
Integrating Proteomics and Transcriptomics Reveals the Potential Pathways of Hippocampal Neuron Apoptosis in Dravet Syndrome Model Mice
Abstract
:1. Introduction
2. Results
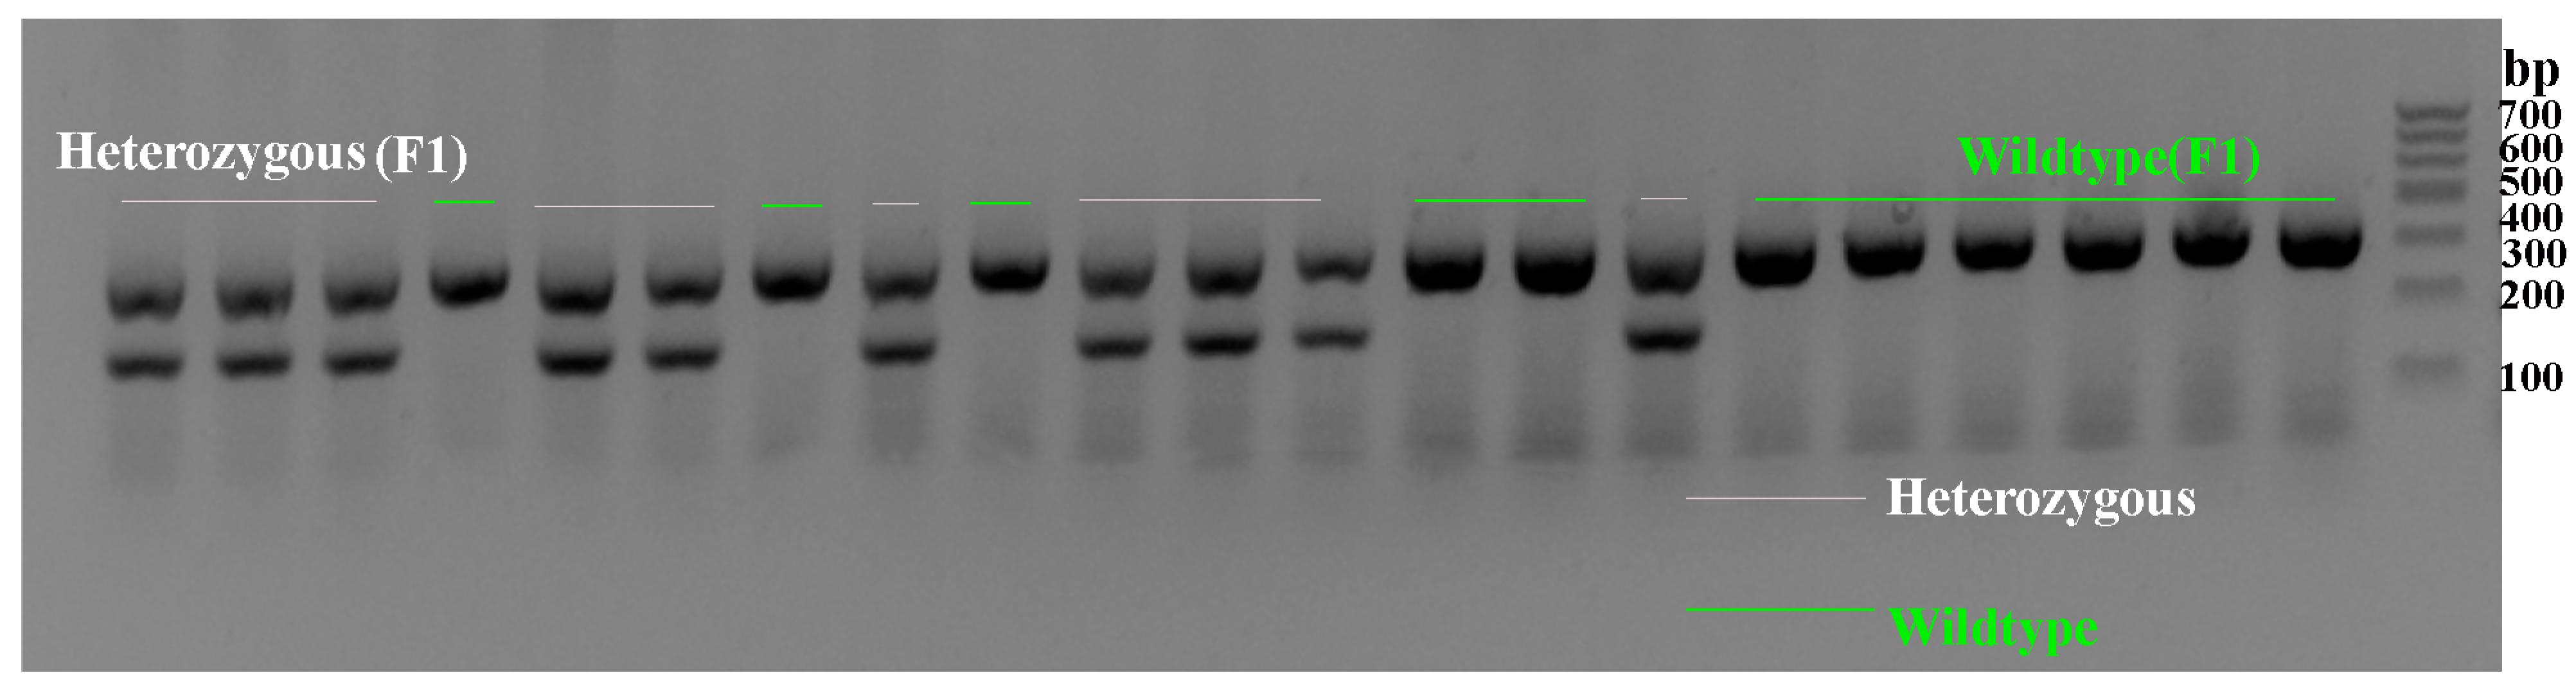
2.1. Genotype Verification of Scn1a KO Mice
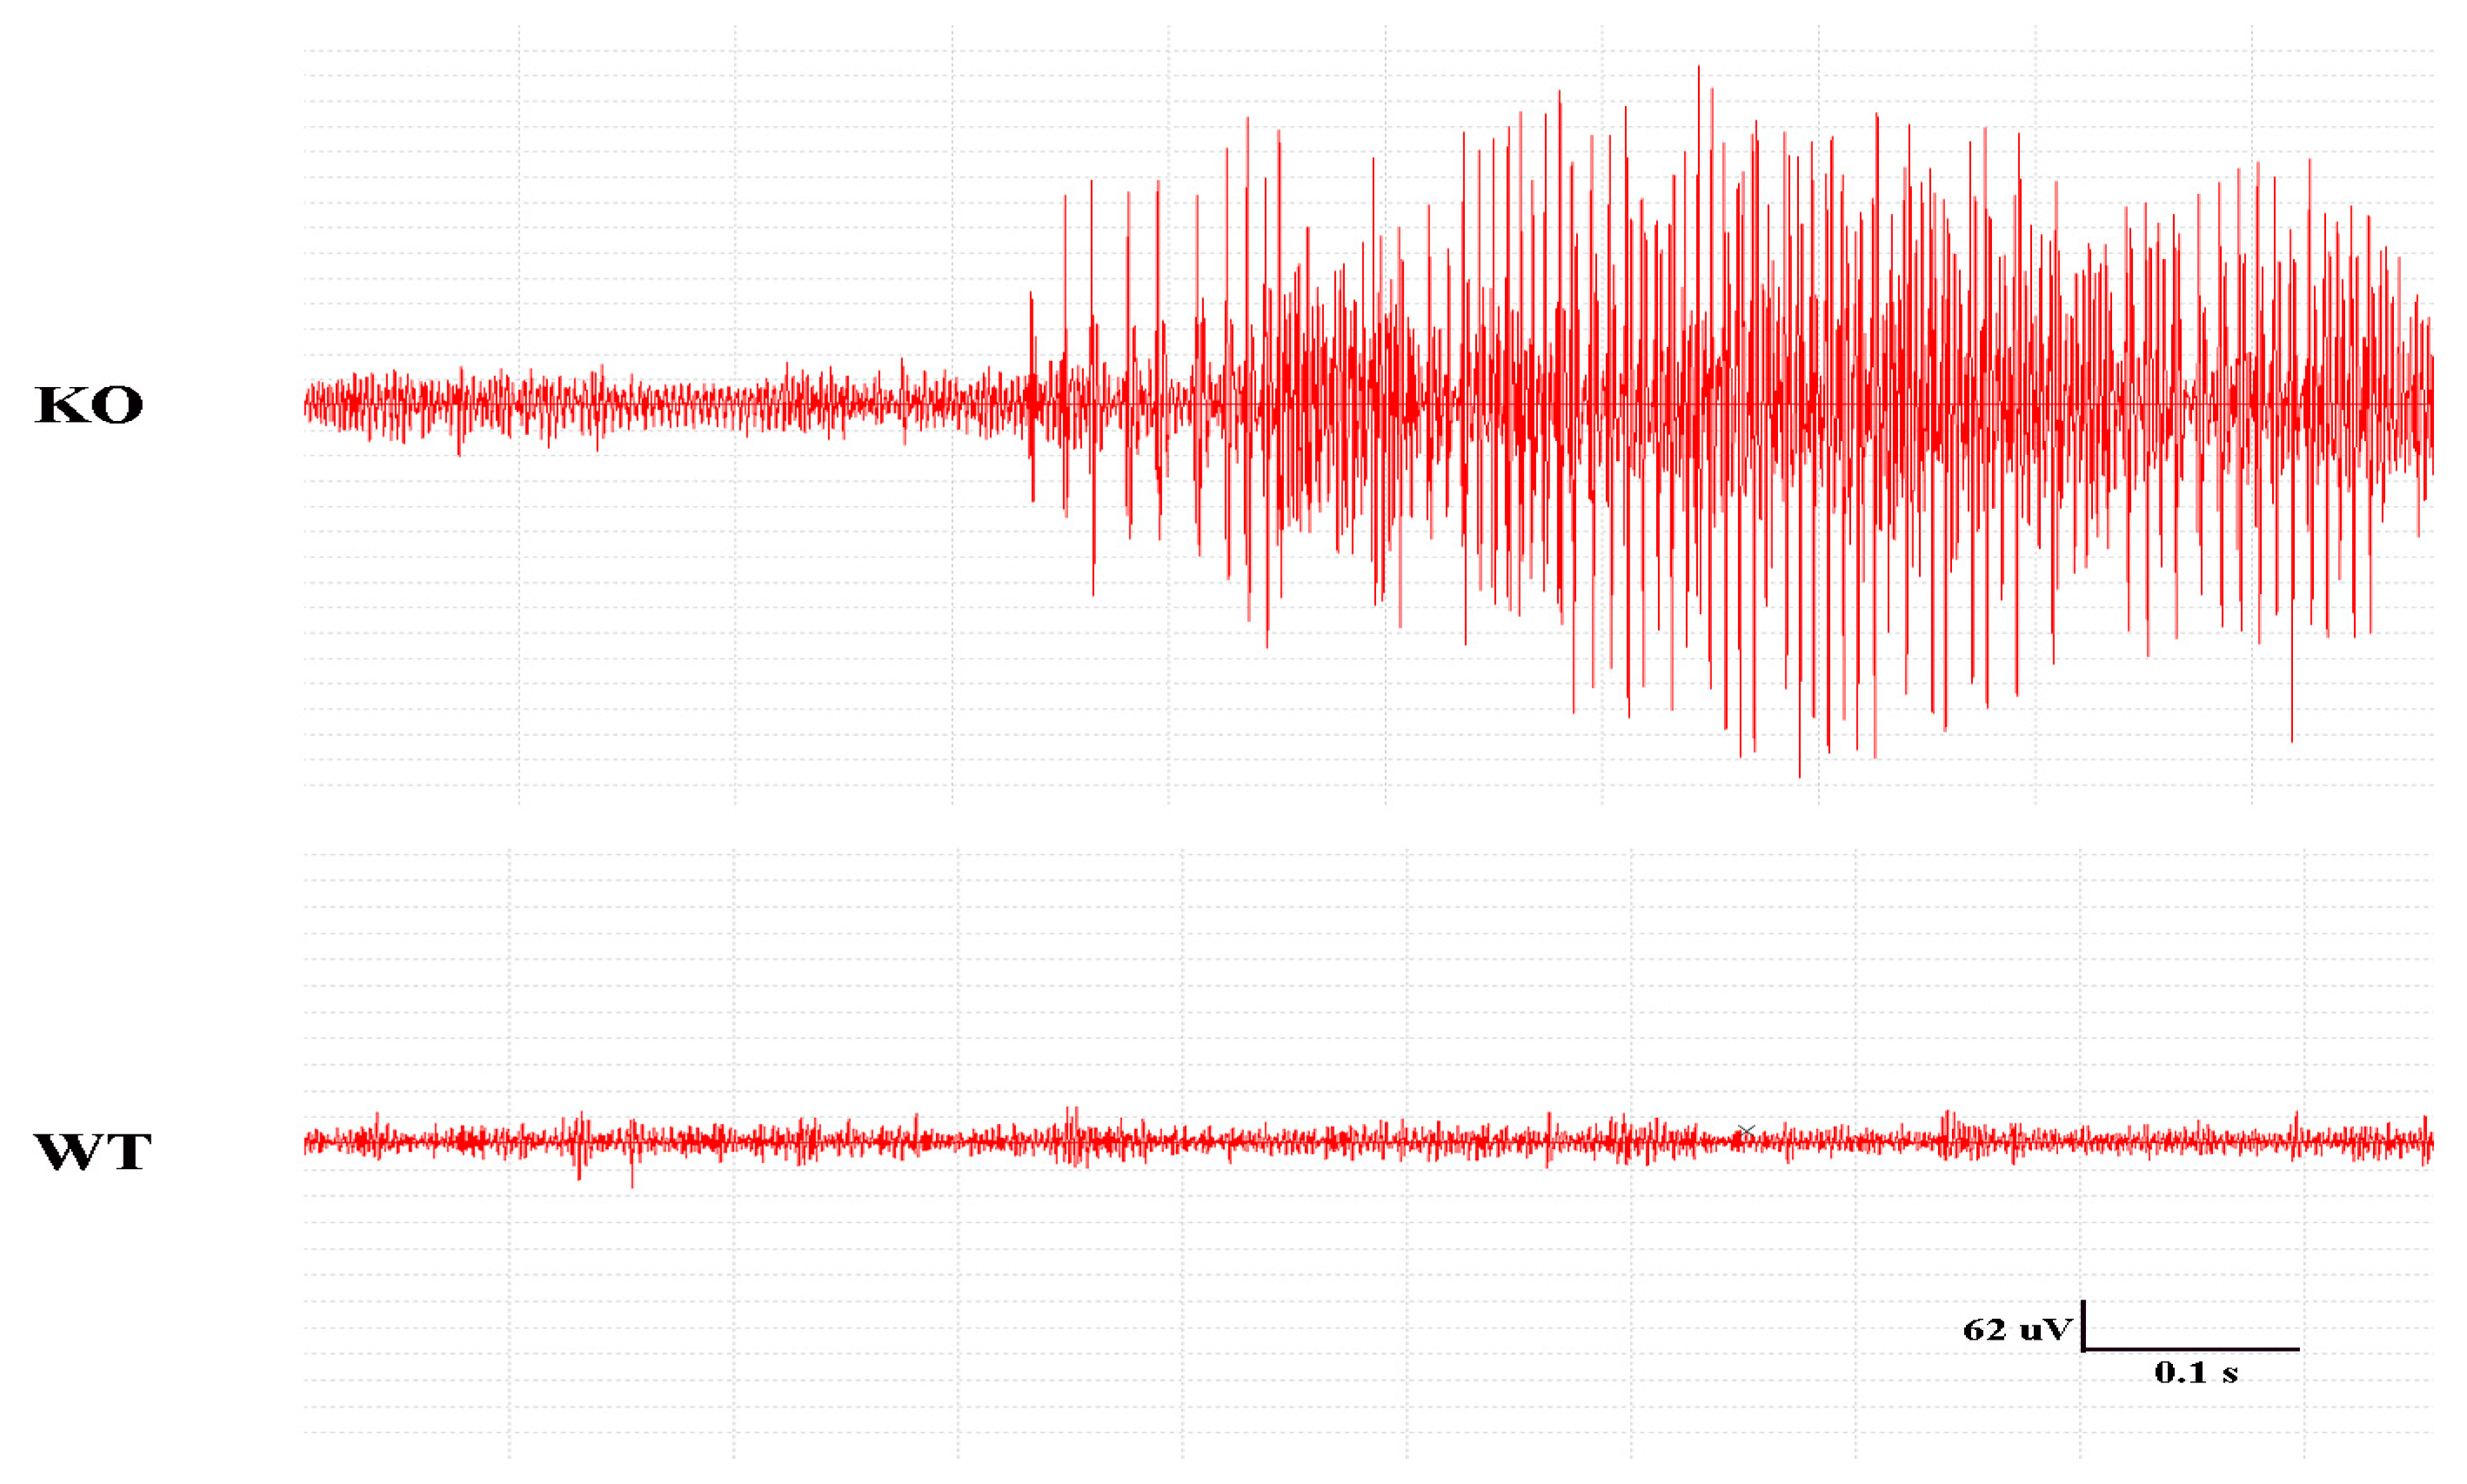
2.2. Seizures in the Mice and EEG Recordings
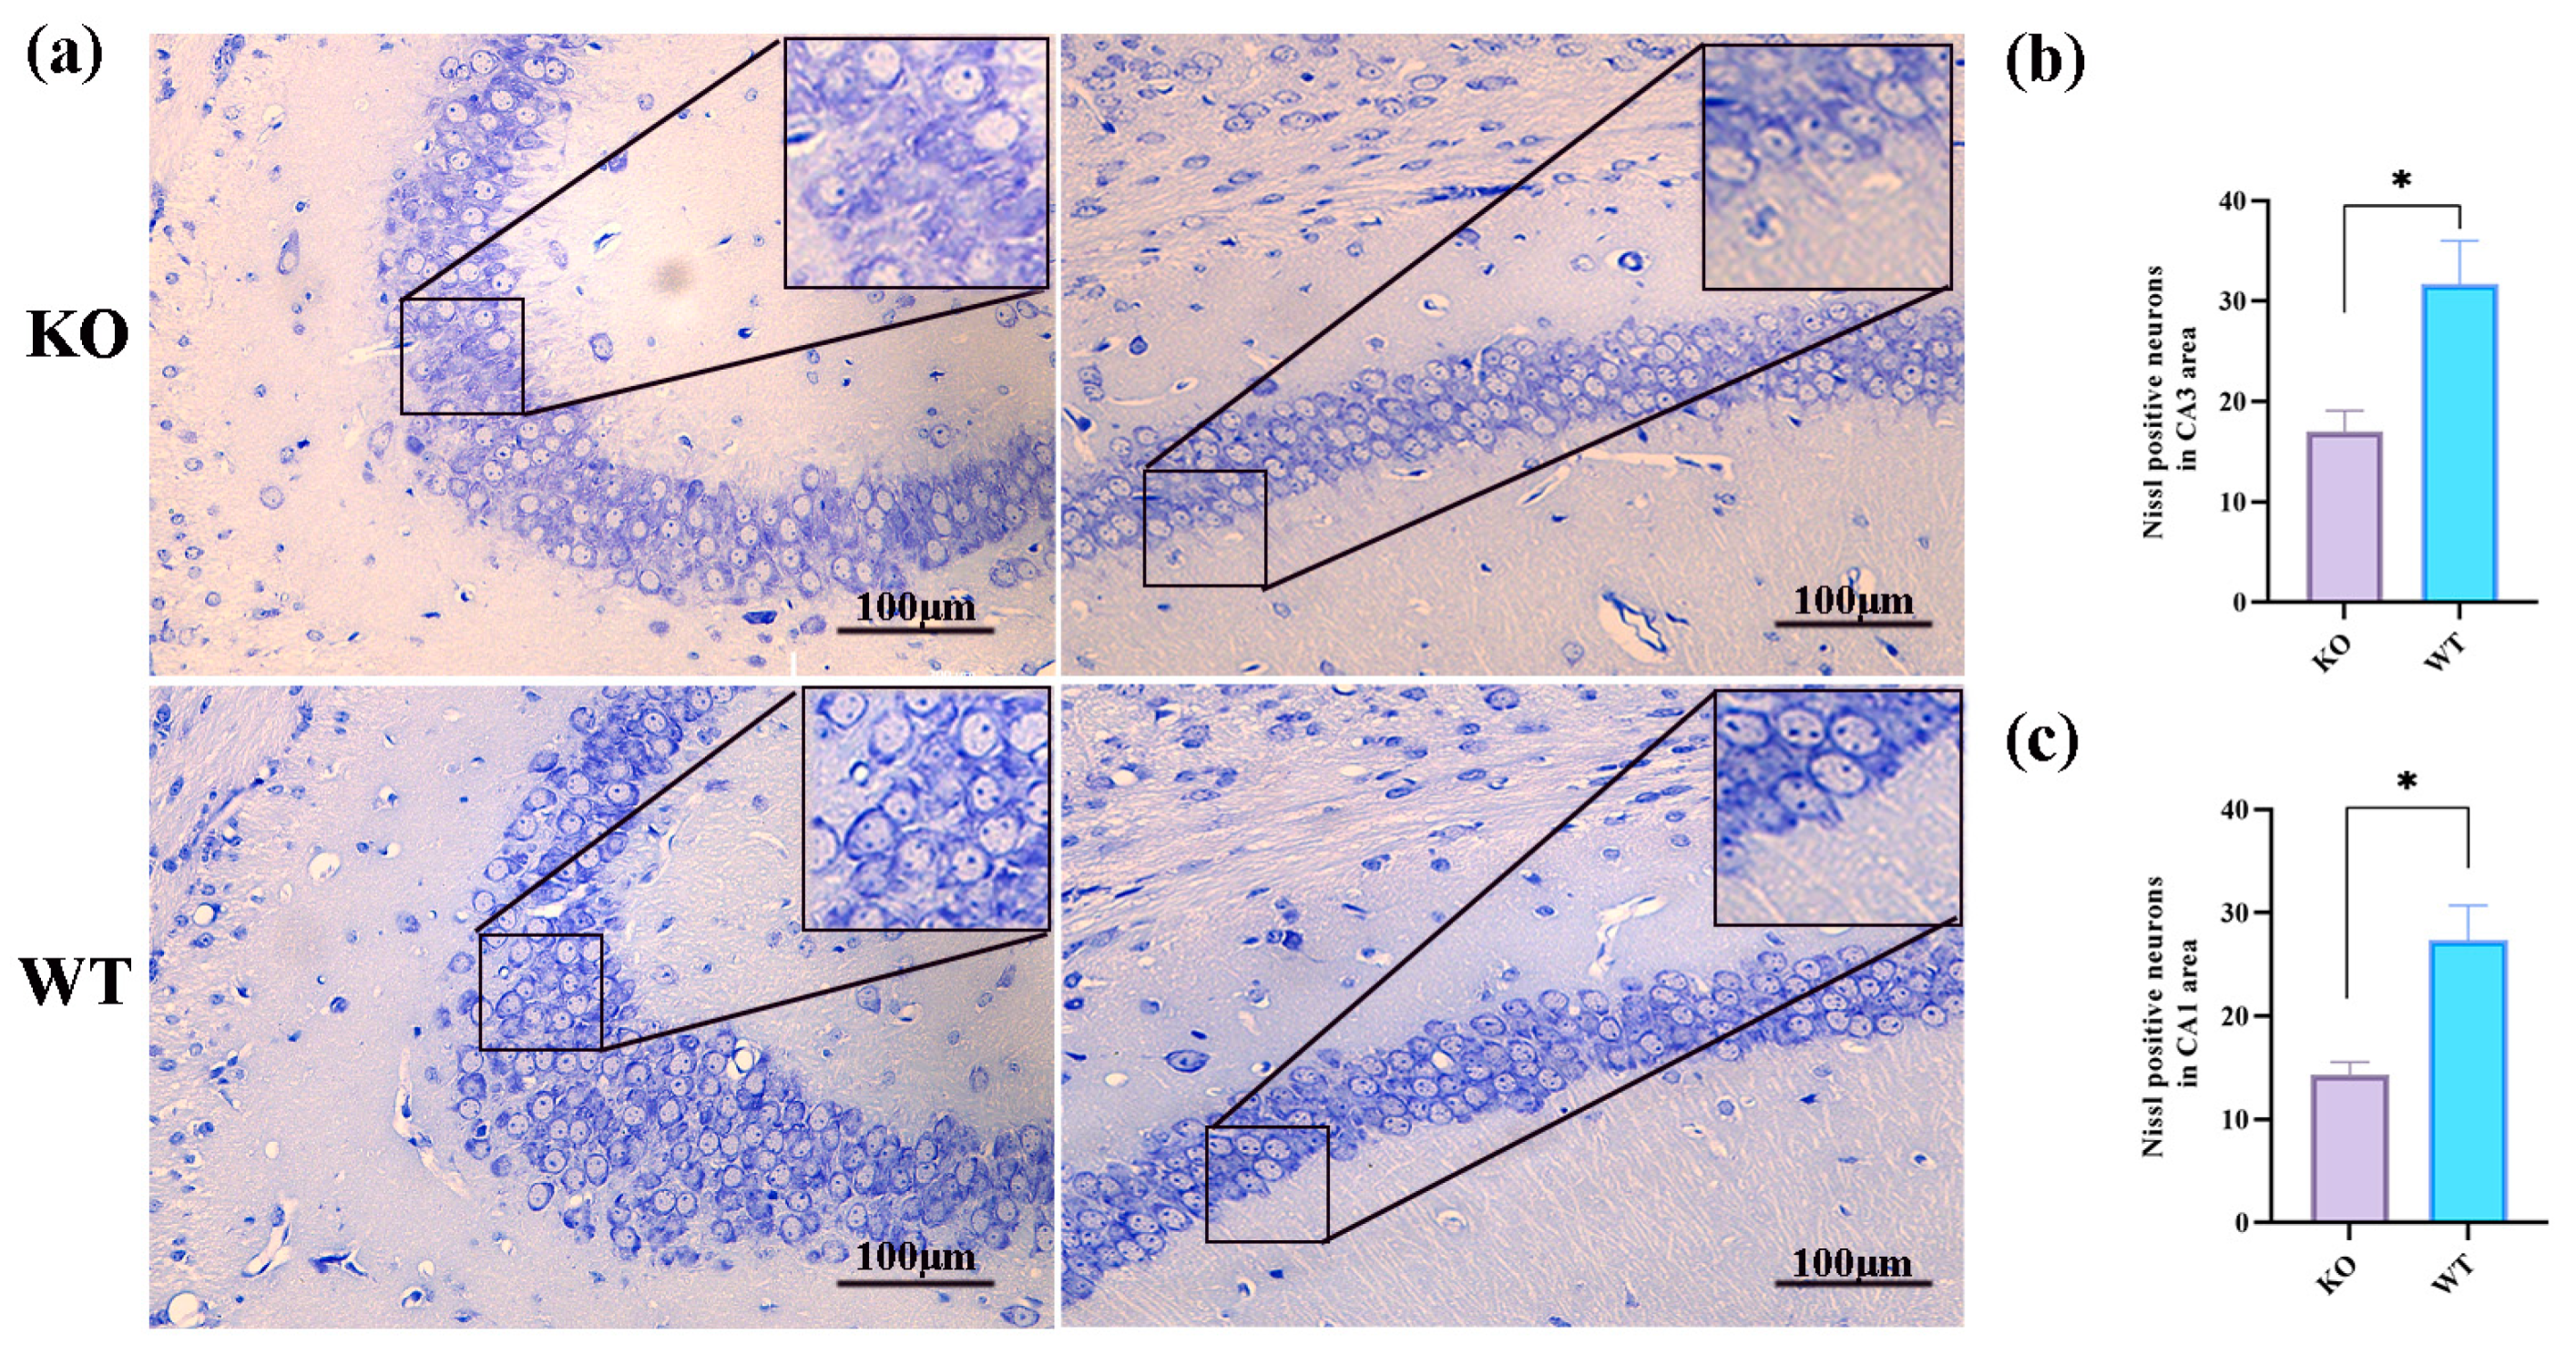
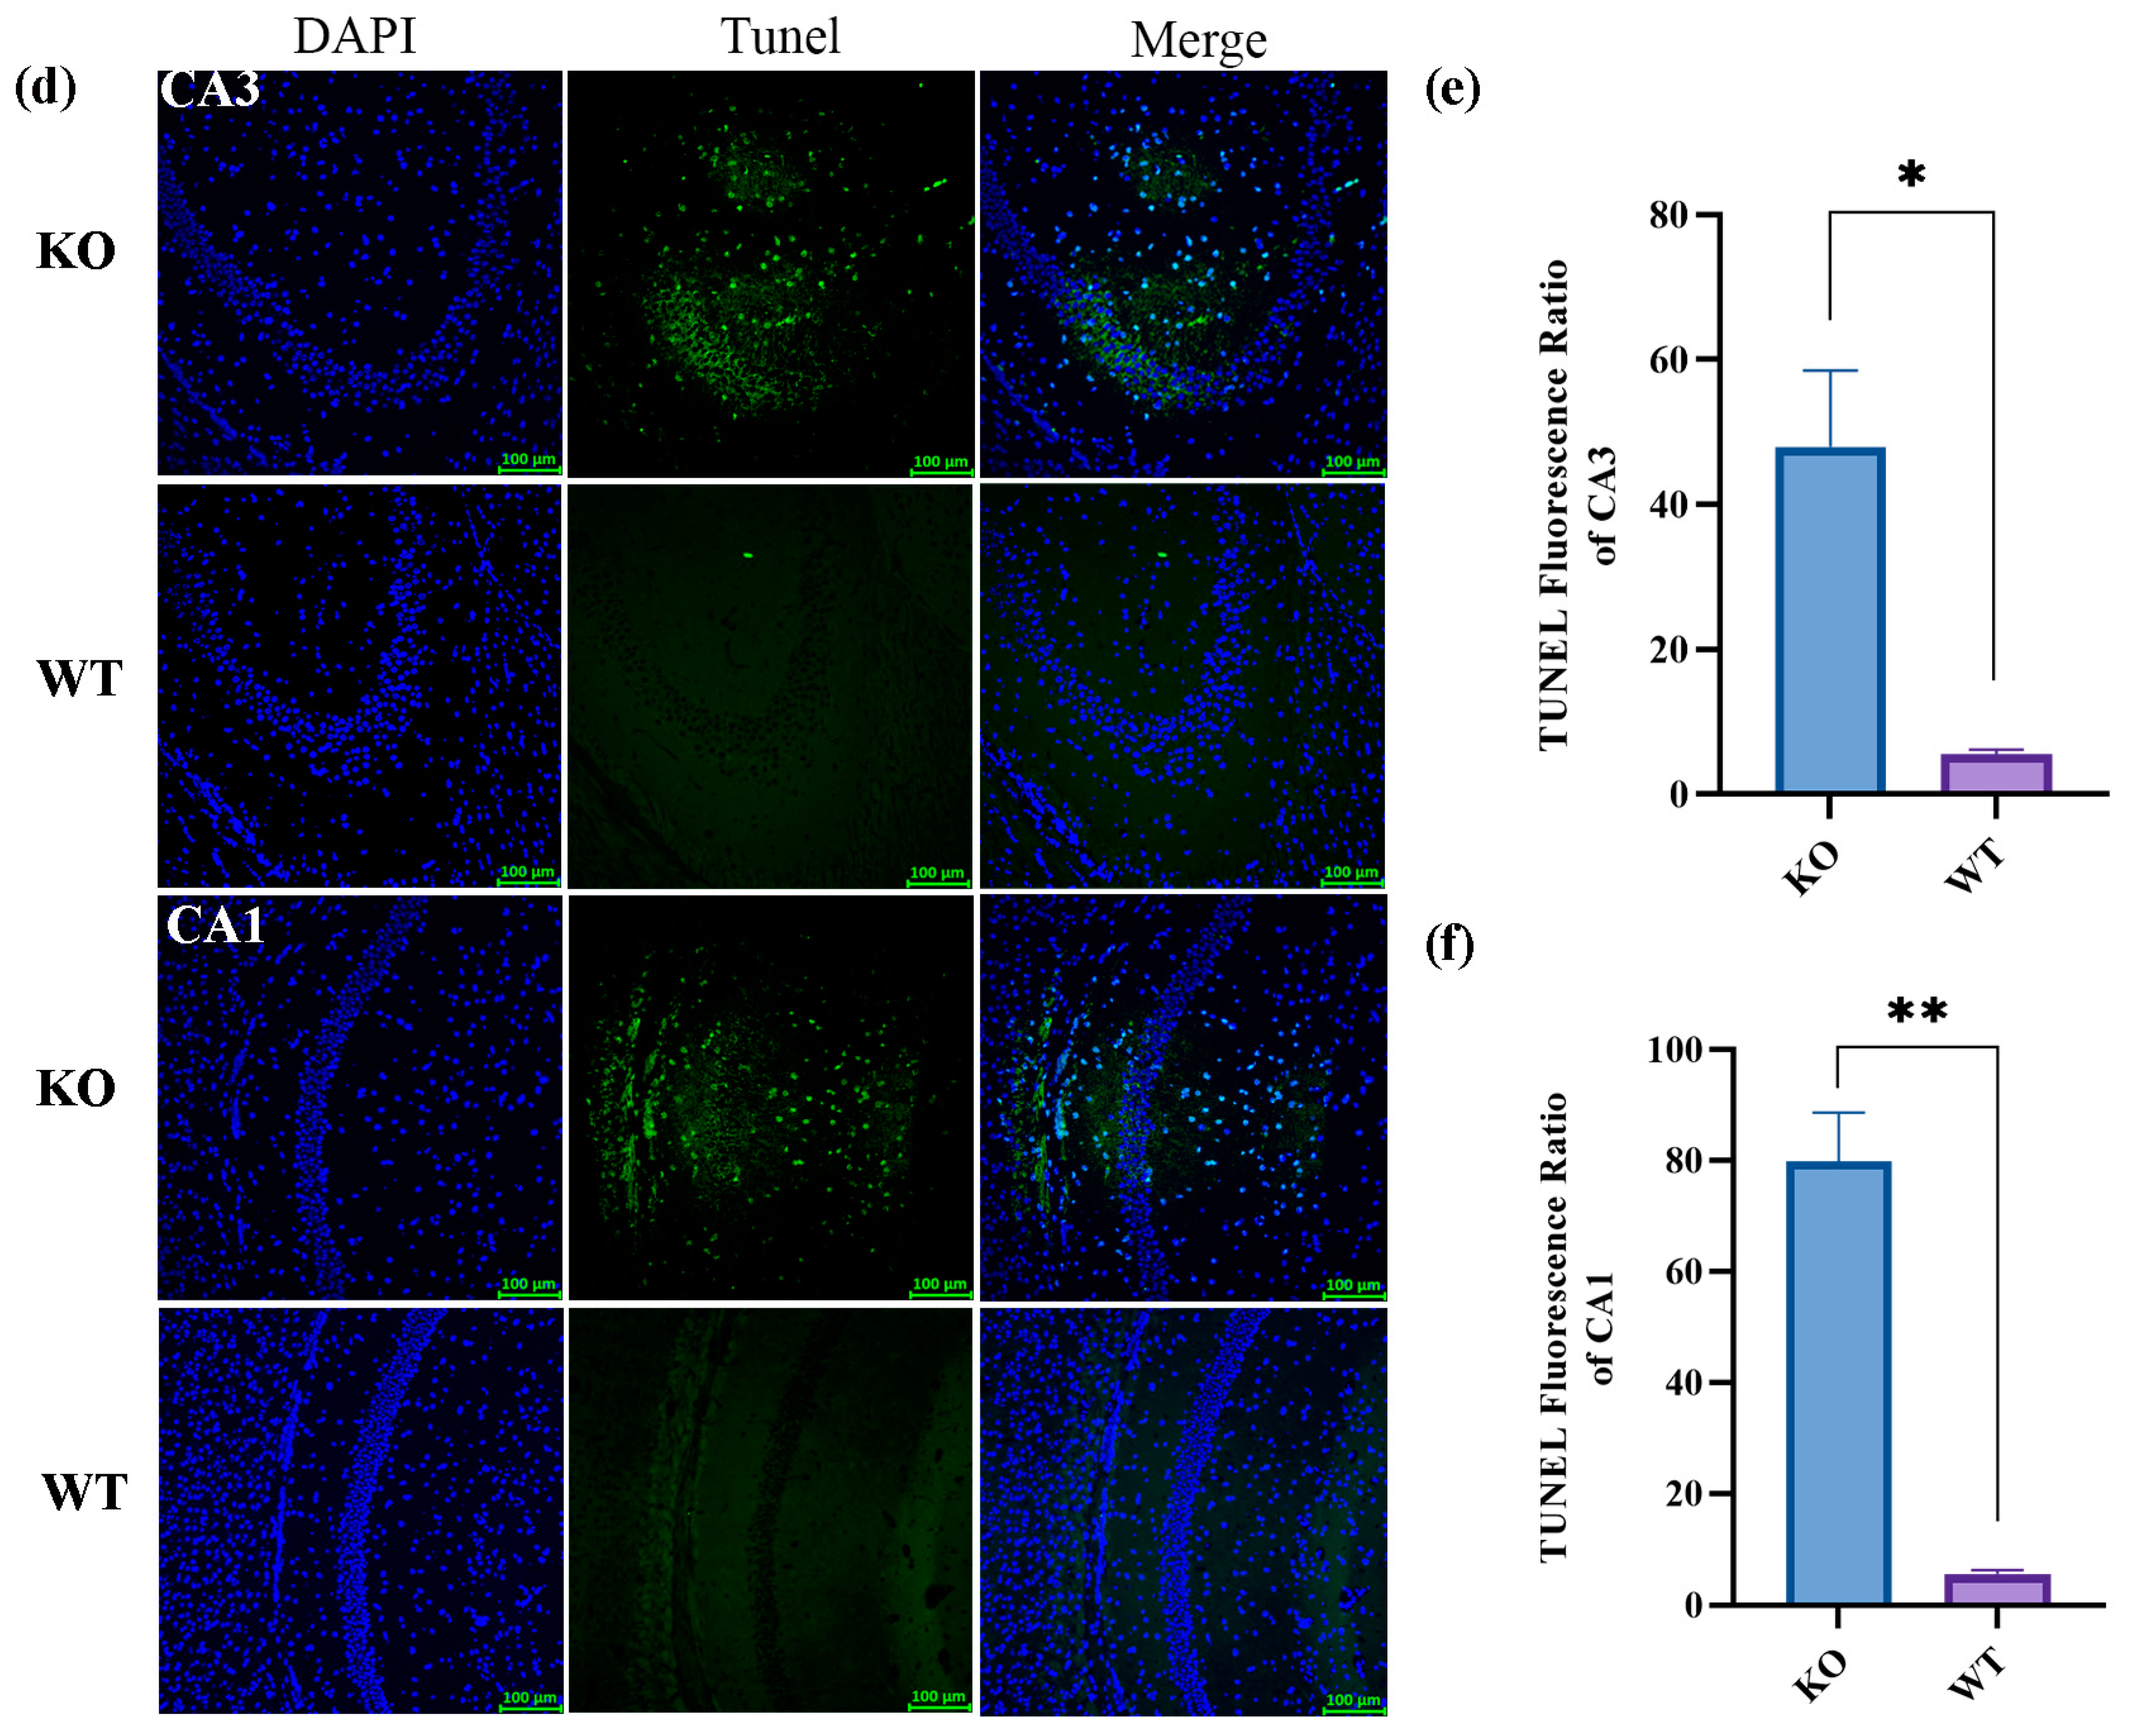
2.3. Histologic Changes after Seizures in Scn1a KO Mice
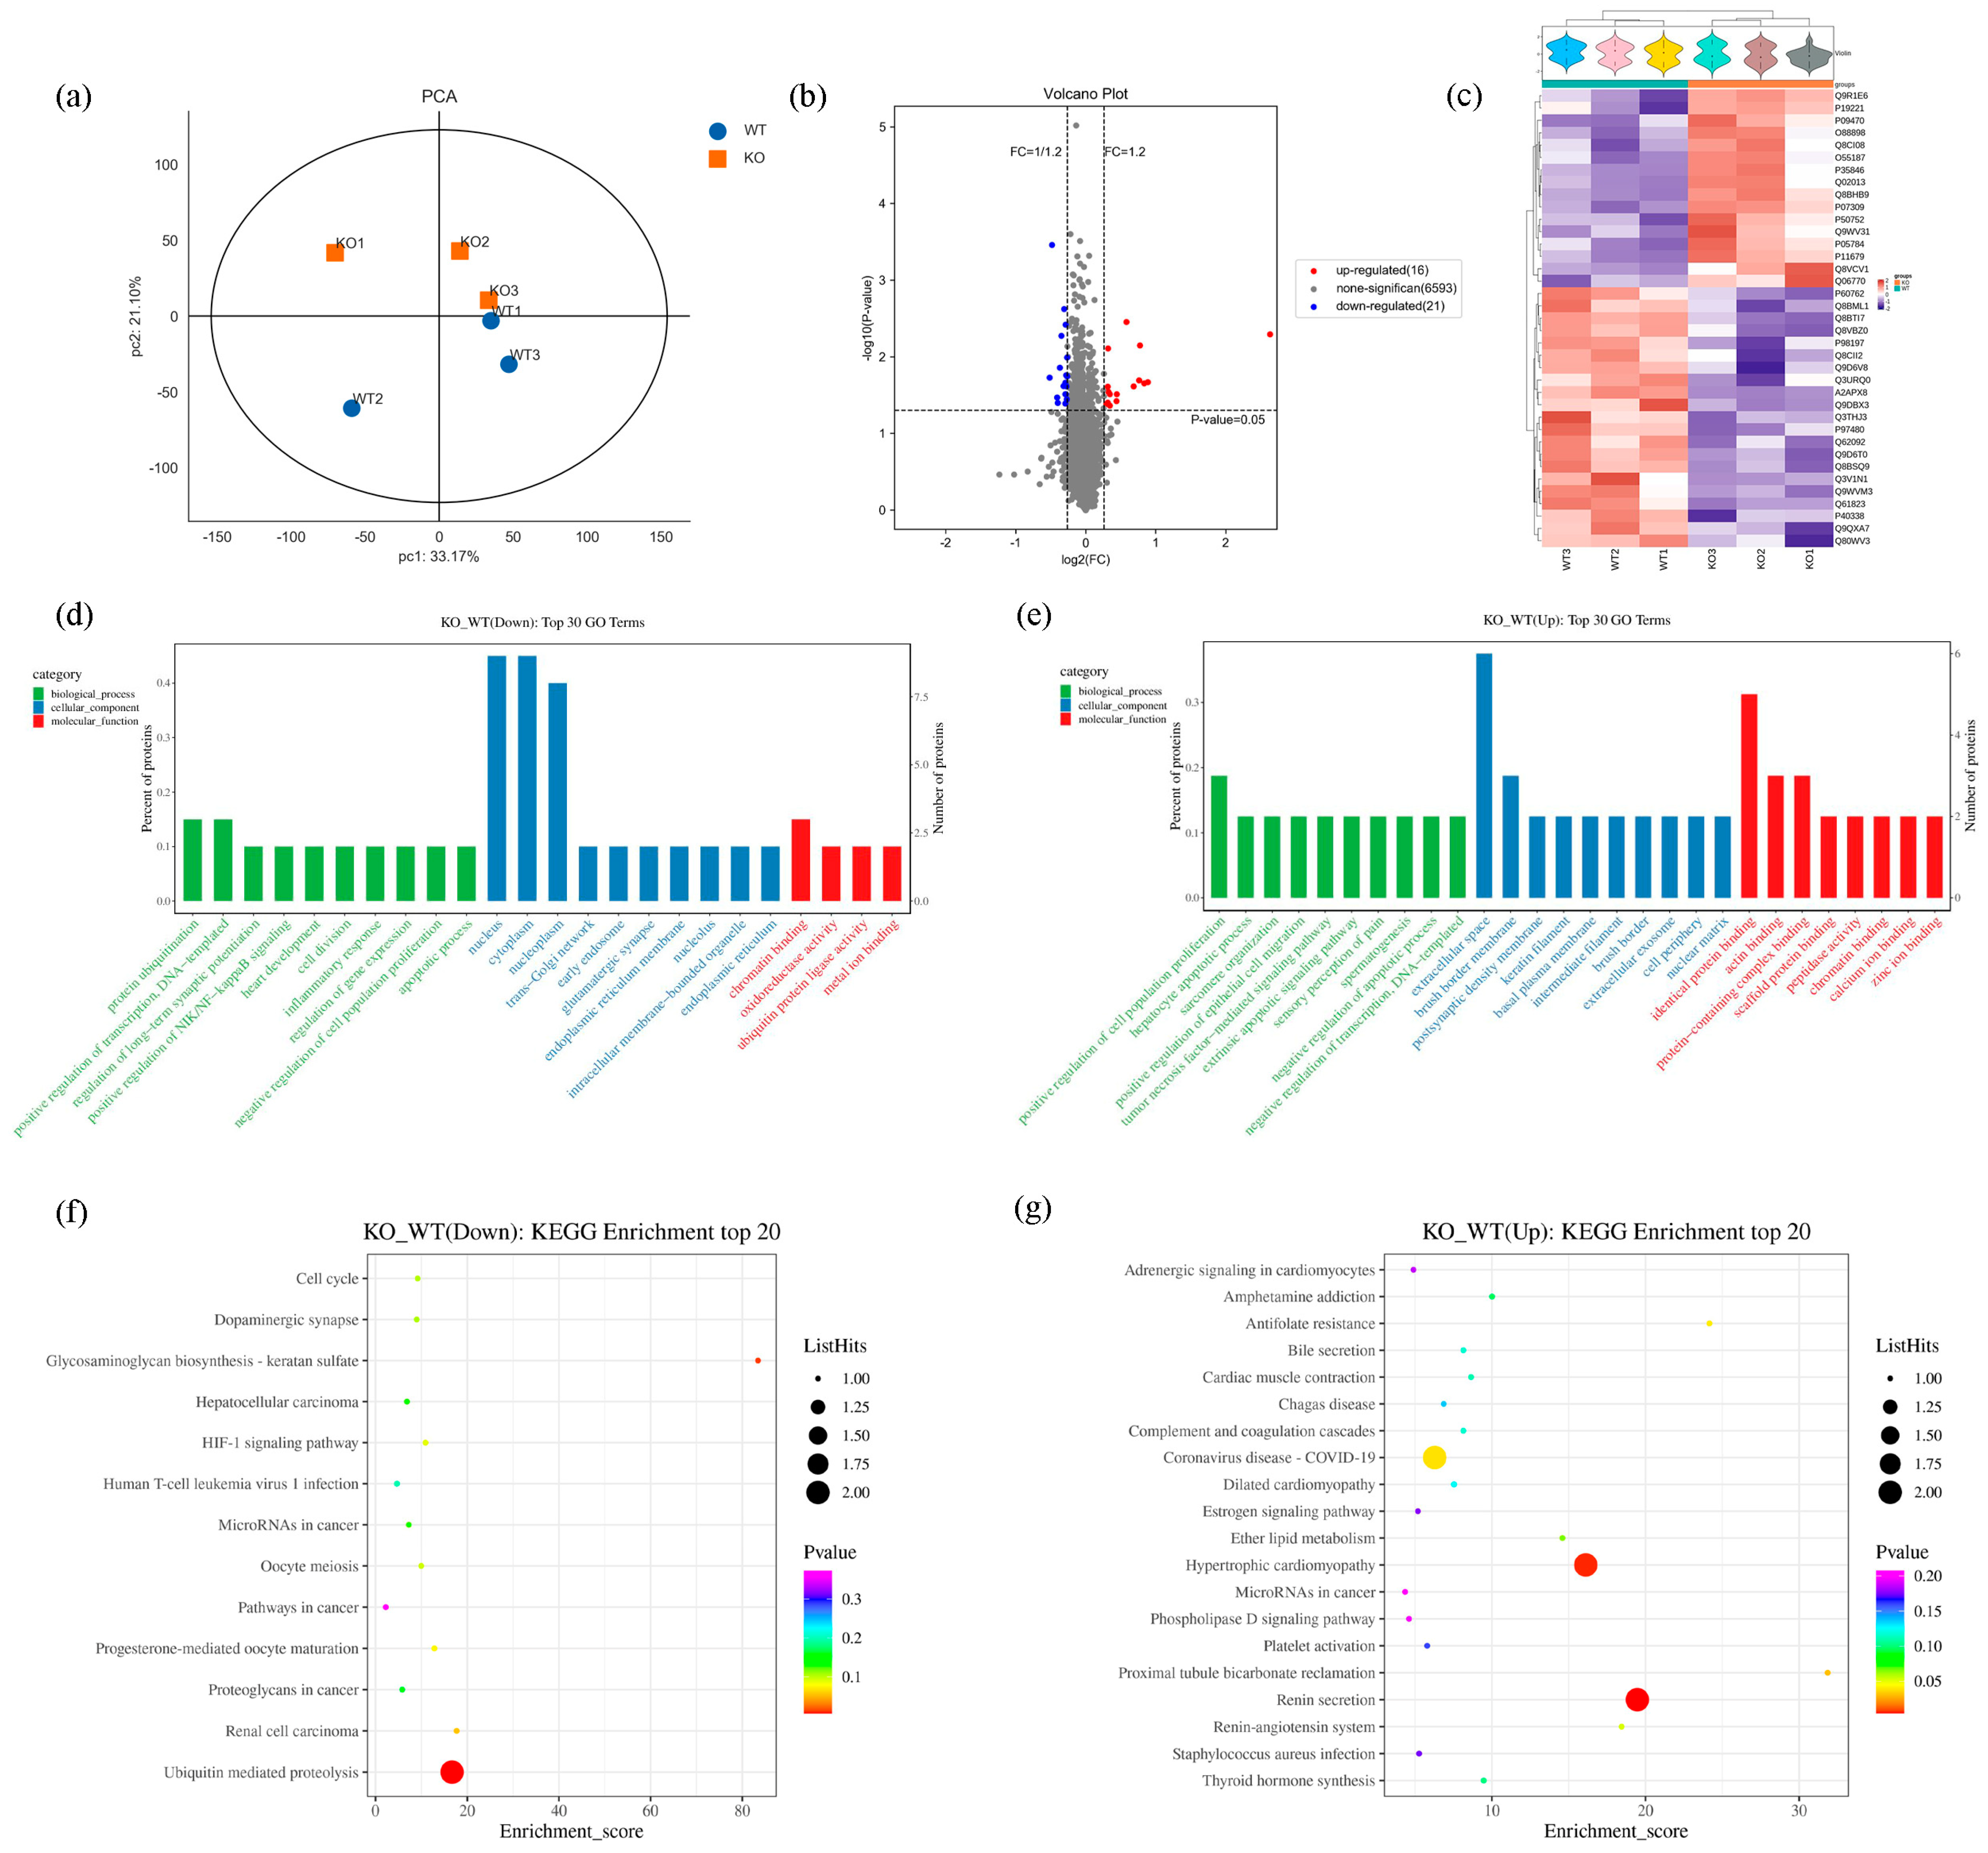
2.4. Proteomics Results
2.5. Transcriptomic Results
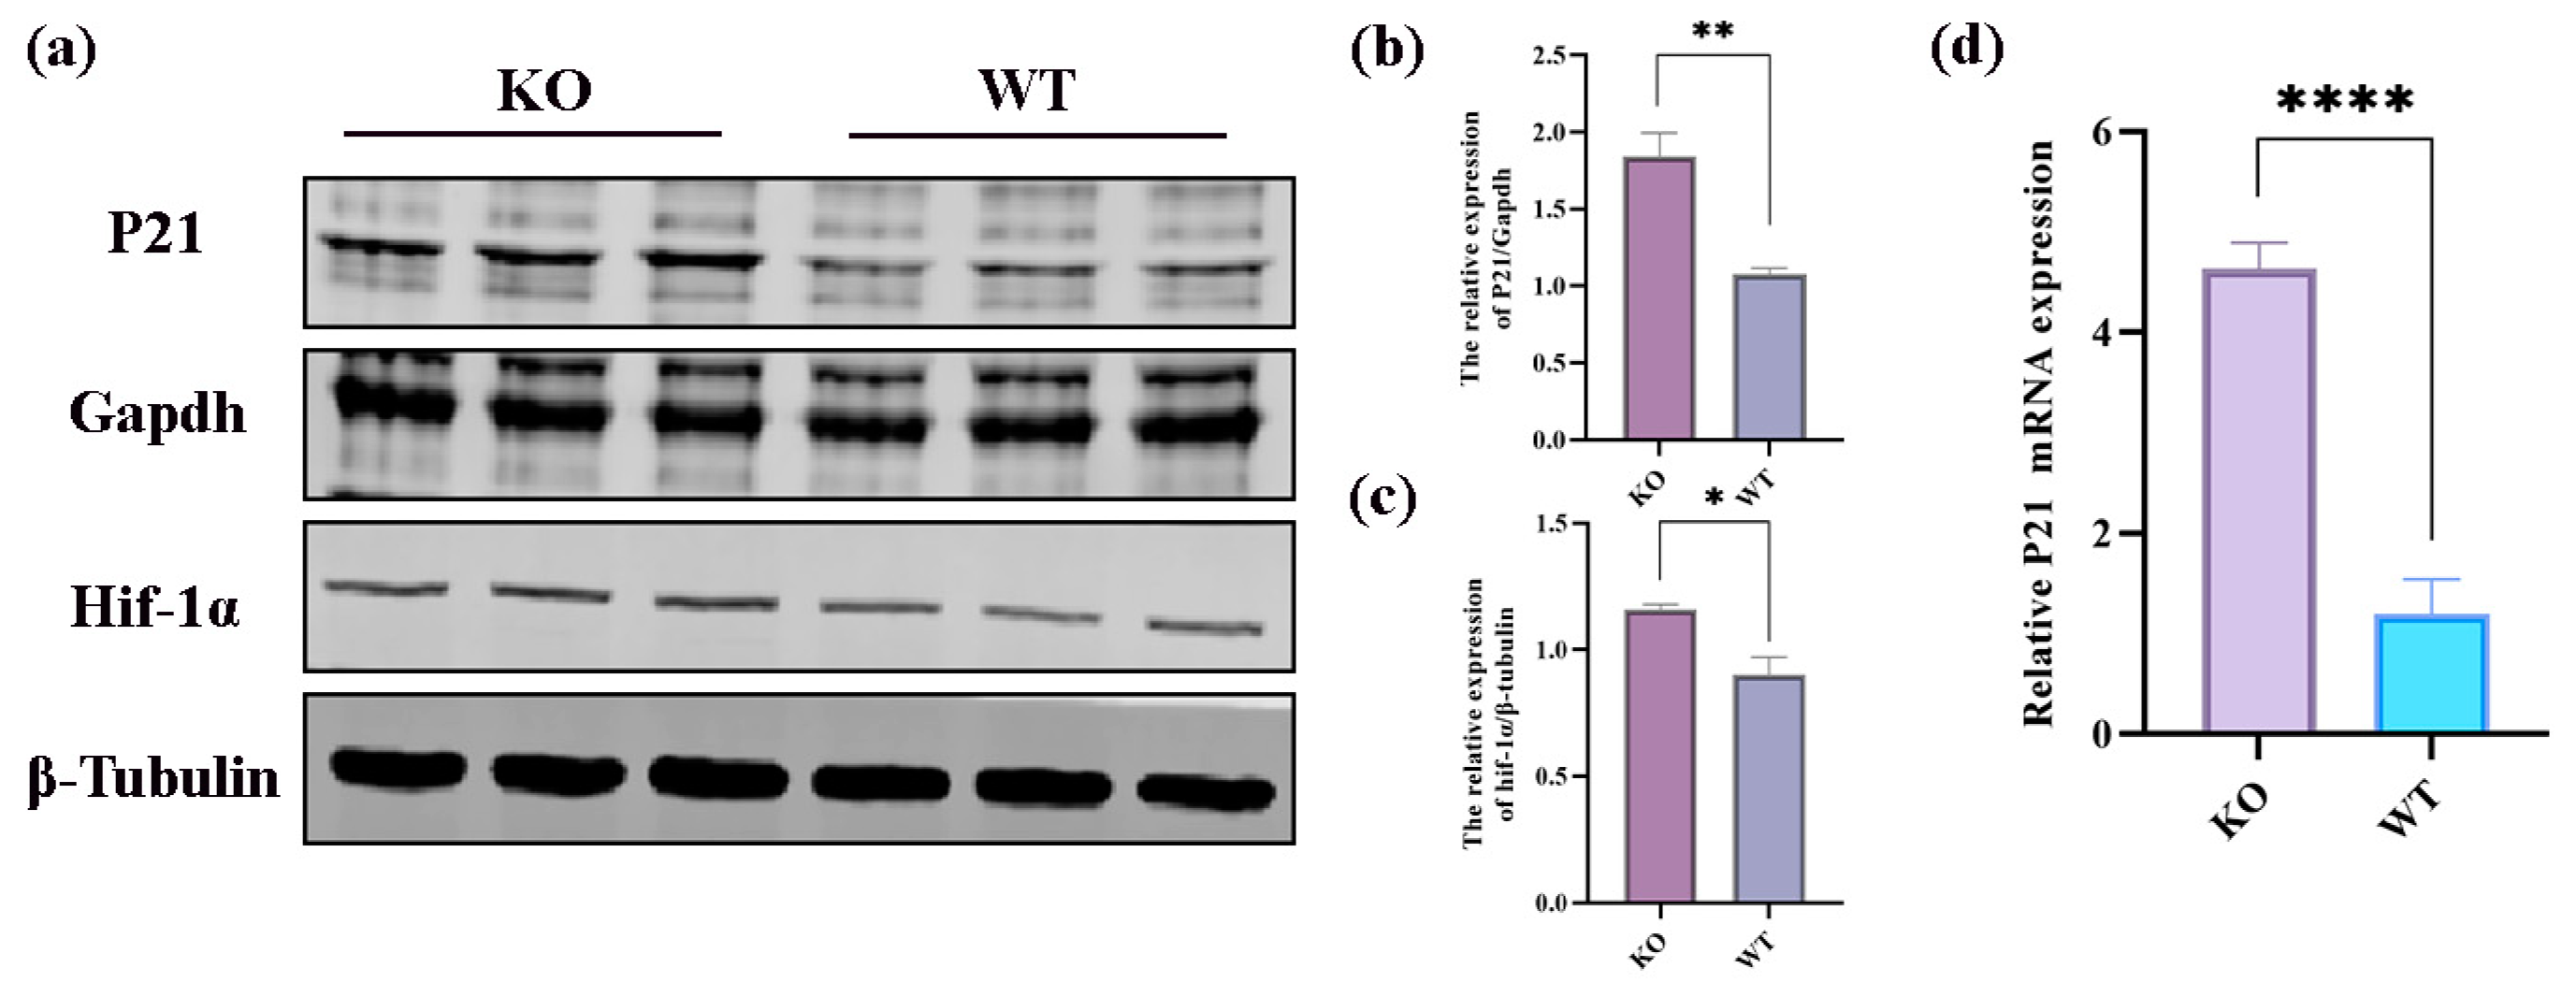
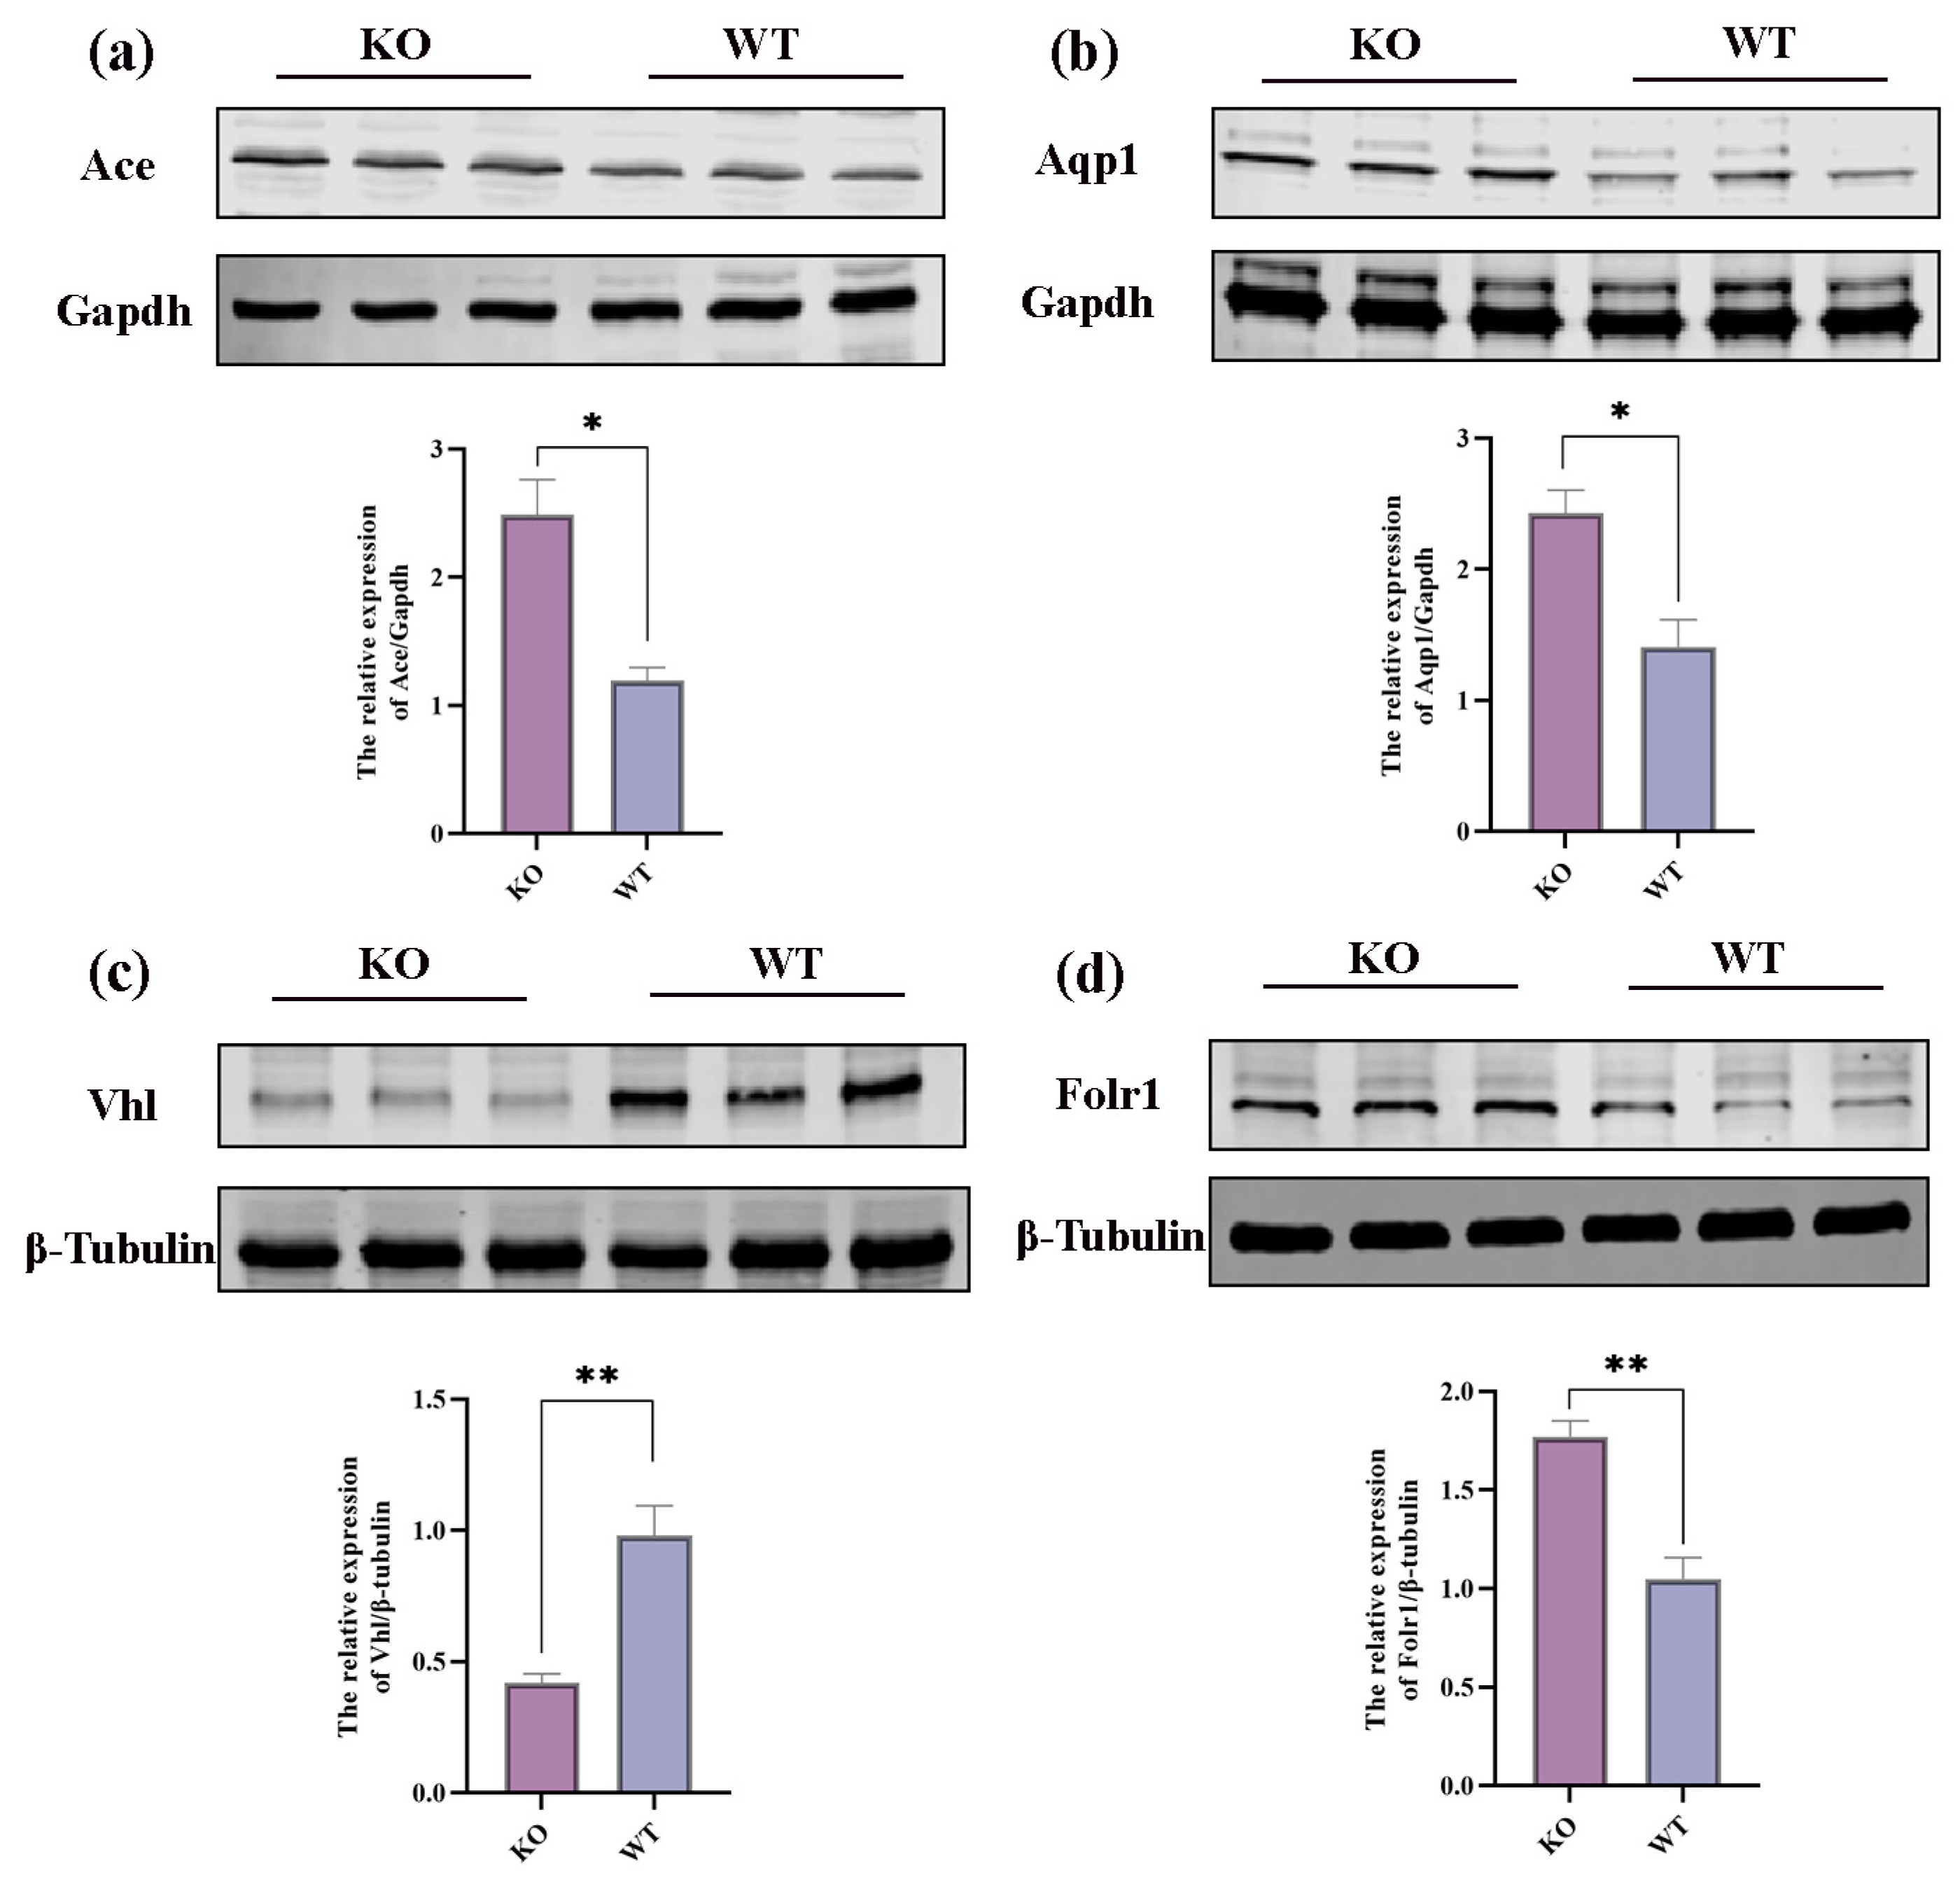
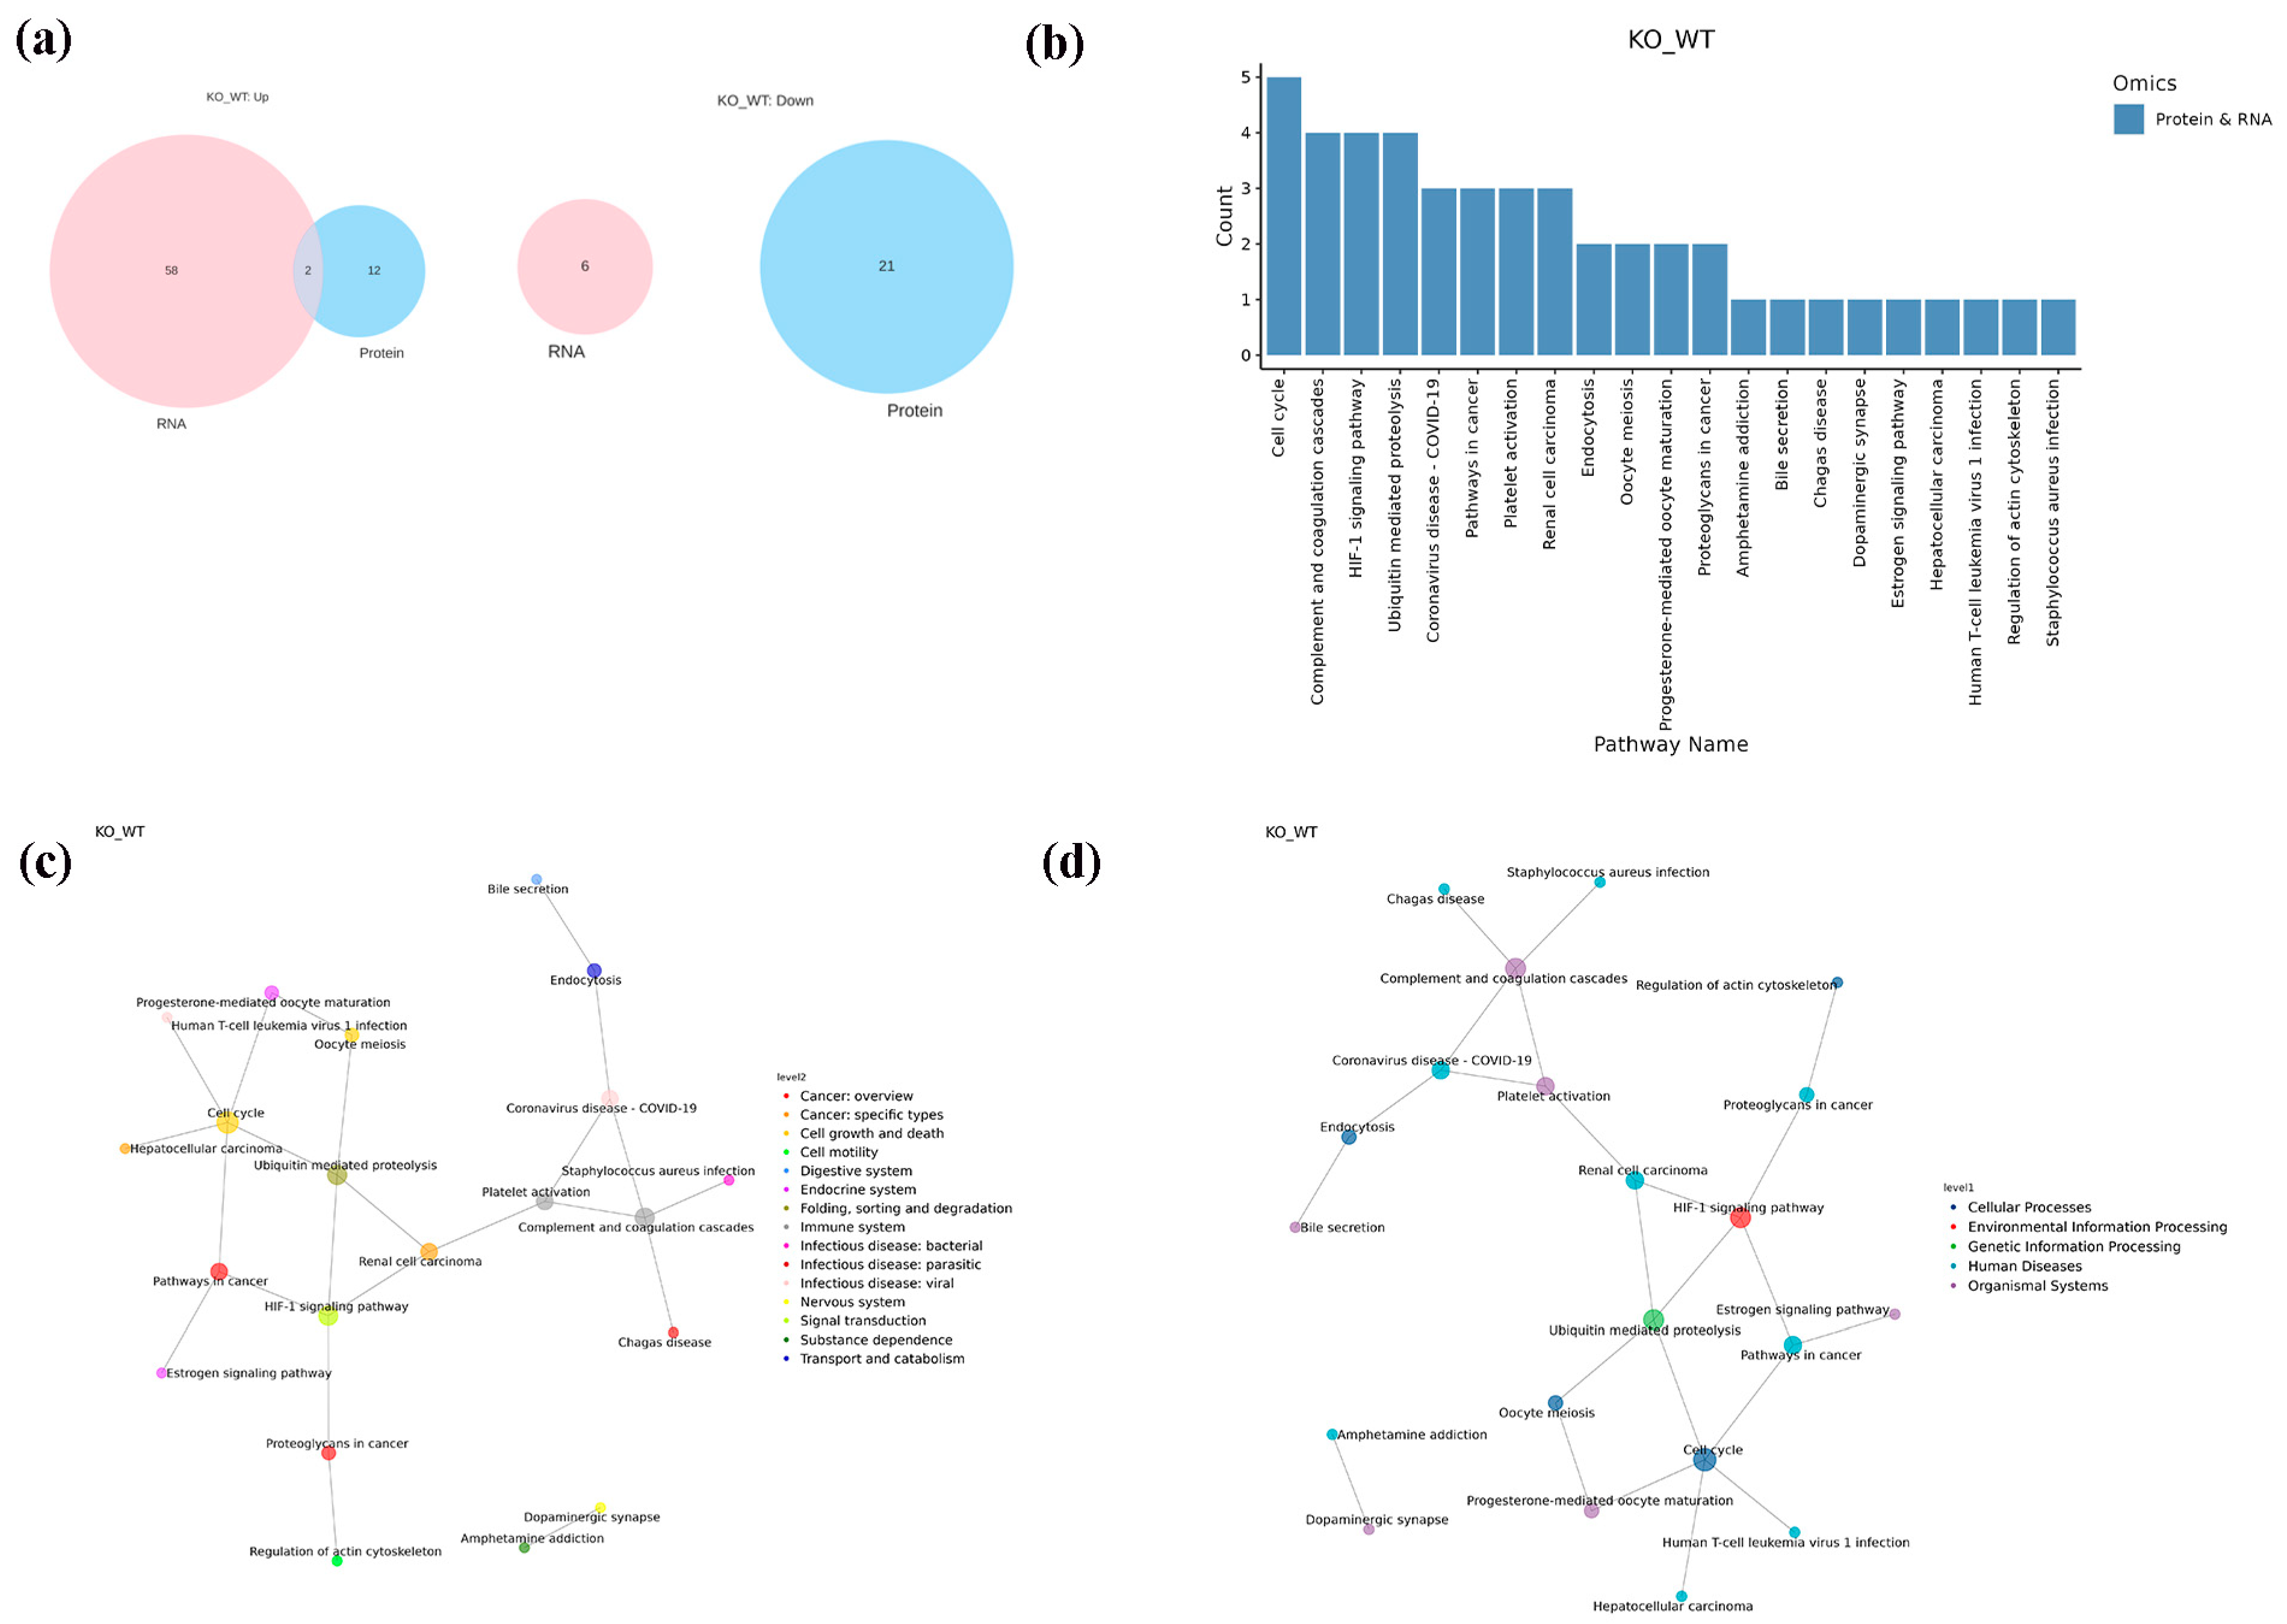
2.6. Integrative Analysis of Proteomics and Transcriptomics
3. Discussion
4. Materials and Methods
4.1. Animals
4.2. Mouse Genotype Identification
4.3. Brain Electrodes
4.4. Hyperthermia-Induced Seizures in Mice
4.5. Nissl Staining
4.6. TUNEL Staining
4.7. Omics Sample Preparation
4.8. Proteomic Experiments
4.8.1. Protein Extraction and SDS–Polyacrylamide Gel Electrophoresis
4.8.2. Trypsin Digestion and Peptide Labeling
4.8.3. Reversed-Phase (RP) Separation
4.8.4. Mass Spectrometry Analyses
4.8.5. Bioinformatics Analyses
4.9. Transcriptomic Experiments
4.10. Western Blot Tests
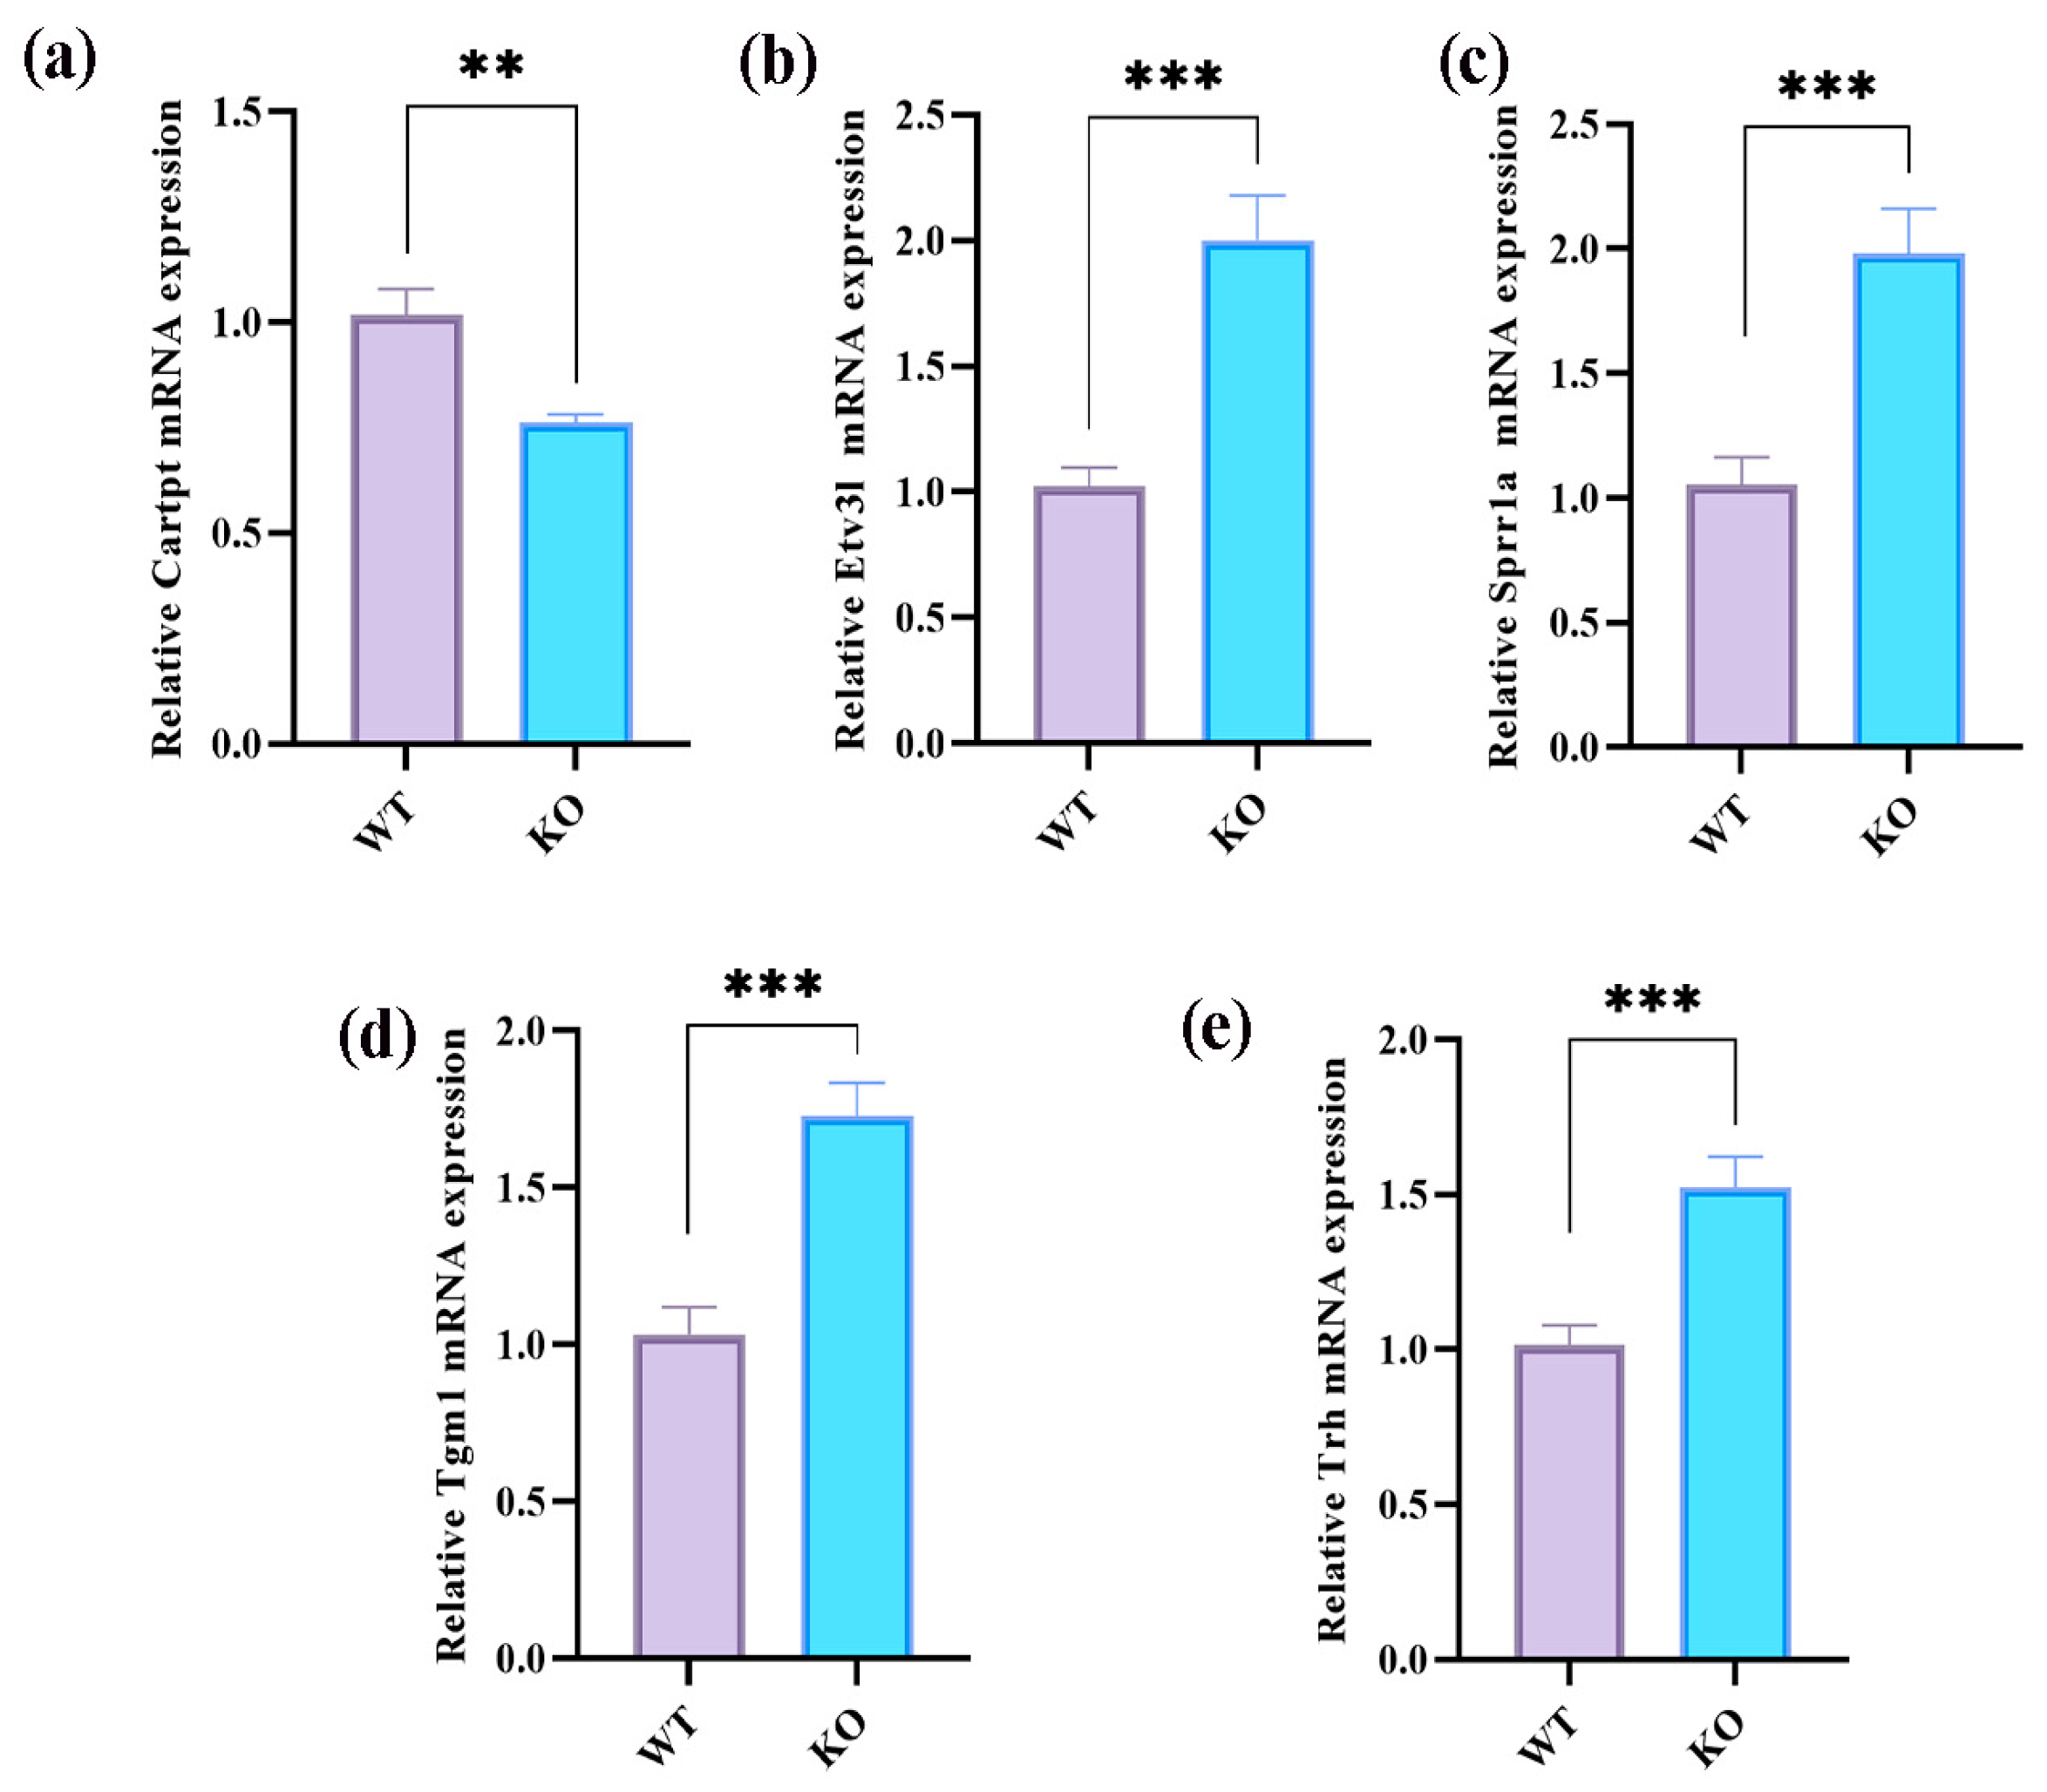
4.11. Real-Time Quantitative Polymerase Chain Reaction Experiments
4.12. Statistical Analyses
5. Conclusions
Supplementary Materials
Author Contributions
Funding
Institutional Review Board Statement
Informed Consent Statement
Data Availability Statement
Conflicts of Interest
References
- Ding, D.; Josemir, D.Z.; Sander, W.; Wang, W.; Li, S.; Hong, Z. Epilepsy in China: Major leaps in the last two decades. Lancet Neurol. 2021, 20, 316–326. [Google Scholar] [CrossRef] [PubMed]
- Fiest, K.M.; Sauro, K.M.; Wiebe, S.; Patten, S.B.; Kwon, C.-S.; Dykeman, J.; Pringsheim, T.; Lorenzetti, D.L.; Jetté, N. Prevalence and incidence of epilepsy: A systematic review and meta-analysis of international studies. Neurology 2017, 88, 296–303. [Google Scholar] [CrossRef] [PubMed]
- Mei, D.; Cetica, V.; Marini, C.; Guerrini, R. Dravet syndrome as part of the clinical and genetic spectrum of sodium channel epilepsies and encephalopathies. Epilepsia 2020, 60, S2–S7. [Google Scholar] [CrossRef]
- Ahluwalia, A.; Tarnawski, A.S. Critical role of hypoxia sensor—HIF-1α in VEGF gene activation. Implications for angiogenesis and tissue injury healing. Curr. Med. Chem. 2012, 19, 90–97. [Google Scholar] [CrossRef]
- Dravet, C. Dravet syndrome history. Dev. Med. Child Neurol. 2011, 53 (Suppl. S2), 1–6. [Google Scholar] [CrossRef] [PubMed]
- Wu, Y.W.; Sullivan, J.; McDaniel, S.S.; Meisler, M.H.; Walsh, E.M.; Li, S.X.; Kuzniewicz, M.W. Incidence of Dravet Syndrome in a US Population. Pediatrics 2015, 136, e1310–e1315. [Google Scholar] [CrossRef] [PubMed]
- Auvin, S.; Jeljeli, M.; Desnous, B.; Soussi-Yanicostas, N.; Dournaud, P.; Sterkers, G. Altered vaccine-induced immunity in children with Dravet syndrome. Epilepsia 2018, 59, e45–e50. [Google Scholar] [CrossRef]
- Xu, X.; Zhang, Y.; Sun, H.; Liu, X.; Yang, X.; Xiong, H.; Jiang, Y.; Bao, X.; Wang, S.; Yang, Z.; et al. Early clinical features and diagnosis of Dravet syndrome in 138 Chinese patients with SCN1A mutations. Brain Dev. 2014, 36, 676–681. [Google Scholar] [CrossRef]
- Bahceci, D.; Anderson, L.L.; Occelli Hanbury Brown, C.V.; Zhou, C.; Arnold, J.C. Adolescent behavioral abnormalities in a Scn1a(+/−) mouse model of Dravet syndrome. Epilepsy Behav. EB 2020, 103 Pt A, 106842. [Google Scholar] [CrossRef]
- Sawyer, N.T.; Helvig, A.W.; Makinson, C.D.; Decker, M.J.; Neigh, G.N.; Escayg, A. Scn1a dysfunction alters behavior but not the effect of stress on seizure response. Genes Brain Behav. 2016, 15, 335–347. [Google Scholar] [CrossRef]
- Cooper, M.S.; McIntosh, A.; Crompton, D.E.; McMahon, J.M.; Schneider, A.; Farrell, K.; Ganesan, V.; Gill, D.; Kivity, S.; Lerman-Sagie, T.; et al. Mortality in Dravet syndrome. Epilepsy Res. 2016, 128, 43–47. [Google Scholar] [CrossRef] [PubMed]
- Miller, I.; Scheffer, I.E.; Gunning, B.; Sanchez-Carpintero, R.; Gil-Nagel, A.; Perry, M.S.; Saneto, R.P.; Checketts, D.; Dunayevich, E.; Knappertz, V. Dose-Ranging Effect of Adjunctive Oral Cannabidiol vs Placebo on Convulsive Seizure Frequency in Dravet Syndrome. JAMA Neurol. 2020, 77, 613–621. [Google Scholar] [CrossRef] [PubMed]
- Nabbout, R.; Mistry, A.; Zuberi, S.; Villeneuve, N.; Gil-Nagel, A.; Sanchez-Carpintero, R.; Stephani, U.; Laux, L.; Wirrell, E.; Knupp, K.; et al. Fenfluramine for Treatment-Resistant Seizures in Patients with Dravet Syndrome Receiving Stiripentol-Inclusive Regimens. JAMA Neurol. 2020, 77, 300–308. [Google Scholar] [CrossRef] [PubMed]
- Yıldız, E.P.; Ozkan, M.U.; Uzunhan, T.A.; Bektaş, G.; Tatlı, B.; Aydınlı, N.; Çalışkan, M.; Özmen, M. Efficacy of Stiripentol and the Clinical Outcome in Dravet Syndrome. J. Child Neurol. 2018, 34, 33–37. [Google Scholar] [CrossRef] [PubMed]
- Chen, Z.; Brodie, M.J.; Liew, D.; Kwan, P. Treatment Outcomes in Patients with Newly Diagnosed Epilepsy Treated with Established and New Antiepileptic Drugs. JAMA Neurol. 2018, 75, 279–286. [Google Scholar] [CrossRef] [PubMed]
- Tian, M.-J.; Wang, R.-F.; Hölscher, C.; Mi, R.-L.; Yuan, Z.-Y.; Li, D.-F.; Xue, G.-F. The novel GLP-1/GIP dual receptor agonist DA3-CH is neuroprotective in the pilocarpine-induced epileptogenesis rat model. Epilepsy Res. 2019, 154, 97–106. [Google Scholar] [CrossRef] [PubMed]
- Kang, S.K.; Hawkins, N.A.; Kearney, J.A. C57BL/6J and C57BL/6N substrains differentially influence phenotype severity in the Scn1a (+/−) mouse model of Dravet syndrome. Epilepsia Open 2019, 4, 164–169. [Google Scholar] [CrossRef] [PubMed]
- Miller, A.R.; Hawkins, N.A.; McCollom, C.E.; Kearney, J.A. Mapping genetic modifiers of survival in a mouse model of Dravet syndrome. Genes Brain Behav. 2014, 13, 163–172. [Google Scholar] [CrossRef] [PubMed]
- Liu, S.; Jin, Z.; Zhang, Y.; Rong, S.; He, W.; Sun, K.; Wan, D.; Huo, J.; Xiao, L.; Li, X.; et al. The Glucagon-Like Peptide-1 Analogue Liraglutide Reduces Seizures Susceptibility, Cognition Dysfunction and Neuronal Apoptosis in a Mouse Model of Dravet Syndrome. Front. Pharmacol. 2020, 11, 136. [Google Scholar] [CrossRef]
- Soroka, V.; Kasper, C.; Poulsen, F.M. Structural biology of NCAM. Adv. Exp. Med. Biol. 2010, 663, 3–22. [Google Scholar]
- Han, C.-L.; Ge, M.; Liu, Y.-P.; Zhao, X.-M.; Wang, K.-L.; Chen, N.; Hu, W.; Zhang, J.-G.; Li, L.; Meng, F.-G. Long non-coding RNA H19 contributes to apoptosis of hippocampal neurons by inhibiting let-7b in a rat model of temporal lobe epilepsy. Cell Death Dis. 2018, 9, 617. [Google Scholar] [CrossRef]
- Wang, L.; Ding, J.; Zhu, C.; Guo, B.; Yang, W.; He, W.; Li, X.; Wang, Y.; Li, W.; Wang, F.; et al. Semaglutide attenuates seizure severity and ameliorates cognitive dysfunction by blocking the NLR family pyrin domain containing 3 inflammasome in pentylenetetrazole-kindled mice. Int. J. Mol. Med. 2021, 48, 219. [Google Scholar] [CrossRef]
- Li, Q.; Li, Q.-Q.; Jia, J.-N.; Cao, S.; Wang, Z.-B.; Wang, X.; Luo, C.; Zhou, H.-H.; Liu, Z.-Q.; Mao, X.-Y. Sodium Valproate Ameliorates Neuronal Apoptosis in a Kainic Acid Model of Epilepsy via Enhancing PKC-Dependent GABAAR γ2 Serine 327 Phosphorylation. Neurochem. Res. 2018, 43, 2343–2352. [Google Scholar] [CrossRef]
- Karahalil, B. Overview of Systems Biology and Omics Technologies. Curr. Med. Chem. 2016, 23, 4221–4230. [Google Scholar] [CrossRef]
- Chu, X.; Zhang, B.; Koeken, V.; Gupta, M.K.; Li, Y. Multi-Omics Approaches in Immunological Research. Front. Immunol. 2021, 12, 668045. [Google Scholar] [CrossRef]
- Zheng, Y.Q.; Jin, M.F.; Suo, G.H.; Wu, Y.J.; Sun, Y.X.; Ni, H. Proteomics for Studying the Effects of Ketogenic Diet Against Lithium Chloride/Pilocarpine Induced Epilepsy in Rats. Front. Neurosci. 2020, 14, 562853. [Google Scholar] [CrossRef]
- Miljanovic, N.; Hauck, S.M.; van Dijk, R.M.; Di Liberto, V.; Rezaei, A.; Potschka, H. Proteomic signature of the Dravet syndrome in the genetic Scn1a-A1783V mouse model. Neurobiol. Dis. 2021, 157, 105423. [Google Scholar] [CrossRef]
- Pai, B.; Tome-Garcia, J.; Cheng, W.S.; Nudelman, G.; Beaumont, K.G.; Ghatan, S.; Panov, F.; Caballero, E.; Sarpong, K.; Marcuse, L.; et al. High-resolution transcriptomics informs glial pathology in human temporal lobe epilepsy. Acta Neuropathol. Commun. 2022, 10, 149. [Google Scholar] [CrossRef]
- Qi, Y.; Qian, R.; Jia, L.; Fei, X.; Zhang, D.; Zhang, Y.; Jiang, S.; Fu, X. Overexpressed microRNA-494 represses RIPK1 to attenuate hippocampal neuron injury in epilepsy rats by inactivating the NF-κB signaling pathway. Cell Cycle 2020, 19, 1298–1313. [Google Scholar] [CrossRef]
- Opitz, B. Memory function and the hippocampus. Front. Neurol. Neurosci. 2014, 34, 51–59. [Google Scholar]
- Zeng, Z.; Li, M.; Jiang, Z.; Lan, Y.; Chen, L.; Chen, Y.; Li, H.; Hui, J.; Zhang, L.; Hu, X.; et al. Integrated transcriptomic and metabolomic profiling reveals dysregulation of purine metabolism during the acute phase of spinal cord injury in rats. Front. Neurosci. 2022, 16, 1066528. [Google Scholar] [CrossRef]
- Li, M.; Luo, L.; Wu, Y.; Song, Z.; Ni, B.; Hao, F.; Luo, N. Elevated apoptosis and abnormal apoptosis signaling of regulatory T cells in patients with systemic lupus erythematosus. Lupus 2022, 31, 1441–1455. [Google Scholar] [CrossRef]
- Kumari, S.; Dhapola, R.; Reddy, D.H. Apoptosis in Alzheimer’s disease: Insight into the signaling pathways and therapeutic avenues. Apoptosis Int. J. Program. Cell Death 2023, 28, 943–957. [Google Scholar] [CrossRef]
- Henshall, D.C.; Simon, R.P. Epilepsy and apoptosis pathways. J. Cereb. Blood Flow Metab. Off. J. Int. Soc. Cereb. Blood Flow Metab. 2005, 25, 1557–1572. [Google Scholar] [CrossRef]
- Liu, M.; Jiang, L.; Wen, M.; Ke, Y.; Tong, X.; Huang, W.; Chen, R. Microglia depletion exacerbates acute seizures and hippocampal neuronal degeneration in mouse models of epilepsy. Am. J. Physiol. Cell Physiol. 2020, 319, C605–c610. [Google Scholar] [CrossRef]
- Hailer, N.P.; Wirjatijasa, F.; Roser, N.; Hischebeth, G.T.; Korf, H.W.; Dehghani, F. Astrocytic factors protect neuronal integrity and reduce microglial activation in an in vitro model of N-methyl-D-aspartate-induced excitotoxic injury in organotypic hippocampal slice cultures. Eur. J. Neurosci. 2001, 14, 315–326. [Google Scholar] [CrossRef]
- Wu, W.; Li, Y.; Wei, Y.; Bosco, D.B.; Xie, M.; Zhao, M.G.; Richardson, J.R.; Wu, L.J. Microglial depletion aggravates the severity of acute and chronic seizures in mice. Brain Behav. Immun. 2020, 89, 245–255. [Google Scholar] [CrossRef]
- Iwasa, K.; Yamamoto, S.; Yagishita, S.; Maruyama, K.; Yoshikawa, K. Excitotoxicity-induced prostaglandin D(2) production induces sustained microglial activation and delayed neuronal death. J. Lipid Res. 2017, 58, 649–655. [Google Scholar] [CrossRef]
- Gao, P.; Wang, F.; Huo, J.; Wan, D.; Zhang, J.; Niu, J.; Wu, J.; Yu, B.; Sun, T. ALG13 Deficiency Associated with Increased Seizure Susceptibility and Severity. Neuroscience 2019, 409, 204–221. [Google Scholar] [CrossRef]
- Wu, Z.; Deshpande, T.; Henning, L.; Bedner, P.; Seifert, G.; Steinhäuser, C. Cell death of hippocampal CA1 astrocytes during early epileptogenesis. Epilepsia 2021, 62, 1569–1583. [Google Scholar] [CrossRef]
- Huang, C.; You, Z.; He, Y.; Li, J.; Liu, Y.; Peng, C.; Liu, Z.; Liu, X.; Sun, J. Combined transcriptomics and proteomics forecast analysis for potential biomarker in the acute phase of temporal lobe epilepsy. Front. Neurosci. 2023, 17, 1145805. [Google Scholar] [CrossRef]
- Copani, A.; Uberti, D.; Sortino, M.A.; Bruno, V.; Nicoletti, F.; Memo, M. Activation of cell-cycle-associated proteins in neuronal death: A mandatory or dispensable path? Trends Neurosci. 2001, 24, 25–31. [Google Scholar] [CrossRef]
- Ham, Y.M.; Choi, K.J.; Song, S.Y.; Jin, Y.H.; Chun, M.W.; Lee, S.K. Xylocydine, a novel inhibitor of cyclin-dependent kinases, prevents the tumor necrosis factor-related apoptosis-inducing ligand-induced apoptotic cell death of SK-HEP-1 cells. J. Pharmacol. Exp. Ther. 2004, 308, 814–819. [Google Scholar] [CrossRef]
- Liu, D.X.; Greene, L.A. Regulation of neuronal survival and death by E2F-dependent gene repression and derepression. Neuron 2001, 32, 425–438. [Google Scholar] [CrossRef]
- Becker, E.B.E.; Bonni, A. Cell cycle regulation of neuronal apoptosis in development and disease. Prog. Neurobiol. 2004, 72, 1–25. [Google Scholar] [CrossRef]
- Heintz, N. Cell death and the cell cycle: A relationship between transformation and neurodegeneration? Trends Biochem. Sci. 1993, 18, 157–159. [Google Scholar] [CrossRef]
- Clarke, A.R.; Maandag, E.R.; van Roon, M.; van der Lugt, N.M.; van der Valk, M.; Hooper, M.L.; Berns, A.; te Riele, H. Requirement for a functional Rb-1 gene in murine development. Nature 1992, 359, 328–330. [Google Scholar] [CrossRef]
- Fishelson, Z.; Attali, G.; Mevorach, D. Complement and apoptosis. Mol. Immunol. 2001, 38, 207–219. [Google Scholar] [CrossRef]
- Afshar-Kharghan, V. The role of the complement system in cancer. J. Clin. Investig. 2017, 127, 780–789. [Google Scholar] [CrossRef]
- De Luca, C.; Virtuoso, A.; Maggio, N.; Papa, M. Neuro-Coagulopathy: Blood Coagulation Factors in Central Nervous System Diseases. Int. J. Mol. Sci. 2017, 18, 2128. [Google Scholar] [CrossRef]
- Liang, Z.; Zheng, Z.; Guo, Q.; Tian, M.; Yang, J.; Liu, X.; Zhu, X.; Liu, S. The role of HIF-1α/HO-1 pathway in hippocampal neuronal ferroptosis in epilepsy. iScience 2023, 26, 108098. [Google Scholar] [CrossRef]
- Wang, G.; Xie, G.; Han, L.; Wang, D.; Du, F.; Kong, X.; Su, G. Involvement of hypoxia-inducible factor-1 alpha in the upregulation of P-glycoprotein in refractory epilepsy. Neuroreport 2019, 30, 1191–1196. [Google Scholar] [CrossRef]
- Choudhry, H.; Harris, A.L. Advances in Hypoxia-Inducible Factor Biology. Cell Metab. 2018, 27, 281–298. [Google Scholar] [CrossRef]
- Keith, B.; Johnson, R.S.; Simon, M.C. HIF1α and HIF2α: Sibling rivalry in hypoxic tumor growth and progression. Nat. Rev. Cancer 2012, 12, 9–22. [Google Scholar] [CrossRef]
- Chowdhury, R.; Leung, I.K.H.; Tian, Y.-M.; Abboud, M.I.; Ge, W.; Domene, C.; Cantrelle, F.-X.; Landrieu, I.; Hardy, A.P.; Pugh, C.W.; et al. Structural basis for oxygen degradation domain selectivity of the HIF prolyl hydroxylases. Nat. Commun. 2016, 7, 12673. [Google Scholar] [CrossRef]
- Gossage, L.; Eisen, T.; Maher, E.R. VHL, the story of a tumour suppressor gene. Nat. Rev. Cancer 2014, 15, 55–64. [Google Scholar] [CrossRef]
- Patrick, H.; Maxwell, M.S.W.; Gin-Wen Chang, S.C.C.; Emma, C.V.; Matthew, E.; Cockman, C.C.W.; Christopher, W.; Pugh, E.R.M.; Ratcliffe, P.J. The tumour suppressor protein VHL targets hypoxia-inducible factors for oxygen-dependent proteolysis. Nat. Commun. 1999, 399, 271–275. [Google Scholar]
- Mack, F.A.; Rathmell, W.K.; Arsham, A.M.; Gnarra, J.; Keith, B.; Simon, M.C. Loss of pVHL is sufficient to cause HIF dysregulation in primary cells but does not promote tumor growth. Cancer Cell 2003, 3, 75–88. [Google Scholar] [CrossRef]
- Bergamaschi, C.; Pagoni, M.; Rosati, M.; Angel, M.; Tzannou, I.; Vlachou, M.; Darmani, I.; Ullah, A.; Bear, J.; Devasundaram, S.; et al. Reduced Antibodies and Innate Cytokine Changes in SARS-CoV-2 BNT162b2 mRNA Vaccinated Transplant Patients with Hematological Malignancies. Front. Immunol. 2022, 13, 899972. [Google Scholar] [CrossRef]
- Rafati, A.; Jameie, M.; Amanollahi, M.; Jameie, M.; Pasebani, Y.; Sakhaei, D.; Ilkhani, S.; Rashedi, S.; Pasebani, M.Y.; Azadi, M.; et al. Association of seizure with COVID-19 vaccines in persons with epilepsy: A systematic review and meta-analysis. J. Med. Virol. 2023, 95, e29118. [Google Scholar] [CrossRef]
- Tufan, A.; Avanoğlu Güler, A.; Matucci-Cerinic, M. COVID-19, immune system response, hyperinflammation and repurposing antirheumatic drugs. Turk. J. Med. Sci. 2020, 50, 620–632. [Google Scholar] [CrossRef]
- Manu, K.A.; Cao, P.H.A.; Chai, T.F.; Casey, P.J.; Wang, M. p21cip1/waf1 Coordinate Autophagy, Proliferation and Apoptosis in Response to Metabolic Stress. Cancers 2019, 11, 1112. [Google Scholar] [CrossRef]
- Baptiste-Okoh, N.; Barsotti, A.M.; Prives, C. Caspase 2 is both required for p53-mediated apoptosis and downregulated by p53 in a p21-dependent manner. Cell Cycle 2008, 7, 1133–1138. [Google Scholar] [CrossRef]
- Jänicke, R.U.; Sohn, D.; Essmann, F.; Schulze-Osthoff, K. The multiple battles fought by anti-apoptotic p21. Cell Cycle 2007, 6, 407–413. [Google Scholar] [CrossRef]
- Gartel, A.L. The conflicting roles of the cdk inhibitor p21(CIP1/WAF1) in apoptosis. Leuk. Res. 2005, 29, 1237–1238. [Google Scholar] [CrossRef]
- Chen, H.; Shen, Y.; Gong, F.; Jiang, Y.; Zhang, R. HIF-α Promotes Chronic Myelogenous Leukemia Cell Proliferation by Upregulating p21 Expression. Cell Biochem. Biophys. 2015, 72, 179–183. [Google Scholar] [CrossRef]
- Cho, Y.-S.; Bae, J.-M.; Chun, Y.-S.; Chung, J.-H.; Jeon, Y.-K.; Kim, I.-S.; Kim, M.-S.; Park, J.-W. HIF-1α controls keratinocyte proliferation by up-regulating p21(WAF1/Cip1). Biochim. Biophys. Acta (BBA)—Mol. Cell Res. 2008, 1783, 323–333. [Google Scholar] [CrossRef]
- Kearney, J.A.; Copeland-Hardin, L.D.; Duarte, S.; Zachwieja, N.A.; Eckart-Frank, I.K.; Hawkins, N.A. Fine mapping and candidate gene analysis of a dravet syndrome modifier locus on mouse chromosome 11. Mamm. Genome Off. J. Int. Mamm. Genome Soc. 2022, 33, 565–574. [Google Scholar] [CrossRef]
- Hawkins, N.A.; Nomura, T.; Duarte, S.; Barse, L.; Williams, R.W.; Homanics, G.E.; Mulligan, M.K.; Contractor, A.; Kearney, J.A. Gabra2 is a genetic modifier of Dravet syndrome in mice. Mamm. Genome Off. J. Int. Mamm. Genome Soc. 2021, 32, 350–363. [Google Scholar] [CrossRef]
- Oakley, J.C.; Kalume, F.; Yu, F.H.; Scheuer, T.; Catterall, W.A. Temperature- and age-dependent seizures in a mouse model of severe myoclonic epilepsy in infancy. Proc. Natl. Acad. Sci. USA 2009, 106, 3994–3999. [Google Scholar] [CrossRef]
- Warner, T.A.; Liu, Z.; Macdonald, R.L.; Kang, J.Q. Heat induced temperature dysregulation and seizures in Dravet Syndrome/GEFS+ Gabrg2(+/Q390X) mice. Epilepsy Res. 2017, 134, 1–8. [Google Scholar] [CrossRef]
- The Gene Ontology Resource: 20 years and still GOing strong. Nucleic Acids Res. 2019, 47, D330–D338. [CrossRef]
- Kanehisa, M.; Araki, M.; Goto, S.; Hattori, M.; Hirakawa, M.; Itoh, M.; Katayama, T.; Kawashima, S.; Okuda, S.; Tokimatsu, T.; et al. KEGG for linking genomes to life and the environment. Nucleic Acids Res. 2008, 36, D480–D484. [Google Scholar] [CrossRef]


| Number | KEGG | Pathway Names | Genes | Proteins |
|---|---|---|---|---|
| 1 | mmu00533 | Glycosaminoglycan biosynthesis– keratan sulfate | B4galt1 | Chst2 |
| 2 | mmu00565 | Ether lipid metabolism | Plb1 | Enpp2 |
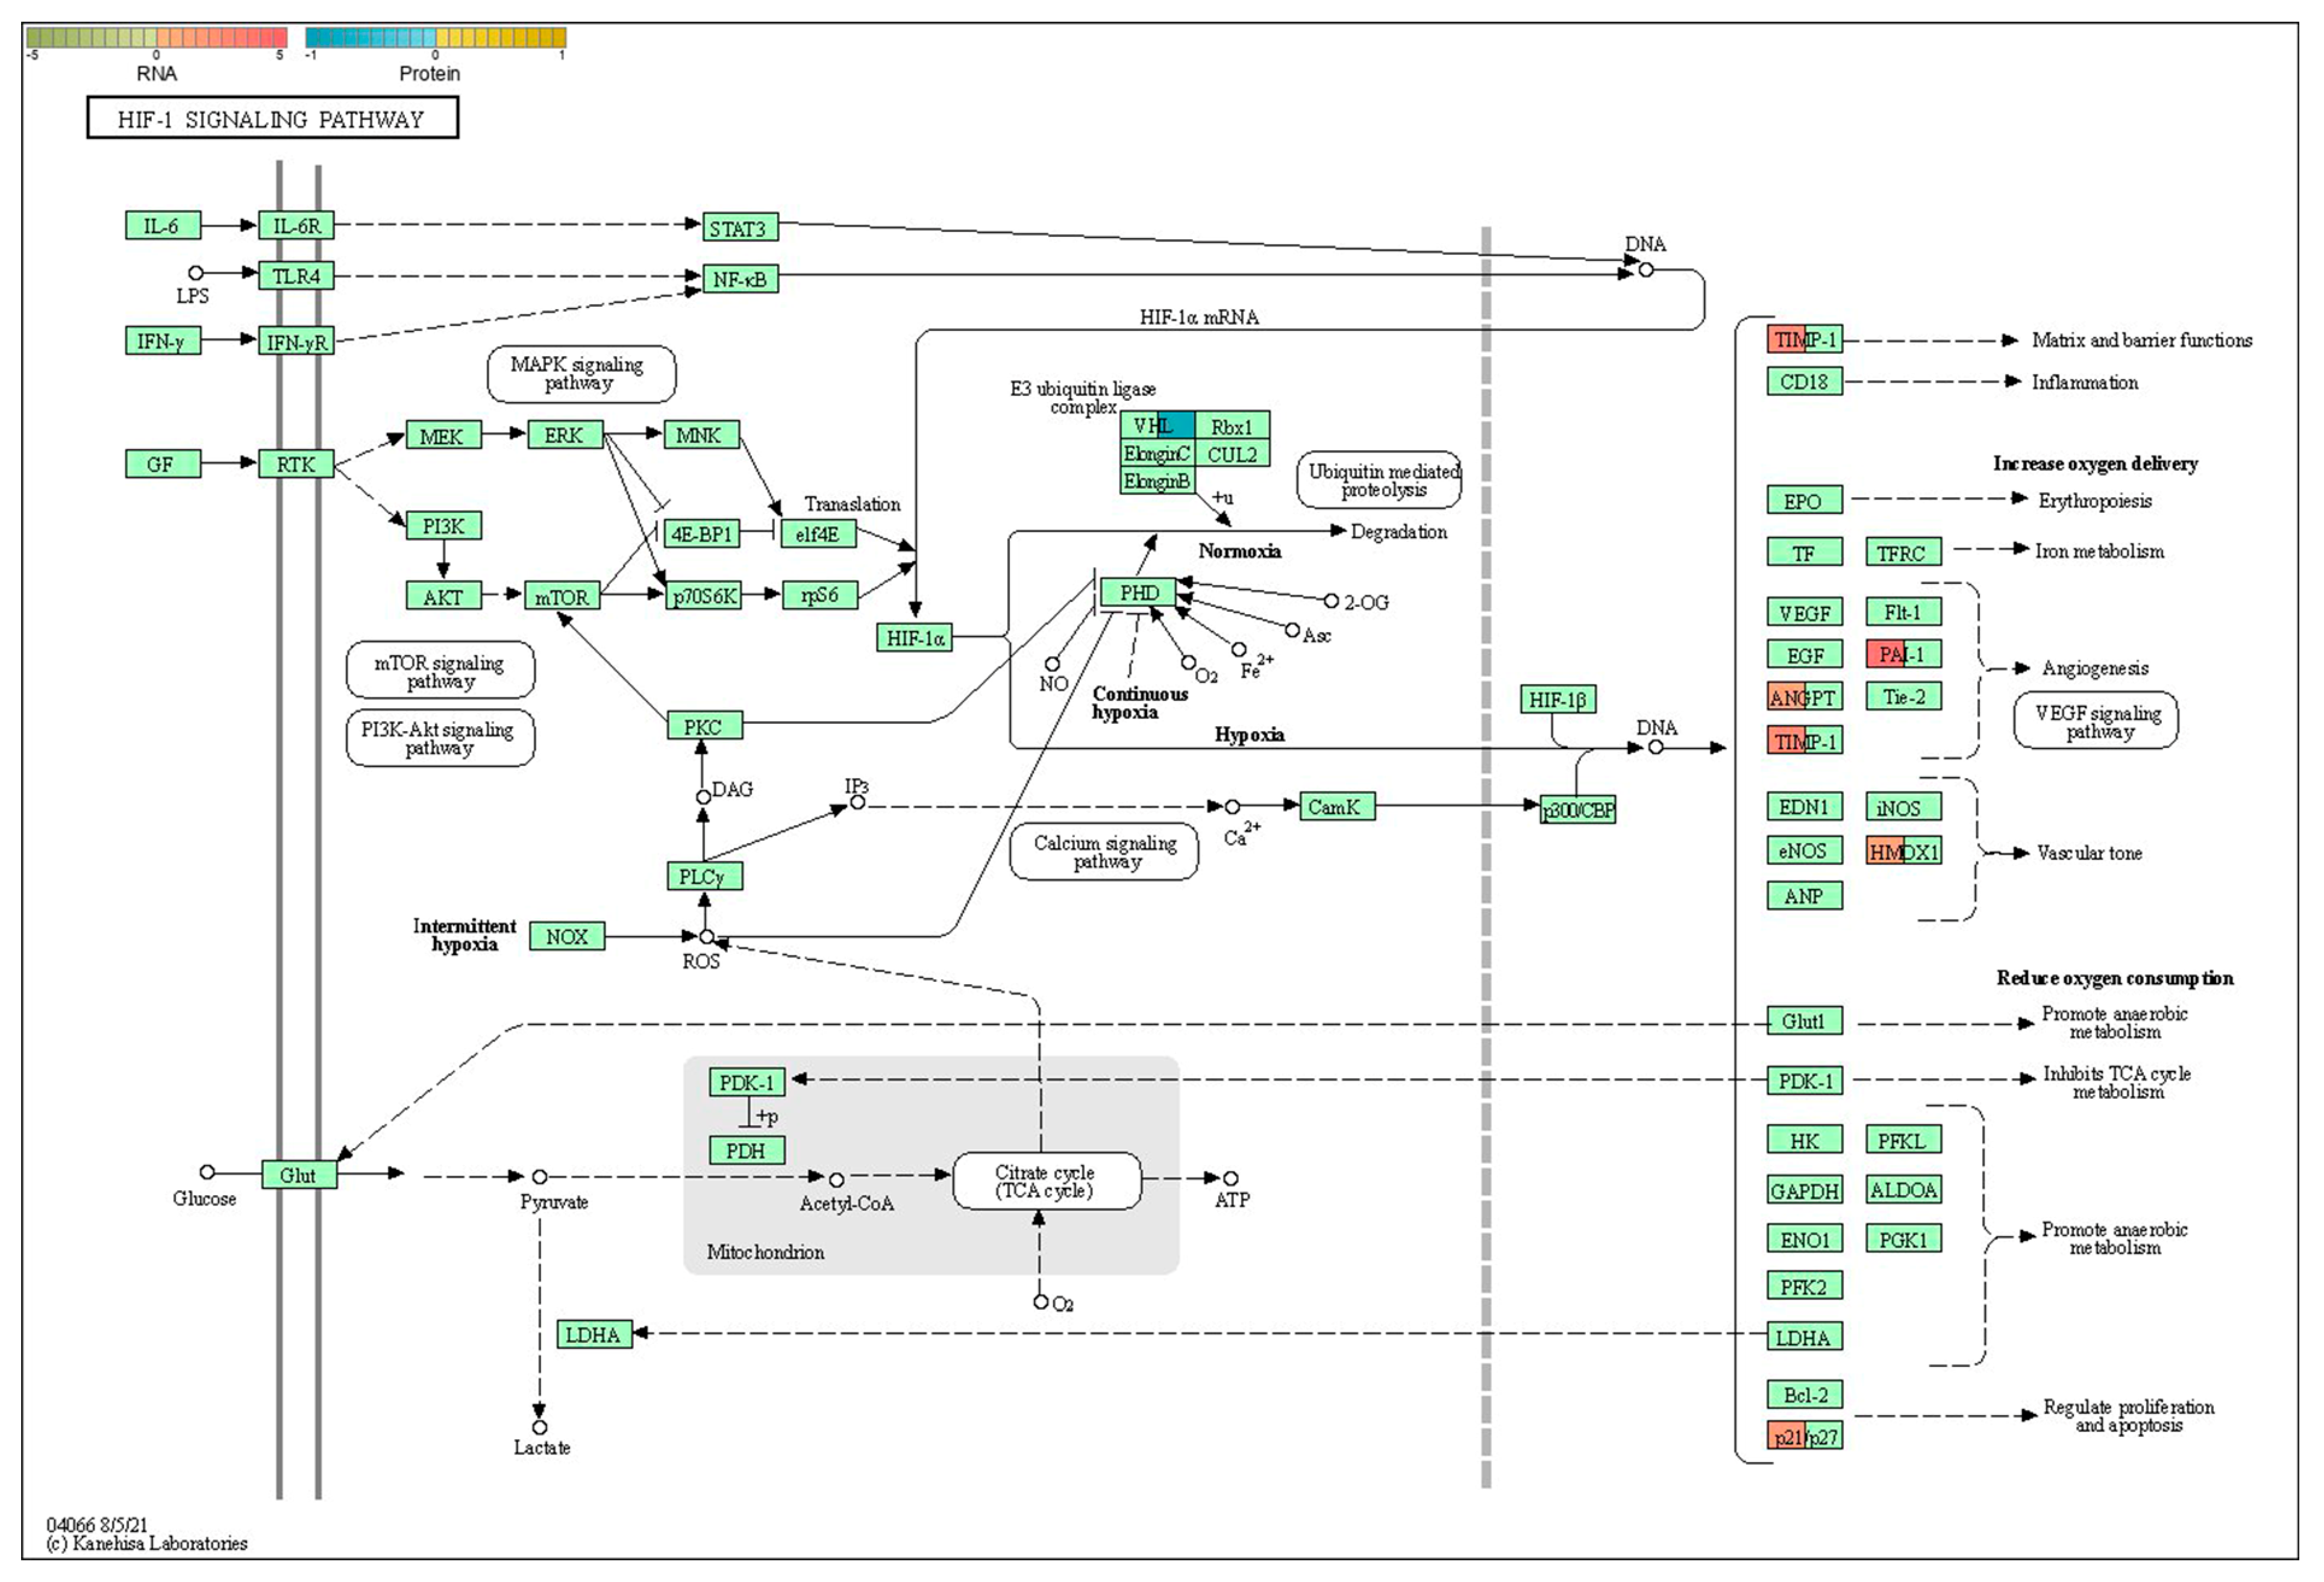
| 3 | mmu04066 | HIF-1 signaling pathway | Angpt2;Cdkn1a;Hmox1;Serpine1;Timp1 | Vhl |
| 4 | mmu04080 | Neuroactive ligand–receptor interaction | Adm;Bdkrb2;C5ar1;Calcr;Drd1;Drd4;Edn3;F2rl2;Gal;Ghsr;Glra1;Hcrtr1;Npbwr1;Npsr1;Npy;Npy2r;Ntsr1;Penk;Prlr;Sstr2;Tacr1;Trh;Vgf | F2 |
| 5 | mmu04110 | Cell cycle | Cdkn1a;Gadd45a;Gadd45b;Gadd45g | Anapc7 |
| 6 | mmu04114 | Oocyte meiosis | Mapk12 | Anapc7 |
| 7 | mmu04120 | Ubiquitin-mediated proteolysis | Socs3;Ubc | Anapc7,Vhl |
| 8 | mmu04144 | Endocytosis | Hspa1a;Hspa1b | Folr1 |
| 9 | mmu04261 | Adrenergic signaling in cardiomyocytes | Creb3l1;Mapk12 | Tnnt2 |
| 10 | mmu04610 | Complement and coagulation cascades | A2m;Bdkrb2;C4b;C5ar1;F2rl2;Plaur;Serpinb2;Serpine1;Serpinf2 | F2 |
| 11 | mmu04611 | Platelet activation | Itga2;Mapk12;Mylk3 | F2 |
| 12 | mmu04728 | Dopaminergic synapse | Creb3l1;Drd1;Drd4;Fos;Mapk12;Slc18a2;Th | Scn1a |
| 13 | mmu04810 | Regulation of actin cytoskeleton | Bdkrb2;Fgf21;Itga2;Itga5;Myh9;Mylk3 | F2 |
| 14 | mmu04914 | Progesterone-mediated oocyte maturation | Mapk12 | Anapc7 |
| 15 | mmu04915 | Estrogen signaling pathway | Creb3l1;Fos;Hspa1a;Hspa1b;Jun;Krt14;Krt15;Rara | Krt18 |
| 16 | mmu04918 | Thyroid hormone synthesis | Creb3l1;Hspa5 | Ttr |
| 17 | mmu04924 | Renin secretion | Aqp1;Edn3;Kcnj2 | Ace,Aqp1 |
| 18 | mmu04964 | Proximal tubule bicarbonate reclamation | Aqp1 | Aqp1 |
| 19 | mmu04976 | Bile secretion | Aqp1;Hmgcr | Aqp1 |
| 20 | mmu05031 | Amphetamine addiction | Arc;Creb3l1;Drd1;Fos;Fosb;Jun;Slc18a2;Th | Arc |
| 21 | mmu05142 | Chagas disease | Bdkrb2;Ccl2;Ccl3;Fadd;Fos;Jun;Mapk12;Serpine1;Tlr2 | Ace |
| 22 | mmu05150 | Staphylococcus aureus infection | C4b;C5ar1;Dsg1c;Fcgr2b;Fcgr4;Icam1;Krt14;Krt15 | Krt18 |
| 23 | mmu05166 | Human T-cell leukemia virus 1 infection | Cdkn1a;Creb3l1;Egr1;Egr2;Fos;Fosl1;Icam1;Il1r2;Jun;Msx3;Zfp36 | Anapc7 |
| 24 | mmu05171 | Coronavirus disease—COVID-19 | C4b;C5ar1;Ccl2;Fos;Jun;Mapk12;Tlr2 | Ace,F2 |
| 25 | mmu05200 | Pathways in cancer | Bbc3;Bdkrb2;Cdkn1a;Col4a1;Epor;Fadd;Fgf21;Fos;Frat2;Gadd45a; Gadd45b;Gadd45g;Hes5;Hmox1;Itga2;Jun; Nkx3-1;Pim1;Pmaip1;Ptgs2;Rara;Ret;Runx1;Wnt2;Wnt8b;Wnt9b | Vhl,F2 |
| 26 | mmu05205 | Proteoglycans in cancer | Cd44;Cdkn1a;Flnc;Itga2;Itga5;Mapk12;Plaur;Sdc1;Thbs1;Tlr2;Wnt2; Wnt8b;Wnt9b | Pdcd4 |
| 27 | mmu05206 | MicroRNAs in cancer | Cd44;Cdkn1a;Hmox1;Itga5;Mcl1;Pim1;Ptgs2;Spry2;Thbs1;Tnc | Pdcd4,Tp63 |
| 28 | mmu05211 | Renal cell carcinoma | Cdkn1a;Jun | Vhl |
| 29 | mmu05225 | Hepatocellular carcinoma | Cdkn1a;Frat2;Gadd45a;Gadd45b;Gadd45g;Hmox1;Wnt2;Wnt8b; Wnt9b | Pbrm1 |
| 30 | mmu05410 | Hypertrophic cardiomyopathy | Itga2;Itga5 | Ace,Tnnt2 |
| 31 | mmu05414 | Dilated cardiomyopathy | Itga2;Itga5 | Tnnt2 |
| 32 | mmu05415 | Diabetic cardiomyopathy | Mapk12 | Ace |
| Items | Settings |
|---|---|
| Static modification | TMT (N-term, K); carbamidomethyl (C) |
| Dynamic modification | Oxidation (M), acetyl (N-term) |
| Digestion | Trypsin |
| Instrument | Orbitrap fusion |
| MS1 tolerance | 10 ppm |
| MS2 tolerance | 0.02 Da |
| Missed cleavages | 2 |
| Database | uniprot-reviewed_yes+taxonomy_10090.fasta |
| Gene | Forward | Reverse |
|---|---|---|
| Trh | 5′-ACCTTGGCTGATGATGGCTCTG-3′ | 5′-CTTCCTCCTGGGCTGCTTCC-3′ |
| Tgm1 | 5′-GTGGAACGACTGCTGGATGAAG-3′ | 5′-GACTAAGCCATTCTTGACGGACTC-3′ |
| Sprr1a | 5′-GCCAGCCTAAGGTGCCAGAG-3′ | 5′-GTATGGTGATGGAGTGACAGTTGAG-3′ |
| Etv3l | 5′-CAAGACCAAAGGCAAGAAGTTTACC-3′ | 5′-AGGCACCAAGGGCTGACAC-3′ |
| Cartpt | 5′-GTGCCCGTGCCCAGGAG-3′ | 5′-TCTTGAGCTTCTTCAGGACTTCTTG-3′ |
| P21 | 5′-CCGTGGACAGTGAGCAGTTG-3′ | 5′-CCTCCAGCGGCGTCTCC-3′ |
Disclaimer/Publisher’s Note: The statements, opinions and data contained in all publications are solely those of the individual author(s) and contributor(s) and not of MDPI and/or the editor(s). MDPI and/or the editor(s) disclaim responsibility for any injury to people or property resulting from any ideas, methods, instructions or products referred to in the content. |
© 2024 by the authors. Licensee MDPI, Basel, Switzerland. This article is an open access article distributed under the terms and conditions of the Creative Commons Attribution (CC BY) license (https://creativecommons.org/licenses/by/4.0/).
Share and Cite
Kong, X.; Dai, G.; Zeng, Z.; Zhang, Y.; Gu, J.; Ma, T.; Wang, N.; Gu, J.; Wang, Y. Integrating Proteomics and Transcriptomics Reveals the Potential Pathways of Hippocampal Neuron Apoptosis in Dravet Syndrome Model Mice. Int. J. Mol. Sci. 2024, 25, 4457. https://doi.org/10.3390/ijms25084457
Kong X, Dai G, Zeng Z, Zhang Y, Gu J, Ma T, Wang N, Gu J, Wang Y. Integrating Proteomics and Transcriptomics Reveals the Potential Pathways of Hippocampal Neuron Apoptosis in Dravet Syndrome Model Mice. International Journal of Molecular Sciences. 2024; 25(8):4457. https://doi.org/10.3390/ijms25084457
Chicago/Turabian StyleKong, Xuerui, Gaohe Dai, Zhong Zeng, Yi Zhang, Jiarong Gu, Teng Ma, Nina Wang, Jinhai Gu, and Yin Wang. 2024. "Integrating Proteomics and Transcriptomics Reveals the Potential Pathways of Hippocampal Neuron Apoptosis in Dravet Syndrome Model Mice" International Journal of Molecular Sciences 25, no. 8: 4457. https://doi.org/10.3390/ijms25084457