
Features of the Effect of Quercetin on Different Genotypes of Wheat under Hypoxia
by

Larisa Ivanovna Fedoreyeva
1,*,
Elena Michailovna Lazareva
1,2 and
Neonila Vasilievna Kononenko
1 1
All-Russia Research Institute of Agricultural Biotechnology, Timiryazevskaya 42, 127550 Moscow, Russia
2
Biological Department, M.V. Lomonosov Moscow State University, Leninskie Gory 1, 119991 Moscow, Russia
*
Author to whom correspondence should be addressed.
Int. J. Mol. Sci. 2024, 25(8), 4487; https://doi.org/10.3390/ijms25084487
Submission received: 30 March 2024
/
Revised: 15 April 2024
/
Accepted: 15 April 2024
/
Published: 19 April 2024
(This article belongs to the Special Issue Assimilate Production and Allocation in Plants under Abiotic Stress 2.0)
Abstract
:Hypoxia is one of the common abiotic stresses that negatively affects the development and productivity of agricultural crops. Quercetin is used to protect plants from oxidative stress when exposed to environmental stressors. O2 deficiency leads to impaired development and morphometric parameters in wheat varieties Orenburgskaya 22 (Triticum aestivum L.) and varieties Zolotaya (Triticum durum Desf.). Cytological analysis revealed various types of changes in the cytoplasm under conditions of hypoxia and treatment with quercetin. The most critical changes in the cytoplasm occur in the Zolotaya variety during pretreatment with quercetin followed by hypoxia, and in the Orenburgskaya 22 variety during hypoxia. Quercetin has a protective effect only on the Orenburgskaya 22 variety, and also promotes a more effective recovery after exposure to low O2 content. Hypoxia causes an increase in reactive oxygen species and activates the antioxidant system. It has been shown that the most active components of the antioxidant system in the Orenburgskaya 22 variety are MnSOD and Cu/ZnSOD, and in the Zolotaya variety GSH. We have shown that quercetin provides resistance only to the wheat genotype Orenburgskaya 22, as a protective agent against abiotic stress, which indicates the need for a comprehensive study of the effects of exogenous protectors before use in agriculture.
1. Introduction
Plants, due to their immobile nature, are very dependent on environmental conditions and suffer from its adverse effects. To counteract negative factors, plants have developed a powerful defense system. Various enzymes and numerous secondary metabolites are involved in the protective functions [1]. Wheat is one of the most important agricultural crops. The survival of half of the population of our planet depends on the yield of this crop and the quality of the grain. In mid-latitudes with a temperate climate, which is most favorable for the normal growth of wheat, there is an increase in wetland crop lands associated with heavy seasonal rainfall.
O2 is an essential element for plant survival. O2 deficiency impairs respiration and other biochemical processes [2]. Not only hypoxia, but also a number of other conditions can lead to a decrease in O2 availability; for example, salt stress can disrupt symplastic connections between cells.
Most terrestrial plants can temporarily survive the O2 deficiency that occurs during heavy rainfall, either by accelerating shoot growth or by slowing growth and entering a dormant state. Reduced O2 content in flooded plants causes growth retardation and cell damage. With prolonged exposure to hypoxia, these effects are enhanced [3,4]. The stage of plant development when it is immersed in water is of great importance for the effect of the damage. This is especially observed during seed germination, and early development; flooding also has a negative effect during flowering [5,6]. Plant recovery after O2 deficiency is also one of the most important factors determining plant tolerance to hypoxia [7]. One of the visual indicators of plant response to hypoxia is the destruction of chlorophyll, the so-called chlorosis, which occurs when there is a lack of O2 [8]. As a result of hypoxia, chlorophyll degradation occurs, the degree of which depends on the duration of hypoxia. However, chlorosis in plants can continue even after normal conditions are restored [9,10].
Stress factors lead to damage causing increased reactive oxygen species (ROS) production [11,12]. A significant increase in ROS is called oxidative stress. ROS generation is carried out mainly by mitochondria during oxidative phosphorylation reactions in the electron transport chain [13,14]. Changes in mitochondria lead to the release of intermembrane proteins, the disruption of the electron transport chain, changes in the transmembrane potential difference, and the formation of excess ROS [15]. An increase in lipid oxidation in mitochondrial membranes disrupts their integrity and leads to the swelling and lysis of mitochondria. This disrupts the energy supply of cells and reduces their adaptive ability to stress factors. During hypoxia, phosphatidic acid is released, which activates type D phospholipase, which triggers the regulation of the production of ROS and calcium [16]. Wheat plants tolerate hypoxia stress by regulating lipid remodeling, causing multiple changes in endogenous lipid levels [17].
The level of formation of highly toxic ROS in plant cells is controlled by antioxidants [18]. Plants have protective mechanisms against oxidative stress, leading to a decrease in the production of ROS and their destruction [19]. The antioxidant system of plants consists of enzymatic (superoxide dismutase, ascorbate peroxidase, guaiacol peroxidase, catalase, etc.) and non-enzymatic antioxidants (flavonoids, carotenoids, ascorbate, glutathione, tocopherols, etc.) [20,21].
Low-molecular-weight antioxidants belong to the secondary antioxidant system, as they are activated under severe oxidative stress, when the enzymatic antioxidant system can no longer cope with excess ROS. The main role of low-molecular-weight antioxidants is to detect and chelate free radicals. Flavonoids are one of the main classes of secondary plant metabolites and belong to the group of low-molecular-weight antioxidants [22]. More than 9000 flavonoid derivatives have been identified in various plants, which are further divided into different subfamilies depending on the modification of their basic structure [23,24]. Flavonoids contain several subgroups, including anthocyanidins, flavones, flavanols, flavanones, etc.
Quercetin (3,3′,4′, 5,7-pentahydroxyflavone) is one of the most abundant flavonoids in plants. Quercetin (Qu), classified as a phenolic compound, has strong antioxidant effects as it helps maintain oxidative balance [25]. This flavonoid is found in the outer membrane layer of the chloroplast membrane [26]. Due to this localization, Qu is involved in the regulation of the intensity of light exposure to plants [27]. Qu plays an important role in the process of protecting plants from the effects of stress, such as ultraviolet radiation or osmotic stress, which has been confirmed in numerous studies [28,29,30,31].
To increase the efficiency of agricultural production, a variety of plant protection products are widely used. However, these products often have adverse effects on the environment and human health. Therefore, more and more attention is being paid to the use of safe agents. The exogenous use of various bioregulators is very promising due to their cost-effectiveness compared to traditional breeding or transgenic approaches for increasing plant tolerance. Currently, more and more data are emerging on the use of Qu as a protective element against various stress factors [32]. However, despite the large number of publications on the effect of the exogenous application of phenolic substances, including Qu, on physiological processes occurring in plants [33], information about it in wheat seedlings is insufficient [34]. The purpose of the study was to evaluate the effectiveness of using exogenous Qu on wheat seedlings of two genotypes exposed to hypoxia. The results obtained will allow future studies to evaluate the usefulness of this flavonoid as a preventive agent that protects plants from biotic and abiotic stresses.
2. Results
2.1. Growth Condition
The deficiency of O2 has the greatest negative effect on seed germination and in the early stages of plant development [5,6]. The effect of hypoxia was studied on six-day-old wheat seedlings grown in a roll culture. To study the reduction of excess ROS formed during hypoxia, the treatment of seedlings of two varieties of Orenburgskaya 22 (Triticum aestivum) and Zolotaya (Triticum durum) with Qu was used before and after hypoxia for antioxidant systems, according to the scheme below (Figure 1).
In Table 1 are given the morphometric parameters of plant changes in response to O2 deficiency in six-day-old seedlings of two wheat varieties before and after treatment with 0.03% Qu.
The total length of seedlings of the Zolotaya variety practically does not change under hypoxia. O2 deficiency leads to a decrease in shoot height by 1.21 times, but, at the same time, the root lengthens by 1.17 times. Hypoxia causes dramatic morphological changes in the Orenburgskaya 22 variety. The total length of seedlings during hypoxia decreases by 1.96 times: at the same time, the length of the roots decreased, in contrast to the Zolotaya variety, by 1.15 times. The height of shoots in the Orenburgskaya 22 variety also decreased by 1.23 times, as in the Zolotaya variety. Qu does not affect the morphometric parameters of the Zolotaya variety grown under normal conditions, and also does not affect the morphometric parameters under conditions of O2 deficiency. However, Qu promotes the development of the Orenburgskaya 22 variety, and leads to a slight elongation of the roots by 1.05 times. Although pre-treatment with the Qu variety Orenburgskaya 22 before hypoxia (path A) is accompanied by morphometric changes, a decrease in the total length of the seedling by 1.08 times and a decrease in shoot height by 1.13 times is observed, while the length of the roots remains practically unchanged. However, treatment with Qu after hypoxia reveals the inhibition of the growth of both roots and shoots in the Orenburgskaya 22 variety. Probably, this fact indicates that, for the Orenburgskaya 22 variety, reoxygenation is the most limiting stage after hypoxia. Unlike the Orenburgskaya 22 variety, the Zolotaya wheat variety is tolerant of O2 deficiency; its total seedling length remains virtually unchanged and treatment with Qu does not affect the morphometric parameters.
2.2. Cytological Analysis
The structure of the root cells of two wheat genotypes grown under different conditions leading to the formation of vacuoles in the cytoplasm was studied. As a result, cell types with vacuoles were identified that differed in size, shape, and localization in the cytoplasm. No changes in the cytoplasm were detected in the cells of control plants of both wheat varieties (Figure 2, Table 2).
Under hypoxic conditions, with a decrease in the availability of O2, small and narrow, elongated vacuoles near the nuclear membrane were detected in the root cells of the Zolotaya variety. However, most cells contained giant vacuoles near the nucleus, causing the nucleus to move toward the cytoplasmic membrane. In most cells of the Orenburgskaya 22 variety, elongated vacuoles near the nucleus were detected. In some cells, irregularly shaped vacuoles were randomly located throughout the cytoplasm. Invaginations of the plasma membrane were detected on the cell surface.
When seedlings of the Orenburg variety were treated with Qu, 22 irregularly shaped vacuoles were detected only in dividing root cells. In some cells of the Zolotaya variety, large vacuoles around the nucleus are found in the cytoplasm. Most cells had one giant vacuole around the nucleus.
Pre-treatment with Qu before exposure to hypoxia on seedlings of the Orenburgskaya 22 variety is accompanied by the formation of giant vacuoles, which can lead to kernel deformation. However, there are cells with a granular structure. In the Zolotaya variety, interphase (G2) and prophase cells are characterized by the granularity of the cytoplasm at the G2 and prophase stages.
Treatment with Qu after hypoxia in cells of the Orenburgskaya 22 variety is accompanied by the formation of a fine-grained structure of the cytoplasm. In most cells, vacuoles of irregular shape are concentrated around the nucleus. In the Zolotaya variety, under the same conditions, cells with numerous small vacuoles are found, forming necklaces around the nuclei.
2.3. Chlorophyll Content
Plant stress negatively affects photosynthetic electron transfer in PSI and PSII and chlorophyll biosynthesis [12,35]. Therefore, the photosynthetic apparatus is a sensor of various environmental stresses, which may be responsible for the imbalance of cellular energy due to the modification of the redox status [36]. From the data in Table 3, it is clear that hypoxia leads to a decrease in the content of chlorophyll a (Chl a) and chlorophyll b (Chl b) in the leaves of the wheat variety Orenburgskaya 22 (3.3 times and 3.7 times, respectively). However, in the leaves of the Zolotaya variety, the effect of hypoxia is of a different nature; even a slight increase in the content of Chl a and b is observed. It should be noted that the content of Chl a and Chl b in the Zolotaya variety in the control is lower than in the Orenburgskaya 22 variety (1.7 times and 1.9 times, respectively). The Chl a/Chl b ratio in the Zolotaya variety is higher than in the Orenburgskaya 22 variety due to the lower Chl b content. Under O2 deficiency, the Chl a/Chl b ratio increased relative to the control in both the Orenburgskaya 22 wheat and the Zolotaya variety, although not as significantly.
The addition of Qu leads to an increase in the content of Chl a and Chl b in the leaves of the wheat variety Orenburgskaya 22 and has virtually no effect on their content in the Zolotaya variety. The addition of Qu before hypoxia (path A) prevents a decrease in the content of Chl a and Chl b in the leaves of the Orenburgskaya 22 variety), thereby not disrupting the process of photosynthesis, and an even higher content of Chl a and Chl b is observed than in the control. The addition of Qu after hypoxia (Figure 1, path B) leads to an increase in the content of Chl a and Chl b, but does not lead to their complete recovery. Thus, in the leaves of the Orenburgskaya 22 variety, the process of destruction of chlorophylls (chlorosis) occurs during hypoxia. Qu prevents the process of chlorosis; however, reoxygenation in the leaves is so significant that Qu does not completely prevent the degradation of chlorophylls after hypoxia.
It is interesting to note that treatment with Qu before and after hypoxia leads to a decrease in the content of Chl a and Chl b in the leaves of the wheat variety Zolotaya compared to control. It can be assumed that, in the Zolotaya variety, there is a different set of non-enzymatic antioxidants, in contrast to the Orenburgskaya 22 variety, which actively protects green pigments from destruction during hypoxia. The addition of Qu competes with other low-molecular-weight metabolites, and, as a result, an increase in the process of chlorosis is observed.
2.4. Content ROS
Abiotic and biotic stress factors induce a reaction in plants, during which the ROS production in cells increases and a series of cascade reactions are triggered to neutralize excess ROS. ROS targets in cells can be various biochemical and physiological reactions, as well as cellular structures, depending on the degree of the damage to which the cell metabolism is rearranged and plants acclimatize to stress conditions or one or another variant of programmed cell death (PCD) is triggered [37,38,39].
The excessive production of ROS during oxidative stress is part of many stressful situations, including hypoxia. In the transition from a normal state to hypoxia, there is an increase in the formation of ROS; plant mitochondria undergo swelling, releasing Ca2+ and cytochrome c. Transmission electron microscopy under hypoxic conditions in wheat roots visualized the presence of H2O2 in the apoplast and in association with the plasma membrane [40]. If, in the control, wheat mitochondria were characterized by an electron-dense matrix, intact membranes, and distinct cristae, then, under the influence of hypoxia, mitochondria are characterized by an increase in volume, a decrease in matrix density, and the disintegration of cristae associated with deep swelling [41]. Under conditions of hypoxic stress, evidence of ROS formation under conditions of low oxygen content was found [42]. The decrease in the ATP content observed during hypoxia increases the likelihood of ROS formation due to the inhibition of the mitochondrial electron transport chain [43].
Our studies have shown that cultivated wheat plants under the action of hypoxia (24 h), when staining the roots of varieties Orenburgskaya 22 and Zolotaya with the ROS marker Carboxy-H2DFF, contain different amounts of ROS production, determined by the intensity of fluorescence. In the roots of Orenburgskaya 22 wheat grown under control conditions, the fluorescence intensity is 1.22 times lower than in the roots of the Zolotaya variety (Figure 3 and Figure 4). Root zones were noted from the most intense fluorescence to its absence. The data obtained show that, during hypoxia, the most intense ROS staining is observed in the areas of the cap and fission. At the same time, compared with the control, the increase in the level of ROS is most observed in the cells of the epidermis and cortex, and, to a lesser extent, in the cells of the central cylinder (Figure 3).
O2 deficiency induces the formation of ROS in both wheat genotypes. But if, in the Zolotaya variety, the amount of ROS increased by only 1.06 times, then, in the Orenburgskaya 22 variety, this increase was 2.69 times. As a result of exposure to hypoxia, the ROS content in the roots of the Orenburgskaya 22 variety exceeded that in the Zolotaya variety by more than 2 times.
Qu significantly reduces the amount of ROS by 1.51 times in the roots of the Orenburgskaya 22 variety and has virtually no effect on the Zolotaya variety. Treatment with Qu, both before and after hypoxia, practically did not change the level of ROS in the roots of the Zolotaya variety. However, pre-treatment with Qu before exposure to hypoxia reduced the production of ROS in the Orenburgskaya 22 variety by 2.45 times and approached almost the level of ROS in the control roots. Although treatment with Qu decreased after hypoxia, it was not as effective as compared to pre-treatment.
2.5. Content H2O2
The H2O2 content in the control shoots of both wheat varieties is close in value (Figure 5). In the roots of the Zolotaya variety, the H2O2 content is slightly higher (1.1 times) than in the roots of the Orenburgskaya 22 variety. Moreover, the H2O2 content in the roots of both wheat varieties exceeds the H2O2 value in the shoots: in the Orenburgskaya 22 variety by 6.26 times, and in the Zolotaya variety—by 7.24 times. The effect of hypoxia leads to an increase in the H2O2 content in both roots and shoots. However, the accumulation of H2O2 in different organs of different wheat genotypes has a different tendency. If, in the roots of the variety Orenburgskaya 22, H2O2 increases only by 1.49 times, then, in the shoots, by 1.64, and, in the Zolotaya variety, in the roots, by 1.15 times and, in the shoots, by 1.08. Qu reduces the H2O2 content only in the roots and shoots of the Orenburgskaya 22 variety; and, in the Zolotaya variety, the added Qu even leads to an increase in H2O2 content. Treatment with Qu before exposure to O2 deficiency on the Orenburgskaya 22 variety resulted in a 1.28-fold decrease in the H2O2 content in roots compared to exposure to hypoxia, and, in seedlings, by 1.23-fold. Treatment with Qu after exposure to hypoxia in seedlings of the Orenburgskaya 22 variety even led to an increase in the accumulation of H2O2 compared to hypoxia by 1.13 times. Treatment of the Zolotaya variety with Qu did not lead to significant changes in the H2O2 content in the roots. It should be noted that treatment of this wheat variety with Qu was accompanied by an increase in the H2O2 content in the shoots by 1.52 times. O2 deficiency in the shoots of the Zolotaya variety was not accompanied by the accumulation of H2O2; however, treatment with Qu before and after hypoxia led to an increase in H2O2.
2.6. Antioxidant System
Various abiotic stresses lead to an overproduction of ROS in plants, which are highly reactive and toxic and cause damage to proteins, lipids, carbohydrates, and DNA, which, ultimately, leads to oxidative stress [44]. The antioxidant system protects plants from damage caused by oxidative stress [38]. The antioxidant system (AOS) includes a complex of enzymes involved in detoxification and the conversion of superoxide ions into peroxide, and then into water, and a complex of low-molecular-weight components. Therefore, the antioxidant activity (AOA) value depends on the extraction method. We used two test systems, which are based on different methods of extraction of the material under study: water and alcohol. (R)-4-[1-Hydroxy-2-(methylamino)ethyl]-benzene-1,2-diol (HMAEB) and 2,2-diphenyl-1-picrylhydrazyl (DPPH) were used as substrates (Table 4).
The AOA value in the wheat variety Orenburgskaya 22 in the roots is 1.09 times higher than in Zolotaya, and, in the shoots of the Zolotaya 22 variety, it is 1.03 times higher than in Orenburgskaya 22 (Table 3). A decrease in O2 levels leads to a decrease in AOA levels in both roots and shoots of both wheat genotypes. However, the decrease in AOA in the Orenburgskaya 22 variety is more significant than in the Zolotaya variety (in roots, by 1.50 and 1.14, respectively, and, in shoots, by 1.55 and 1.1, respectively).
Qu increases AOA in the roots of the Orenburgskaya 22 variety by 1.18 times, and, in the shoots, only by 1.03 times. It is interesting to note that, in the shoots of the Zolotaya variety, Qu reduces AOA by 1.03 times. Pre-treatment of the Orenburgskaya 22 variety with Qu does not protect the roots from hypoxia and AOA remains at the same level as under hypoxia. A slight increase in AOA is observed only in the shoots of this variety. And treatment of the Orenburgskaya 22 variety with Qu after O2 deficiency leads to an even greater drop in AOA. Similar to the Zolotaya variety, treatment with Qu after hypoxia reduces the total level of AOA in both roots and shoots. However, pre-treatment of the Zolotaya variety with Qu leads to an increase in AOA in shoots by 1.13 times.
The ARA value is significantly higher than the AOA, but its changes have the same trend as the AOA. The ARA value in the shoots of the Zolotaya variety is also higher than in the Orenburgskaya 22 variety, and lower in the roots. It should be noted that the differences in the content of the two wheat varieties in ARA values are less significant than AOA. This is probably due to the fact that the amount of low-molecular-weight antioxidants in the Zolotaya variety is higher than in the Orenburgskaya 22 variety, since the determination of ARA uses the alcoholic extraction of plant materials, which promotes the extraction of low-molecular-weight antioxidants, such as polyphenols and flavonoids.
2.6.1. Content Glutathione
Glutathione (GSH) is one of the low-molecular-weight components of AOS involved in H2O2 detoxification [24]. Glutathione is a tripeptide (L-glutamyl-L-cysteinylglycine). The protective effect of GSH is accompanied by its oxidation sulfhydryl group and conversion to glutathione disulfide (GSSG). A high GSH/GSSG ratio and the activity of enzymes associated with GSH metabolism are among the markers of plant resistance to stressors [45].
The GSH content in the roots of the Zolotaya variety (2.43 mM) is 1.87 times higher than in the Orenburgskaya 22 variety (1.32 mM) (Figure 6), and, in the shoots, it is 1.42 times higher (Figure 6). A decrease in the O2 level leads to a sharp increase in the GSH concentration, especially in the shoots of the Zolotaya variety by 7.68 times. At the same time, in the Orenburgskaya variety, the increase in GSH content increases only by 1.21 times. Although the GSH content in the roots of the Orenburgskaya 22 variety increases more significantly than in the shoots (1.76 times), and, in the Zolotaya variety, in the roots, less significantly (2.58 times) compared to the shoots, the total GSH content in the roots of the Zolotaya variety is, nevertheless, higher by 2.75 times.
Qu has a positive effect on the Orenburgskaya 22 variety, especially on the roots: the GSH content increases by 1.77 times. At the same time, in the roots of the Zolotaya variety, Qu inhibits the synthesis of GSH: its content decreases by 1.58 times. Qu has little effect on the GSH content in the shoots of both wheat varieties. Treatment with Qu both before and after hypoxia, in the variety Orenburgskaya 22, increases the GSH content, especially in the roots (before by 1.98 times; after by 1.44 times). If treatment of the roots of the Zolotaya variety with Qu is not as effective as for the Orenburgskaya 22 variety, then this treatment has a negative effect on the shoots: the GSH content decreases (before 1.36 times; after −1.6 times).
2.6.2. Expression of Genes
The antioxidant system protects plants from damage caused by oxidative stress. ROS also influence the expression of a number of genes and, therefore, control many processes such as growth, cell cycle, PCD, abiotic stress responses, pathogen defense, systemic signaling, and development. In this review, we describe the biochemistry of ROS and their sites of production, as well as the antioxidant defense mechanisms that scavenge ROS. Superoxide ion (O2−.) is the most toxic molecule that accumulates in plants as a result of exposure to abiotic stress. Superoxide dismutases (SODs) convert O2-. into H2O2 [21]. Increased SOD activity represents one of the most important protective mechanisms that reduces oxidative damage caused by stress. However, the increased H2O2 content is reactive and toxic and must be removed. The conversion of H2O2 involves a number of enzymes that convert H2O2 into H2O. CAT, PX, and GPX, are among the most active enzymes involved in the neutralization of H2O2 [46].
The expression of the mitochondrial MnSOD gene in the Orenburgskaya 22 variety is higher than in the Zolotaya variety: in the roots, by 2.42 times; in the shoots, it decreased by 1.03 times. (Figure 7). It should be noted that, in the roots of the Orenburgskaya 22 variety, MnSOD activity is 2.12 times higher than in the shoots. In the Zolotaya variety, there is a slight excess of MnSOD activity in the shoots than in the roots (1.1 times). O2 deficiency causes a significant increase in MnSOD activity in both roots and shoots of both wheat varieties. It should be noted that hypoxia stimulates MnSOD activity in the Zolotaya variety (2.92 times in roots; 2.2 times in shoots) more significantly than in the Orenburgskaya 22 variety (1.74 times in roots; 1.95 times in shoots).
Treatment with Qu leads to a significant increase in the level of MnSOD expression in the roots of the Orenburgskaya 22 variety by 2.88 times and, in the shoots, by 2.22 times. However, the changes in expression levels are less significant, especially in roots: only 1.08 times. Pre-treatment with Qu before decreasing the O2 content is accompanied by an increase in MnSOD activity in both the roots and shoots of the Orenburgskaya 22 variety (2.01 and 2.49 times, respectively). And treatment with Qu after exposure to hypoxia is not as effective as pre-treatment. In contrast to the variety Orenburgskaya 22, in the variety Zolotaya, pretreatment is much less significant; moreover, it even leads to a decrease in the level of MnSOD expression, especially in the roots (2.48 times).
In control samples of wheat Orenburgskaya 22, the level of expression of the chloroplast Cu/ZnSOD is higher than in the Zolotaya variety, especially in the roots (2.23 times). It should be noted that the Cu/ZnSOD activity in the shoots of the Orenburgskaya 22 variety is slightly lower than in the roots (1.09 times), and, in the Zolotaya variety, the opposite picture is observed: in the shoots, the Cu/ZnSOD activity is 1.35 times higher than in the roots. A decrease in O2 content is accompanied by an increase in the expression of Cu/ZnSOD; this is especially noticeable for the Zolotaya variety: in the roots, it increases by 5.02 times, and, in the shoots, by 2.64 times.
Qu stimulates the activity of Cu/ZnSOD especially in the roots of the Orenburgskaya 22 variety by 2.96 times. At the same time, in the shoots of the Zolotaya variety, a slight drop in Cu/ZnSOD activity is observed. Treatment with Qu before or after hypoxia induces different expression responses of Cu/ZnSOD in roots and shoots of different wheat genotypes. If, in the Orenburgskaya 22 variety, treatment with Qu leads to the activation of Cu/ZnSOD, especially in the shoots (pathway a, 1.92 times), then, in the Zolotaya variety, under the same conditions, Cu/ZnSOD activity is inhibited in the shoots.
One of the main enzymes involved in the conversion of H2O2 to H2O and O2 is catalase (CAT) [47,48]. Based on the data obtained, it follows that CAT is more active in shoots than in roots in both wheat genotypes: in Orenburgskaya 22 by 4.55 times; in Zolotoy by 1.45 times. It is interesting to note that CAT is most active in the roots of the Zolotaya variety and in the shoots of the Orenburgskaya 22 variety. Hypoxia leads to an increase in activity in the Zolotaya variety in both roots and shoots (1.59 times, and 1.47 times, respectively). If O2 deficiency is not accompanied by changes in the expression of CAT in the shoots of the Orenburgskaya 22 variety, a significant drop in CAT activity by 1.43 times is observed in the roots. Qu causes the activation of the CAT expression in the roots of Orenburgskaya 22 (1.96 times), and, in the Zolotaya variety, the inhibition of CAT activity is observed. In the shoots of both wheat varieties, Qu did not have a significant effect on CAT levels. Pretreatment with Qu leads to a sharp increase in the level of CAT expression in the roots of both wheat varieties, especially in the roots of the Orenburgskaya 22 variety (4.09 times). In shoots of the Zolotaya variety, there is also an increase in CAT activity before and after treatment with Qu, and, in shoots of the Orenburgskaya 22 variety, under the same conditions, CAT activity decreases.
Peroxidase (PX) is also involved in the neutralization of H2O2 [49]. The highest PX activity was observed in the roots of Orenburgskaya 22 compared to the roots of the Zolotaya variety (5.93 times). In shoots, there is no longer such a big difference in the PX activity between varieties (1.85 times). But if, in the roots and shoots of the Orenburgskaya 22 variety, the levels of PX expression are close, then, in the shoots of the Zolotaya variety, the level of PX activity is 3.07 times higher than in the roots. Hypoxia causes a sharp increase in activity in the roots of the Zolotaya variety by 5.53 times. PX activity in the roots of the Zolotaya variety also increases significantly with the addition of Qu (4.08 times). The level of activity during pre-treatment with Qu before reducing the O2 level in the roots of the Zalotaya variety also contributes to the activation of PX. In shoots of the Zolotaya variety, a decrease in PX activity is observed, especially in the case of treatment with Qu after hypoxia by 3.16 times. If O2 deficiency leads to a slight increase in PX activity in the Orenburgskaya 22 variety, then Qu, in all variants, causes a significant decrease in PX activity in both roots and shoots.
Another enzyme involved in the neutralization of H2O2 is glutathion peroxidase (GPX) [50,51]. GPX activity in control samples of wheat variety Orenburgskaya 22 in both roots and shoots is higher than in the Zolotaya variety (1.24 times and 2.20 times, respectively). It is noted that GPX activity is higher in the shoots of Orenburgskaya 22 than in the roots by 1.06 times, and, in the Zolotaya variety, it is higher in the roots, than in escapes at 1.66. O2 deficiency leads to a decrease in GPX activity in all variants. Qu also inhibits GPX activity. Only in the case of treatment with Qu before and after exposure to hypoxia in the shoots of the Zolotaya variety is an increase in GPX activity observed.
Glutathion-S- transferase (GST) responsible for detoxification has approximately the same level of activity in all control samples [52,53]. Changes in the growing conditions for the Orenburgskaya 22 variety practically did not lead to significant changes. A decrease in O2 content significantly stimulated an increase in the activity of GST in the Zolotaya variety: in the roots by 2.78 times; in the shoots by 1.93 times. It is interesting to note that the addition of Qu decreased the level of GST expression in the shoots of the Orenburgskaya 22 variety and increased it in the shoots of the Zolotaya variety.
3. Discussion
Oxygen (O2) is an important element for normal plant development [54]. O2 deficiency resulting from heavy precipitation impairs respiration and other biochemical processes [54]. In addition, a number of other conditions can lead to hypoxia; for example, salt stress can disrupt symplastic connections between cells, resulting in a decrease in cell permeability to O2 [55]
Plants are very plastic and quickly adapt to changing unfavorable environmental conditions. Depending on the mechanisms and speed of adaptation, plants can be divided into varieties tolerant and sensitive to abiotic stress. Hypoxia is one of the most important abiotic stresses. In addition, plants often experience physiological hypoxia in tissues and organs due to limited O2 diffusion or rapid O2 consumption [56].
Hypoxia-tolerant plants tolerate long-term reductions in O2 availability by accelerating shoot growth and thereby increasing O2, or, conversely, by slowing growth while conserving nutrient resources [4]. To survive O2 deficiency, plants use various strategies through biochemical, anatomical, and morphological changes. For example, the distribution of O2 from the aerial parts to the roots is facilitated by the formation of aerenchyma [57,58]. Similarly, the formation of adventitious roots can also improve O2 levels in plants under waterlogged conditions [59]. Meanwhile, balanced ROS production and increased antioxidant activity can improve tolerance to hypoxia and anoxia in plants [60].
Abiotic stresses lead to a decrease in the content of chlorophyll (Chl) and carotenoids, leaf necrosis, and a decrease in metabolic functions in the cell, including photosynthesis [61]. Osmotic stress associated with ion imbalance as well as hypoxia can lead to oxidative damage [12]. The analysis of chlorophyll a and b content is an excellent tool for quantifying the damage to the photosynthetic apparatus caused by abiotic stress [62].
Stress negatively affects photosynthetic electron transfer in PSI and PSII and Chl biosynthesis in plants [63]. Therefore, the photosynthetic apparatus is a sensor of various environmental stresses, which may be responsible for the imbalance of cellular energy due to the modification of the redox status.
All significant changes occurring in the roots and shoots of two wheat genotypes grown under different conditions are presented in diagrams (Figure 8, Figure 9, Figure 10 and Figure 11). Under normal development conditions, the content of Chl a and Chl b in the Orenburgskaya 22 variety is significantly higher than that in the Zolotaya variety by 1.67 and 1.92 times, respectively. It can be assumed that the slowdown in the process of photosynthesis in the Zolotaya variety is due to the slower access of O2 and its absorption compared to the Orenburgskaya 22 variety. From the data in the figure, it can be seen that O2 deficiency leads to a decrease in the content of Chl a and Chl b in the leaves of the wheat variety Orenburgskaya 22, and, in the Zolotaya variety, it even increases. Hypoxia and the associated O2 deficiency turned out to be not critical for the biosynthesis of Chl in the Zolotaya variety, since the Zolotaya variety is adapted to O2 deficiency.
When exposed to various unfavorable stresses, including hypoxia, the level of ROS in plants increases [38]. The accumulation of the fluorescent ROS marker Carboxy-H2DFFDA in the cells and tissues of the roots of wheat seedlings under the influence of oxidative stress induced by hypoxia indicates a disruption of ROS homeostasis. In the variety Orenburgskaya 22, under hypoxia, a significant increase in ROS is observed compared to the variety Zolotaya. In particular, in the Orenburgskaya 22 variety, there is a more significant accumulation of H2O2 both in the roots and in the shoots compared to the Zolotaya variety. Increased ROS production triggers antioxidant defense in wheat. In the process of evolution, plants have developed a powerful antioxidant system to protect against external influences. A decrease in the availability of O2 during hypoxia leads to a decrease in the overall activity of AOA, with the most significant drop in activity noted in the roots of the Orenburgskaya 22 variety, and the least significant drop occurs in the shoots of the Zolotaya variety.
AOS includes both an enzymatic complex and low-molecular-weight antioxidants. The enzyme complex mainly includes SOD, which is divided into different isoforms depending on the metal cofactor [47]. Depending on the cofactor, the localization of SOD is determined [48,49]. The most important isoform of the enzyme is MnSOD, since it is localized in mitochondria, the main sources of ROS.
Depending on the metal interacting with the active site, enzymes can be divided into three types: FeSOD, MnSOD, and Cu/ZnSOD [23]. Different isoforms of SOD with similar functions have different metal cofactors, amino acid sequences, crystal structures, and subcellular localizations, and exhibit a different sensitivity to H2O2 in vitro [64,65]. Cu/ZnSOD, which are mainly located in chloroplasts, cytoplasm, and/or extracellular space, are present in some bacteria and all eukaryotic species [66], while MnSODs are mainly found in plant mitochondria [67,68]. FeSOD are common in prokaryotes, and protozoa, usually localized in chloroplasts and plant cytoplasm [69].
The greatest activity of mitochondrial MnSOD is manifested in the roots of the Orenburgskaya 22 variety. O2 deficiency leads to an increase in the level of MnSOD expression; this is especially noticeable in the roots of the Zolotaya variety. However, the overall level of MnSOD activity remains higher in the Orenburgskaya 22 variety. Under normal growth conditions in the roots and shoots of the Orenburgskaya 22 variety, the level of activity of another SOD, the chloroplast Cu/ZnSOD, exceeds that of the Zolotaya variety. However, under hypoxic conditions, this form of SOD is most activated in the Zolotaya variety, especially in the roots. Consequently, in the Orenburgskaya 22 variety, mitochondrial MnSOD is most responsible for the conversion of the superoxide ion into peroxide under O2 deficiency, and, in the Zolotaya variety, it is the chloroplast Cu/ZnSOD.
Further detoxification associated with the conversion of H2O2 into H2O and free O2 occurs with the help of a number of enzymes, the most important of which is catalase [53,54]. It should be noted that catalase activity depends on the level of H2O2. However, the greatest accumulation of H2O2 occurs in the roots of the Orenburgskaya 22 variety, but, at the same time, the activity of CAT decreases. Although the H2O2 content in the roots of the Zolotaya variety increases slightly under hypoxia, the expression of the CAT gene has the greatest activity. Another enzyme involved in the detoxification of H2O2-PX also does not show an increase in activity in the Orenburgskaya 22 variety under hypoxia, in contrast to the Zolotaya variety, in which, especially in the roots, the activity of PX increases sharply.
Under stressful circumstances, when ROS accumulate in plants and the enzymatic AOS is unable to neutralize excess ROS, low-molecular-weight antioxidants are activated in plants. One of the most important antioxidants is GSH [21]. The main place of its localization is chloroplasts. GSH is often used as a marker of plant resistance to stressors [45]. In the roots, the GSH content of the Zolotaya variety is almost two times higher than that of the Orenburgskaya 22 variety. As a result of a decrease in O2 levels, an increase in GSH content is observed in all wheat genotypes, both in shoots and roots. But if the increase in GSH in the Orenburgskaya 22 variety is not so significant, then, in the roots of the Zolotaya variety, the GSH increase occurs more than seven times. Such a high GSH content in the Zolotaya variety may be due to the fact that the functioning of chloroplasts plays a special role in the Zolotaya variety under O2 deficiency. This assumption is also confirmed by the special activity of the chloroplast Cu/ZnSOD under hypoxic conditions. One of the evidence of the special role of GSH in the Zolotaya variety under hypoxia is the activation of GST-glutathione-S-transferase, an enzyme involved in detoxification together with GSH [58,59].
Using cytological analysis, different types of changes in the structure of the cytoplasm in root cells of two wheat genotypes were identified. In most Zolotaya wheat cells, under hypoxia, giant vacuoles formed around the nucleus. In cells of the Orenburgskaya 22 variety, cells with irregularly shaped vacuoles, randomly located throughout the cytoplasm, were observed. Different changes in the structure of the cytoplasm indicate different methods of protection against O2 deficiency. The formation of giant vacuoles probably contributes to a better adaptation to hypoxia in the Zolotaya variety compared to the Orenburgskaya 22 variety.
The greatest changes occur in the root cells of the Zolotaya variety during pretreatment with Qu (path A). These changes are associated with the formation of a fine-grained structure of the cytoplasm. Individual cells with a similar structure are also found in the variety Orenburgskaya 22. There are significantly more such cells in Orenburgskaya 22 when seedlings are treated with Qu after hypoxia.
In stressful factors, phytoprotectors are used that protect plants and mitigate the effects of stress [70]. These metabolites include phenolic compounds, one of which is Qu. Qu is a flavonoid that plays an important role in maintaining a balanced concentration of ROS in cells and in enhancing physiological functions, providing tolerance to biotic and abiotic stresses. Qu reduces the level of H2O2, and absorbs ROS, inhibiting their aggregation. The antioxidant effect of Qu was confirmed in studies by [71], in which various plant species were subjected to paraquat stress, where Qu was shown to be an effective protective agent against the harmful effects of ROS on plants. Therefore, this flavonoid has a beneficial effect on plant resistance to oxidative stress due to the inactivation of reactive oxygen and the interaction of ROS with the electron transport of chloroplasts and mitochondria [33].
The addition of exogenous Qu to the Orenburgskaya 22 variety had a beneficial effect on both morphometric parameters and Chls content (Figure 9). Moreover, a decrease in ROS and H2O2 levels was noted. The total AOA increased, and MnSOD and Cu/ZnSOD activities also increased, especially in roots. But, at the same time, the inhibition of the activity of enzymes involved in the neutralization of H2O2 was observed. One can guess that exogenous Qu activates SOD enzymes itself and actively participates in the neutralization of H2O2, inhibiting enzyme activity, participating in this process.
Unlike the Orenburgskaya 22 variety, treatment with Qu on the Zolotaya variety does not have a noticeable effect on morphometric parameters and Chls content. Moreover, a decrease in AOA and an increase in H2O2 content were noted. In addition, the content of the important AOS component for the Zolotoy variety, GSH, decreased slightly in the roots, while the activity of the MnSOD and Cu/ZnSOD genes remained virtually unchanged or even decreased. It should be noted that, in the roots of the Zolotaya variety, treatment with Qu significantly increased the activity of PX. It can be assumed that, in the Zolotaya variety, there is competition between endogenous GSH and exogenous Qu. As a result of this, low-molecular antioxidants were excluded from the process of H2O2 neutralization, which led to a slight increase in the H2O2 content.
Pre-treatment with Qu before the negative impact of hypoxia on the Orenburgskaya 22 variety has a positive effect (Figure 10). Although, in comparison with the sample of wheat treated with Qu, there is a decrease in morphometric parameters with further hypoxia, but, in comparison with the sample after exposure to hypoxia (without pre-treatment with Qu), the shoot height and root length of the Orenburgskaya 22 variety are higher. The chlorophyll content in shoots of Orenburgskaya 22 does not decrease with O2 deficiency, which also indicates the protective mechanism of Qu. It should be noted that pre-treatment with Qu helps to reduce ROS compared to hypoxia; however, compared to the control, H2O2 accumulates in the shoots of the Orenburgskaya 22 variety. The total AOA decreases, especially in the roots, and pretreatment with Qu does not improve the situation. Under these conditions, in the roots of the Orenburgskaya 22 variety, the activities of MnSOD and Cu/ZnSOD, as well as enzymes involved in the neutralization of H2O2, except for CAT, are significantly reduced. However, it should be noted that the GSH content simultaneously increases. It is interesting to note that a different picture is observed in the shoots: the activity of MnSOD and Cu/ZnSOD and the activity of PX and GPX increase. Thus, it can be assumed that pre-treatment with Qu on the Orenburgskaya 22 variety has a positive protective effect mainly on the development of shoots and changes the defense mechanism in the roots, placing the main emphasis on GSH.
Pre-treatment with Qu before hypoxia in the Zolotaya variety has its own characteristics. This treatment does not lead to the accumulation of ROS; the H2O2 content also does not increase in the roots, only in the shoots, while the chlorophyll content decreases. Under these conditions, in the Zolotaya variety, as well as in the Orenburgskaya 22 variety, the activity of MnSOD and Cu/ZnSOD, as well as enzymes involved in the neutralization of H2O2, with the exception of CAT, is significantly reduced. At the same time, the GSH content increases significantly. Thus, we can conclude that Qu does not have a positive effect on the Zolotaya variety, and hypoxia even helps to restore the normal development of the Zolotaya variety.
The process of plant reoxygenation—recovery from hypoxia—is also a stress state in plants [7]. During this period, plants experience oxidative stress, associated with excess O2, resulting in cellular damage. Depending on the duration of the reoxygenation process, when the water level slowly decreases, in the case of the poor adaptation of the plant to the reoxygenation process, especially at an early stage of development, cellular damage can be significant and can lead to death. To facilitate the recovery of wheat after hypoxia, we used the Qu treatment (Figure 11).
Treatment with Qu after hypoxia promotes root elongation and an increase in shoot height in the Orenburgskaya 22 variety, as well as an increase in Chls content, although there is no complete restoration to the control level. Especially, after stress, treatment with Qu effectively affects the shoots of the Orenburgskaya 22 variety. Against the background of the inactivation of redox processes in the roots, these processes are significantly activated in the shoots. Perhaps the Orenburgskaya 22 variety requires a longer period to fully recover from hypoxia. But, even based on these indicators, we can talk about the positive effect of treating the Orenburgskaya 22 variety, which is sensitive to O2 deficiency, with Qu.
Treatment of the Zolotaya variety with Qu during reoxygenation gives a different effect. If the morphometric parameters remain practically unchanged, then the Chls content decreases both in comparison with control shoots and with shoots under hypoxia. Moreover, almost all participants in redox processes are inactivated in both shoots and roots. Consequently, this experiment also confirms the conclusion that the Zolotaya variety is a wheat variety with a low level of redox balance; O2 deficiency is the norm for its development and an increase in the activity of oxidative processes leads to significant damage.
Abiotic and biotic stresses cause the degradation of intracellular components through the process of autophagy [72]. Increased ROS generation under stress conditions promotes the induction of autophagy, which attenuates oxidative stress [73], thus representing a regulatory cycle. It was previously established that autophagy is induced in wheat cells of the Orenburgskaya 22 and Zolotaya varieties under stress [74] depending on the degree of damage to the cellular structures, at which a restructuring of cellular metabolism occurs and plants acclimatize to stressful conditions, or one or another variant of PCD is triggered [74,75,76]. Two pathways of plant PCD are known: “apoptosis-like”, the markers of which are DNA breaks, the release of cytochrome c from mitochondria, and the transfer of phosphatidylserine to the outer layer of the membrane; and “vacuolar death”, characterized by the formation of large vacuoles and autophagosomes [77].
O2 deficiency causes an increase in nuclei with DNA breaks in seedling root cells (our article). In the variety Orenburgskaya 22, breaks were found in 11% of root cells, and, in the variety Zolotaya, in 8%. Under hypoxic conditions, the root cells of Orenburgskaya 22 were noticeably larger than those of the Zolotaya variety; cells in the G2 period and prophase predominated. Many binucleated cells were observed, which indicates a violation of cytokinesis; the cytoplasm of these cells was vacuolated. The appearance of DNA breaks in the nuclei of root cells indicates the role of hypoxia as an inducer of cell death along an apoptosis-like pathway. When exposed to hypoxia, phosphatidylserine was detected on the plasma membrane of both wheat varieties, and the cell nuclei are stained with propidium iodide, which indicates their necrotic death.
The immunodetection of cytochrome c revealed the release of cytochrome c from mitochondria into the cytoplasm of cells in both wheat varieties, but, in the Orenburgskaya variety, there were significantly more (22) death cells than in the Zolotaya variety. These indicators indicate the mitochondrial pathway of apoptosis under hypoxia in two wheat genotypes. During hypoxia, giant vacuoles are formed in the Zolotaya variety, which are one of the protective mechanisms against O2 deficiency.
Qu activates protective mechanisms when O2 availability decreases only in the case of the Orenburgskaya 22 variety. Pre-treatment with Qu helps to increase the tolerance of the Orenburgskaya 22 variety. However, under the same conditions, maximum changes in cell structure are observed in the Zolotaya variety.
Thus, the use of Qu to strengthen the protective mechanisms of plants against the effects of abiotic stress is possible only after a preliminary comprehensive study of its effect on the plant.
4. Materials and Methods
4.1. Plants
Two wheat varieties Orenburgskaya 22 (Triticum aestivum L.) (2n = 42) and Zolotaya (Triticum durum Desf.) (2n = 28) were developed by the Orenburg Research Institute of Agriculture of the Steppe Ecological Detachment (Federal Scientific Center of the Russian Academy of Sciences, Orenburg, Russia). Seedlings were grown at 24 °C under a 10 h light/14 h dark photoperiod and fluorescent lamps (5000 lx). The effect of hypoxia and treatment with 0.03% Qu on the antioxidant system of two wheat varieties was studied. In an experiment on wheat seedlings, a Qu solution was used. Plants were grown in rolls [78] according to the scheme (Figure 1). The addition of Qu on wheat before (pathway A) or after stress (pathway B) allowed us to determine the protective properties of Qu for the antioxidant system. The study was carried out on six-day-old seedlings at Stage 1: Leaf development according to the BBCH system.
4.2. Chlorophyll Content Analysis
Chlorophyll was extracted using 80% acetone extraction [79]. Chlorophyll levels were determined by absorbance values at 665 nm and 649 nm, which were measured on an IMPLEN nanophotometer (IMPLEN, Westlake Village, CA, USA). The content of chlorophyll a and b was determined using the formulae:
where Vml is the total volume of the extract, and Wmg is the plant weight sample.
chl a = [(11.63 × A665) − (2.39 × A649)] × Vml/1000 × Wmg
chl b = [(20.11 × A649) − (5.18 × A665)] × Vml/1000 × Wmg
Data were expressed as mean ± standard deviation (SD; n = 30), and significant differences were defined as p < 0.05. Chlorophyll determination was carried out at least three times.
4.3. Fluorescence Microscopy
To visualize and determine the level of ROS in the cells of root tips (4–5 mm) of six-day-old wheat seedlings, 25–50 nM carboxy-H2DFFDA (Thermo Fisher Scientific, Waltham, MA, USA) was used for 30 min, then washed three times. The samples were analyzed under an Olympus BX51 fluorescence microscope (Olympus corporation, Tokyo, Japan), ×10 objective, wavelength 490 nm. Images were obtained using Color View digital camera (Munster, Germany). ImageJ software (version 1.54i) was used to measure fluorescence intensity.
4.4. Light Microscopy
For 6-day-old seedlings, sections (5 mm) of the root tip were fixed in a 4% solution of paraformaldehyde (Sigma Aldrich, Saint Louis, MO, USA) in PHEM buffer, pH = 6.9 (60 mM PIPES (Sigma Aldrich, USA), 25 mM HEPES (Sigma Aldrich, USA), 10 mM EGTA (Sigma Aldrich, USA), and 2 mM MgCl2 (Sigma Aldrich, USA) for 1.5 h at room temperature. The fixative was washed with PHEM buffer. The samples were incubated 7 min in 0.4 M mannitol containing 4% cellulase (Sigma Aldrich, USA) and 5 mM EGTA, then washed with PBS buffer; after incubation in the enzyme, the roots were transferred to coverslips and separated into individual cells. The prepared preparations were dried in the refrigerator at +4 °C for 24 h and placed in Mowiol U-44 (Hoechst, Germany) with the addition of DAPI (1 μL/1 mL) (4,6-diamidino-2-phenylindole) (Sigma Aldrich, USA). The samples were analyzed under an Olympus BX51 fluorescence microscope (Japan), ×100 objective. Images were obtained using Color View digital camera (Germany). ImageJ software was used to measure fluorescence intensity.
4.5. Biochemical Analysis
Antioxidant activity (AOA) was determined by blocking the oxidation process of a 0.1% aqueous solution of (R)-4-[1-hydroxy-2-(methylamino)ethyl]benzene-1,2-diol (HMAEB). Absorbance was measured at λ = 347 nm [80]. Antiradical activity (ARA) was determined by the method [81] of decrease in color of a 5 × 10⁻⁵ M alcohol solution of 2,2-diphenyl-1-picrylhydrazyl (DPPH). Absorbance was measured at λ = 517 nm. The concentration of peroxide in aqueous solutions of plants was determined by the decrease in color of a 0.02 M KMnO4 solution. Absorbance was measured at λ = 480 nm [82]. The content of glutathione (GSH} in mM was determined by the Elman method by the appearance of color after adding a 0.01 M alcohol solution. Absorbance was measured at λ = 412 nm [83].
4.6. Total RNA Isolation and Gene Expression Analysis
The analysis was carried out using a standard kit for RNA isolation “Extran RNA Synthol” (Russia). RNA was isolated from the roots and shoots of wheat grown under different conditions. cDNAs were synthesized by reverse transcription using standard methods (Syntol, Moscow, Russia). The cDNA concentration was determined spectrophotometrically using an IMPLEN nanophotometer. RT-PCR using SYBR Green I (Syntol) was carried out in a CFX 96 real-time thermal cycler (BioRad, Hercules, CA, USA). Information on the structure of Cu/ZnSOD, MnSOD, PX, GPX, CAT, and GST genes in wheat was obtained from NCBI. Primers for the genes were synthesized by Syntol. The relative level of gene expression was calculated using a calibration curve constructed with PCR products obtained with primers for the GaPDh gene. Each RT-PCR reaction was performed in triplicate.
4.7. Statistical Methods
Statistica 6.0 (version 13.3.721) and statistical software package STATAN-2009 were used for statistical calculations using Student’s t test (R version 4.3.1). Different letters indicate significant differences at p < 0.05. Values are presented as means ± standard deviations of triplicate biological copies, with significant differences at p < 0.05.
5. Conclusions
Under natural conditions, plants are often exposed to various stresses that affect their growth and development. One of the visible symptoms of abiotic stress is impaired seedling development. The greatest morphometric changes are caused by the effect of hypoxia on the Orenburgskaya 22 variety (Triticum aestivum). Using cytological analysis, various types of cytoplasmic changes in root cells under hypoxic conditions were identified. The formation of giant vacuoles during hypoxia in the Zolotaya variety (Triticum durum) is one of the protective mechanisms. Various stress factors lead to an increase in ROS and increased damage to various plant tissues. Increased ROS production under abiotic stress triggers antioxidant defense in wheat. In the Orenburgskaya 22 variety, the most active components of the antioxidant system are MnSOD and Cu/ZnSOD, and, in the Zolotaya variety, GSH. The antioxidant quercetin reduces the formation of ROS. Pre-treatment of wheat seedlings with 0.3% quercetin has a protective effect against O2 deficiency on seedlings of the Orenburgskaya 22 variety, but has a negative effect on seedlings of the Zolotaya variety. Treatment of seedlings of the Orenburgskaya 22 variety with quercetin after exposure to hypoxia helps restore their development. Quercetin is effective and helps protect against oxidative stress for seedlings of the Orenburgskaya 22 variety. Thus, under hypoxia, quercetin has a different effect on two wheat genotypes.
This study may have practical implications for growing wheat in different climatic conditions. However, extensive further research is required on the effect of quercetin on different wheat varieties under different stress conditions.
Author Contributions
L.I.F. designed and performed the experiment, PCR designed and prepared the figures, evaluated the data, and wrote and finalized the manuscript; E.M.L. performed the light and fluorescent microscopy, evaluated the data, and wrote and finalized the manuscript; and N.V.K. performed the light and fluorescent microscopy, evaluated the data, and wrote and finalized the manuscript. All authors have read and agreed to the published version of the manuscript.
Funding
The reported study was supported by FGUM-2022-0003 of the Ministry of Science and Higher Education of the Russian Federation.
Data Availability Statement
Data are contained within the article.
Conflicts of Interest
The authors declare no conflicts of interest.
References
- Cramer, G.R.; Urano, K.; Delrot, S.; Pezzotti, M.; Shinozaki, K. Effects of abiotic stress on plants: A systems biology perspective. BMC Plant Biol. 2011, 11, 163. [Google Scholar] [CrossRef] [PubMed]
- Zhou, W.; Chen, F.; Meng, Y.; Chandrasekaran, U.; Luo, X.; Yang, W.; Shu, K. Plant waterlogging/flooding stress responses: From seed germination to maturation. Plant Physiol. Biochem. 2020, 148, 228–236. [Google Scholar] [CrossRef] [PubMed]
- Loreti, E.; Perata, P. The many facets of hypoxia in plants. Plants 2020, 9, 745. [Google Scholar] [CrossRef] [PubMed]
- Nakamura, M.; Noguchi, K. Tolerant mechanisms to O2 deficiency under submergence conditions in plants. J. Plant Res. 2020, 133, 343–371. [Google Scholar] [CrossRef] [PubMed]
- Considine, M.J.; Diaz-Vivancos, P.; Kerchev, P.; Signorelli, S.; Agudelo-Romero, P.; Gibbs, D.J.; Foyer, C.H. Learning to breathe: Developmental phase transitions in oxygen status. Trends Plant Sci. 2017, 22, 140–153. [Google Scholar] [CrossRef] [PubMed]
- Le Gac, A.L.; Laux, T. Hypoxia is a developmental regulator in plant meristems. Mol. Plant 2019, 12, 1422–1424. [Google Scholar] [CrossRef] [PubMed]
- León, J.; Castillo, M.C.; Gayubas, B. The hypoxia–reoxygenation stress in plants. J. Exp. Bot. 2021, 72, 5841–5856. [Google Scholar] [CrossRef] [PubMed]
- Fukao, T.; Yeung, E.; Bailey-Serres, J. The submergence tolerance regulator SUB1A mediates crosstalk between submergence and drought tolerance in rice. Plant Cell 2011, 23, 412–427. [Google Scholar] [CrossRef]
- Fukao, T.; Yeung, E.; Bailey-Serres, J. The submergence tolerance gene SUB1A delays leaf senescence under prolonged darkness through hormonal regulation in rice. Plant Physiol. 2012, 160, 1795–1807. [Google Scholar] [CrossRef]
- Tamang, B.G.; Fukao, T. Plant adaptation to multiple stresses during submergence and following desubmergence. Int. J. Mol. Sci. 2015, 16, 30164–30180. [Google Scholar] [CrossRef]
- Del Rio, L.A. ROS and RNS in plant physiology: An overview. J. Exp. Bot. 2015, 66, 2827–2837. [Google Scholar] [CrossRef]
- Sharma, A.; Kumar, V.; Shahzad, B.; Ramakrishnan, M.; Sidhu, G.P.S.; Bali, A.S.; Handa, N.; Kapoor, D.; Yadav, P.; Khanna, K. Photosynthetic response of plants under different abiotic stresses: A Review. J. Plant Growth Regul. 2020, 39, 509–531. [Google Scholar] [CrossRef]
- Demidchik, V. Mechanisms of oxidative stress in plants: From classical chemistry to cell biology. Environ. Exp. Bot. 2015, 109, 212–228. [Google Scholar] [CrossRef]
- Raja, V.; Majeed, U.; Kang, H.; Andrabi, K.I.; John, R. Abiotic stress: Interplay between ROS, hormones and MAPKs. Environ. Exp. Bot. 2017, 137, 142–157. [Google Scholar] [CrossRef]
- Xu, L.; Pan, R.; Zhang, W. Membrane lipids are involved in plant response to oxygen deprivation. Plant Signal. Behav. 2020, 15, 1771938. [Google Scholar] [CrossRef]
- Lindberg, S.; Premkumar, A.; Rasmussen, U.; Schulz, A.; Lager, I. Phospholipases AtPLDζ1 and AtPLDζ2 function differently in hypoxia. Physiol. Plant. 2018, 162, 98–108. [Google Scholar] [CrossRef]
- Xu, L.; Pan, R.; Zhou, M.; Xu, Y.; Zhang, W. Lipid remodelling plays an important role in wheat (Triticum aestivum) hypoxia stress. Funct. Plant Biol. 2019, 47, 58–66. [Google Scholar] [CrossRef]
- Gill, S.S.; Tuteja, N. Reactive oxygen species and antioxidant machinery in abiotic stress tolerance in crop plants. Plant Physiol. Biochem. 2010, 48, 909–930. [Google Scholar] [CrossRef]
- Parihar, P.; Singh, S.; Singh, R.; Singh, V.P.; Prasad, S.M. Effect of salinity stress on plants and its tolerance strategies: A review. Environ. Sci. Pollut. Res. 2015, 22, 4056–4075. [Google Scholar] [CrossRef]
- Navrot, N.; Finnie, C.; Svensson, B.; Hägglund, P. Plant redox proteomics. J. Proteom. 2011, 12, 1450–1462. [Google Scholar] [CrossRef]
- Averill-Bates, D.A. Antioxidant glutathione. Vitam. Horm. 2023, 121, 109–141. [Google Scholar]
- Kiani, R.; Arzani, A.; Maibody, S.A.M.M. Polyphenols, Flavonoids, and Antioxidant Activity Involved in Salt Tolerance in Wheat, Aegilops cylindrica and Their Amphidiploids. Front. Plant Sci. 2021, 12, 646221. [Google Scholar] [CrossRef]
- Sirin, S.; Aslım, B. Determination of antioxidant capacity, phenolic acid composition and antiproliferative effect associated with phenylalanine ammonia lyase (PAL) activity in some plants naturally growing under salt stress. Med. Chem. Res. 2018, 28, 229–238. [Google Scholar] [CrossRef]
- Løvdal, T.; Olsen, K.M.; Slimestad, R.; Verheul, M.; Lillo, C. Synergetic effects of nitrogen depletion, temperature, and light on the content of phenolic compounds and gene expression in leaves of tomato. Phytochemistry 2010, 71, 605–613. [Google Scholar] [CrossRef]
- Singh, P.; Arif, Y.; Bajguz, A.; Hayat, S. The role of quercetin in plants. Plant Physiol. Biochem. 2021, 166, 10–19. [Google Scholar] [CrossRef]
- Agati, G.; Azzarello, E.; Pollastri, S.; Tattini, M. Flavonoids as antioxidants in plants: Location and functional significance. Plant Sci. 2012, 196, 67–76. [Google Scholar] [CrossRef]
- Dobrikova, A.G.; Apostolova, E.L. Damage and protection of the photosynthetic apparatus from UV-B radiation. II. Effect of quercetin at different pH. J. Plant Physiol. 2015, 184, 98–105. [Google Scholar]
- Caretto, S.; Linsalata, V.; Colella, G.; Mita, G.; Lattanzio, V. Carbon fluxes between primary metabolism and phenolic pathway in plant tissues under stress. Int. J. Mol. Sci. 2015, 16, 26378–26394. [Google Scholar] [CrossRef]
- Pollastri, S.; Tattini, M. Flavonols: Old compound for old roles. Ann. Bot. 2011, 108, 1225–1233. [Google Scholar]
- Parvin, K.; Hasanuzzaman, M.; Bhuyan, M.H.M.B.; Mohsin, S.M.; Fujita, M. Quercetin mediated salt tolerance in tomato through the enhancement of plant antioxidant defense and glyoxalase systems. Plants 2019, 8, 247. [Google Scholar] [CrossRef]
- Yang, J.; Zhang, L.; Jiang, L.; Zhan, Y.G.; Fan, G.Z. Quercetin alleviates seed germination and growth inhibition in Apocynum venetum and Apocynum pictum under mannitol-induced osmotic stress. Plant Physiol. Biochem. 2021, 159, 268–276. [Google Scholar] [CrossRef]
- Manzoor, M.F.; Hussain, A.; Sameen, A.; Sahar, A.; Khan, S.; Siddique, R.; Aadil, R.M.; Xu, B. Novel extraction, rapid assessment and bioavailability improvement of quercetin: A review. Ultrason. Sonochem. 2021, 78, 105686. [Google Scholar] [CrossRef]
- Jańczak-Pieniążek, M.; Migut, D.; Piechowiak, T.; Buczek, J.; Balawejder, M. The Effect of Exogenous Application of Quercetin Derivative Solutions on the Course of Physiological and Biochemical Processes in Wheat Seedlings. Int. J. Mol. Sci. 2021, 22, 6882. [Google Scholar] [CrossRef]
- Janczak-Pieniazek, M.; Migut, D.; Piechowiak, T.; Balawejder, M. Assessment of the Impact of the Application of a Quercetin—Copper Complex on the Course of Physiological and Biochemical Processes in Wheat Plants (Triticum aestivum L.) Growing under Saline Conditions. Cells 2022, 11, 1141. [Google Scholar] [CrossRef]
- Gururani, M.A.; Mohanta, T.K.; Bae, H. Current Understanding of the Interplay between Phytohormones and Photosynthesis under Environmental Stress. Int. J. Mol. Sci. 2015, 16, 19055–19085. [Google Scholar] [CrossRef]
- Kalaji, H.M.; Jajoo, A.; Oukarroum, A.; Brestic, M.; Zivcak, M.; Samborska, I.A.; Cetner, M.D.; Łukasik, I.; Goltsev, V.; Ladle, R.J. Chlorophyll a fluorescence as a tool to monitor physiological status of plants under abiotic stress conditions. Acta Physiol. Plant. 2016, 38, 102. [Google Scholar] [CrossRef]
- Żabka, A.; Winnicki, K.; Polit, J.T.; Maszewski, J. Sanguinarine-induced oxidative stress and apoptosis-like programmed cell death(AL-PCD) in root meristem cells of Allium cepa. Plant Physiol. Biochem. 2017, 112, 193–206. [Google Scholar] [CrossRef]
- Kerchev, P.I.; Van Breusegem, F. Improving oxidative stress resilience in plants. Plant J. 2022, 109, 359–372. [Google Scholar] [CrossRef]
- Mittler, R.; Zandalinas, S.I.; Fichman, Y.; Van Breusegem, F. Reactive oxygen species signalling in plant stress responses. Nat. Rev. Mol. Cell Biol. 2022, 23, 663–679. [Google Scholar] [CrossRef]
- Gill, S.S.; Anjum, N.A.; Gill, R.; Yadav, S.; Hasanuzzaman, M.; Fujita, M.; Mishra, P.; Sabat, S.C.; Tuteja, N. Superoxide dismutase—Mentor of abiotic stress tolerance in crop plants. Environ. Sci. Pollut. Res. 2015, 22, 10375–10394. [Google Scholar] [CrossRef]
- Zulfiqar, F.; Ashraf, M. Antioxidants as modulators of arsenic-induced oxidative stress tolerance in plants. J. Hazard. Mater. 2022, 427, 127891. [Google Scholar] [CrossRef]
- You, J.; Chan, Z. ROS regulation during abiotic stress responses in crop plants. Front. Plant Sci. 2015, 6, 1092. [Google Scholar] [CrossRef]
- Okoye, C.N.; Koren, S.A.; Wojtovich, A.P. Mitochondrial complex IROS production and redox signaling in hypoxia. Redox Biol. 2023, 67, 102926. [Google Scholar] [CrossRef]
- Ren, L.; Wang, M.-R.; Wang, Q.-C. ROS-induced oxidative stress in plant cryopreservation: Occurrence and alleviation. Planta 2021, 254, 124. [Google Scholar] [CrossRef]
- Liu, T.; Sun, L.; Zhang, Y.; Wang, Y.; Zheng, J. Imbalanced GSH/ROS and sequential cell death. J. Biochem. Mol. Toxicol. 2022, 36, e22942. [Google Scholar] [CrossRef]
- Feng, K.; Yu, J.; Cheng, Y.; Ruan, M.; Wang, R.; Ye, Q.; Zhou, G.; Li, Z.; Yao, Z.; Yang, Y.; et al. The SOD gene family in tomato: Identification, phylogenetic relationships, and expression patterns. Front. Plant Sci. 2016, 7, 1279. [Google Scholar] [CrossRef]
- Anjum, N.A.; Sharma, P.; Gill, S.S.; Hasanuzzaman, M.; Khan, E.A.; Kachhap, K.; Mohamed, A.A.; Thangavel, P.; Devi, G.D.; Vasudhevan, P.; et al. Catalase and ascorbate peroxidase-representative H2O2-detoxifying heme enzymes in plants. Environ. Sci. Pollut. Res. 2016, 23, 19002–19029. [Google Scholar] [CrossRef]
- Pan, L.; Luo, Y.; Wang, J.; Li, X.; Tang, B.; Yang, H.; Hou, X.; Liu, F.; Zou, X. Evolution and functional diversification of catalase genes in the green lineage. BMC Genom. 2022, 23, 411. [Google Scholar] [CrossRef]
- Sellami, K.; Couvert, A.; Nasrallah, N.; Maachi, R.; Abouseoud, M.; Amrane, A. Peroxidase enzymes as green catalysts for bioremediation and biotechnological applications. Sci. Total Environ. 2022, 806, 150500. [Google Scholar] [CrossRef]
- Bela, K.; Horváth, E.; Gallé, Á.; Szabados, L.; Tari, I.; Csiszár, J. Plant glutathione peroxidases: Emerging role of the antioxidant enzymes in plant development and stress responses. J. Plant Physiol. 2015, 176, 192–201. [Google Scholar] [CrossRef]
- Lian, Z.; Zhang, J.; Hao, Z.; Zhu, L.; Liu, Y.; Fang, H.; Lu, Y.; Li, X.; Shi, J.; Chen, J.; et al. The Glutathione Peroxidase Gene Family in Nitraria sibirica: Genome-Wide Identification, Classification, and Gene Expression Analysis under Stress Conditions. Genes 2023, 14, 950. [Google Scholar] [CrossRef]
- Meng, H.; Zhao, J.; Yang, Y.; Diao, K.; Zheng, G.; Li, T.; Dai, X.; Li, J. PeGSTU58, a Glutathione S-Transferase from Populus euphratica, Enhances Salt and Drought Stress Tolerance in Transgenic Arabidopsis. Int. J. Mol. Sci. 2023, 24, 9354. [Google Scholar] [CrossRef]
- Zou, Y.; Cao, S.; Zhao, B.; Sun, Z.; Liu, L.; Ji, M. Increase in glutathione S-transferase activity and antioxidant damage ability drive resistance to bensulfuron-methyl in Sagittaria trifolia. Plant Physiol. Biochem. 2022, 190, 240–247. [Google Scholar] [CrossRef]
- Weits, D.A.; van Dongen, J.T.; Licausi, F. Molecular oxygen as a signaling component in plant development. New Phytol. 2021, 229, 24–35. [Google Scholar] [CrossRef]
- Posso, D.A.; Borella, J.; Reissig, G.N.; Bacarin, M.A. Root flooding-induced changes in the dynamic dissipation of the photosynthetic energy of common bean plants. Acta Physiol. Plant. 2018, 40, 212–229. [Google Scholar] [CrossRef]
- Kapoor, D.; Singh, S.; Kumar, V.; Romero, R.; Prasad, R.; Singh, J. Antioxidant enzymes regulation in plants in reference to reactive oxygen species (ROS) and reactive nitrogen species (RNS). Plant Gene 2019, 19, 100182. [Google Scholar] [CrossRef]
- Sauter, M. Root responses to flooding. Curr. Opin. Plant Biol. 2013, 16, 282–286. [Google Scholar] [CrossRef]
- Kordyum, E.L.; Shevchenko, G.V.; Brykov, V.O. Cytoskeleton during aerenchyma formation in plants. Cell Biol. Int. 2019, 43, 991–998. [Google Scholar] [CrossRef]
- Yamauchi, T.; Tanaka, A.; Mori, H.; Takamure, I.; Kato, K.; Nakazono, M. Ethylene-dependent aerenchyma formation in adventitious roots is regulated differently in rice and maize. Plant Cell Environ. 2016, 39, 2145–2157. [Google Scholar] [CrossRef]
- Schmidt, R.R.; Weits, D.A.; Feulner, C.F.J.; van Dongen, J.T.; Sensing, O. Integrative stress signaling in plants. Plant Physiol. 2018, 176, 1131–1142. [Google Scholar] [CrossRef]
- Choudhury, F.K.; Rivero, R.M.; Blumwald, E.; Mittler, R. Reactive oxygen species, abiotic stress and stress combination. Plant J. 2017, 90, 856–867. [Google Scholar] [CrossRef]
- Li, X.; Zhang, W.; Niu, D.; Liu, X. Effects of abiotic stress on chlorophyll metabolism. Plant Sci. 2024, 342, 112030. [Google Scholar] [CrossRef]
- Abdeshahian, M.; Nabipour, M.; Meskarbashee, M. Chlorophyll fluorescence as criterion for the diagnosis salt stress in wheat (Triticum aestivum) plants. World Acad. Sci. Eng. Technol. 2010, 71, 569–571. [Google Scholar]
- Yan, J.J.; Zhang, L.; Wang, R.Q.; Xie, B.; Li, X.; Chen, R.-L.; Guo, L.-X.; Xie, B.-G. The sequence characteristics and expression models reveal superoxide dismutase involved in cold response and fruiting body development in Volvariella volvacea. Int. J. Mol. Sci. 2016, 17, 34. [Google Scholar] [CrossRef]
- Abreu, I.A.; Cabelli, D.E. Superoxide dismutases-a review of the metal-associated mechanistic variations. Biochim. Biophys. Acta (BBA) Proteins Proteom. 2019, 1804, 263–274. [Google Scholar] [CrossRef]
- Arora, D.; Bhatla, S.C. Nitric oxide triggers a concentration-dependent differential modulation of superoxide dismutase (FeSOD and Cu/ZnSOD) activity in sunflower seedling roots and cotyledons as an early and long distance signaling response to NaCl stress. Plant Signal. Behav. 2015, 10, e1071753. [Google Scholar] [CrossRef]
- Das, K.; Roychoudhury, A. Reactive oxygen species (ROS) and response of antioxidants as ROS-scavengers during environmental stress in plants. Front. Environ. Sci. 2014, 2, 53. [Google Scholar] [CrossRef]
- Pilon, M.; Ravet, K.; Tapken, W. The biogenesis and physiological function of chloroplast superoxide dismutases. Biochim. Biophys. Acta (BBA) Bioenerg. 2011, 180, 989–998. [Google Scholar] [CrossRef]
- Feng, X.; Lai, Z.; Lin, Y.; Lai, G.; Lian, C. Genome-wide identification and characterization of the superoxide dismutase gene family in Musa acuminata cv. Tianbaojiao (AAA group). BMC Genom. 2015, 16, 823. [Google Scholar] [CrossRef]
- Mehta, P.; Jajoo, A.; Mathur, S.; Bharti, S. Chlorophyll a fluorescence study revealing effects of high salt stress on Photosystem II in wheat leaves. Plant Physiol. Biochem. 2010, 48, 16–20. [Google Scholar] [CrossRef]
- Rahman, A.; Nahar, K.; Mahmud, J.; Mirza, H.; Hossain, M.; Fujita, M. Salt Stress Tolerance in Rice: Emerging Role of Exogenous Phytoprotectants. In Advances in International Rice Research; Li, J., Ed.; IntechOpen: London, UK, 2017. [Google Scholar]
- Li, F.; Vierstra, R.D. Autophagy: A multifaceted intracellular system for bulk and selective recycling. Trends Plant Sci. 2012, 17, 526–537. [Google Scholar] [CrossRef]
- Pérez-Pérez, M.E.; Lemaire, S.D.; Crespo, J.L. Reactive oxygen species and autophagy in plants and algae. Plant Physiol. 2012, 160, 156–164. [Google Scholar] [CrossRef]
- Fedoreyeva, L.I.; Lazareva, E.M.; Shelepova, O.V.; Baranova, E.N.; Kononenko, N.V. Salt induced autophagy and programmed cell death in wheat. Agronomy 2022, 12, 1909. [Google Scholar] [CrossRef]
- Gigante, A.D.; Young, L.T.; Yatham, L.N.; Andreazza, A.C.; Nery, F.G.; Grinberg, L.T.; Heinsen, H.; Lafer, B. Morphometric post-mortem studies in bipolar disorder: Possible association with oxidative stress and apoptosis. Int. J. Neuropsychopharmacol. 2011, 14, 1075–1089. [Google Scholar] [CrossRef]
- Locato, V.; De Gara, L. Programmed Cell Death in Plants. Methods Mol. Biol. 2018, 1743, 1–48. [Google Scholar]
- Van Doorn, W.G.; Beers, E.P.; Dangl, J.L.; Franklin-Tong, V.E.; Gallois, P.; Hara-Nishimura, I.; Jones, A.M.; Kawai-Yamada, M.; Lam, E.; Mundy, J.; et al. Morphological classification of plant cell deaths. Cell Death Differ. 2011, 18, 1241–1246. [Google Scholar] [CrossRef]
- Kononenko, N.V.; Baranova, E.N.; Dilovarova, T.A.; Akanov, E.N.; Fedoreyeva, L.I. Oxidative Damage to Various Root Tissues and Aerial Parts of Durum and Soft Wheat Seedlings during Chloride Salinity. Agriculture 2020, 10, 55. [Google Scholar] [CrossRef]
- Hu, X.; Tanaka, A.; Tanaka, R. Simple extraction methods that prevent the artifactual conversion of chlorophyll to chlorophyllide during pigment isolation from leaf samples. Plant Methods 2013, 9, 19. [Google Scholar]
- Rahini, D.; Anuradha, R. In vitro antioxidant activity of Artabotrys hexapetallus. Res. J. Pharm. Biol. Chem. Sci. 2014, 5, 396–405. [Google Scholar]
- Adesanwo, J.K.; Makinde, O.O.; Obafemi, C.A. Phytochemical analysis and antioxidant activity of methanol extract and betulinic acid isolated from the roots of Tetracera potatoria. J. Pharm. Res. 2013, 6, 903–907. [Google Scholar] [CrossRef]
- Zalutskaya, Z.M.; Skryabina, U.S.; Ermilova, E.V. Hydrogen peroxide generation and transcription regulation of antioxidant enzyme expression Chlamydomonas reinbardtii under hypothermia. Plant Physiol. 2019, 66, 104–111. [Google Scholar]
- Ellman, G.L. Tissue sulfhydryl groups. Arch. Biochem. Biophys. 1959, 82, 70–81. [Google Scholar] [CrossRef] [PubMed]
Figure 1.
Network for treating two wheat genotypes with quercetin.

Figure 2.
Cells with different types of altered cytoplasm in the roots of wheat varieties Orenburgskaya 22 and Zolotaya, grown under different conditions. Below are nuclei-stained with DAPI. Bar 10 μm.
Figure 2.
Cells with different types of altered cytoplasm in the roots of wheat varieties Orenburgskaya 22 and Zolotaya, grown under different conditions. Below are nuclei-stained with DAPI. Bar 10 μm.


Figure 3.
Distribution of ROS+ and ROS—cells in the zones of six-day seedling of wheat roots Orenburgskaya 22 and Zolotaya: A, B—control; C, D—hypoxia: E, F—Qu; G, H—Qu+hypoxia; and I, J—hypoxia+Qu. Bar 400 µm.
Figure 3.
Distribution of ROS+ and ROS—cells in the zones of six-day seedling of wheat roots Orenburgskaya 22 and Zolotaya: A, B—control; C, D—hypoxia: E, F—Qu; G, H—Qu+hypoxia; and I, J—hypoxia+Qu. Bar 400 µm.


Figure 4.
The intensity of ROS fluorescence under the influence of stress factors in wheat: 1—variety Orenburgskaya 22; and 2—variety Zolotaya. a–e-indicate significant difference were determined (p < 0.05).
Figure 4.
The intensity of ROS fluorescence under the influence of stress factors in wheat: 1—variety Orenburgskaya 22; and 2—variety Zolotaya. a–e-indicate significant difference were determined (p < 0.05).

Figure 5.
H2O2 content in roots and shoots in six-day seedlings of Orenburgskaya 22 variety (1) and Zolotaya variety (2). a–e-indicate significant difference were determined (p < 0.05).
Figure 5.
H2O2 content in roots and shoots in six-day seedlings of Orenburgskaya 22 variety (1) and Zolotaya variety (2). a–e-indicate significant difference were determined (p < 0.05).

Figure 6.
GSH content in roots and shoots in six-day seedlings of Orenburgskaya 22 variety (1) and Zolotaya variety (2). a–e-indicate significant difference were determined (p < 0.05).
Figure 6.
GSH content in roots and shoots in six-day seedlings of Orenburgskaya 22 variety (1) and Zolotaya variety (2). a–e-indicate significant difference were determined (p < 0.05).

Figure 7.
Expression of MnSOD, Cu/ZnSOD, GST, GPX, CAT, and PX genes in six-day seedlings of wheat varieties Orenburgskaya 22 (1, 3) and Zolotaya (2, 4) under the influence of various factors in (1,2)—roots, (3,4)—shoots. a–e-indicate significant difference were determined (p < 0.05).
Figure 7.
Expression of MnSOD, Cu/ZnSOD, GST, GPX, CAT, and PX genes in six-day seedlings of wheat varieties Orenburgskaya 22 (1, 3) and Zolotaya (2, 4) under the influence of various factors in (1,2)—roots, (3,4)—shoots. a–e-indicate significant difference were determined (p < 0.05).


Figure 8.
Diagram of the total changes occurring in wheat of the Orenburgskaya 22 variety and the Zolotaya variety under the influence of hypoxia relative to the control.
Figure 8.
Diagram of the total changes occurring in wheat of the Orenburgskaya 22 variety and the Zolotaya variety under the influence of hypoxia relative to the control.

Figure 9.
Diagram of the total changes occurring in wheat of the Orenburgskaya 22 variety and the Zolotaya variety under the influence of Qu relative to the control.
Figure 9.
Diagram of the total changes occurring in wheat of the Orenburgskaya 22 variety and the Zolotaya variety under the influence of Qu relative to the control.

Figure 10.
Diagram of the total changes occurring in wheat of the Orenburgskaya 22 variety and the Zolotaya variety under the influence of hypoxia relative to the Qu.
Figure 10.
Diagram of the total changes occurring in wheat of the Orenburgskaya 22 variety and the Zolotaya variety under the influence of hypoxia relative to the Qu.

Figure 11.
Diagram of the total changes occurring in wheat of the Orenburgskaya 22 variety and the Zolotaya variety under the influence of Qu relative to the hypoxia.
Figure 11.
Diagram of the total changes occurring in wheat of the Orenburgskaya 22 variety and the Zolotaya variety under the influence of Qu relative to the hypoxia.


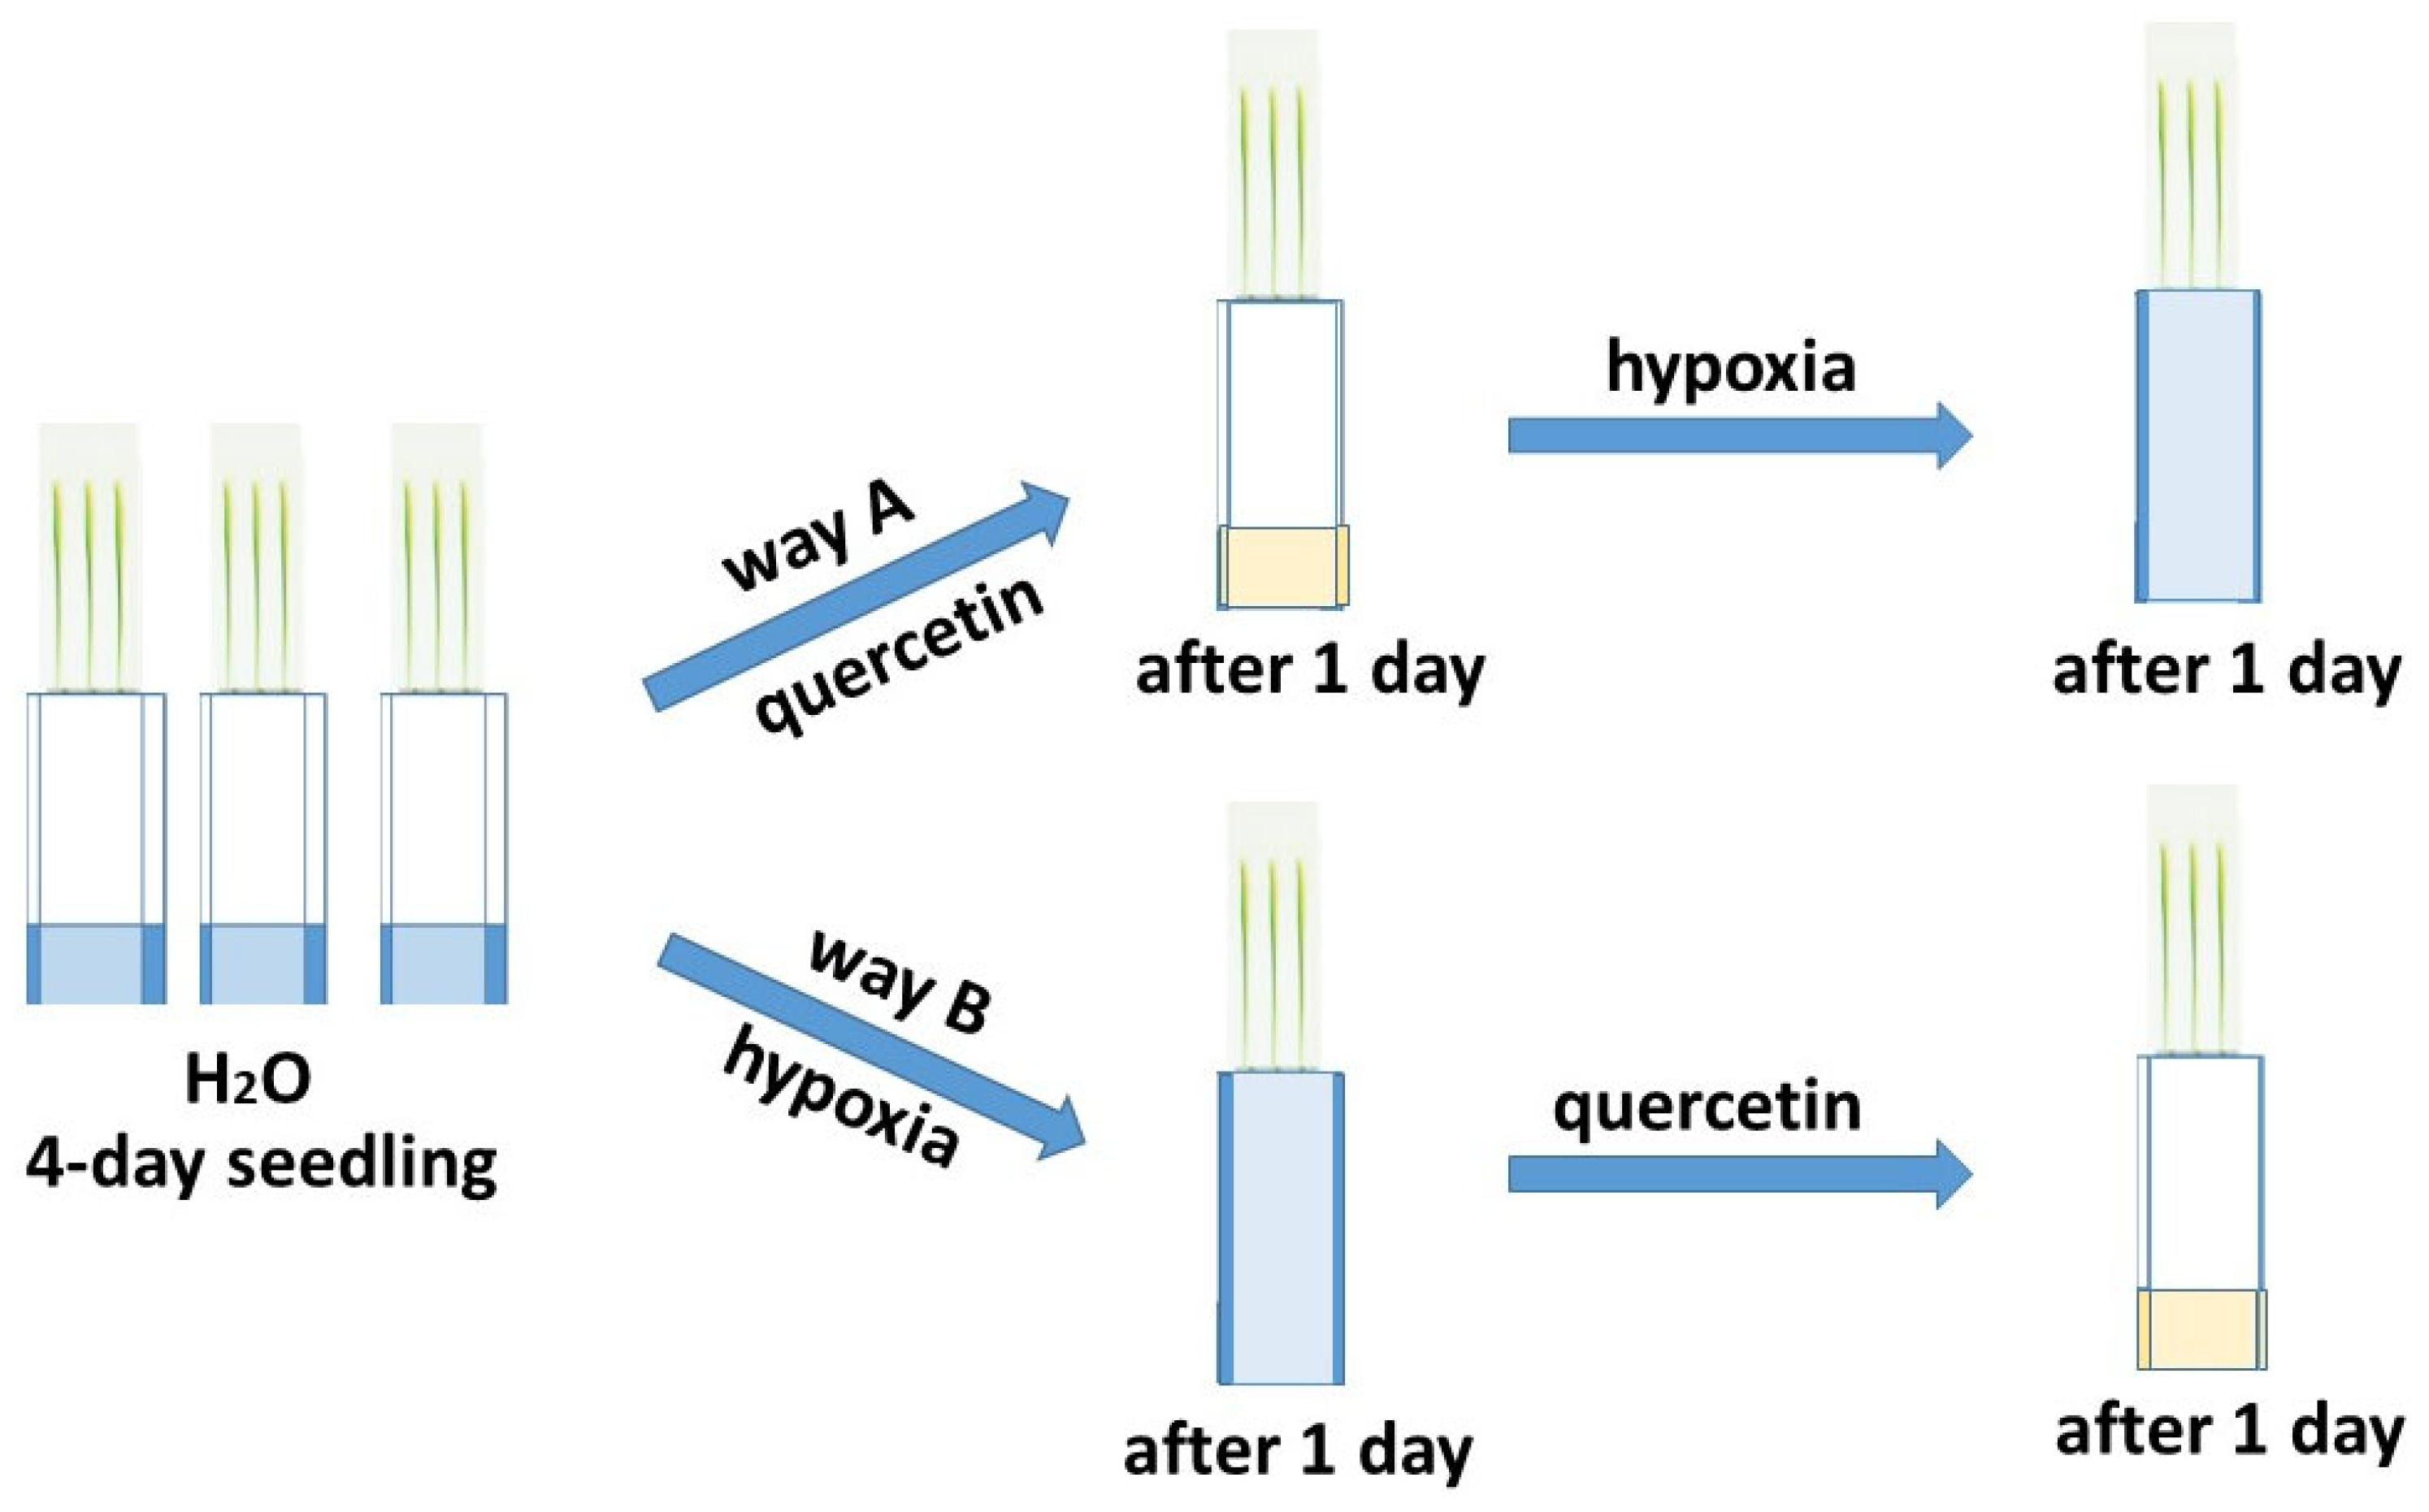
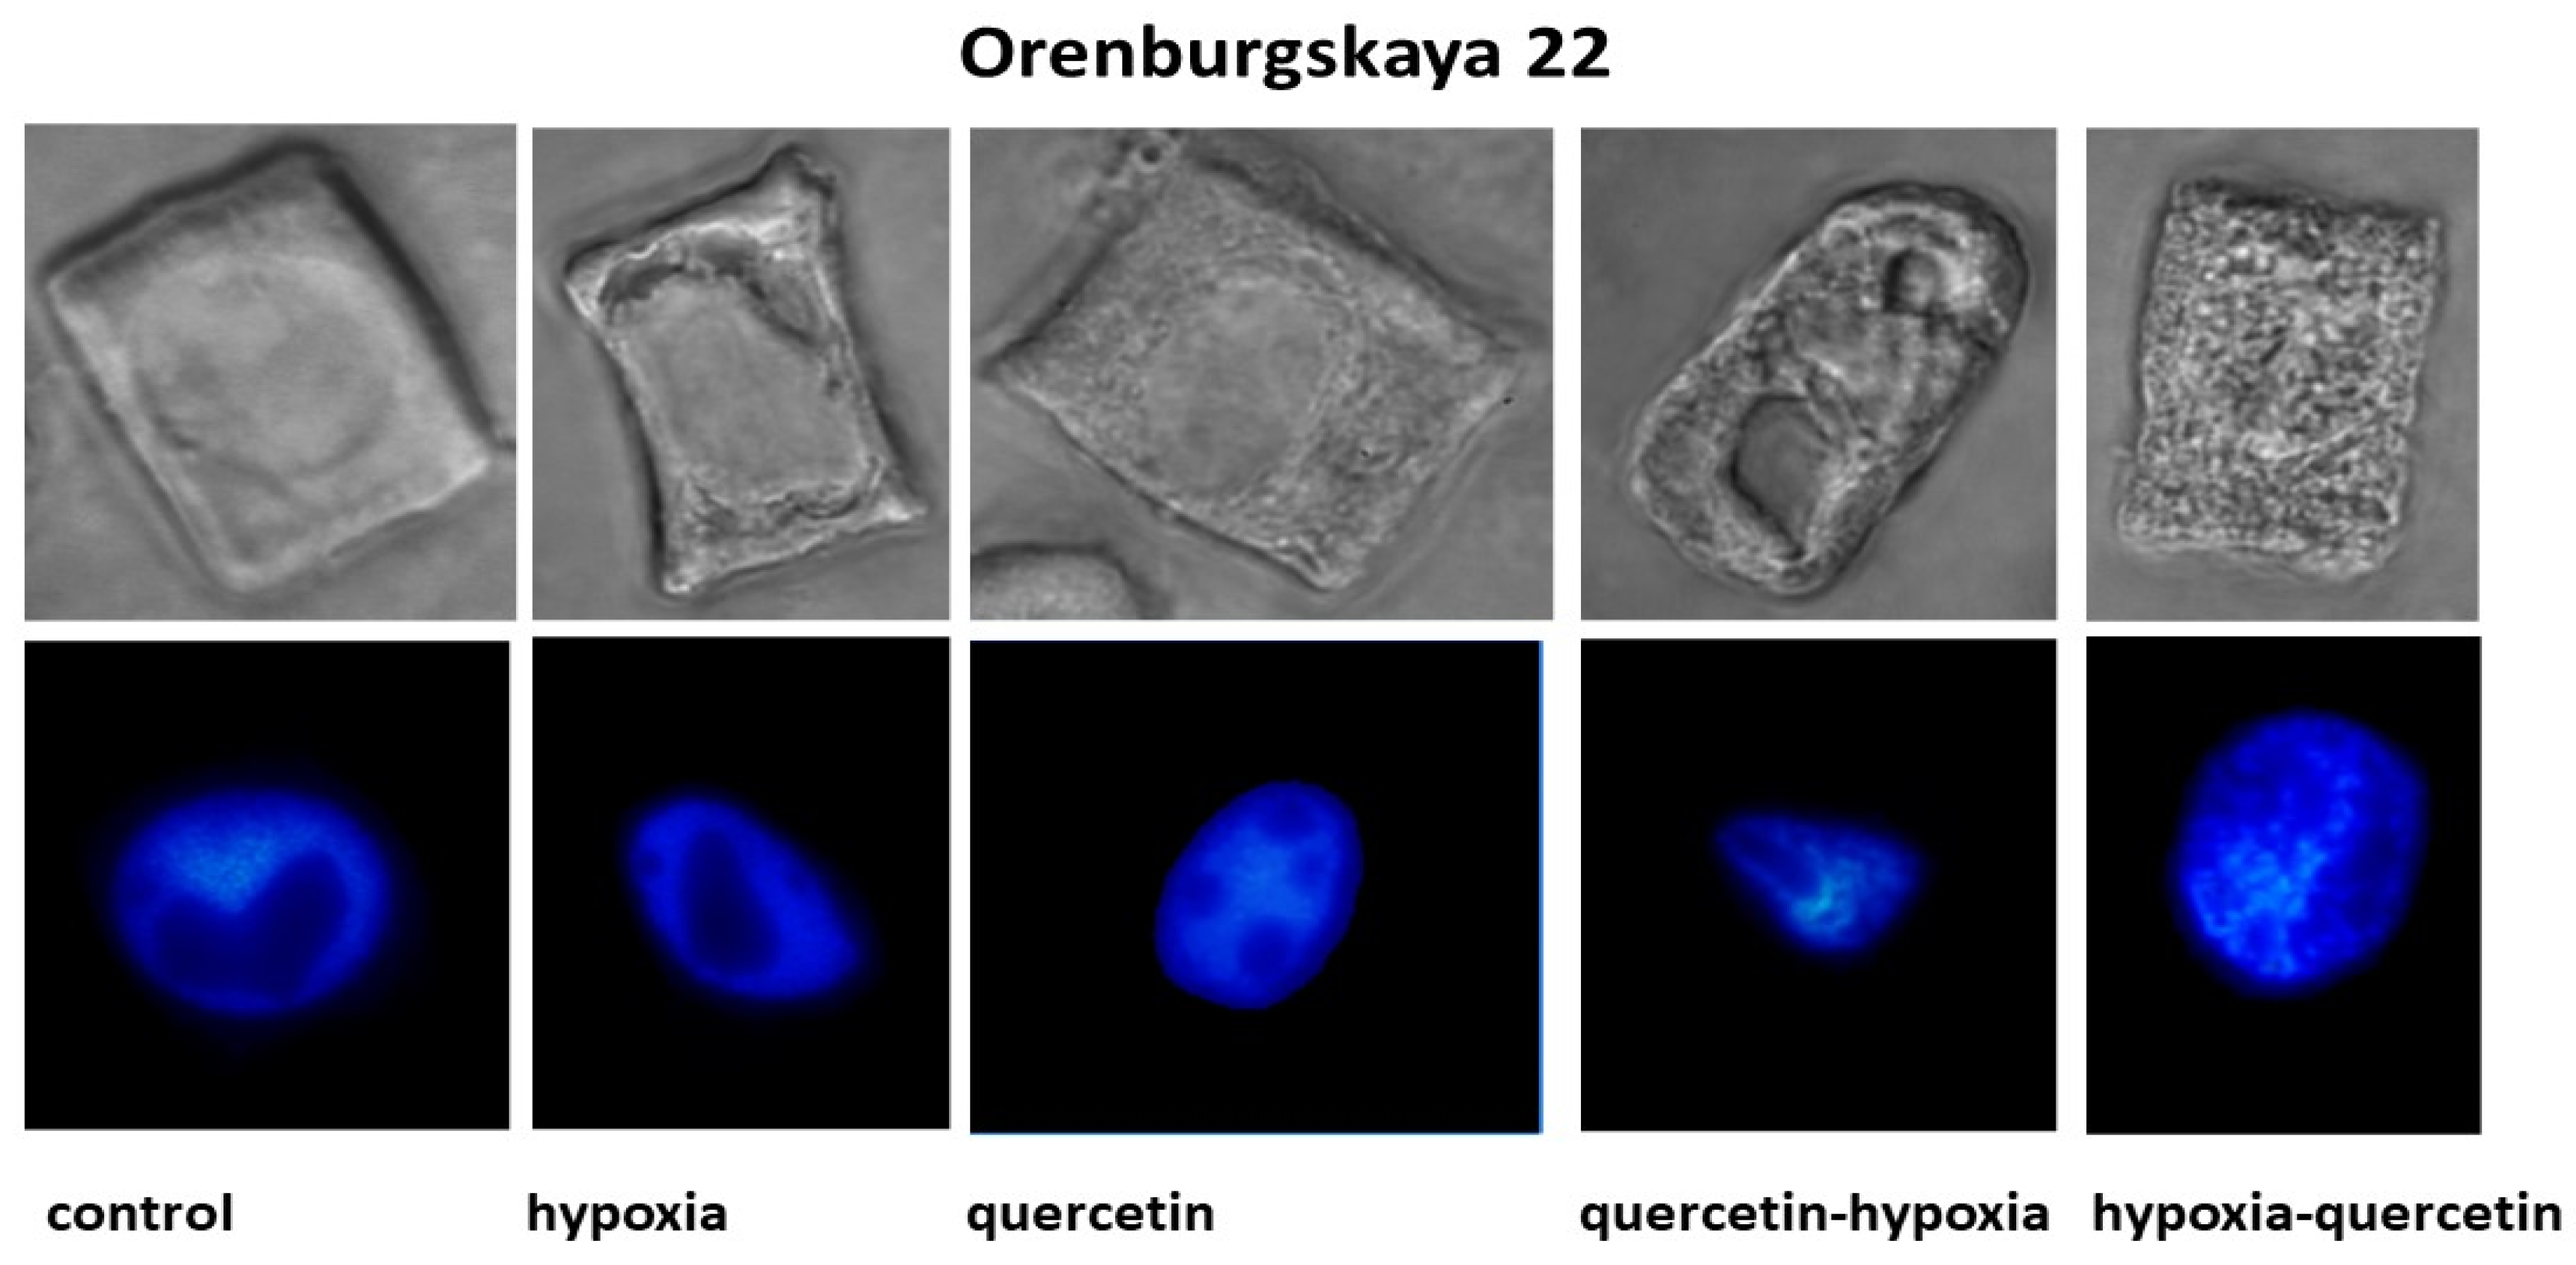
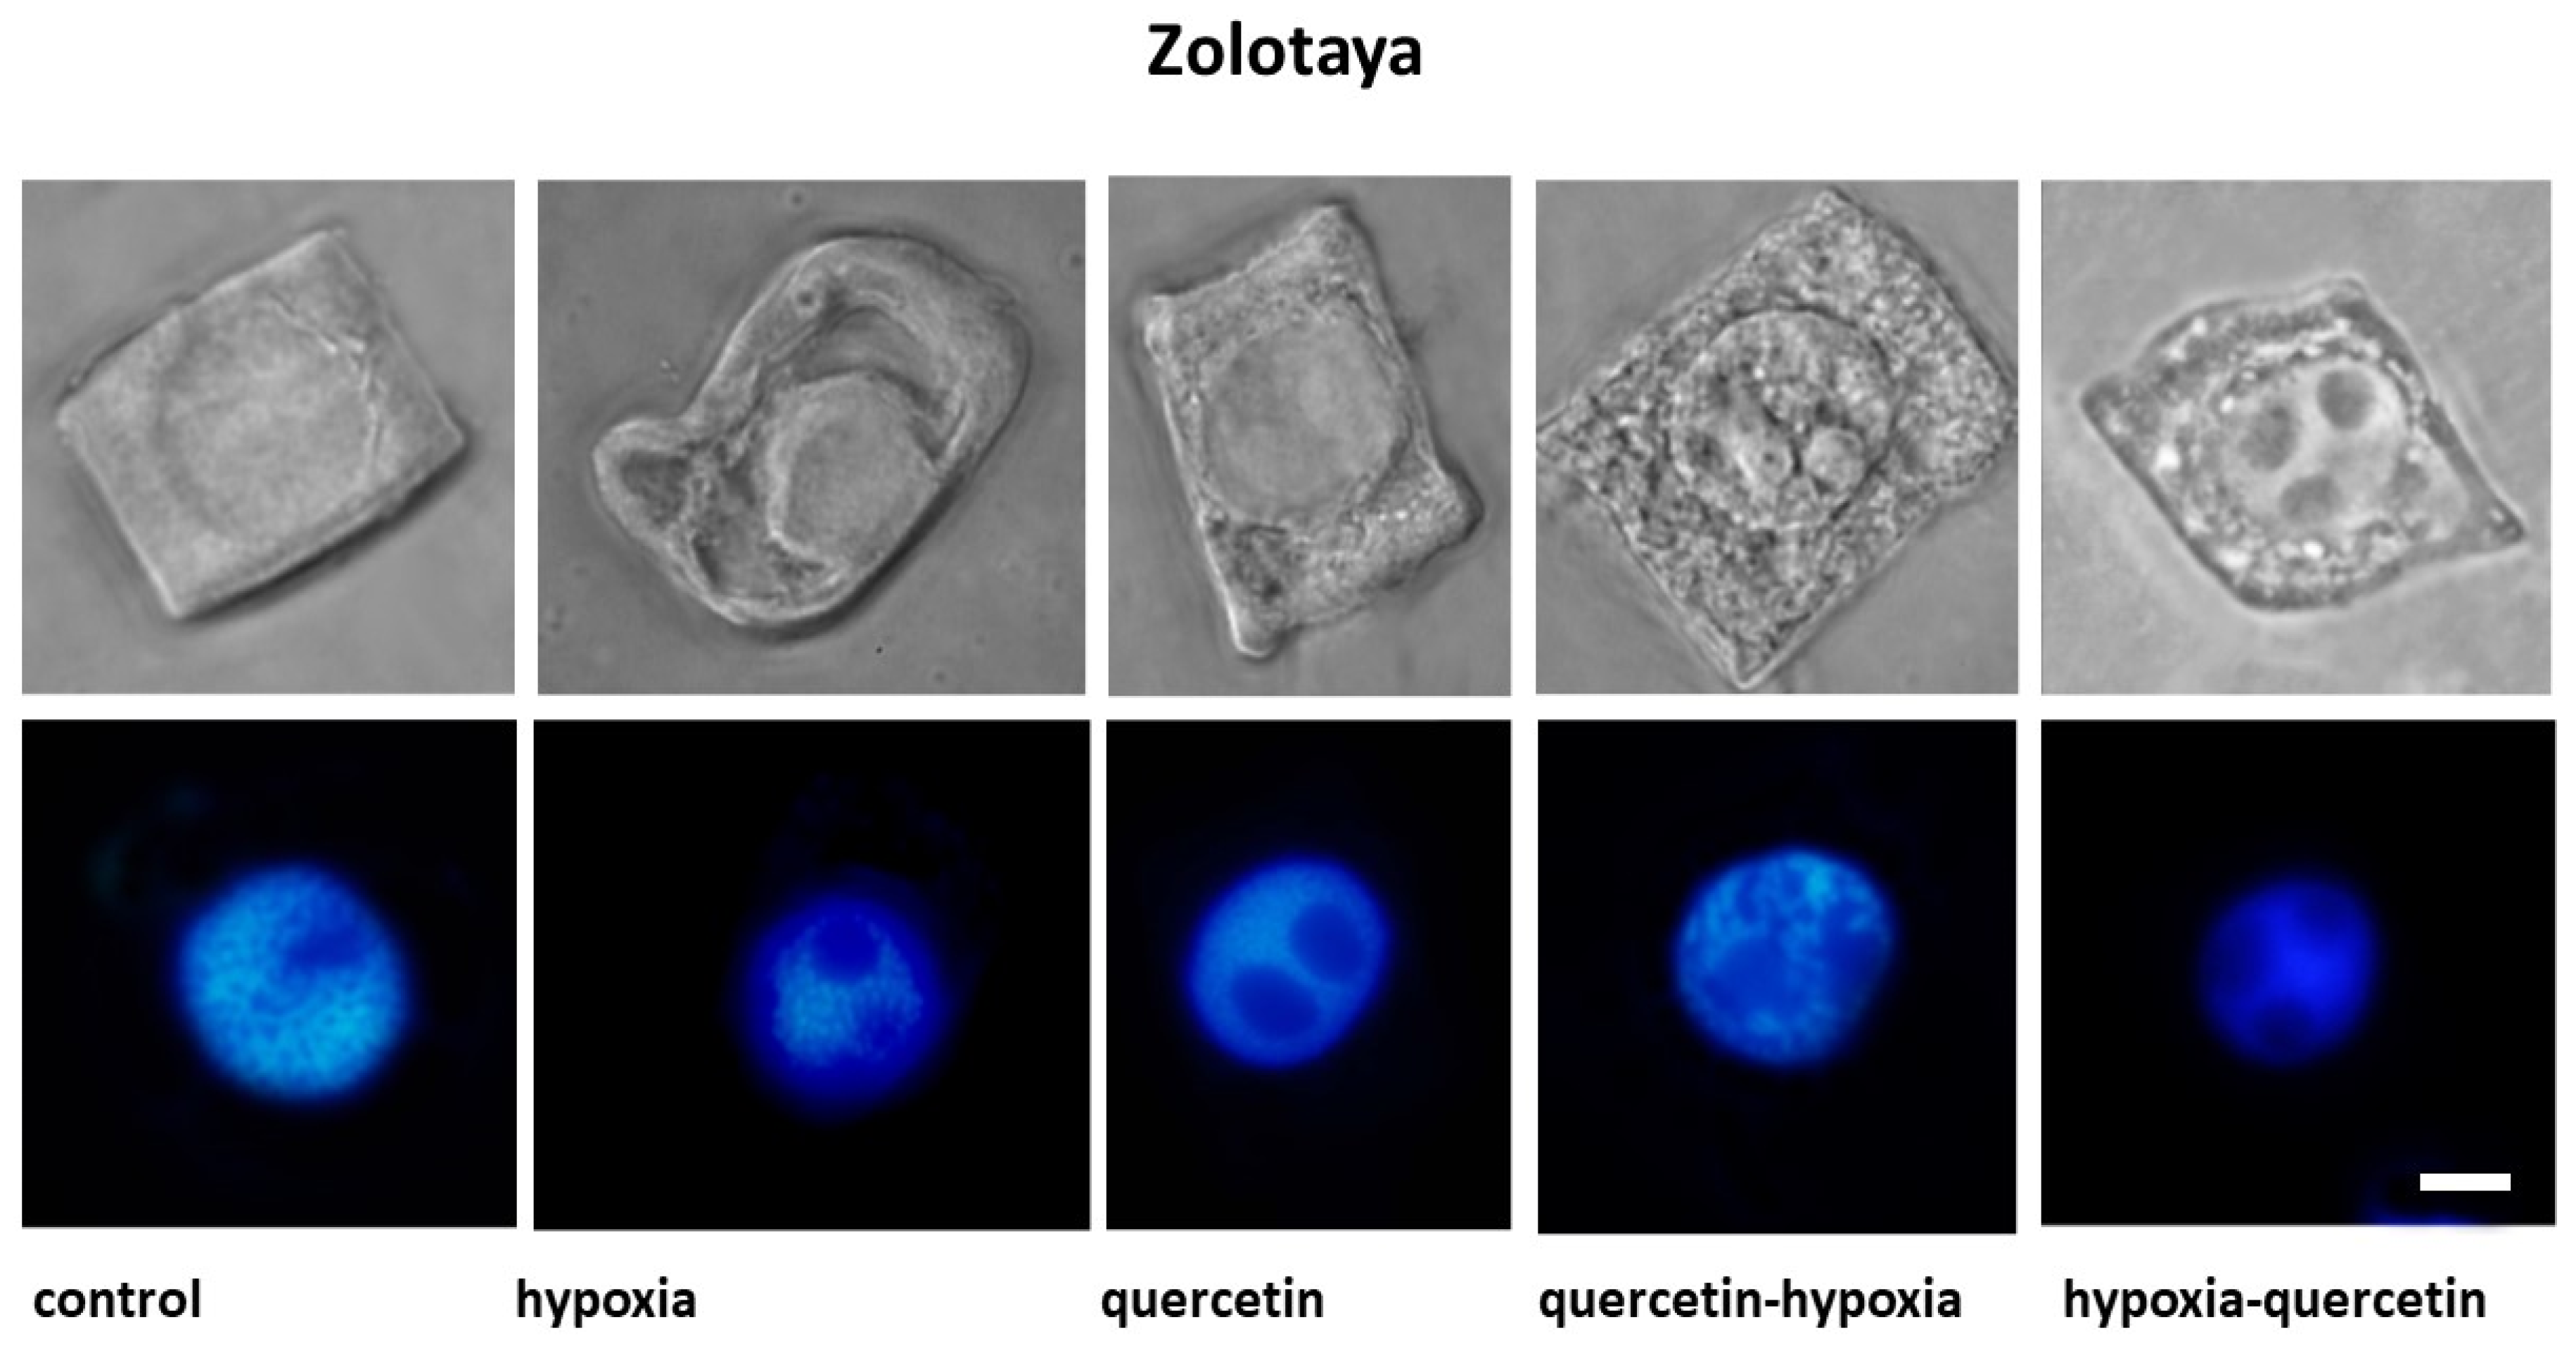
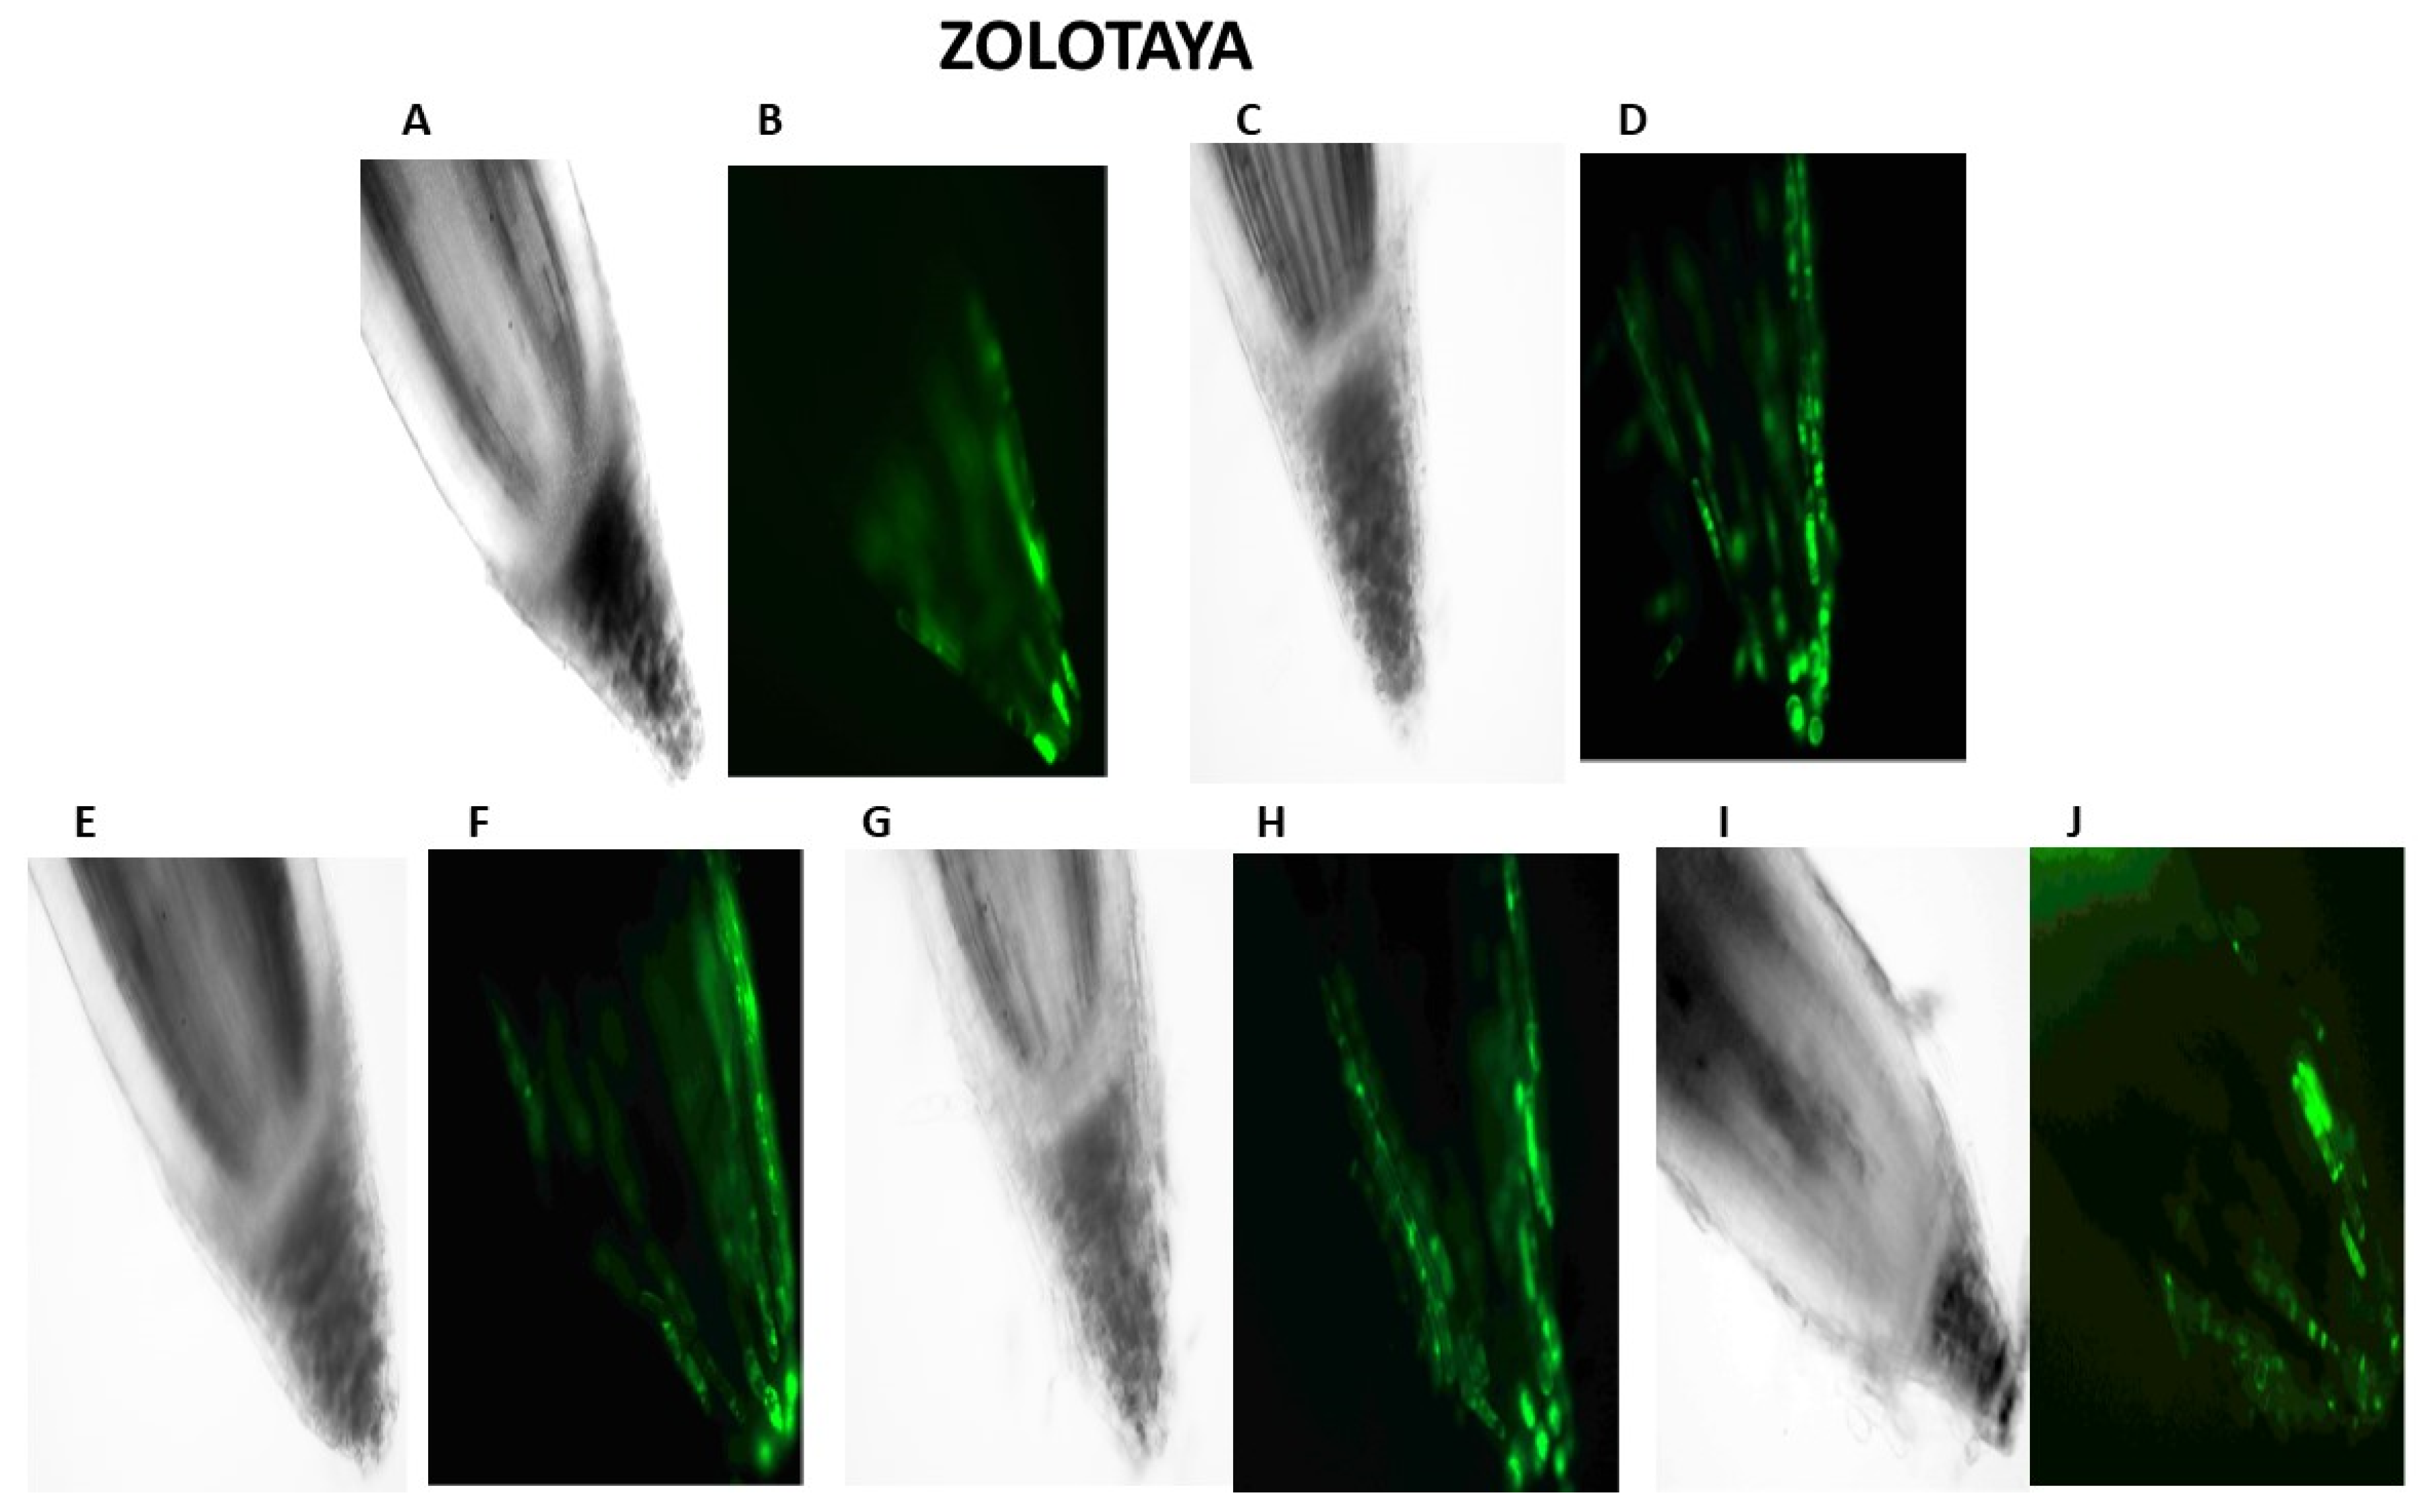
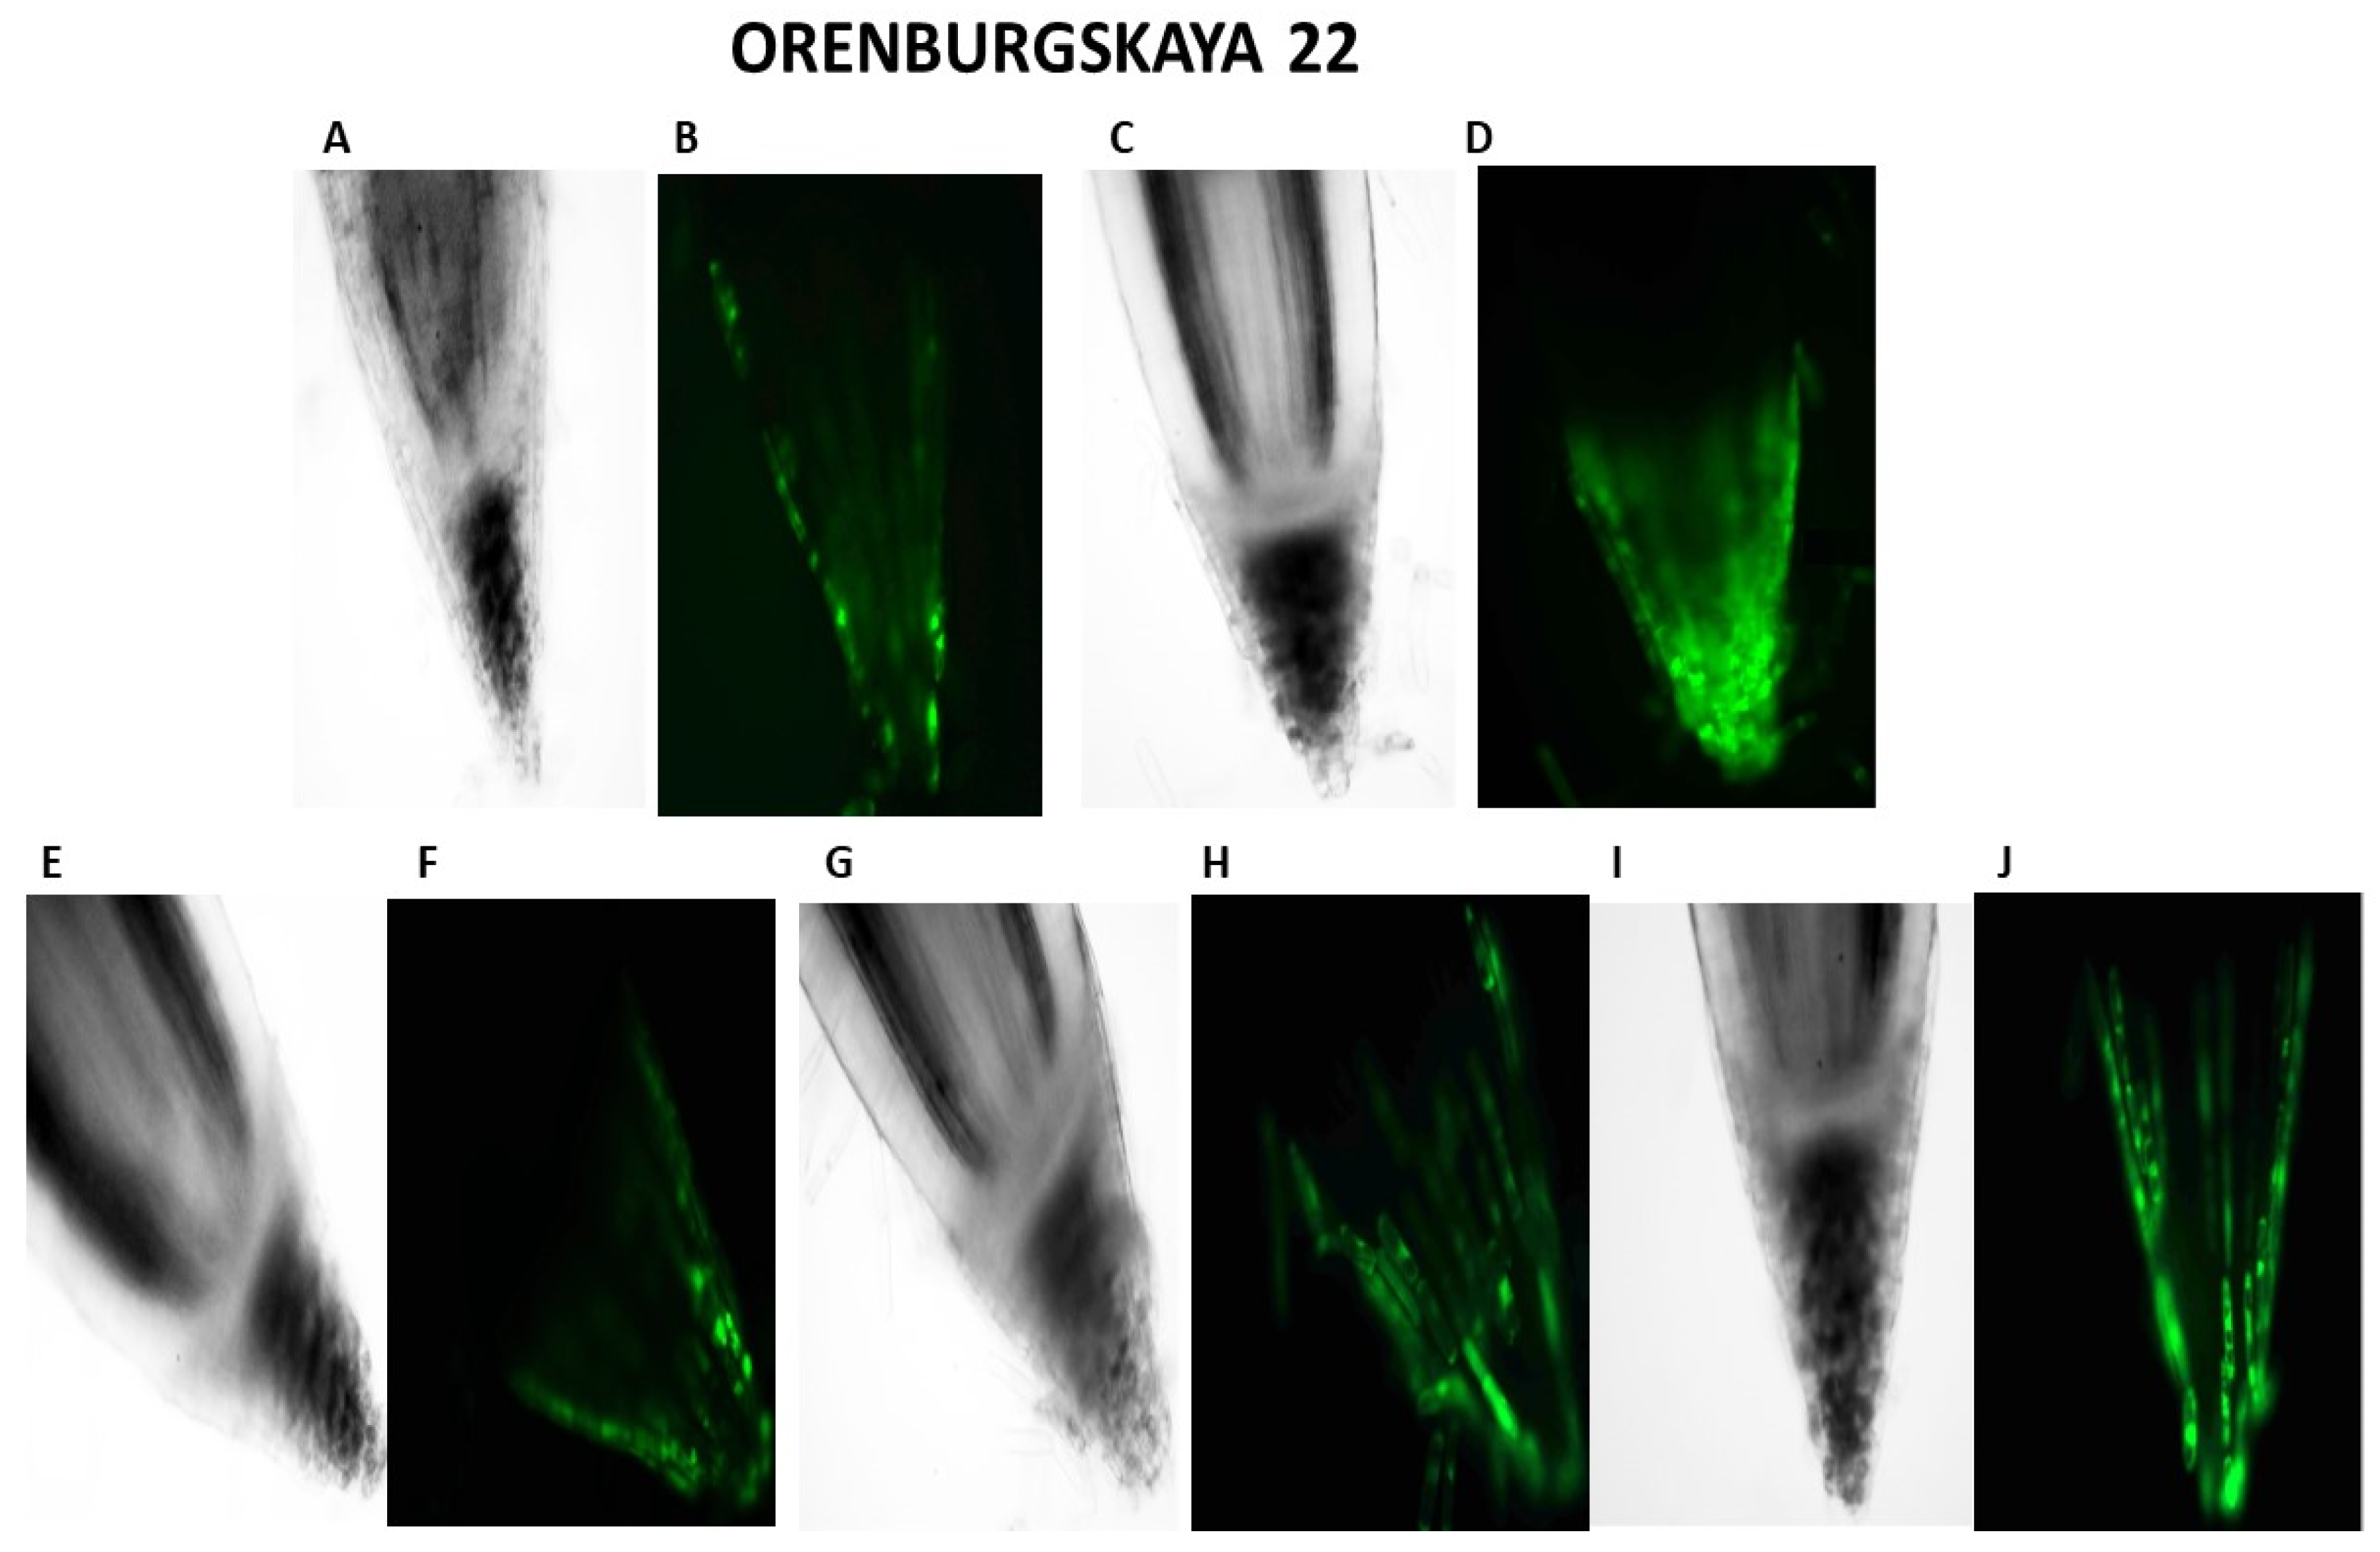
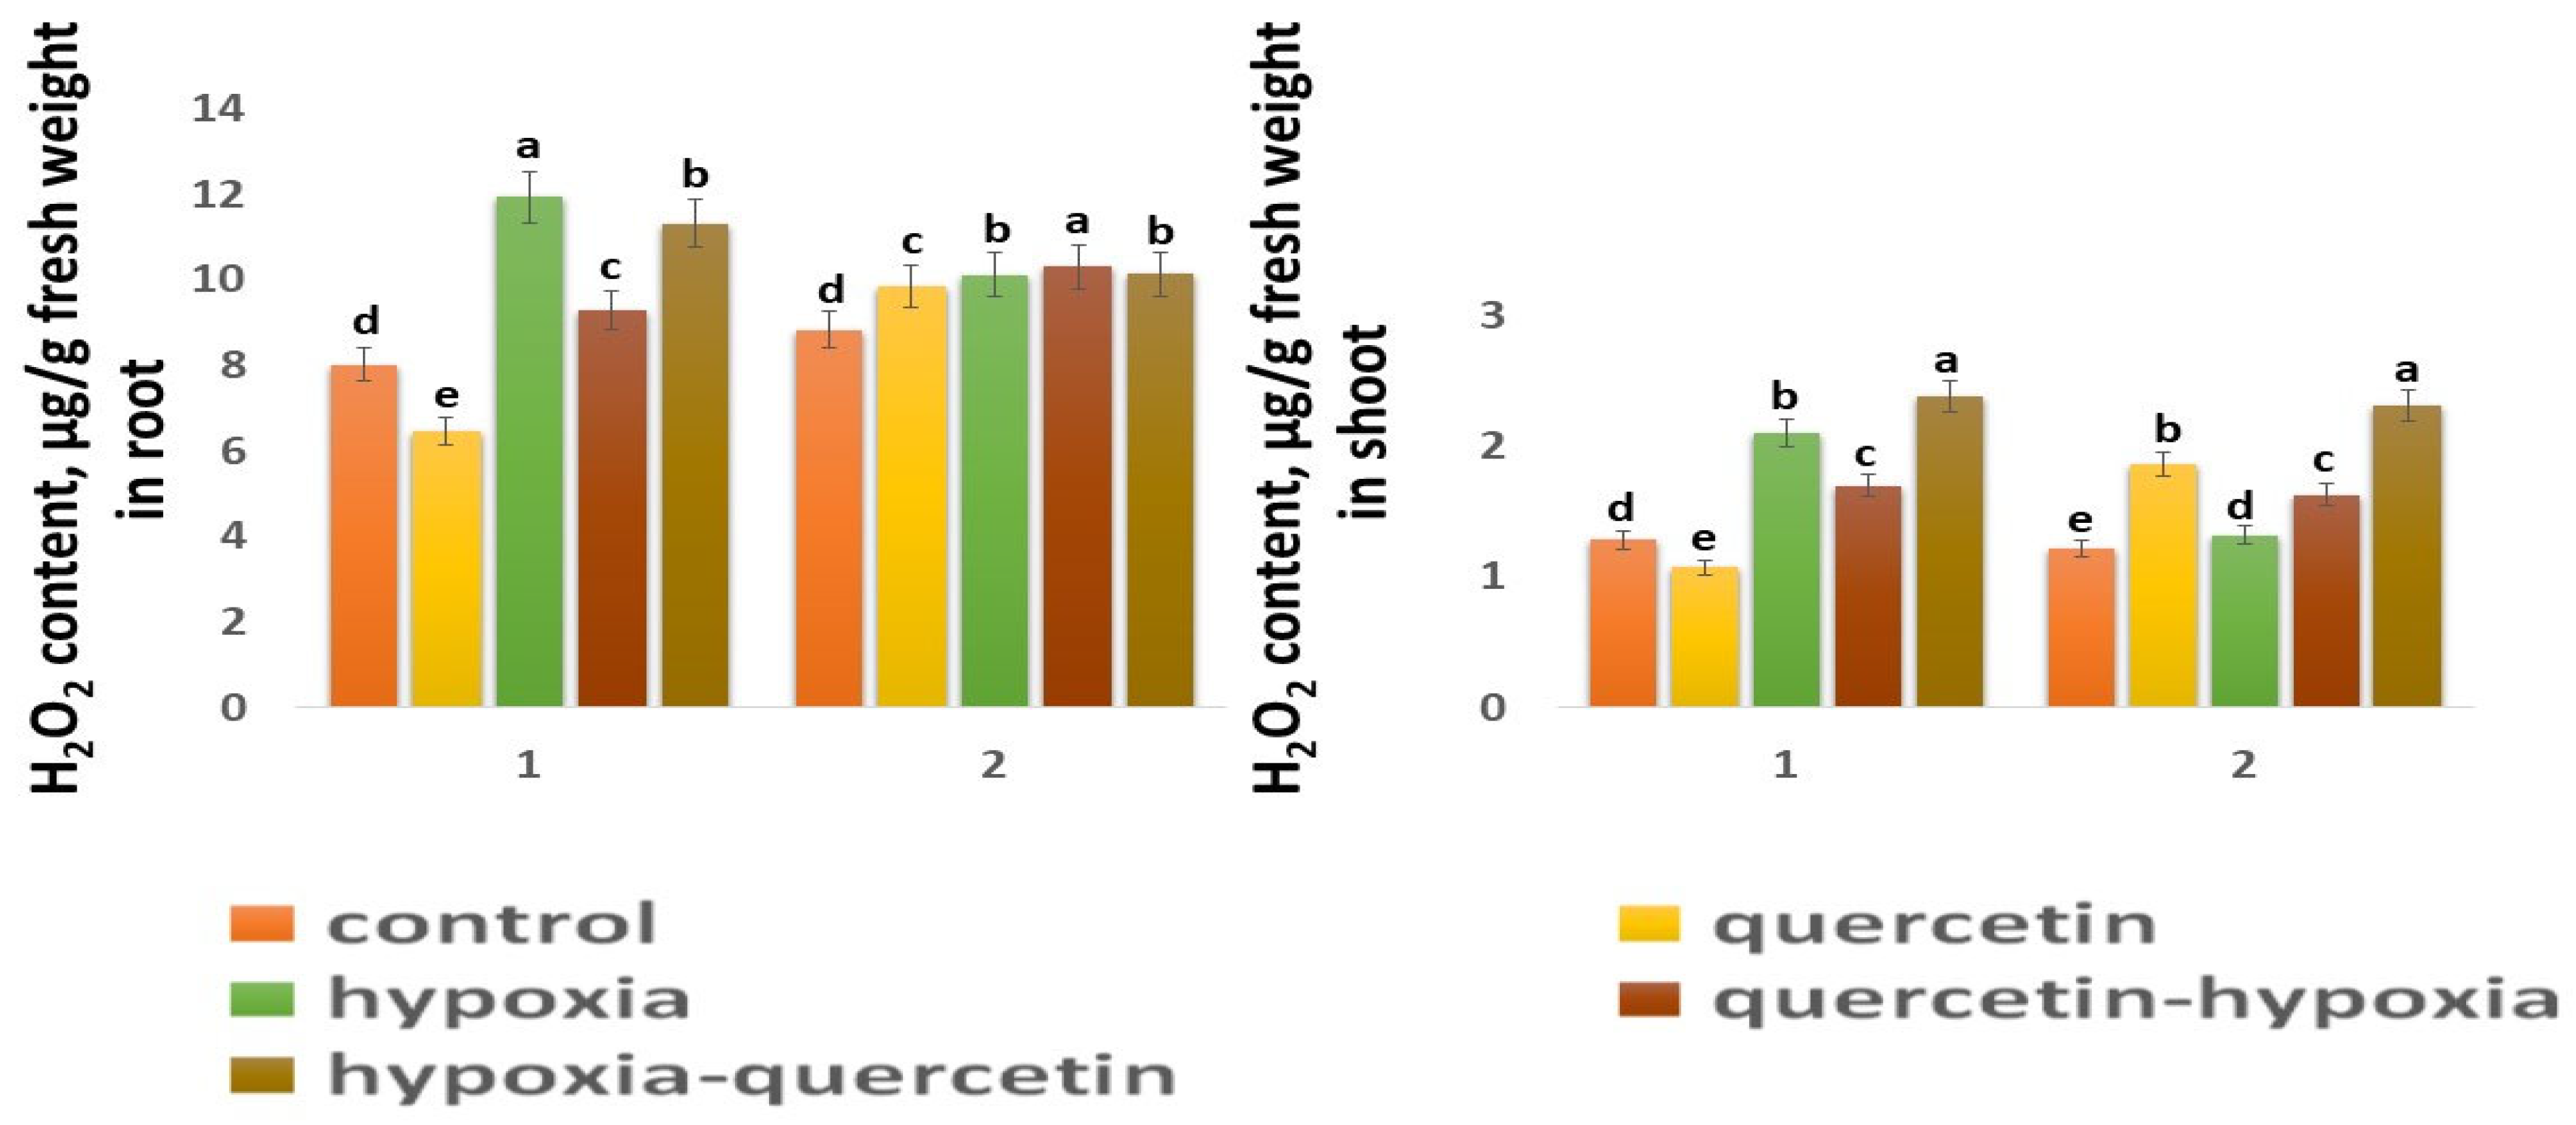
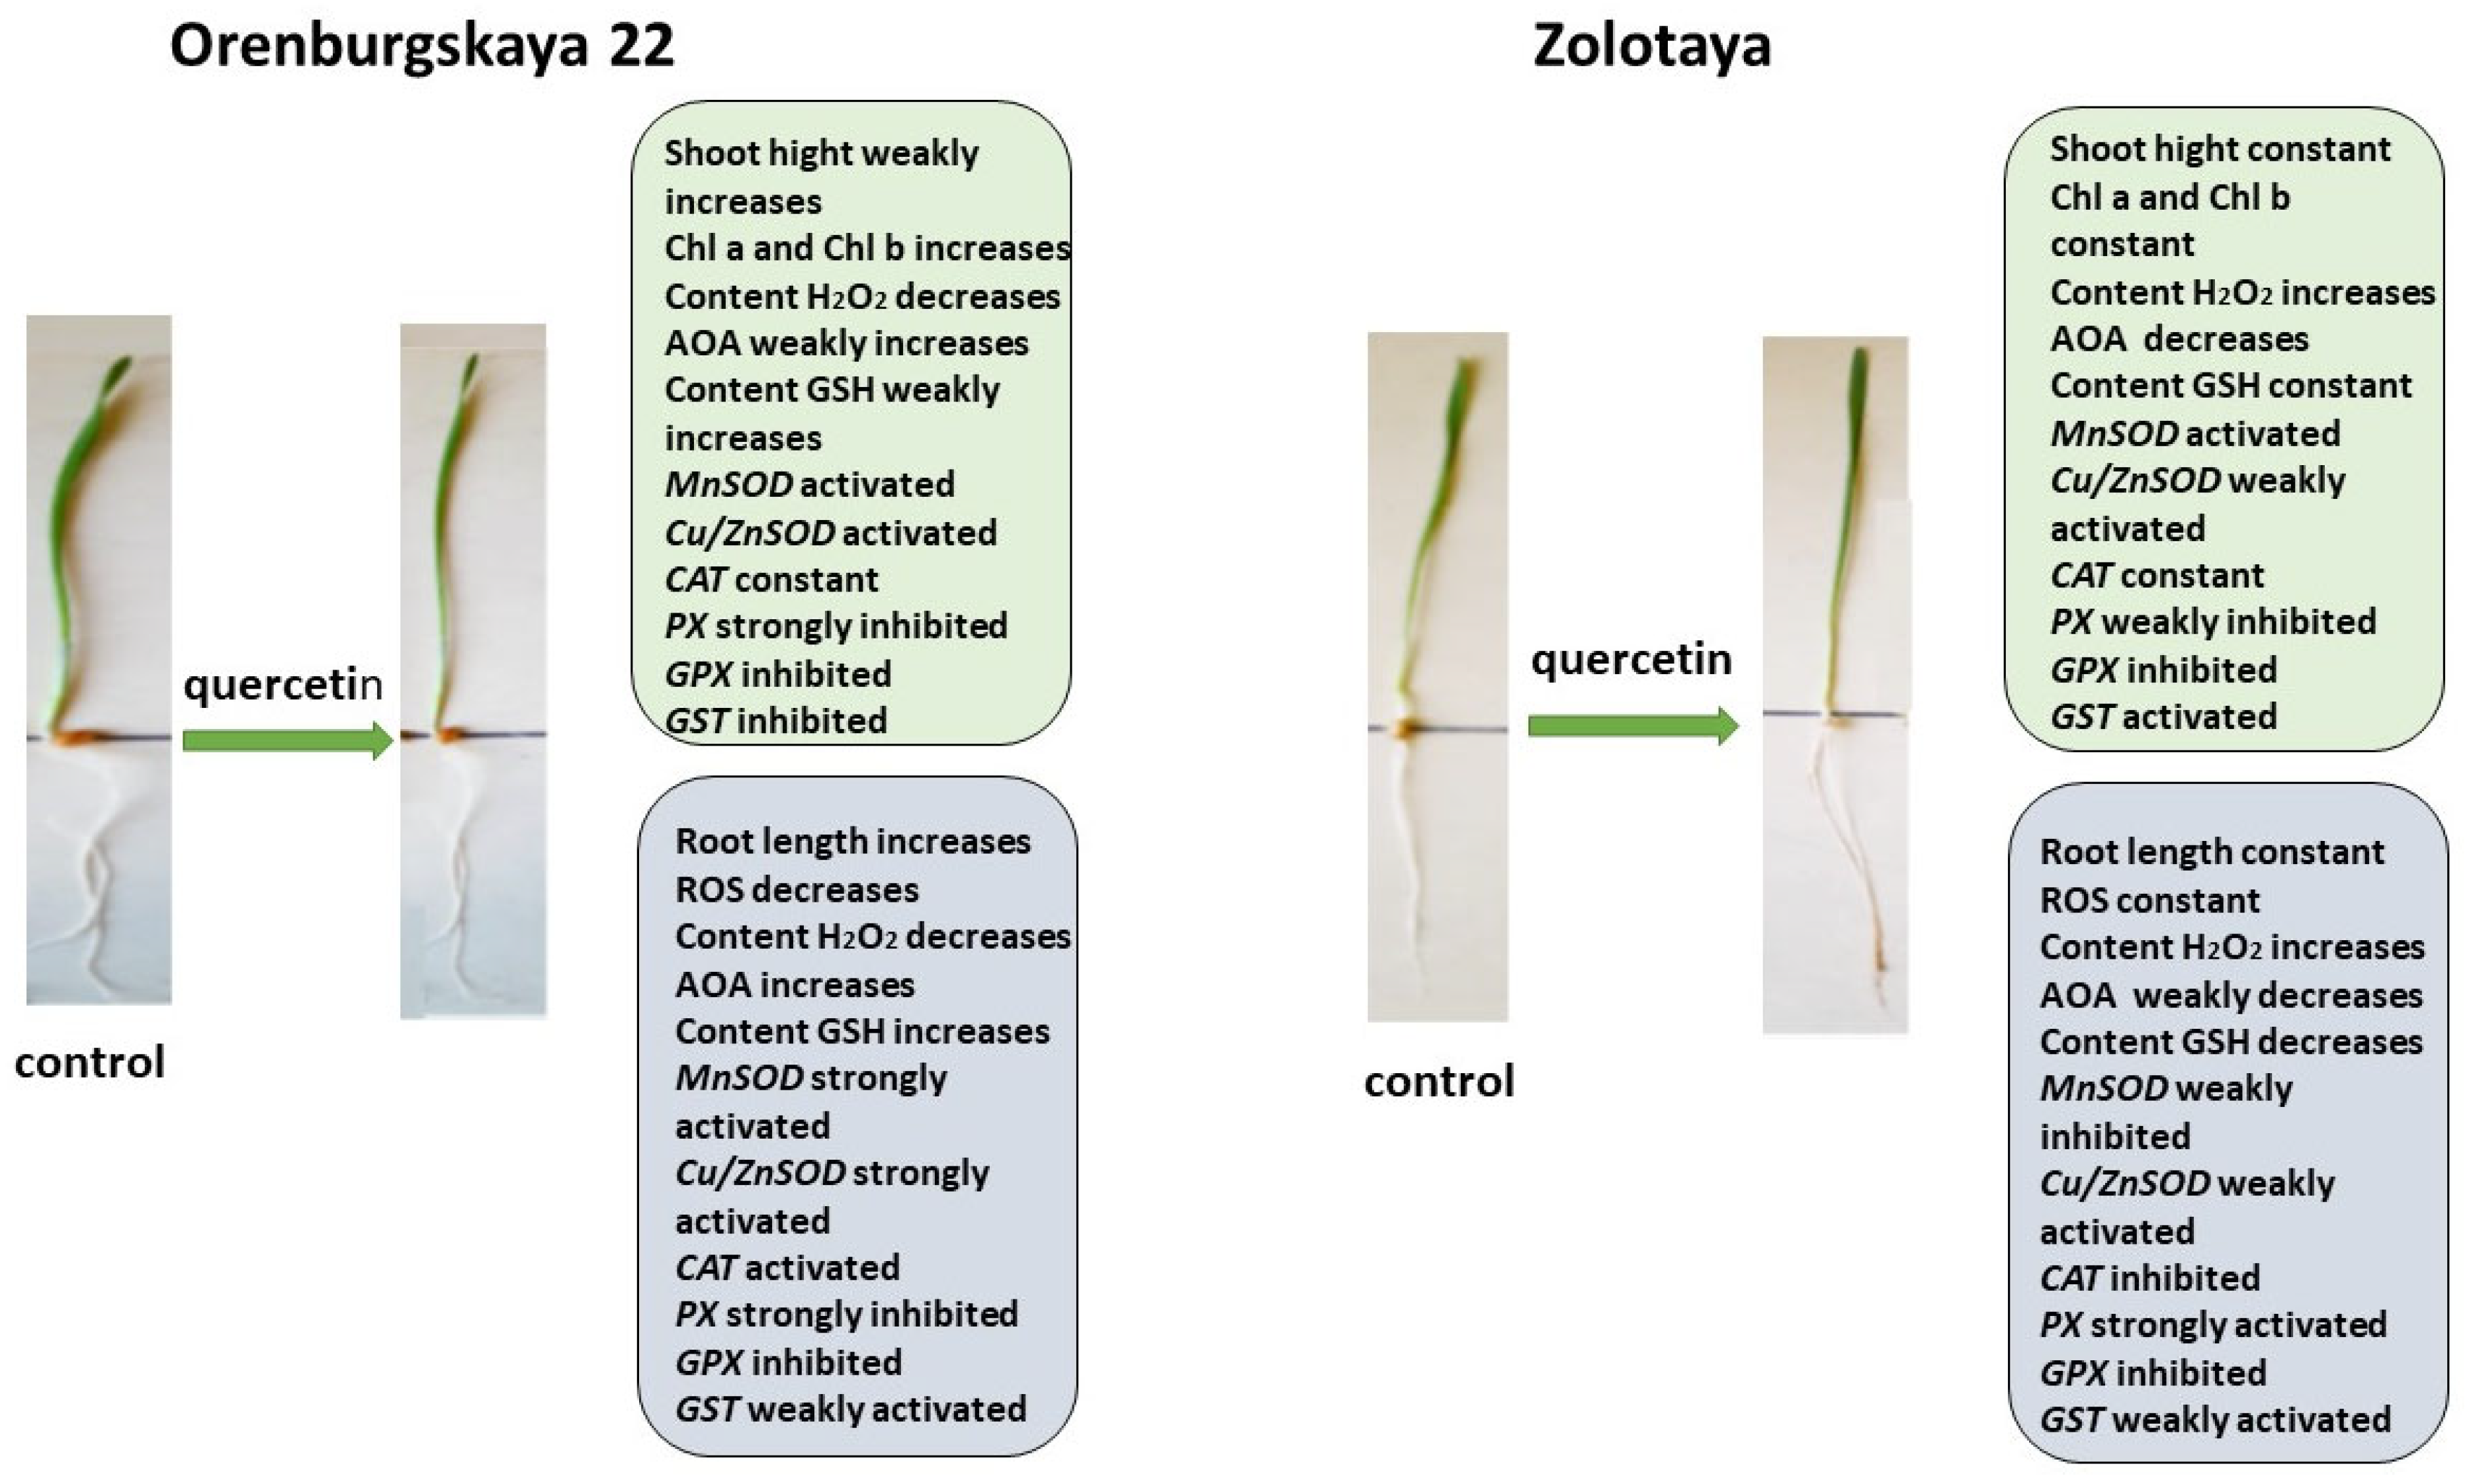
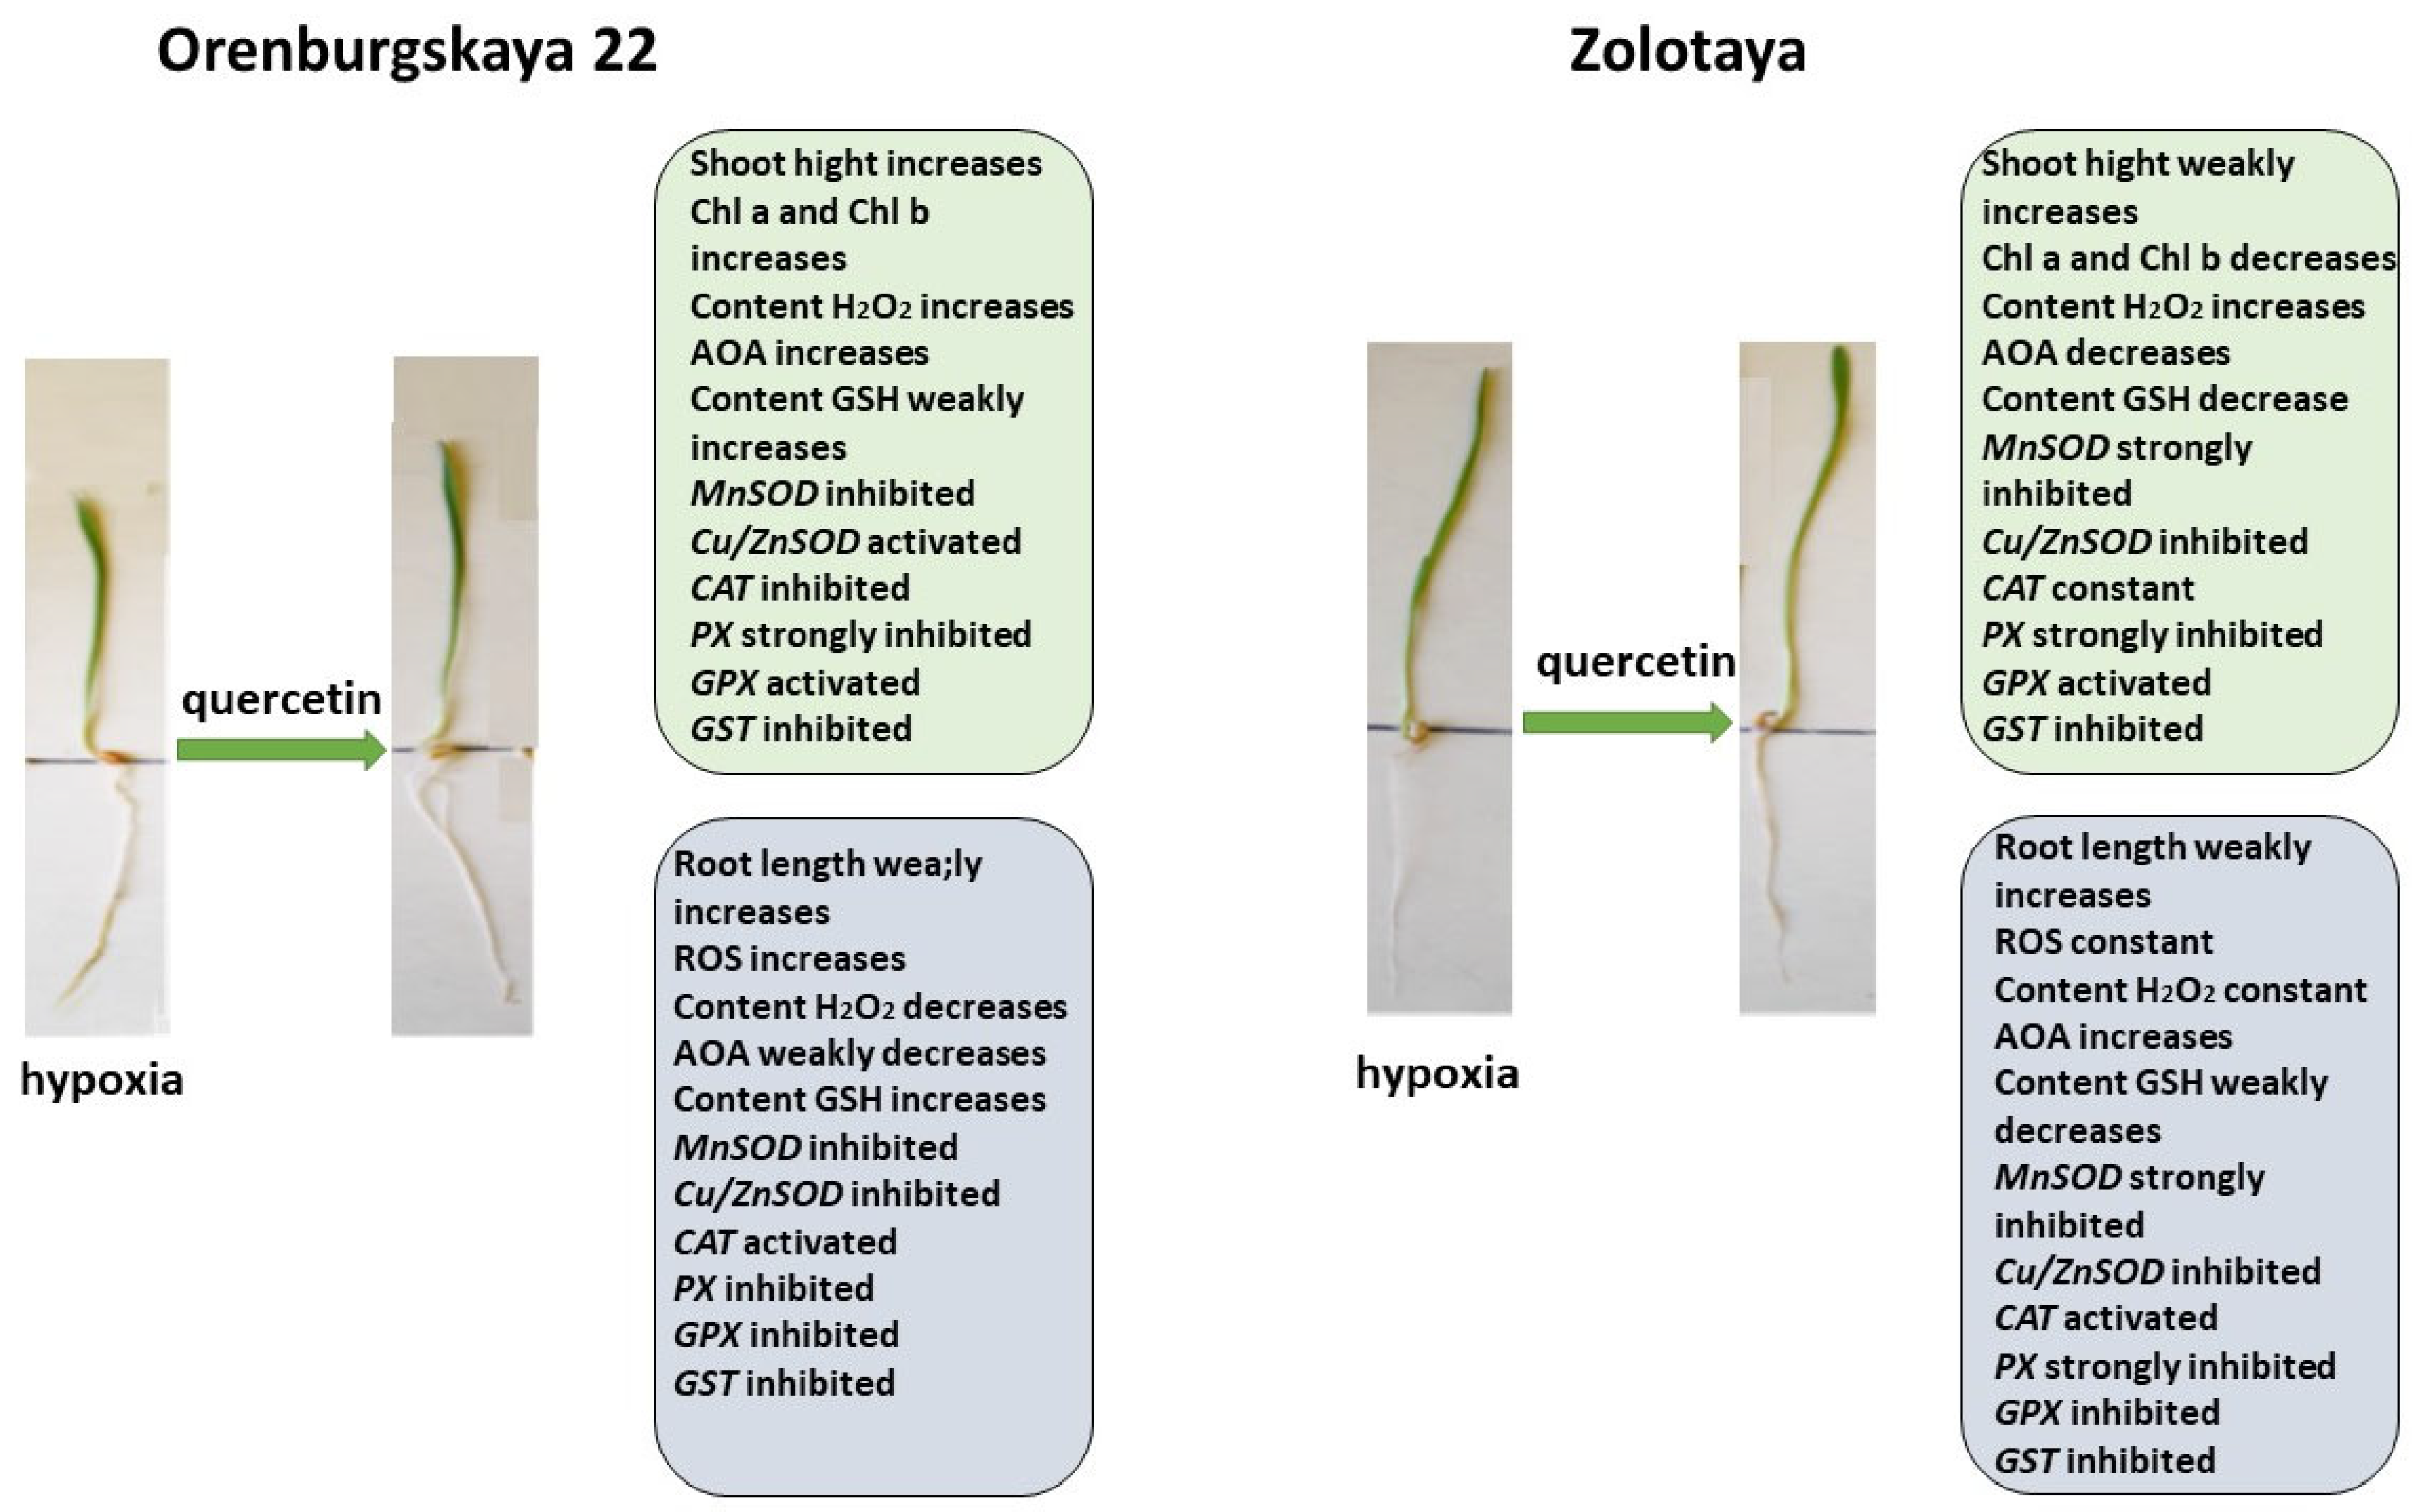
Table 1.
Morphometric parameters of wheat varieties Orenburgskaya 22 and Zolotaya grown under different conditions.
Table 1.
Morphometric parameters of wheat varieties Orenburgskaya 22 and Zolotaya grown under different conditions.
| Wheat Variety | Growth Condition | Seedling Length, cm | Shoot Hight, cm | Root Length, cm |
|---|---|---|---|---|
| Orenburgskaya 22 | control | 29.9 ± 1.44 b | 17.4 ± 0.87 a | 12.5 ± 0.62 b |
| quercetin | 30.8 ± 1.54 a | 17.7 ± 0.88 a | 13.1 ± 0.65 a | |
| hypoxia | 25.0 ± 1.3 d | 14.1 ± 0.7 c | 10.9 ± 0.54 d | |
| quercetin–hypoxia | 27.6 ± 1.38 c | 15.3 ± 0.76 b | 12.3 ± 0.61 b | |
| hypoxia–quercetin | 26.3 ± 1.31 c | 14.8 ± 0.74 c | 11.5 ± 0.57 c | |
| Zolotaya | control | 27.7 ± 1.38 a | 16.0 ± 0.8 a | 11.7 ± 0.58 b |
| quercetin | 27.8 ± 1.39 a | 16.2 ± 0.81 a | 11.6 ± 0.58 b | |
| hypoxia | 26.9 ± 1.34 a | 13.2 ± 0.66 b | 13.7 ± 0.68 a | |
| quercetin–hypoxia | 27.0 ± 1.35 a | 13.6 ± 0.68 b | 13.4 ± 0.67 a | |
| hypoxia–quercetin | 27.5 ± 1.37 a | 13.6 ± 0.68 b | 13.9 ± 0.69 a |
Data were expressed as mean ± standard deviation (SD; n = 30) and a–d-indicate significant difference were determined (p < 0.05).
Table 2.
The number of cells with altered cytoplasm in the wheat varieties Orenburgskaya 22 and the Zolotaya variety under different growing conditions per 100 cells.
Table 2.
The number of cells with altered cytoplasm in the wheat varieties Orenburgskaya 22 and the Zolotaya variety under different growing conditions per 100 cells.
| Growth Condition | Orenburgskaya 22 | Zolotaya |
|---|---|---|
| control | 6 ± 2 | 8 ± 2 |
| hypoxia | 70 ± 8 | 60 ± 8 |
| quercetin | 8 ± 1 | 15 ± 3 |
| quercetin–hypoxia | 15 ± 2 | 70 ± 5 |
| hypoxia–quercetin | 25 ± 3 | 35 ± 3 |
Table 3.
Content of Chl a and Chl b in wheat Orenburgskaya 22 and Zolotaya grown under different conditions.
Table 3.
Content of Chl a and Chl b in wheat Orenburgskaya 22 and Zolotaya grown under different conditions.
| Wheat Variety | Growth Condition | Chl a, mg/g | Chl b, mg/g | Ch a/Chl b |
|---|---|---|---|---|
| Orenburgskaya 22 | control | 4.13 ± 0.2 b | 1.69 ± 0.08 b | 2.44 ± 0.12 c |
| quercetin | 5.09 ± 0.25 a | 1.79 ± 0.09 a | 2.93 ± 0.15 a | |
| hypoxia | 1.25 ± 0.06 d | 0.46 ± 0.02 d | 2.72 ± 0.13 b | |
| quercetin–hypoxia | 5.06 ± 0.25 a | 1.76 ± 0.09 a | 2.87 ± 0.14 a | |
| hypoxia–quercetin | 2.60 ± 0.13 c | 1.03 ± 0.05 c | 2.53 ± 0.13 c | |
| Zolotaya | control | 2.47 ± 0.12 b | 0.88 ± 0.04 a | 2.89 ± 0.14 a |
| quercetin | 2.44 ± 0.12 b | 0.92 ± 0.05 a | 2.66 ± 0.13 b | |
| hypoxia | 2.70 ± 0.13 a | 0.92 ± 0.05 a | 2.93 ± 0.15 a | |
| quercetin–hypoxia | 1.28 ± 0.06 d | 0.48 ± 0.02 b | 2.65 ± 0.13 b | |
| hypoxia–quercetin | 1.41 ± 0.07 c | 0.50 ± 0.02 b | 2.83 ± 0.14 a |
Data were expressed as mean ± standard deviation (SD; n = 30) and a–d-indicate significant difference were determined (p < 0.05).
Table 4.
Antiradical activity (ARA) and antioxidant activity (AOA) in the roots and shoots of Orenburgskaya 22 and Zolotaya wheat varieties.
Table 4.
Antiradical activity (ARA) and antioxidant activity (AOA) in the roots and shoots of Orenburgskaya 22 and Zolotaya wheat varieties.
| Wheat Variety | Growth Condition | Antiradical Activity, % (Method DPPH) | Antioxidant Activity, % (Method HMAEB) |
|---|---|---|---|
| Orenburgskaya 22 | control | 56.86 ± 2.84 b | 39.04 ± 1.95 b |
| root | quercetin | 69.55 ± 3.48 a | 46.14 ± 2.31 a |
| hypoxia | 43.63 ± 2.18 c | 25.98 ± 1.3 c | |
| quercetin–hypoxia | 38,88 ± 1.94 d | 25.12 ± 1.25 c | |
| hypoxia–quercetin | 42.85 ± 2.14 c | 21.37 ± 1.07 d | |
| Orenburgslaya 22 | control | 52.08 ± 2.6 a | 36.15 ± 1.81 a |
| shoot | quercetin | 53.52 ± 2.67 a | 37.37 ± 1.87 a |
| hypoxia | 36.74 ± 1.84 d | 23.24 ± 1.16 c | |
| quercetin–hypoxia | 43.22 ± 2.16 c | 32.21 ± 1.61 b | |
| hypoxia–quercetin | 46.44 ± 2.32 b | 18.93 ± 0.95 d | |
| Zolotaya | control | 54.24 ± 2.71 a | 35.86 ± 1.79 a |
| root | quercetin | 53.4 ± 2.67 a | 34.93 ± 1.75 a |
| hypoxia | 49.57 ± 2.48 b | 31.56 ± 1.58 b | |
| quercetin–hypoxia | 36.59 ± 1.83 d | 31.78 ± 1.59 b | |
| hypoxia–quercetin | 46.51 ± 2.32 c | 24.77 ± 1.24 c | |
| Zolotaya | control | 53.42 ± 2.67 a | 37.12 ± 1.85 a |
| shoot | quercetin | 49.82 ± 2.49 b | 35.94 ± 1.8 b |
| hypoxia | 47.05 ± 2.35 c | 33.74 ± 1.69 c | |
| quercetin–hypoxia | 42.66 ± 2,13 d | 38.04 ± 1.9 a | |
| hypoxia–quercetin | 41.09 ± 2.05 d | 30.21 ± 1.51 d |
Data were expressed as mean ± standard deviation (SD; n = 30) and a–d-indicate significant difference were determined (p < 0.05).
Disclaimer/Publisher’s Note: The statements, opinions and data contained in all publications are solely those of the individual author(s) and contributor(s) and not of MDPI and/or the editor(s). MDPI and/or the editor(s) disclaim responsibility for any injury to people or property resulting from any ideas, methods, instructions or products referred to in the content. |
© 2024 by the authors. Licensee MDPI, Basel, Switzerland. This article is an open access article distributed under the terms and conditions of the Creative Commons Attribution (CC BY) license (https://creativecommons.org/licenses/by/4.0/).
Share and Cite
MDPI and ACS Style
Fedoreyeva, L.I.; Lazareva, E.M.; Kononenko, N.V. Features of the Effect of Quercetin on Different Genotypes of Wheat under Hypoxia. Int. J. Mol. Sci. 2024, 25, 4487. https://doi.org/10.3390/ijms25084487
AMA Style
Fedoreyeva LI, Lazareva EM, Kononenko NV. Features of the Effect of Quercetin on Different Genotypes of Wheat under Hypoxia. International Journal of Molecular Sciences. 2024; 25(8):4487. https://doi.org/10.3390/ijms25084487
Chicago/Turabian StyleFedoreyeva, Larisa Ivanovna, Elena Michailovna Lazareva, and Neonila Vasilievna Kononenko. 2024. "Features of the Effect of Quercetin on Different Genotypes of Wheat under Hypoxia" International Journal of Molecular Sciences 25, no. 8: 4487. https://doi.org/10.3390/ijms25084487
Note that from the first issue of 2016, this journal uses article numbers instead of page numbers. See further details here.