

RNA-Seq Bulked Segregant Analysis of an Exotic B. napus ssp. napobrassica (Rutabaga) F2 Population Reveals Novel QTLs for Breeding Clubroot-Resistant Canola

Abstract
:1. Introduction
2. Results
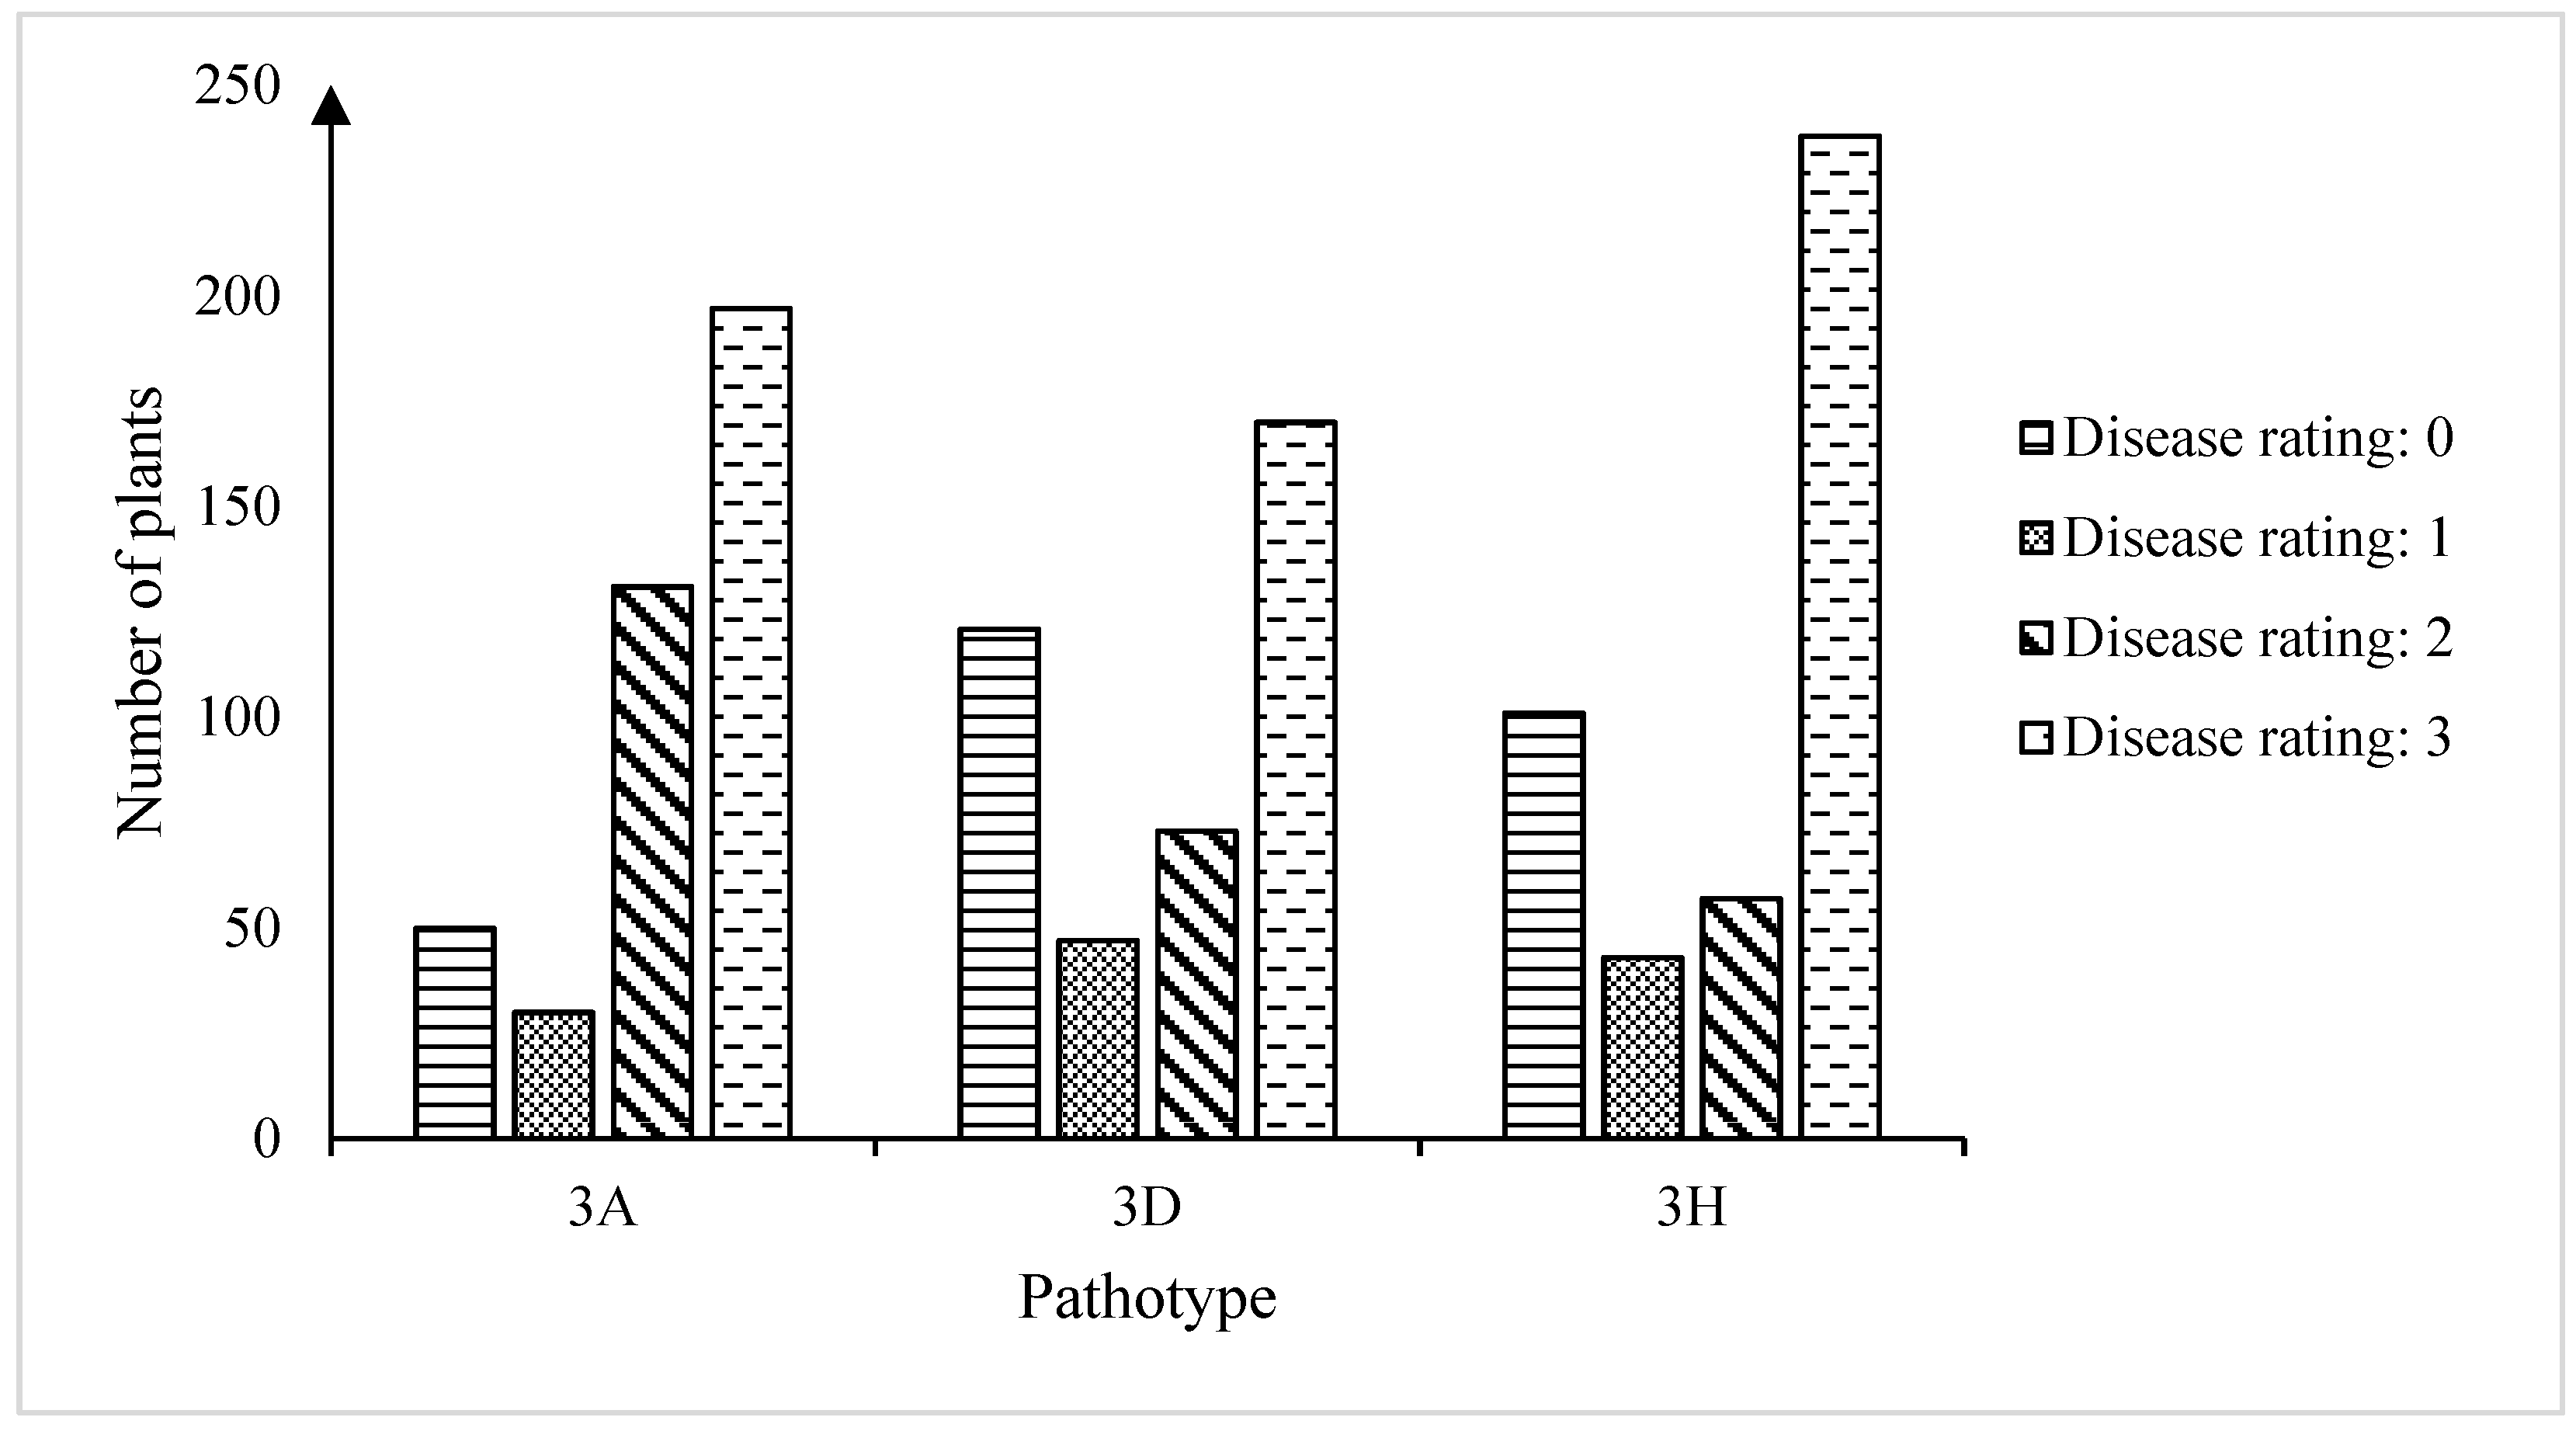
2.1. Clubroot Tests
2.2. Inheritance of Clubroot Resistance in F2 Populations
2.3. RNA Sequencing, Filtering, and Sequence Alignment
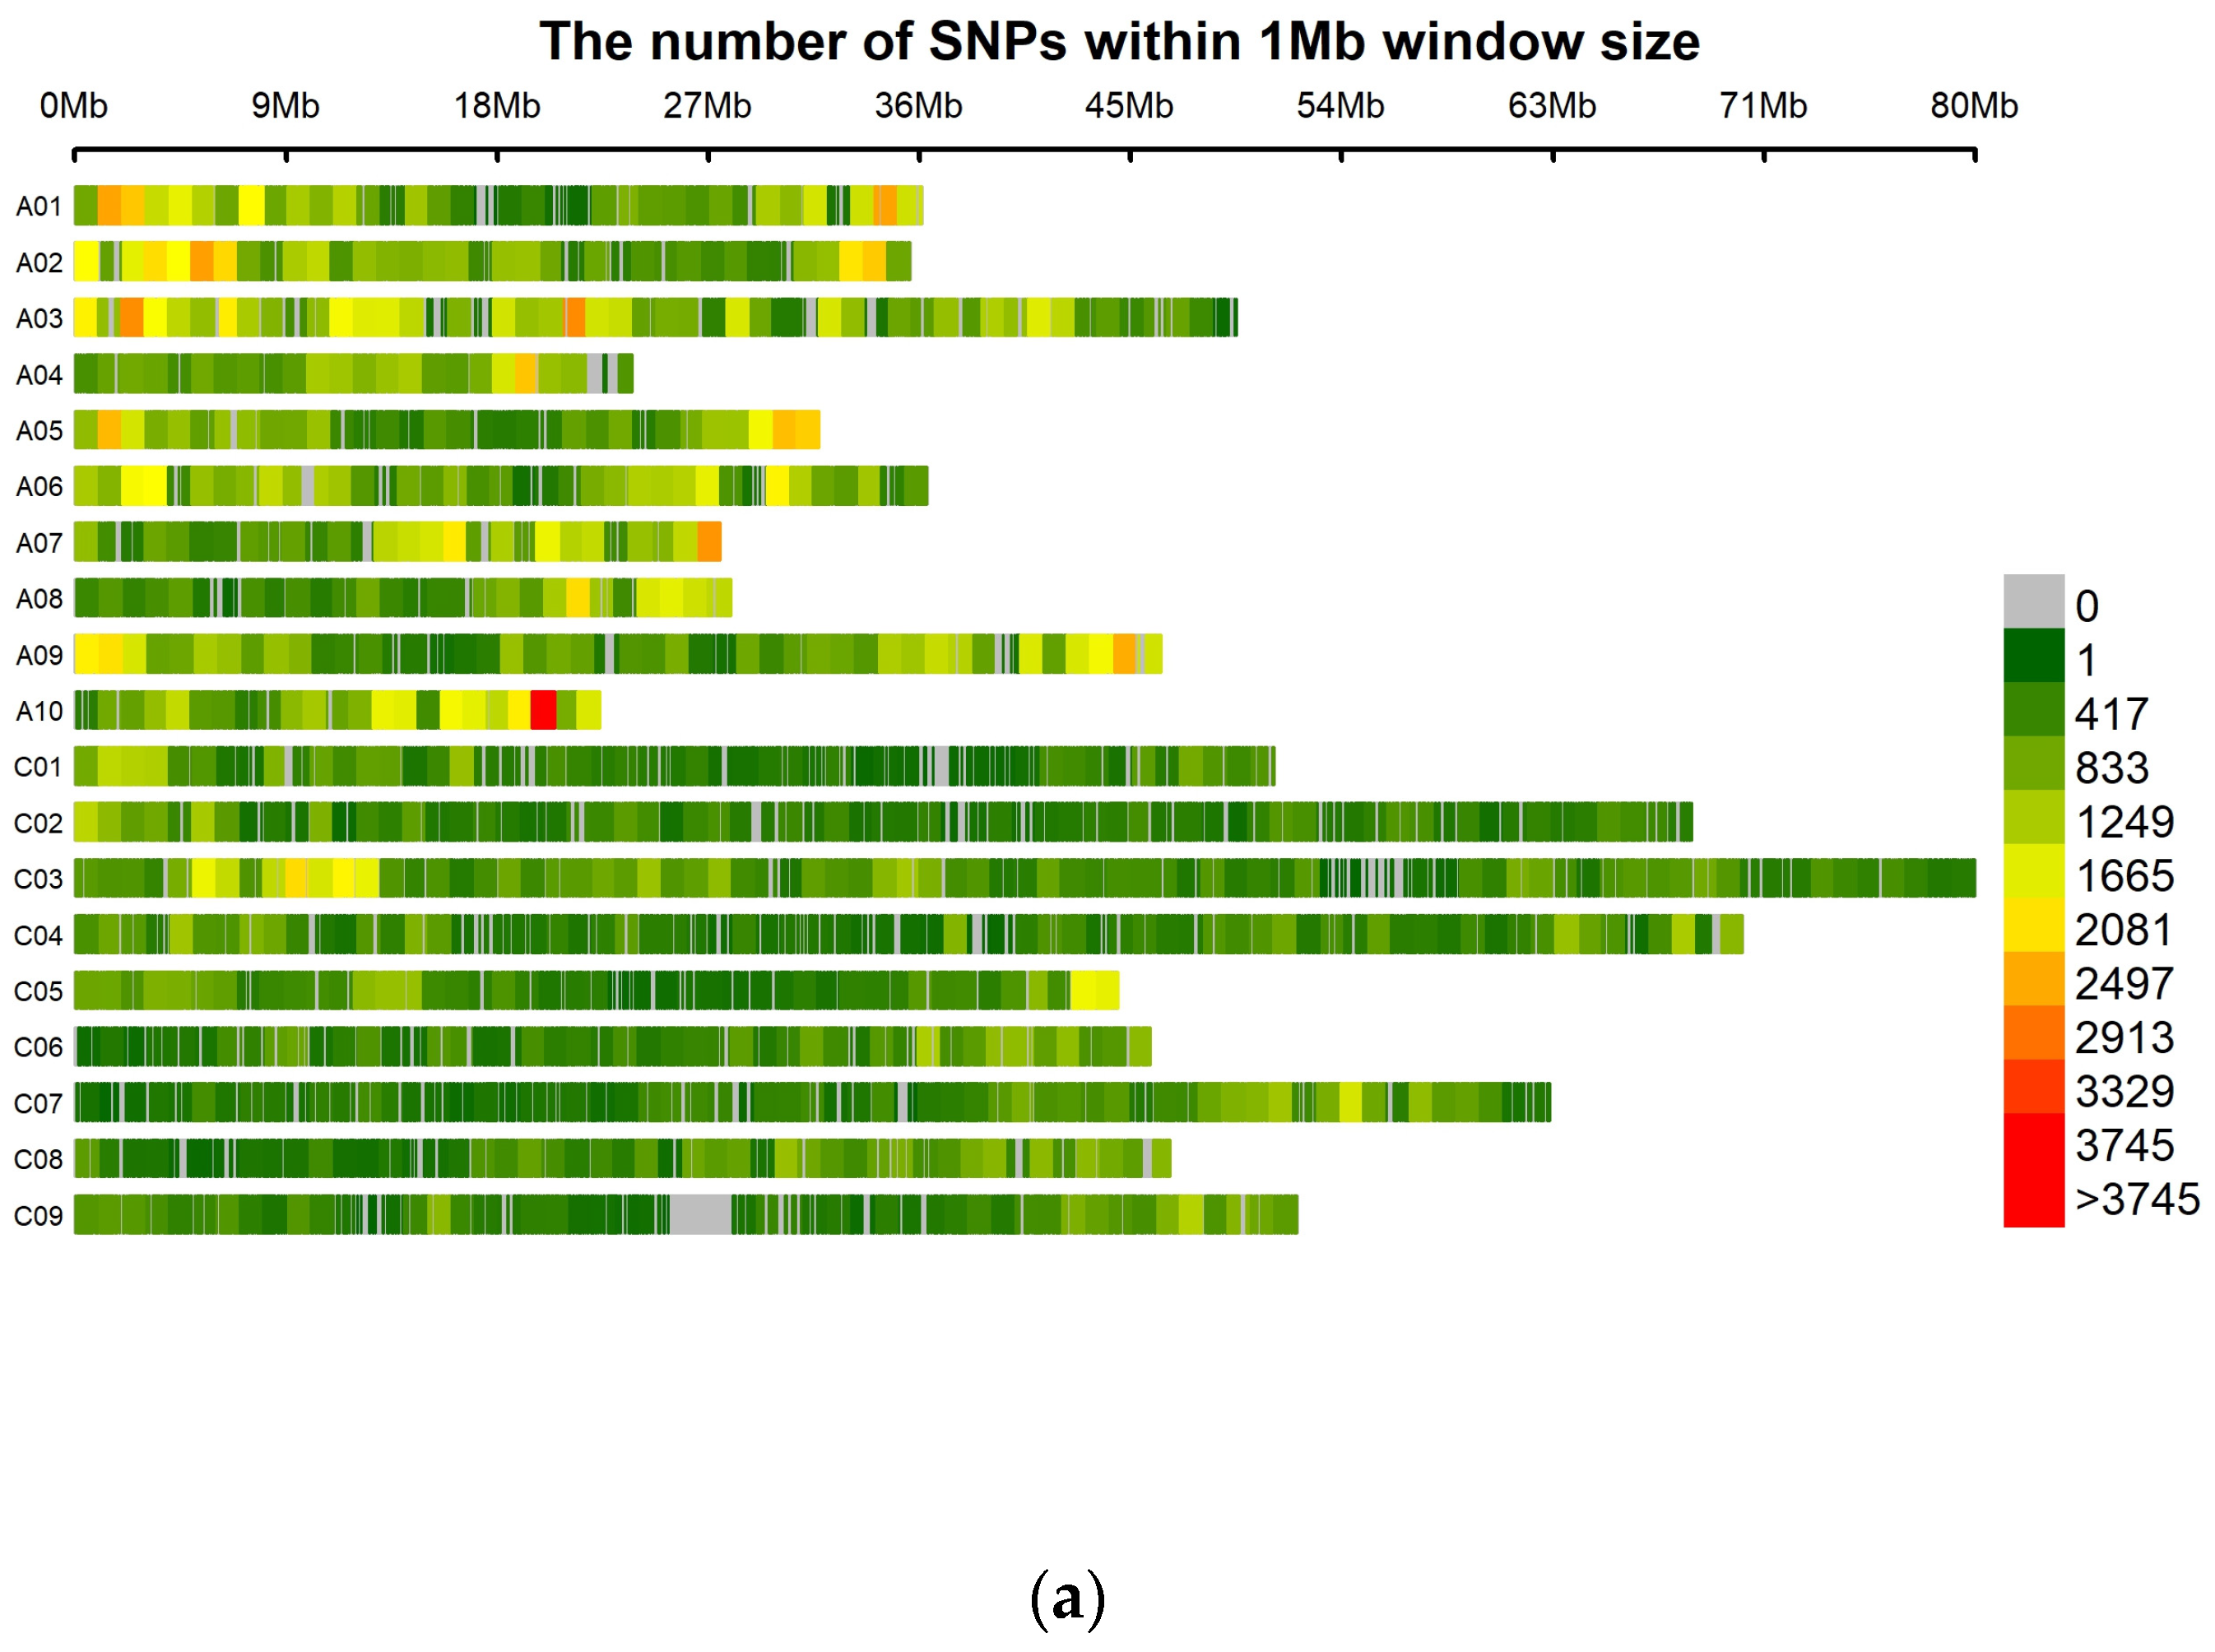
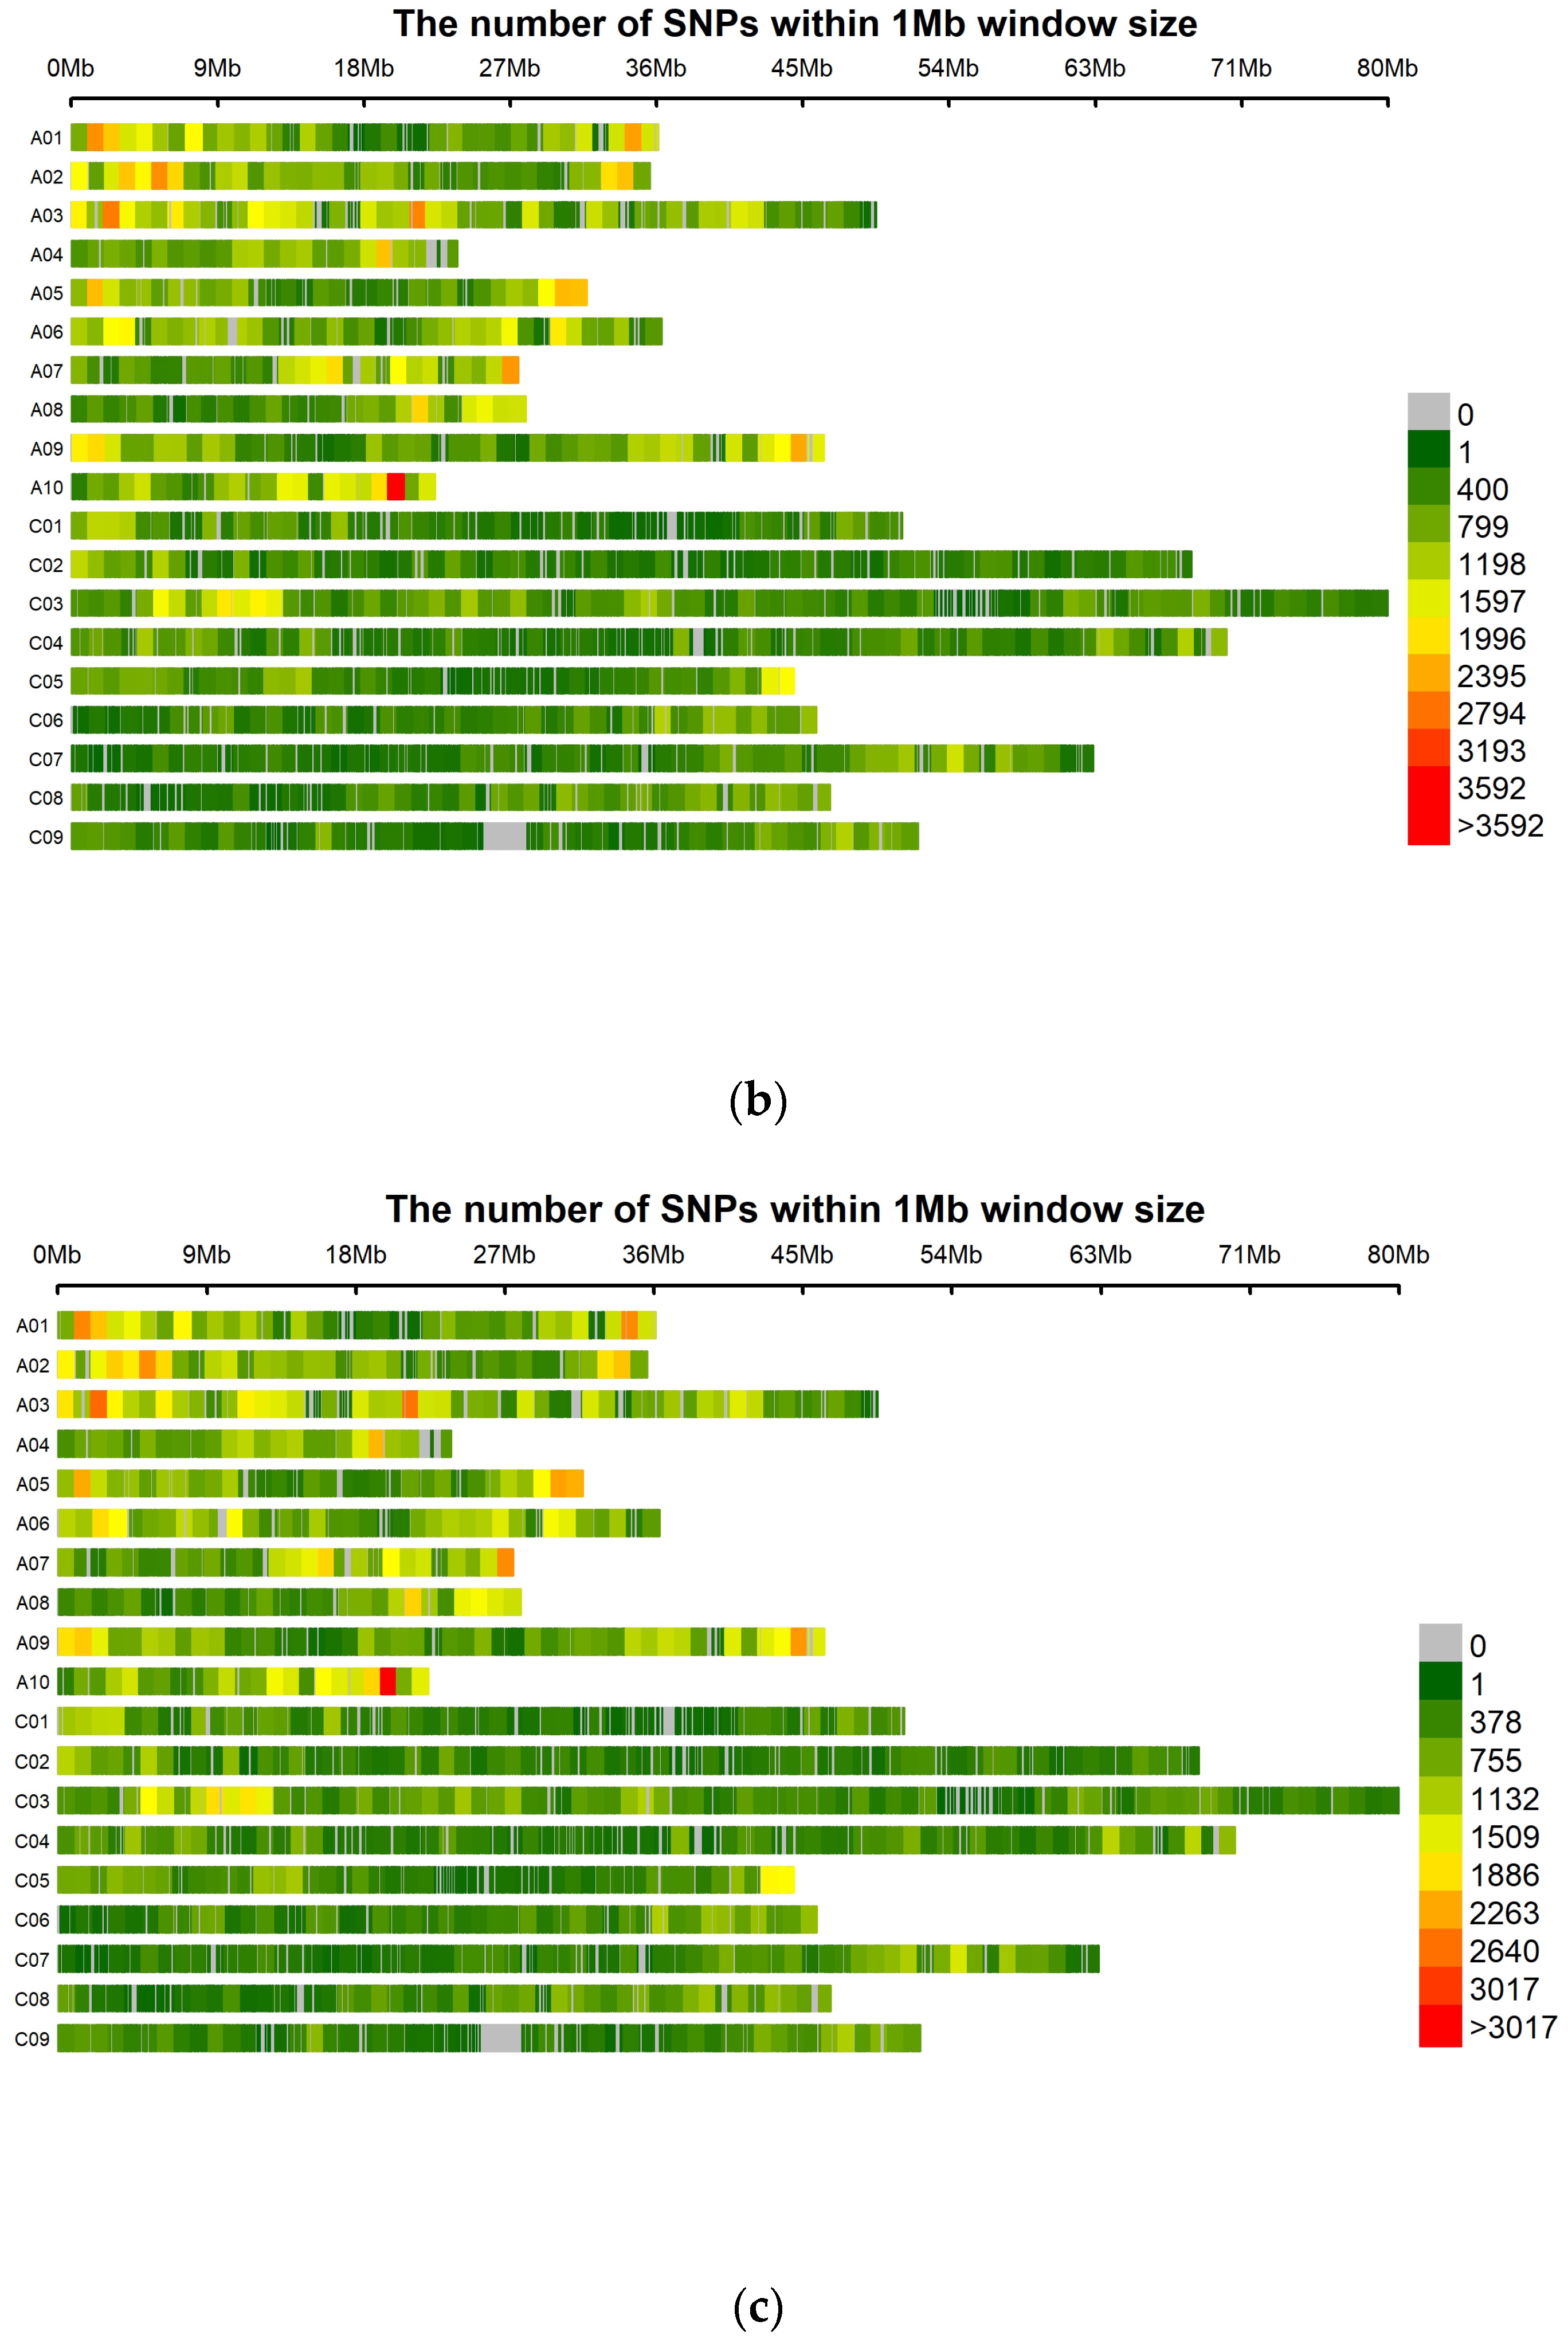
2.4. SNP Calling and Marker Distribution
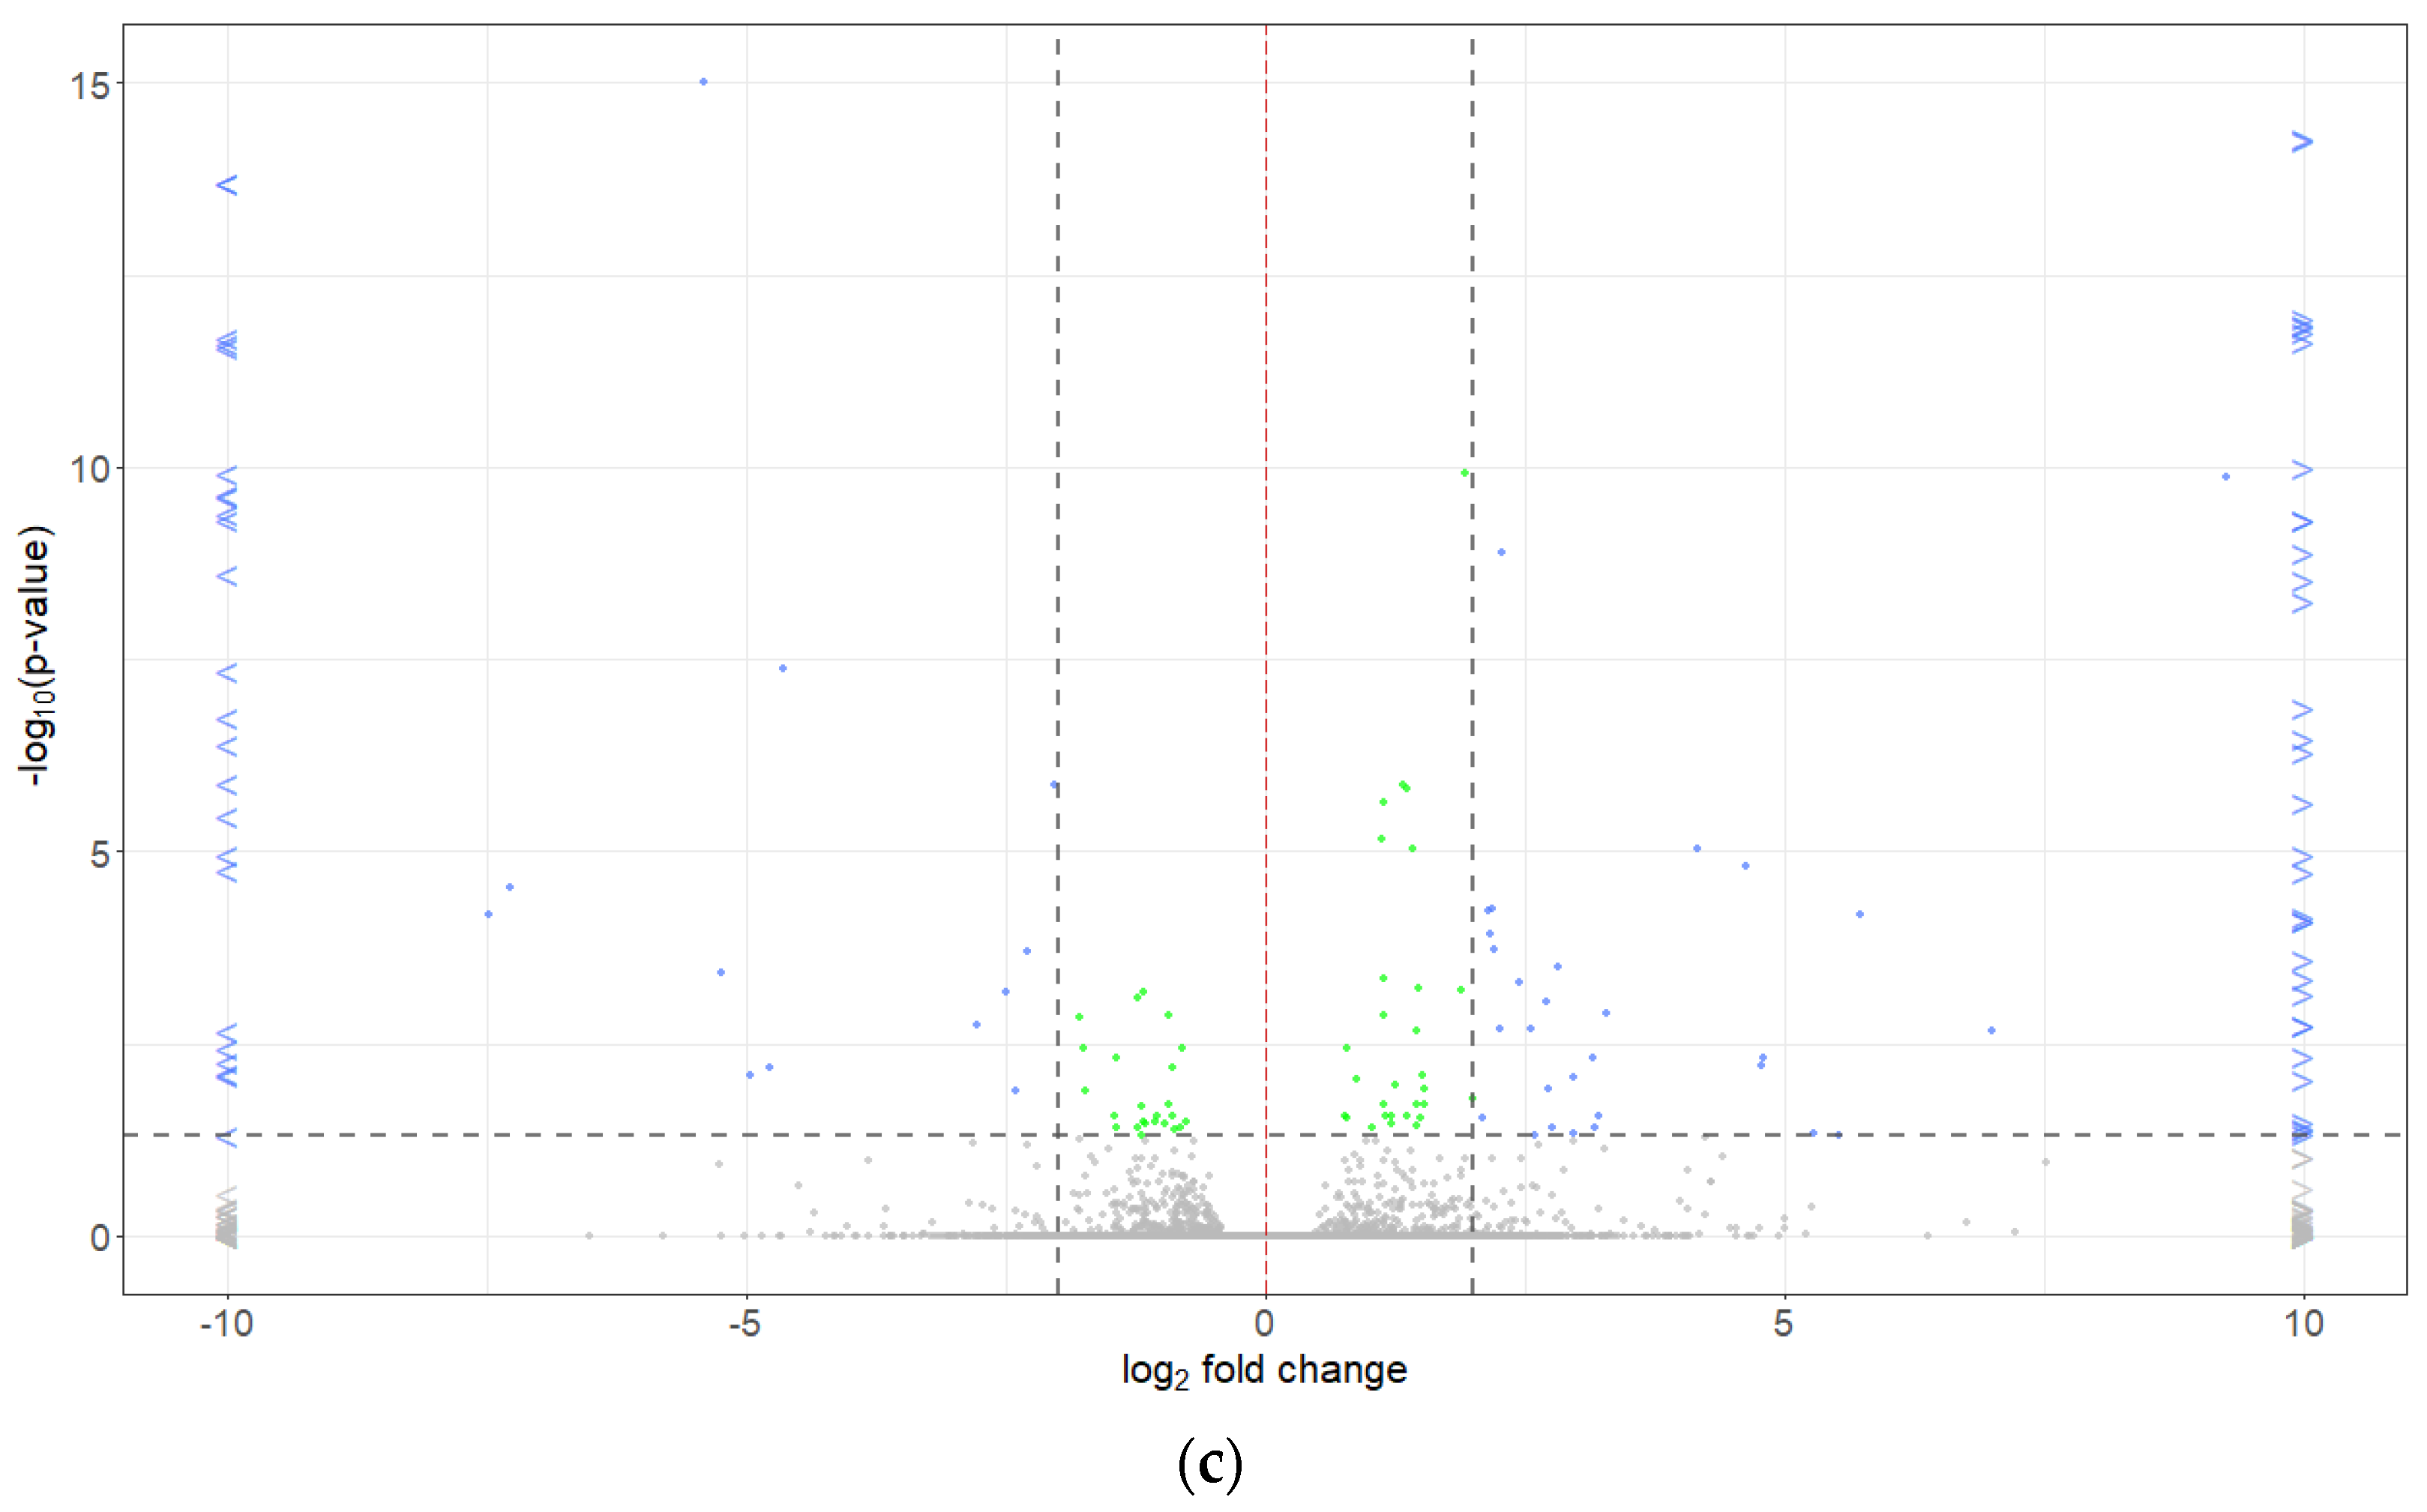
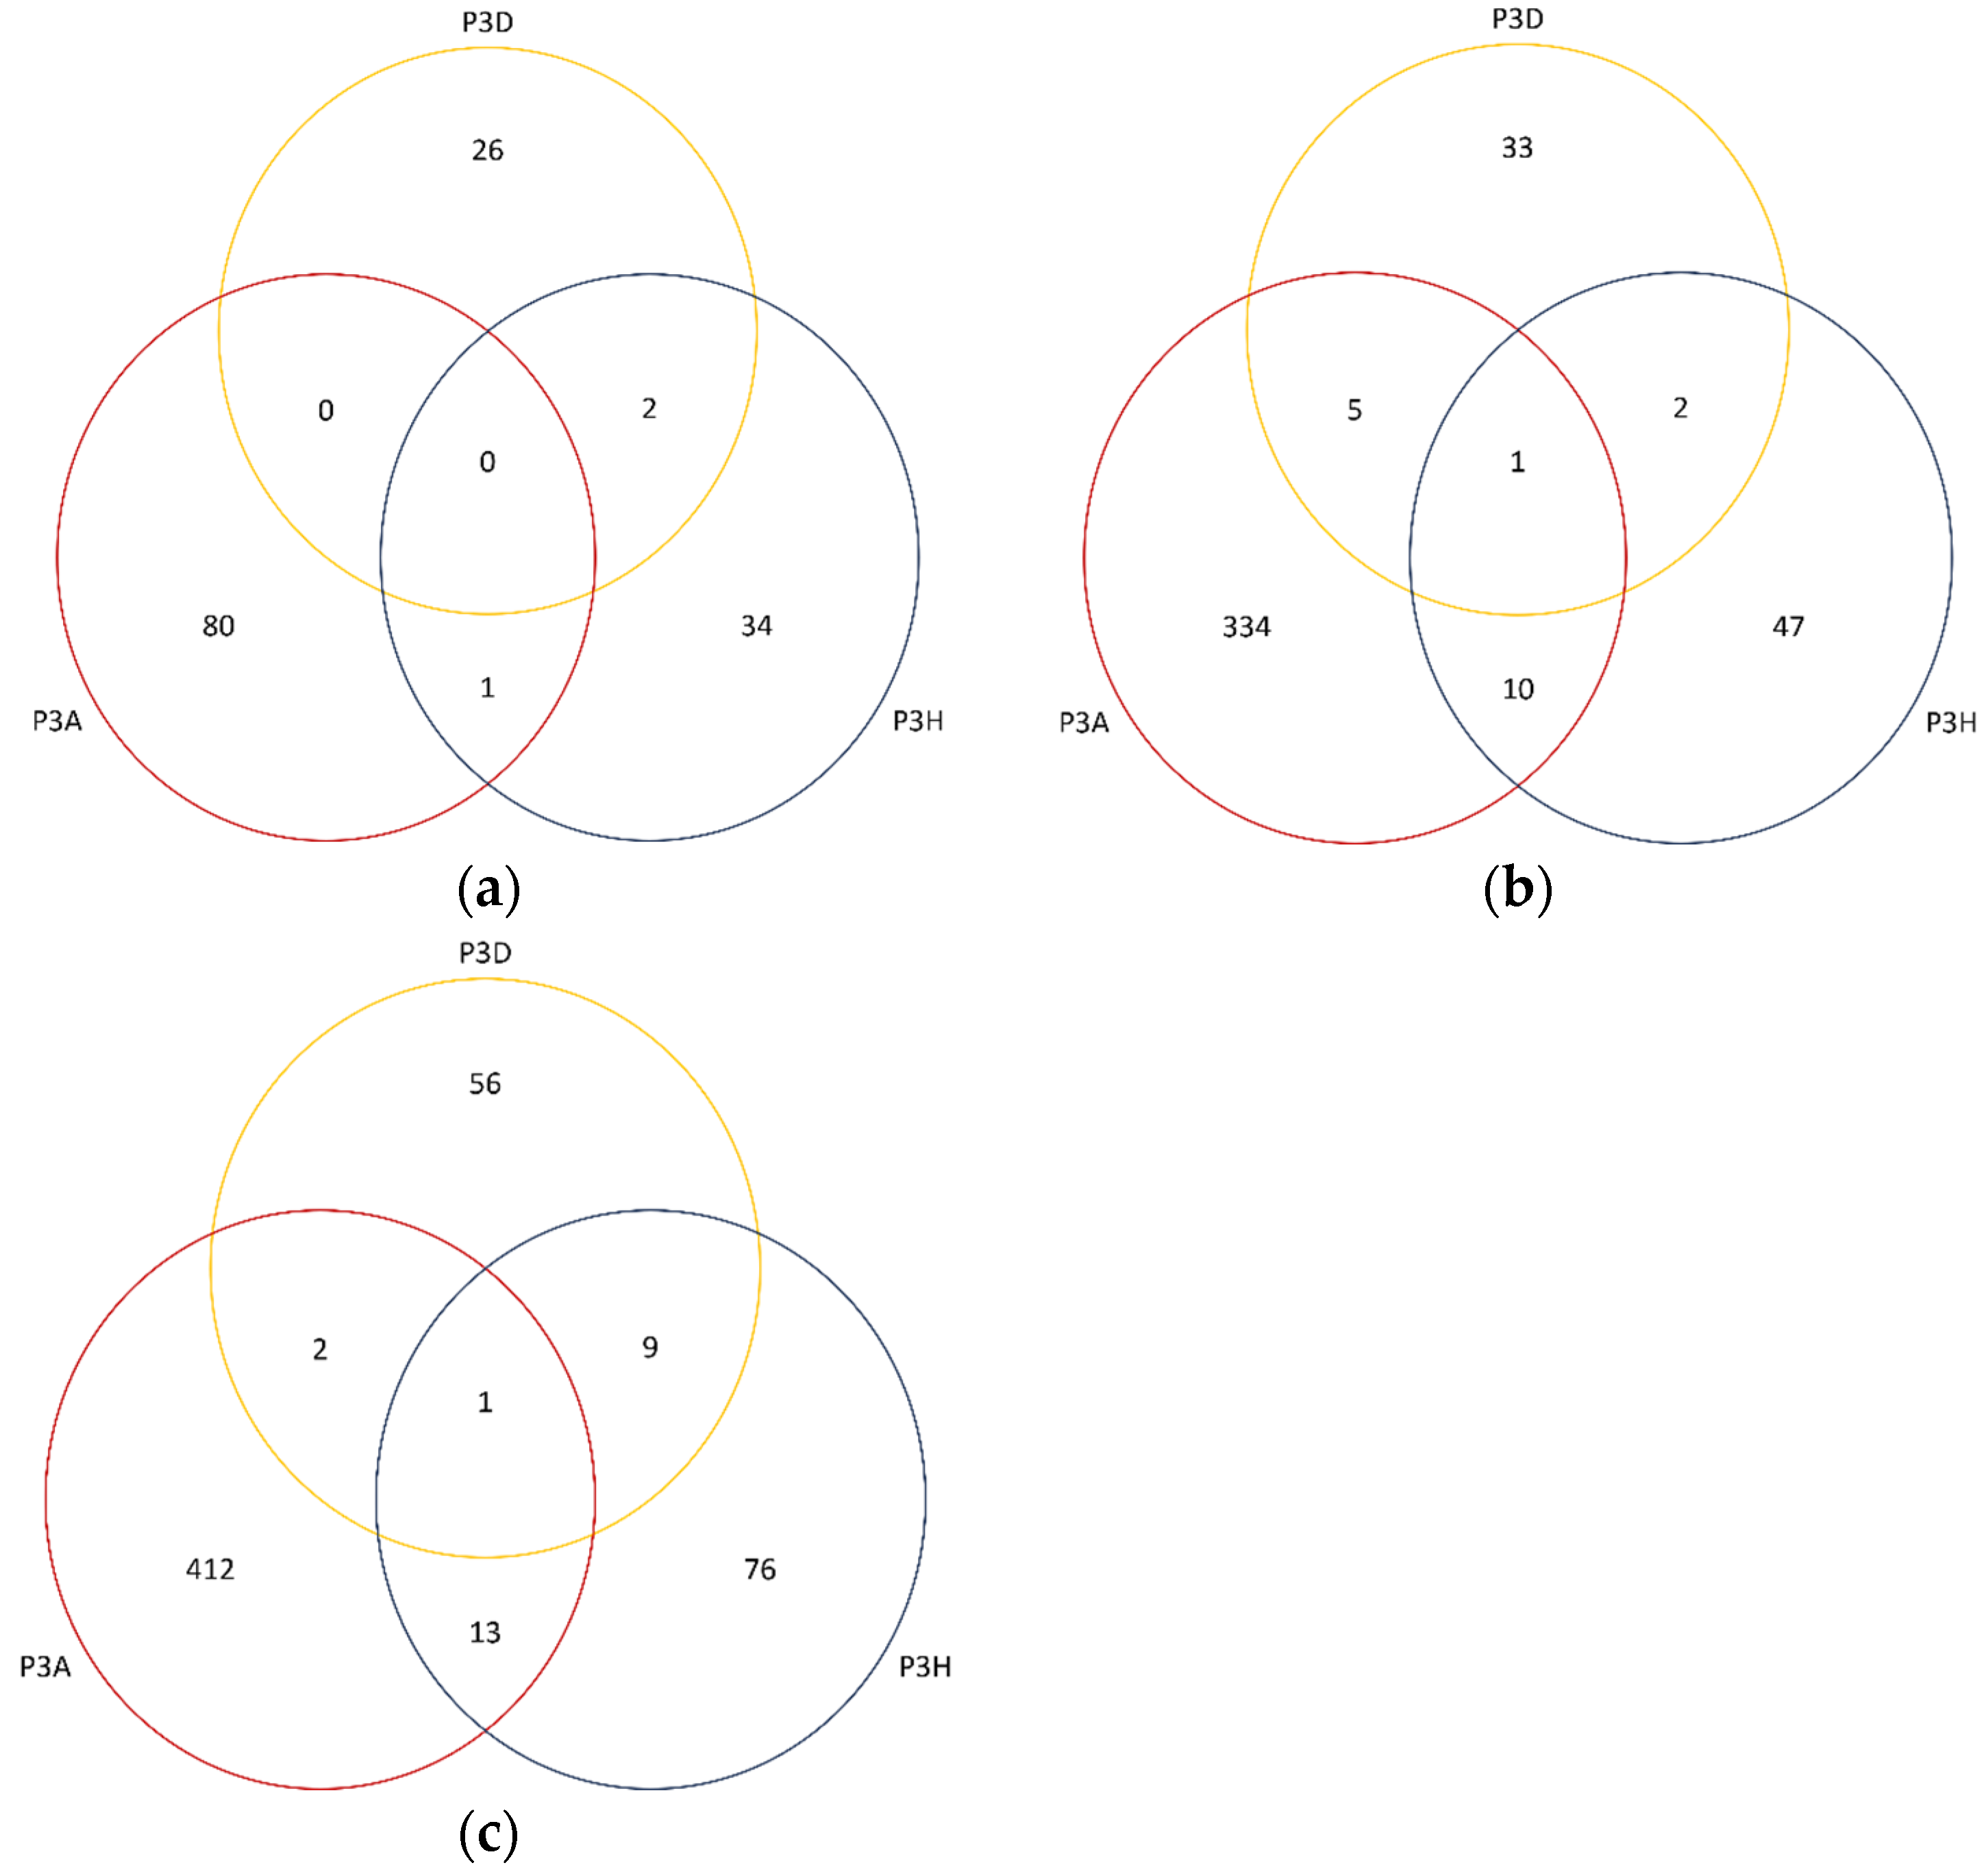
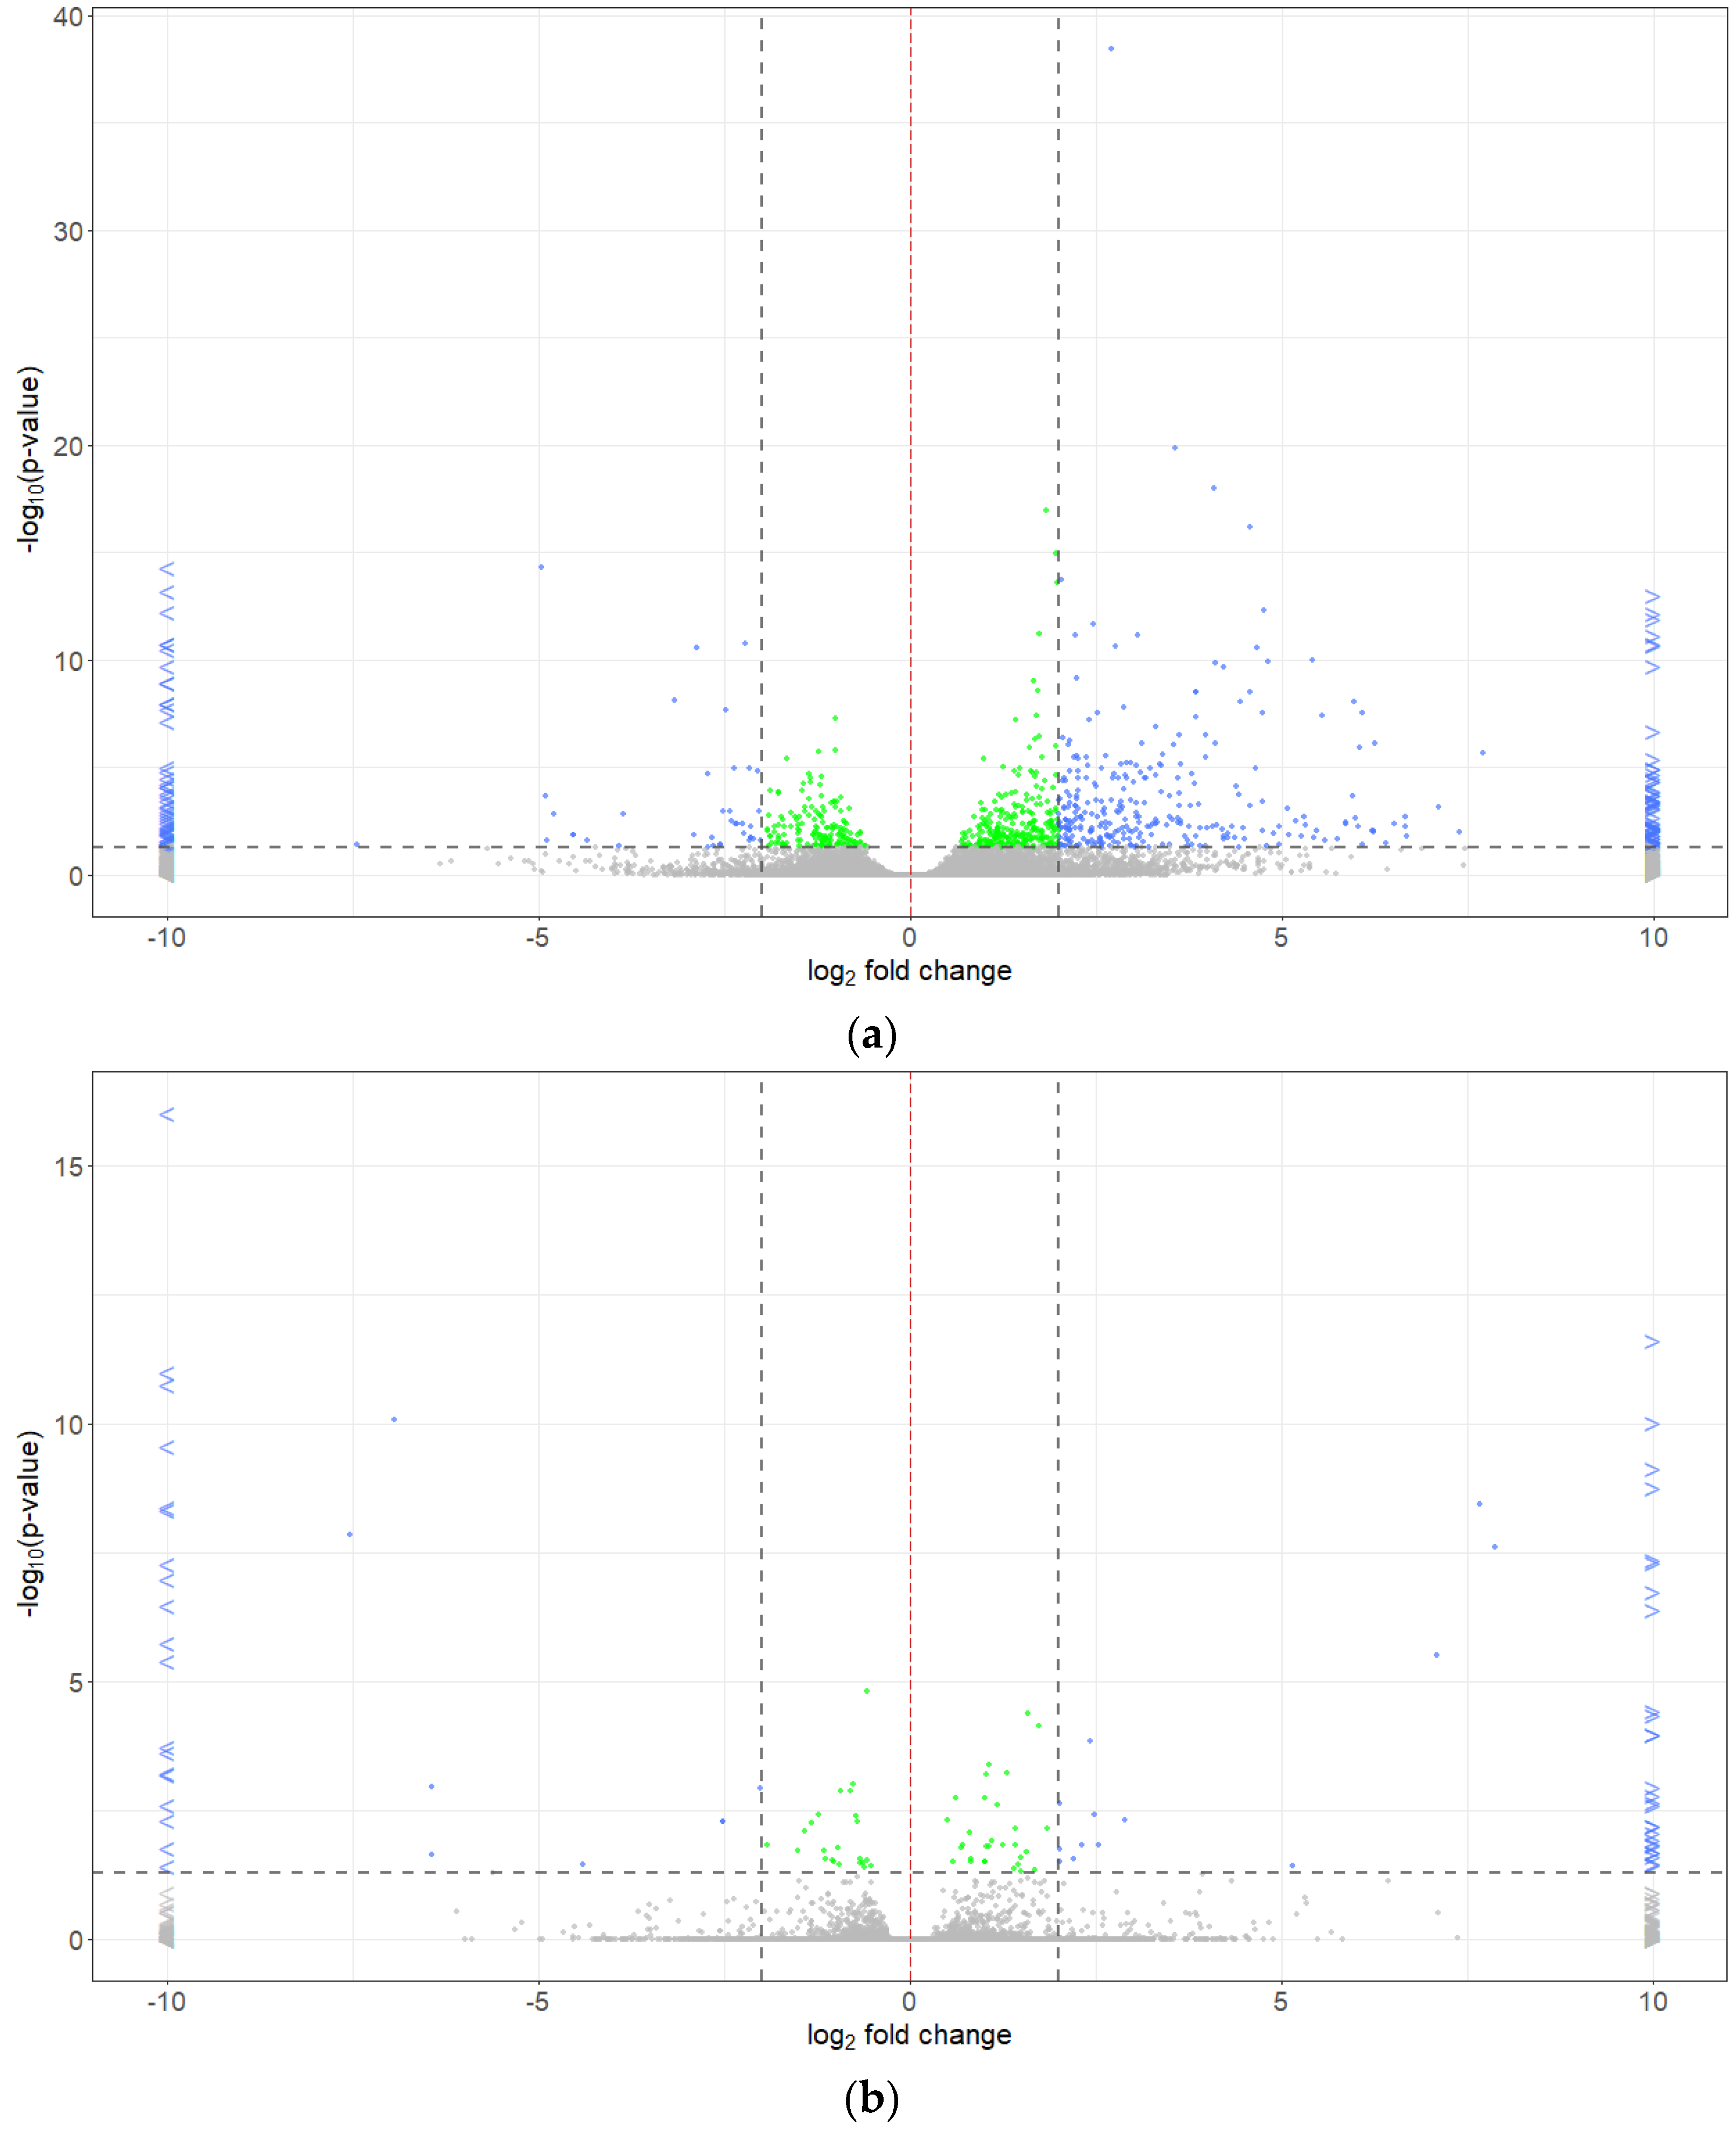
2.5. Differentially Expressed Genes
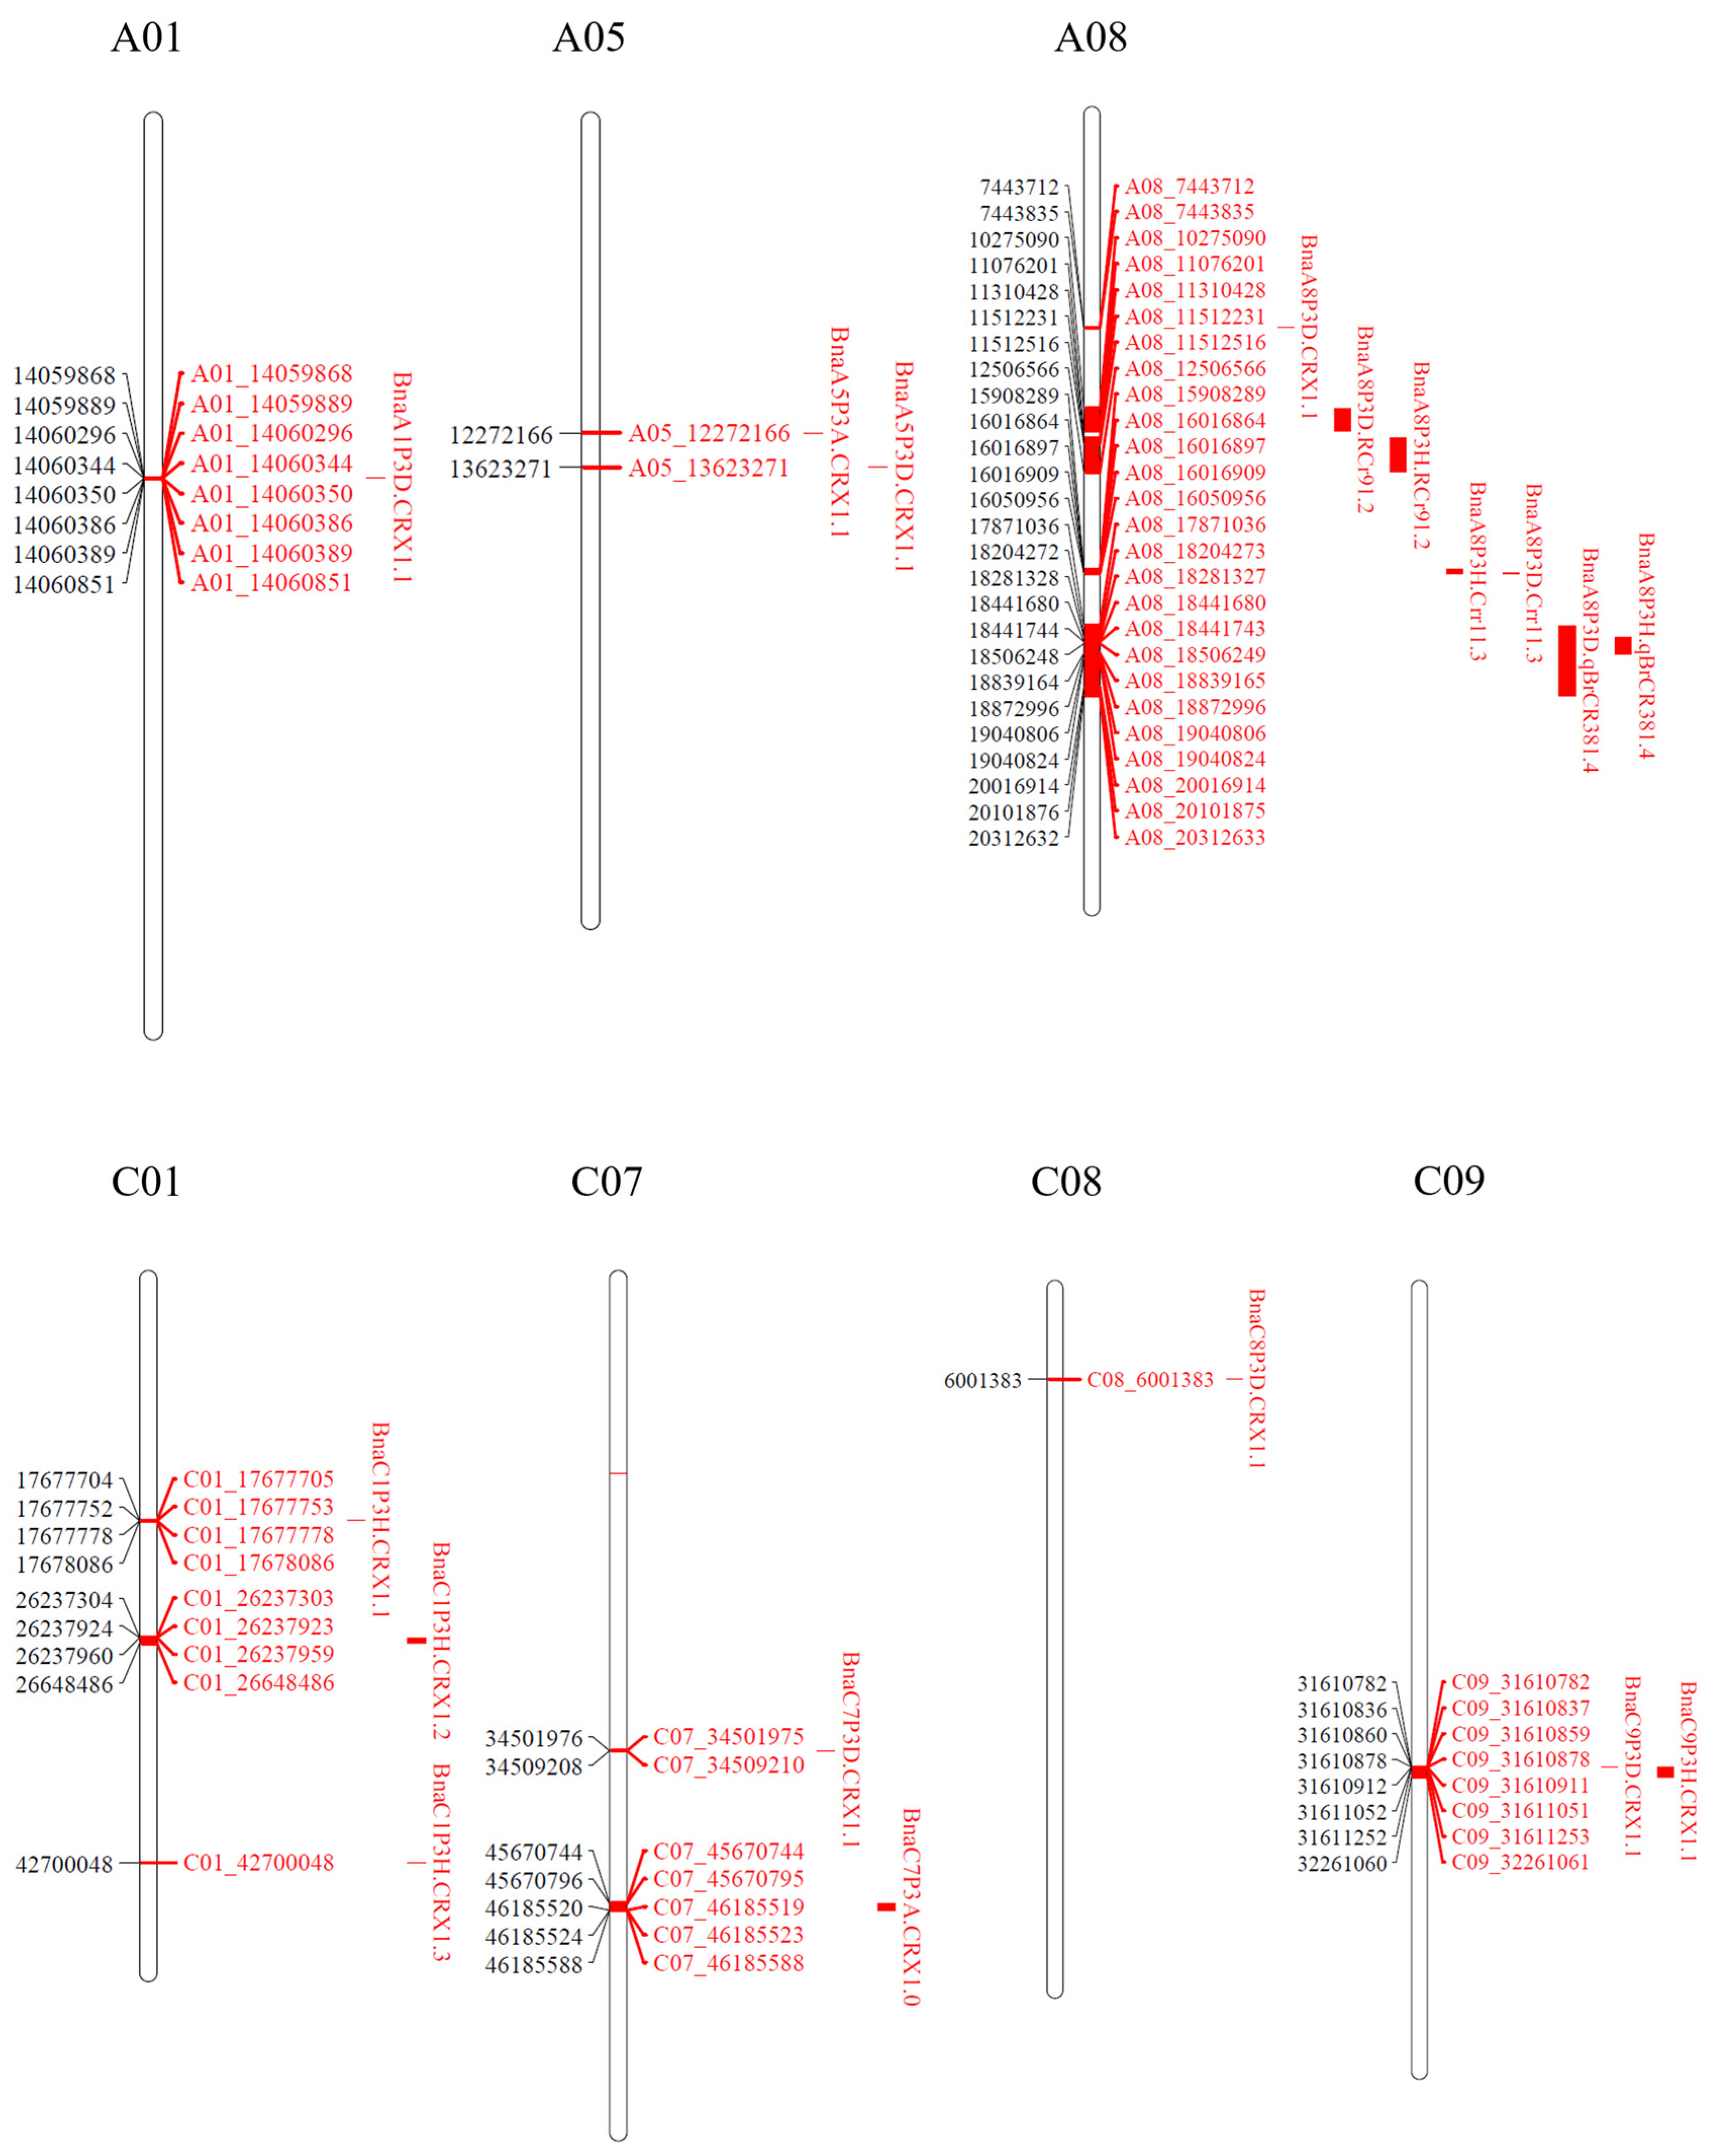
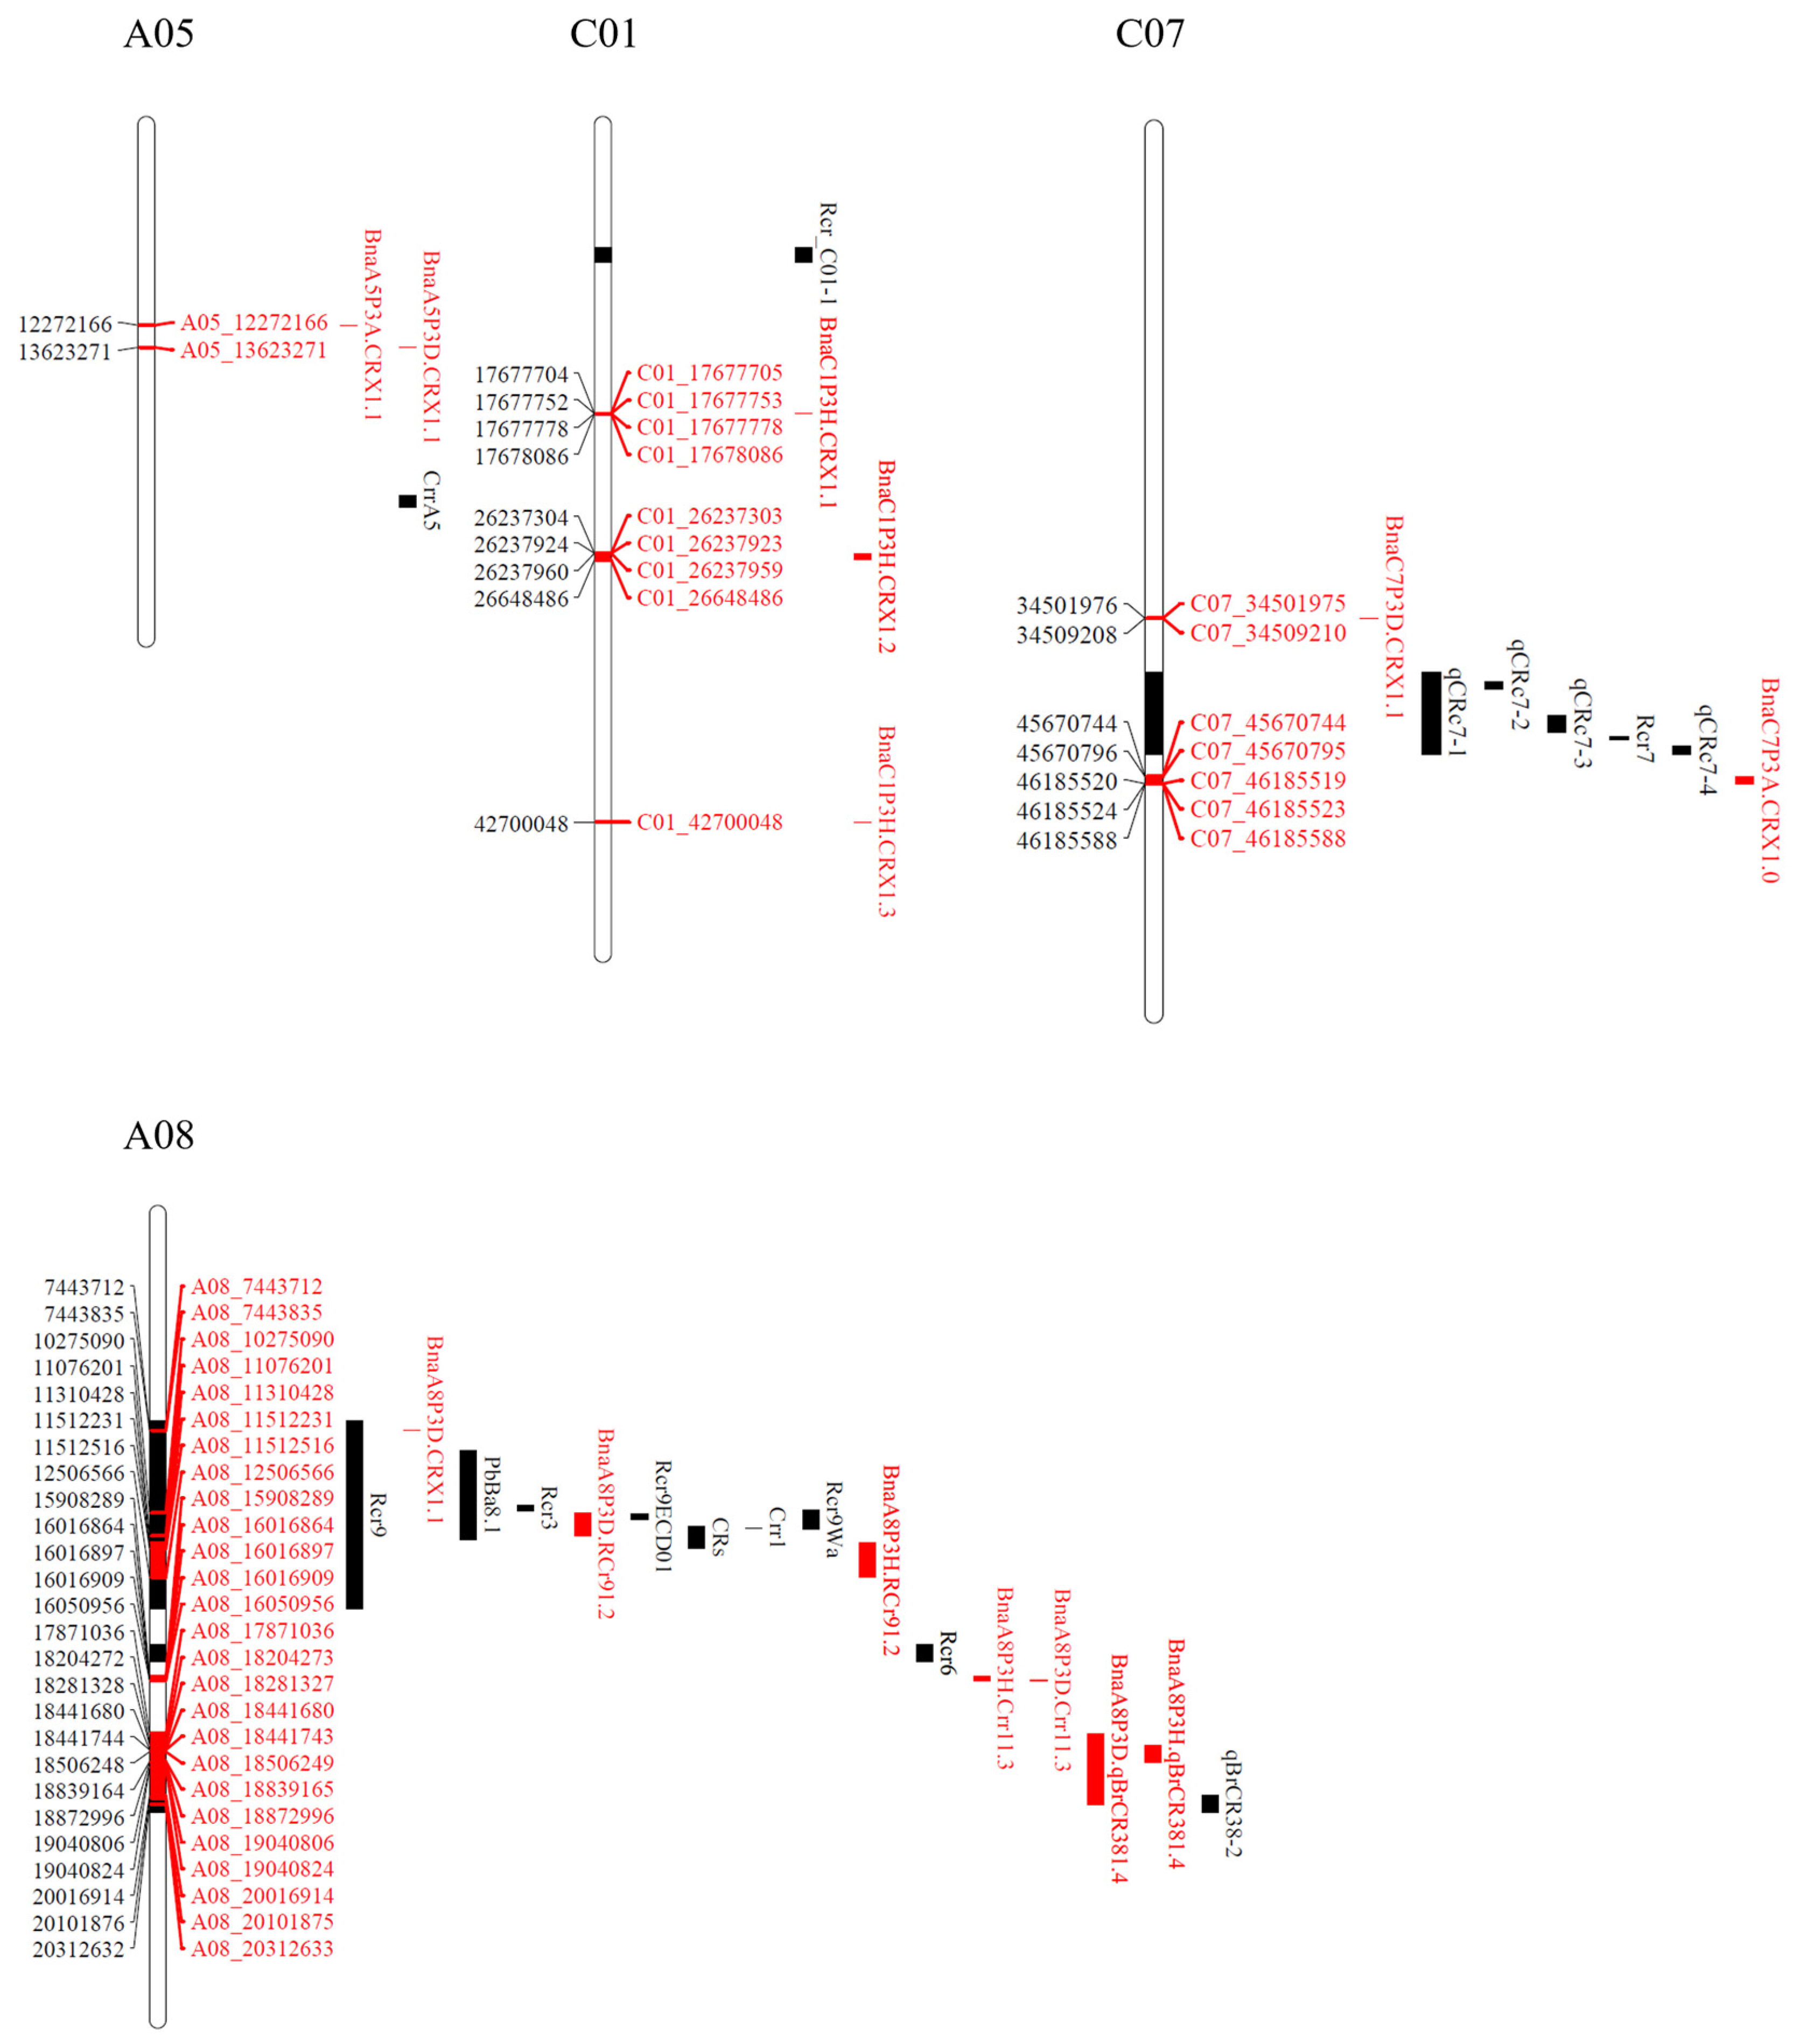
2.6. Identification of QTLs Associated with Clubroot Resistance
2.7. Genes Identified in Clubroot Resistance QTL Regions
2.8. DEGs Identified in Clubroot Resistance QTL Regions
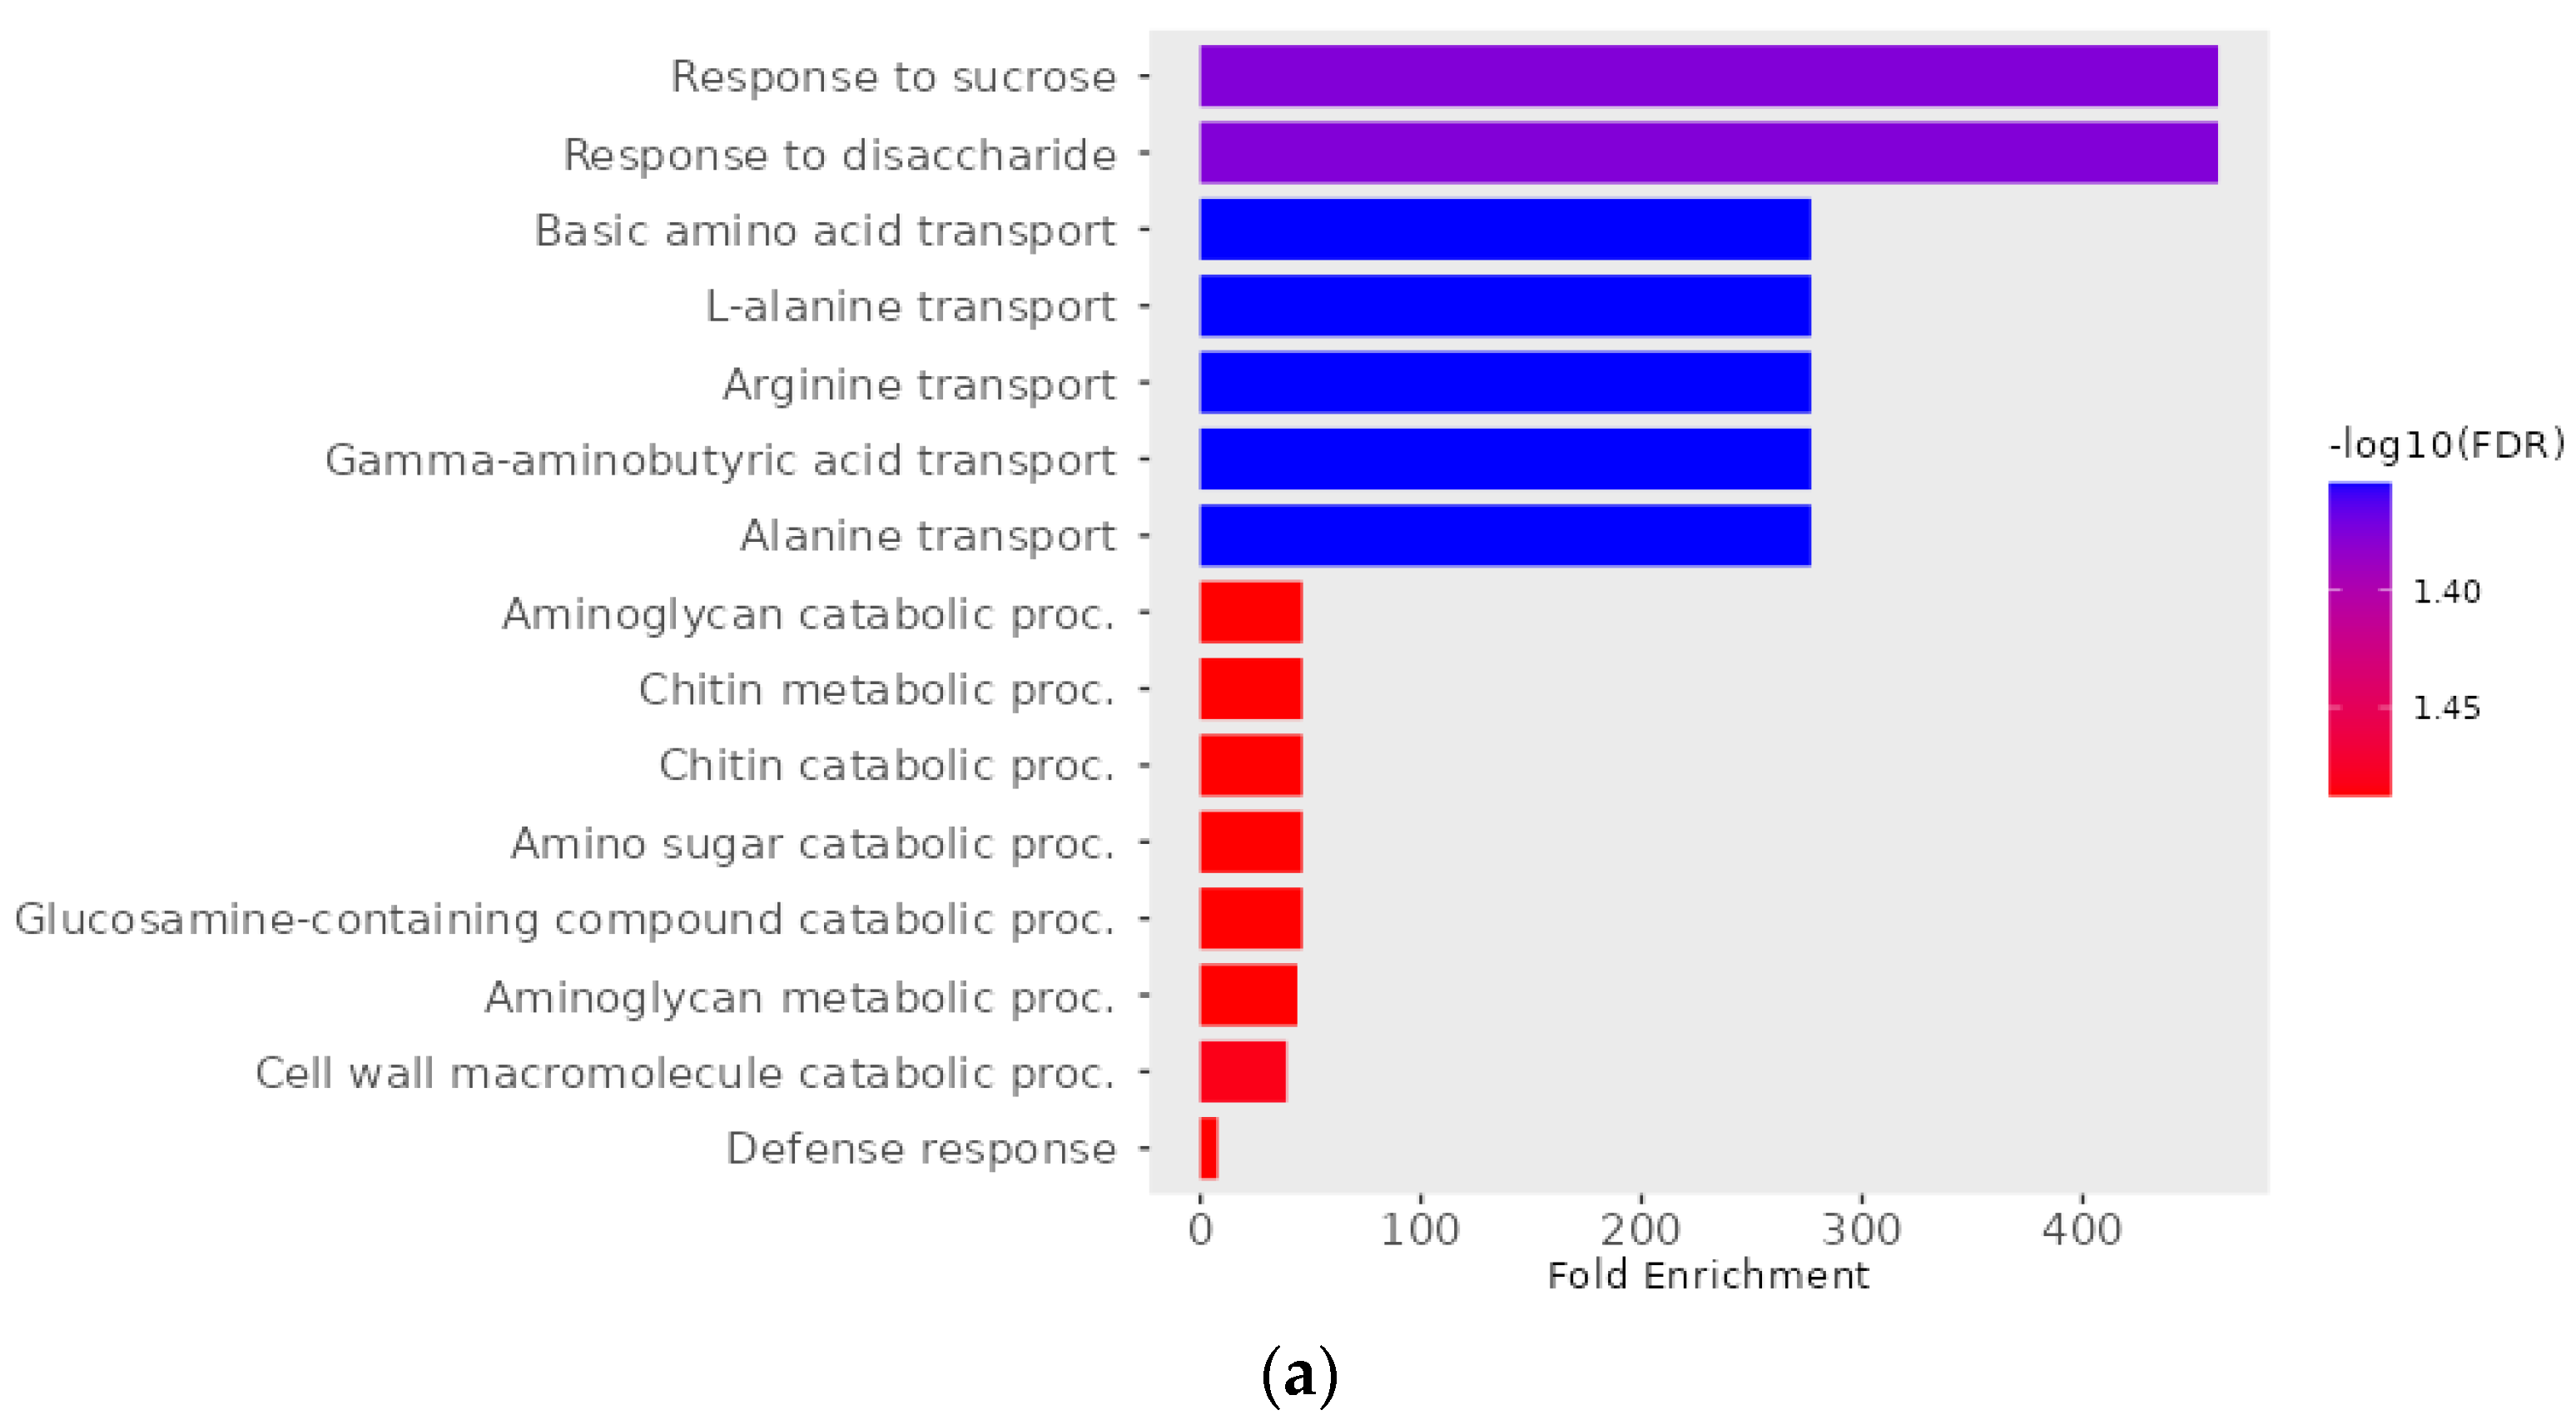
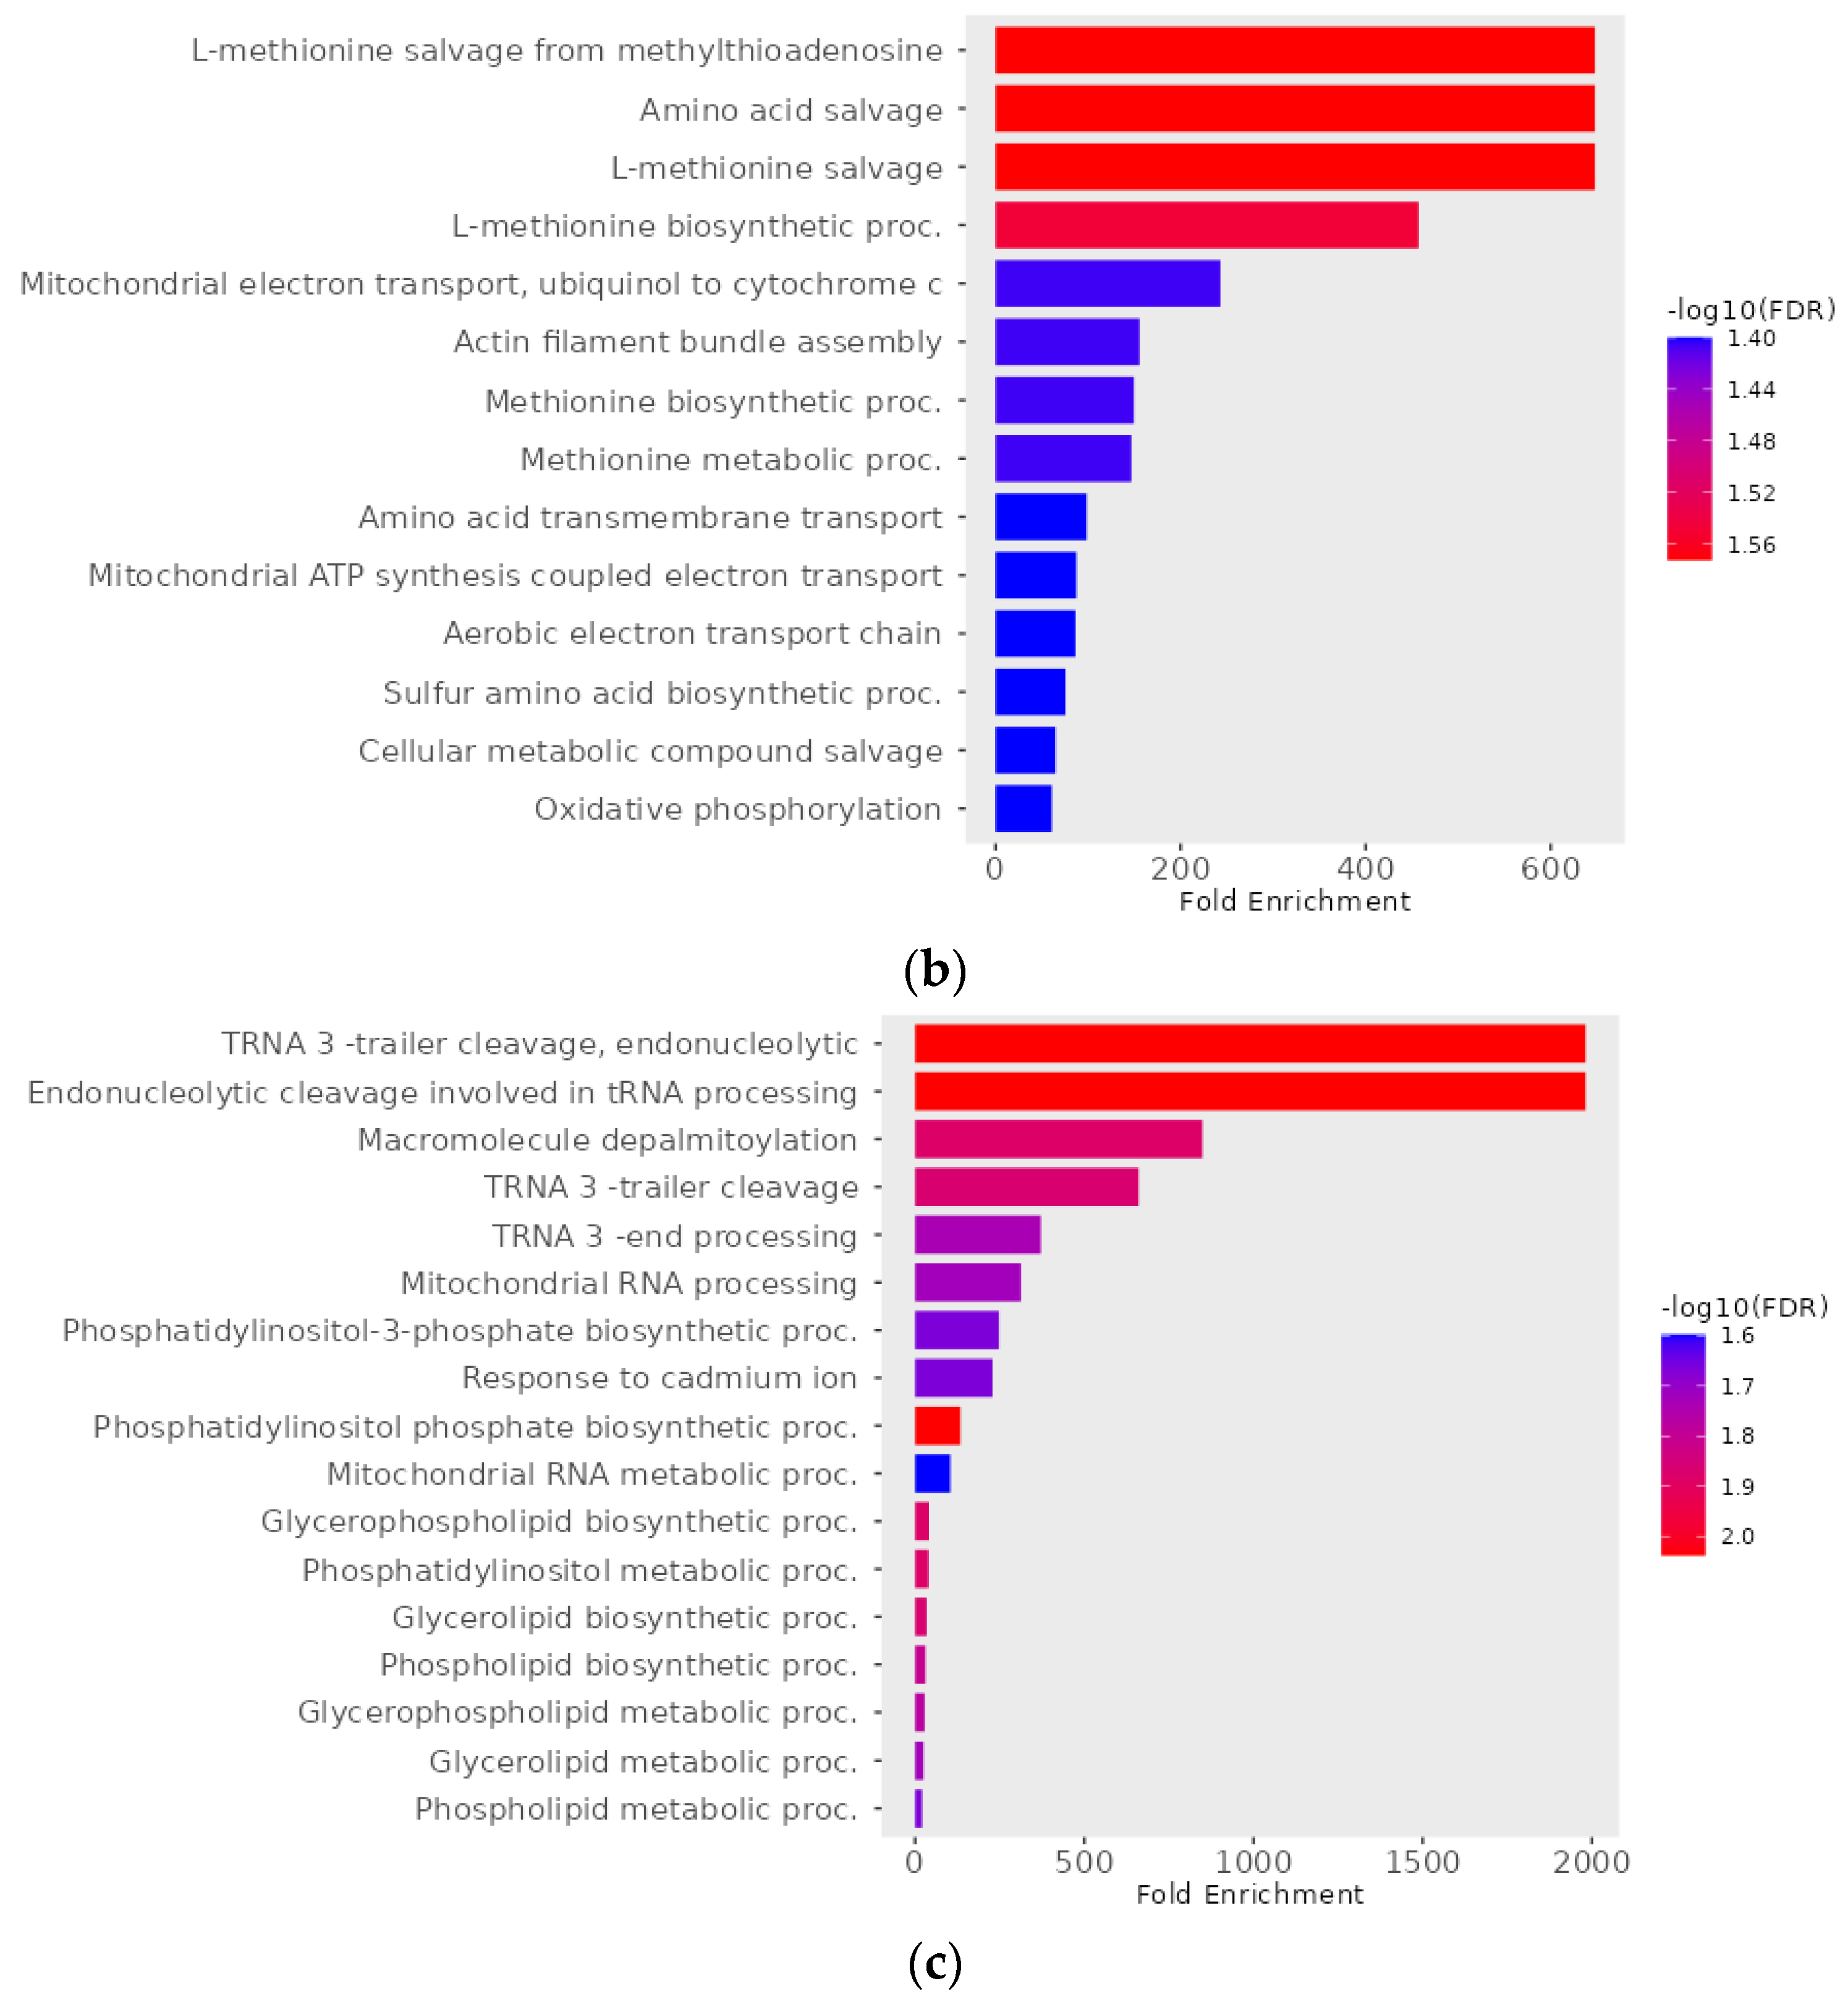
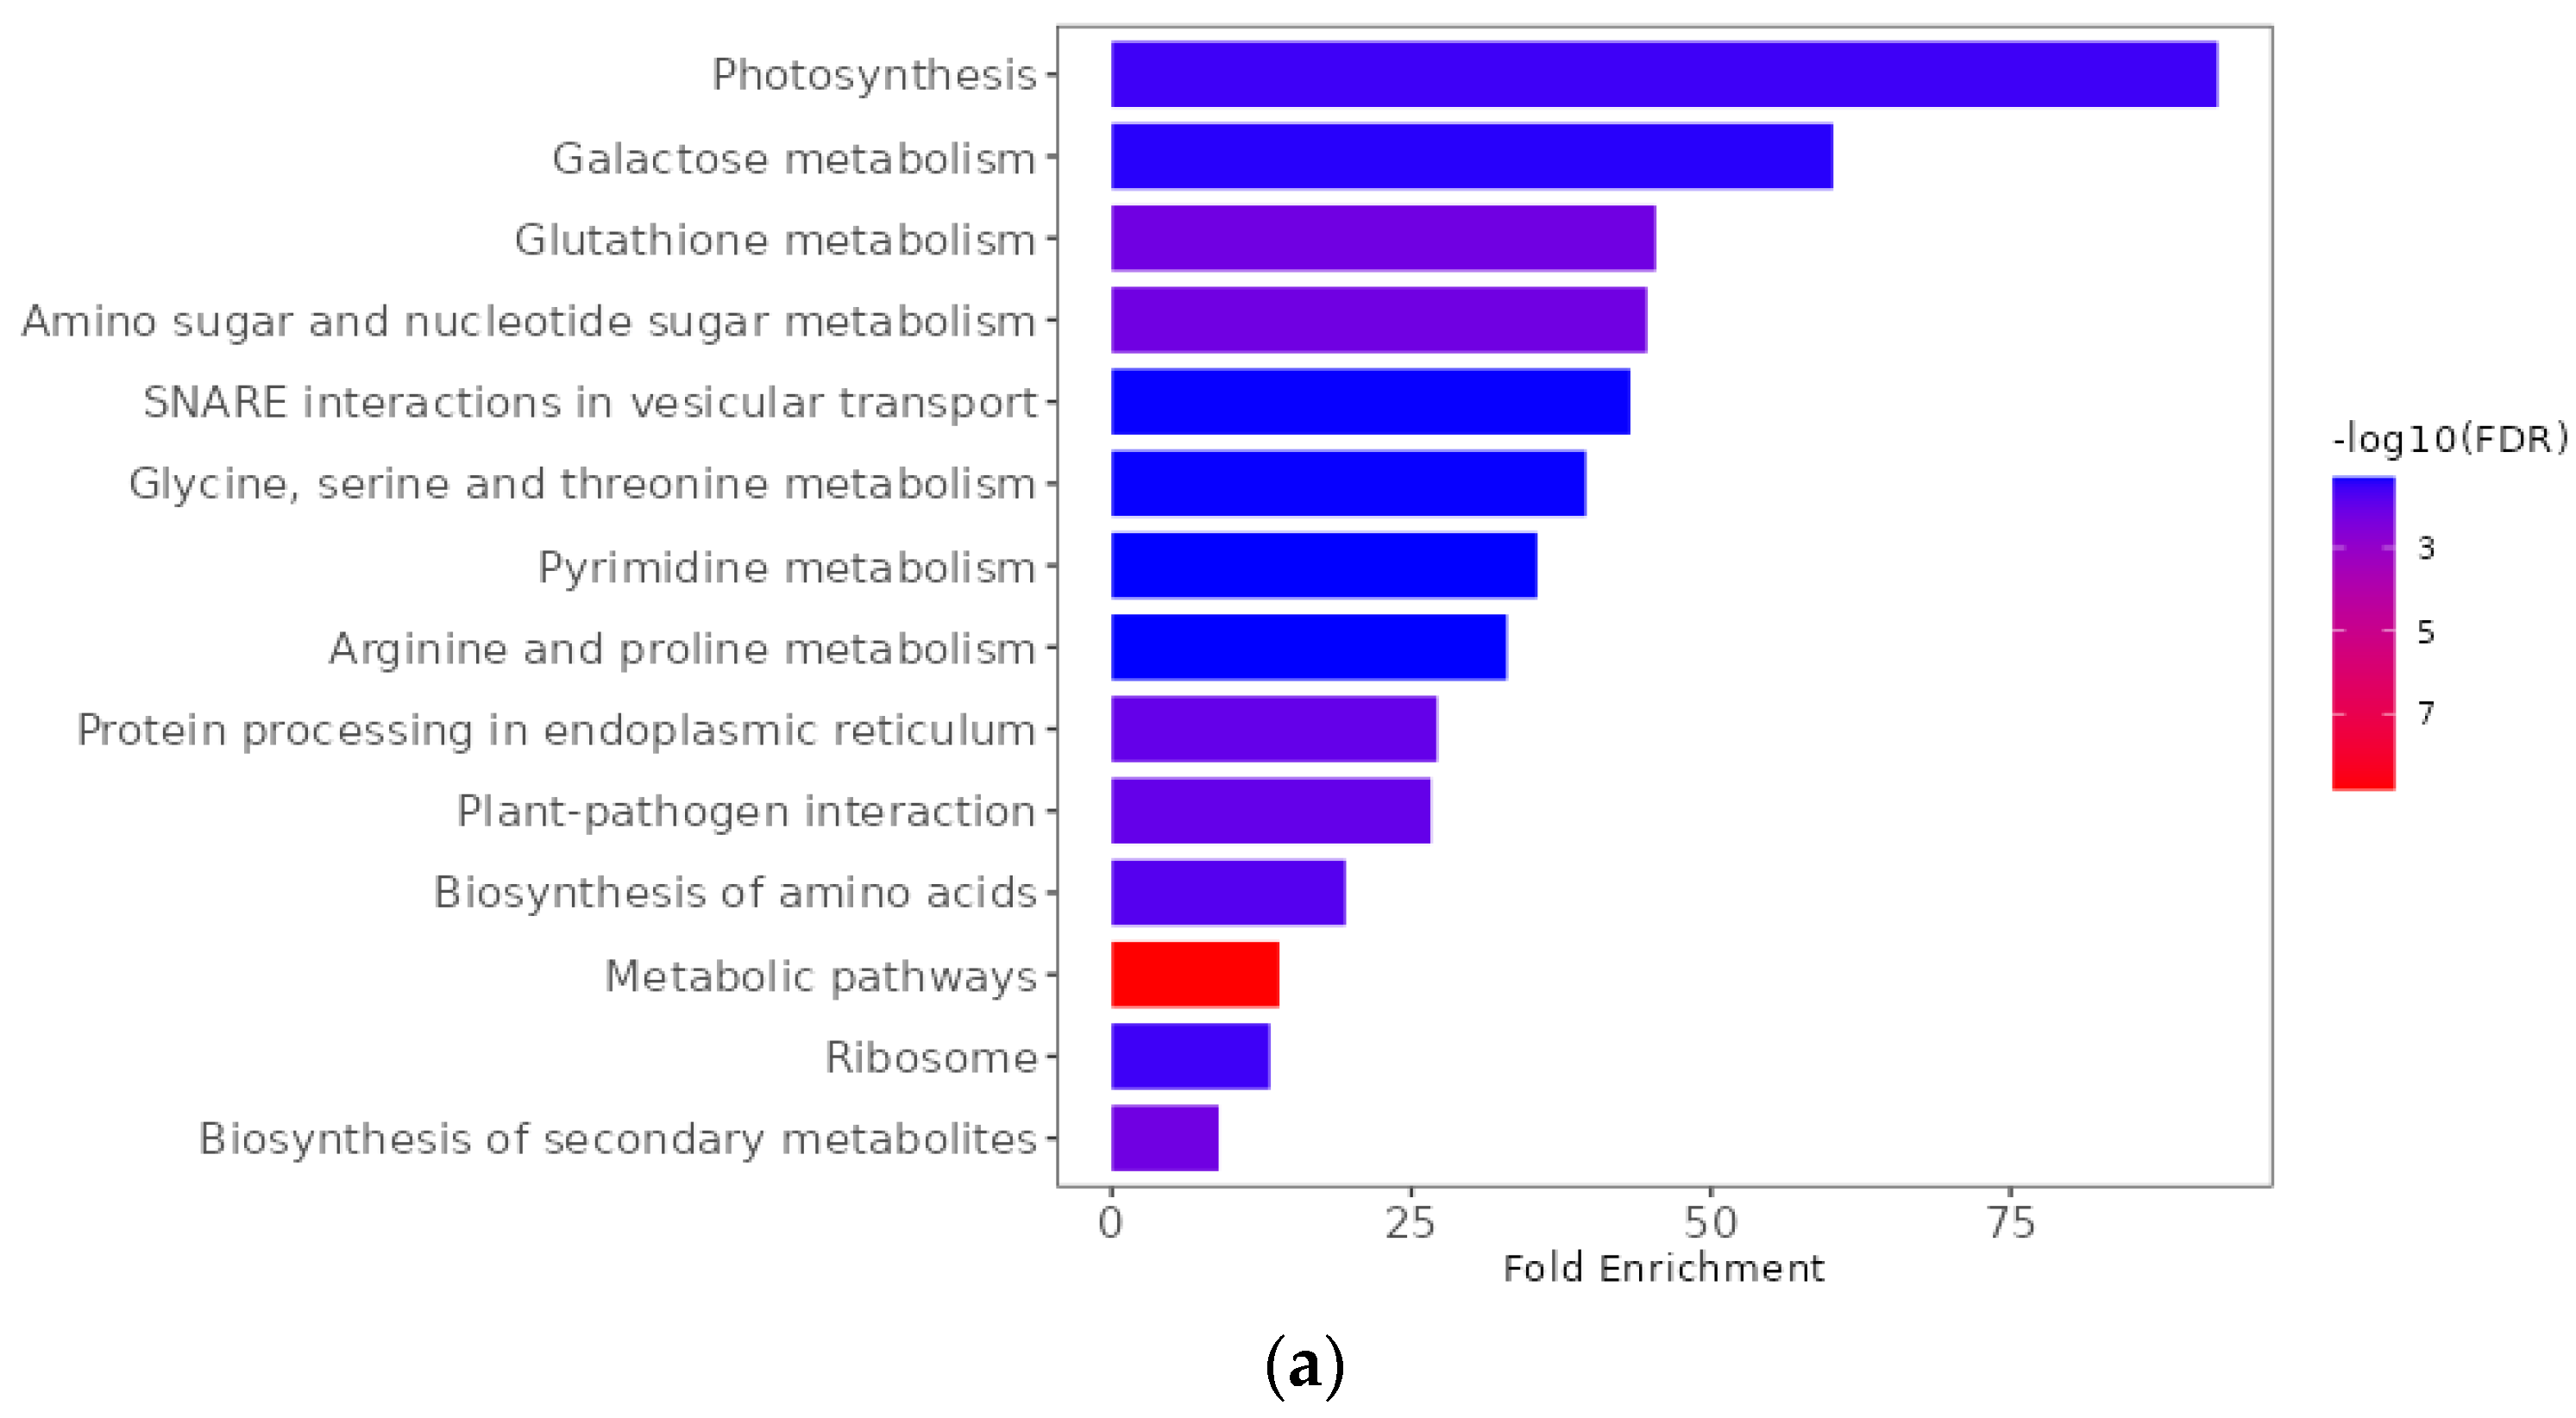
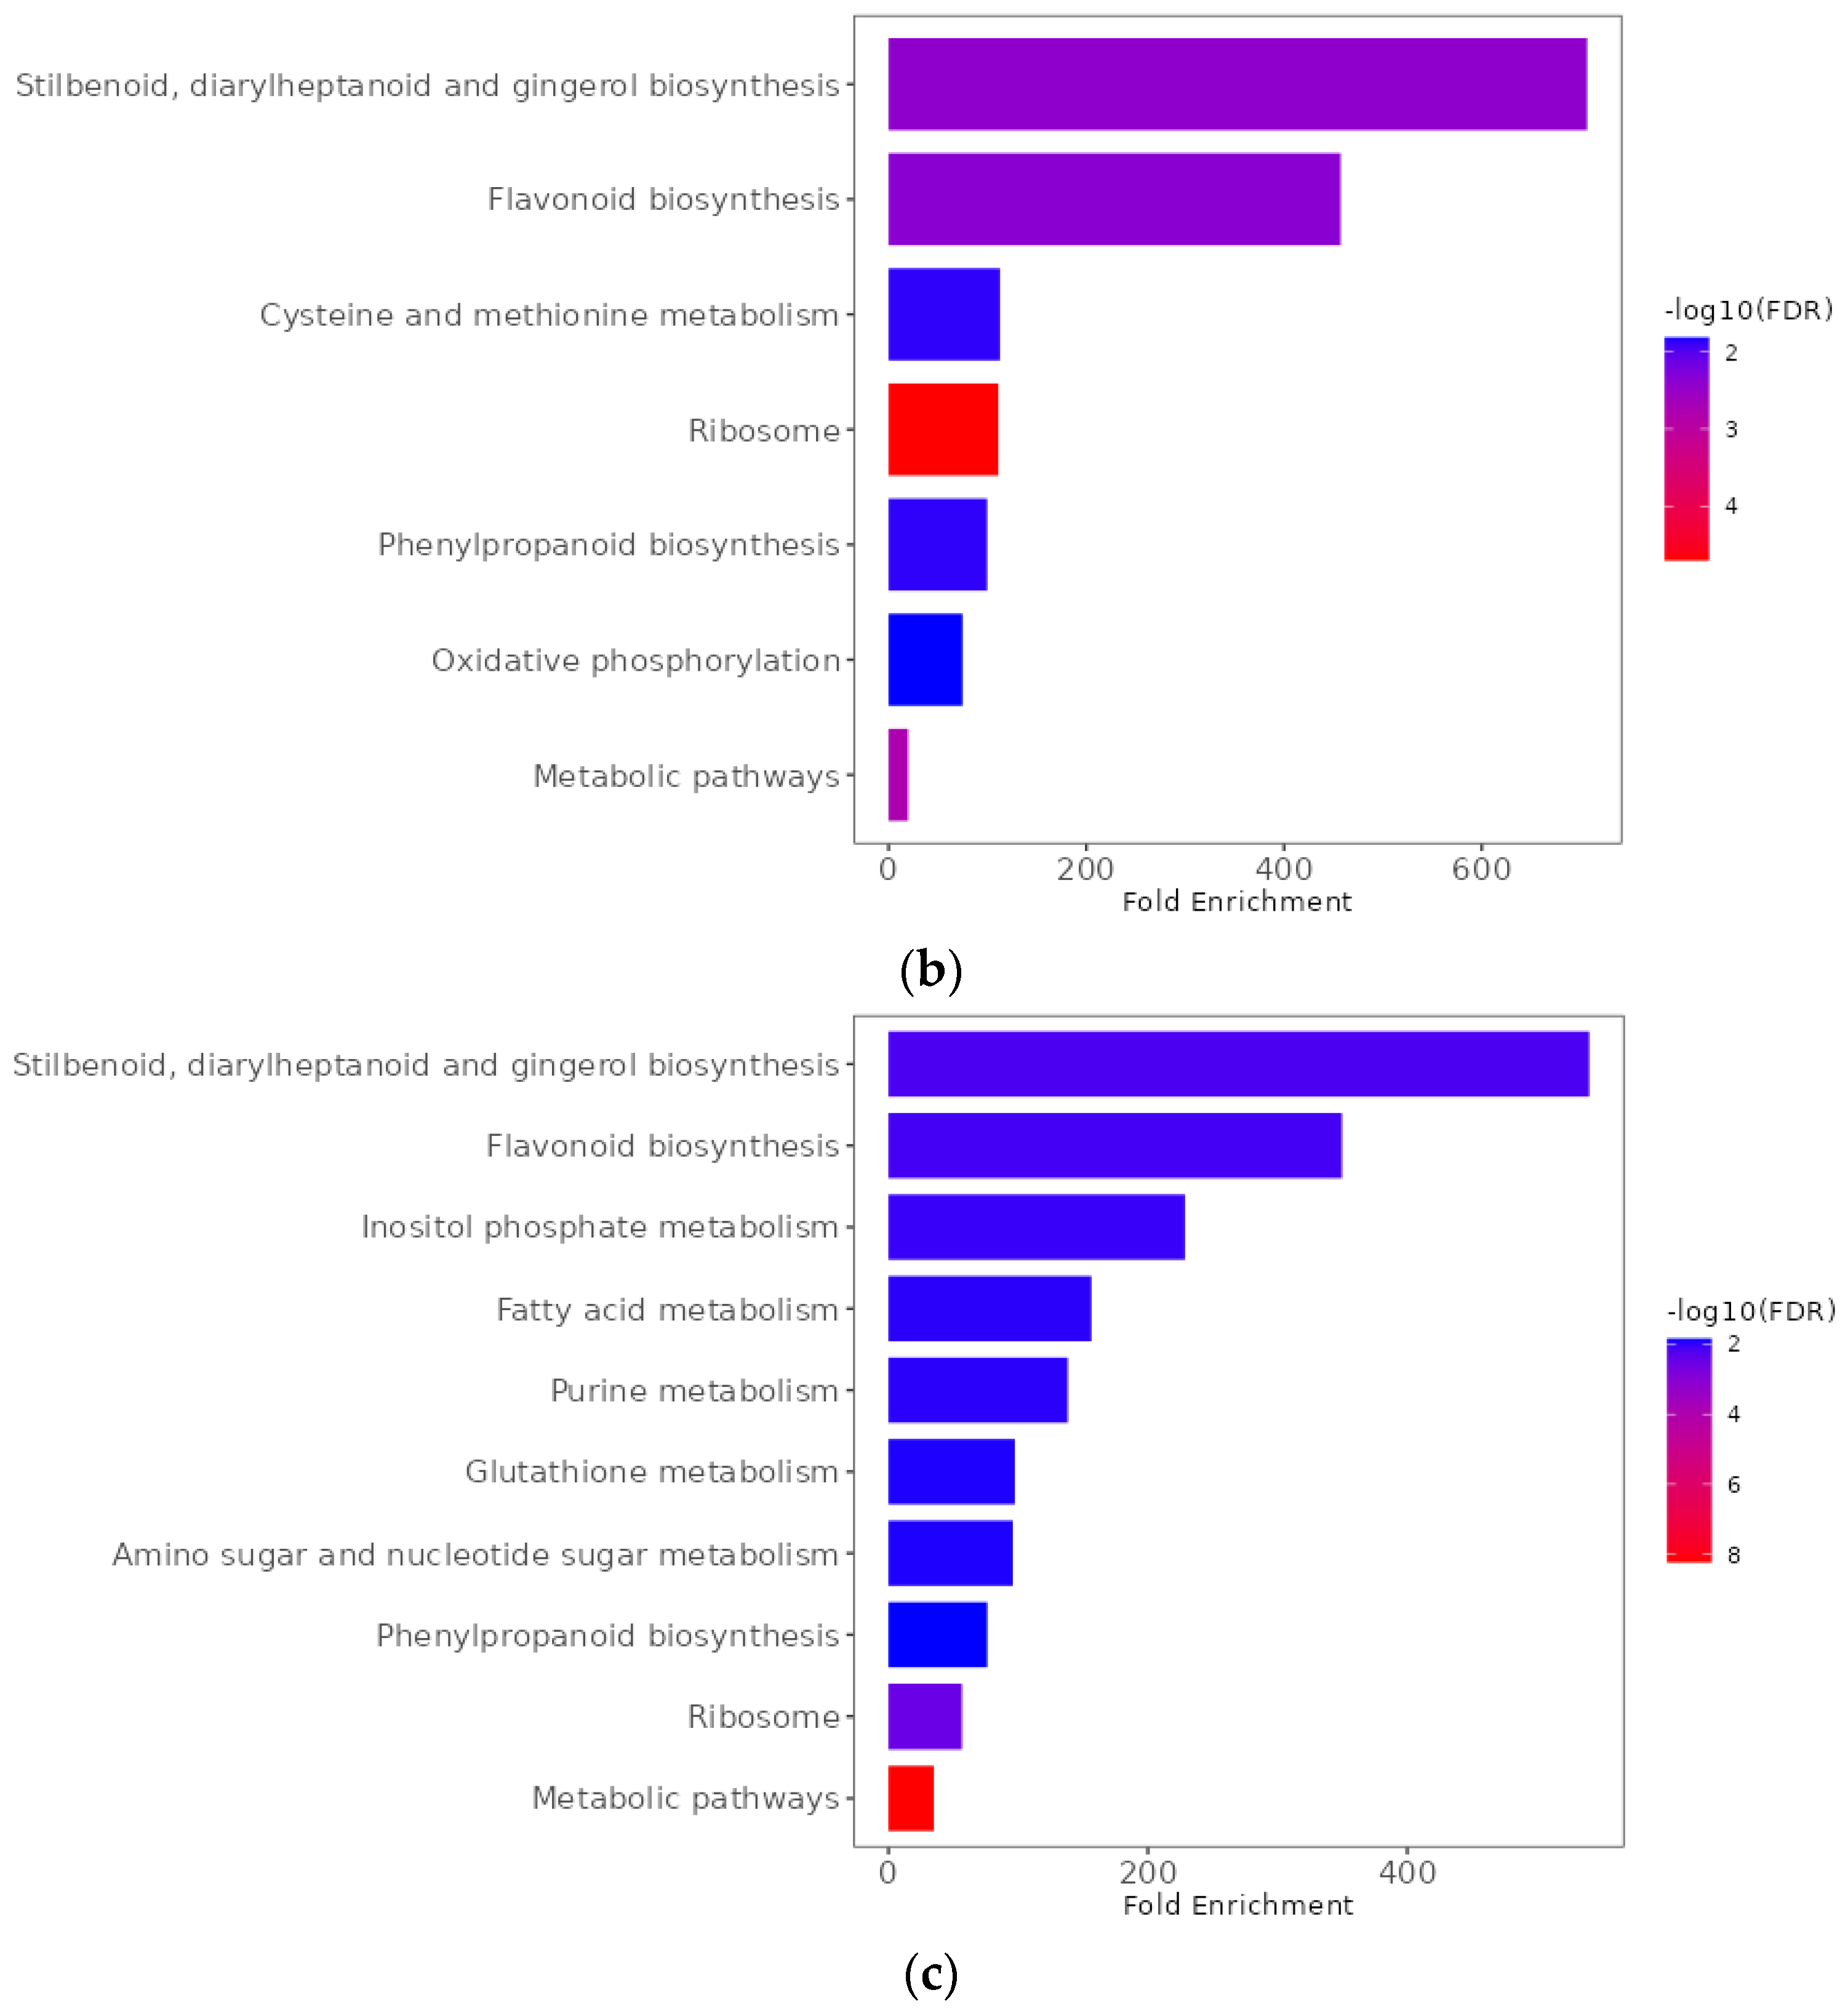
2.9. Functional Enrichment Analyses of Differentially Expressed Genes
3. Discussion
4. Materials and Methods
4.1. Plant Materials
4.2. Phenotyping Assays
4.3. Bulk Construction and RNA Extraction
4.4. RNA Sequencing
4.5. Sequence Alignment, Identification of DEGs, and Variant Calling
4.6. Statistical Analyses
5. Conclusions
Supplementary Materials
Author Contributions
Funding
Institutional Review Board Statement
Informed Consent Statement
Data Availability Statement
Acknowledgments
Conflicts of Interest
References
- Dixon, G.R. The Occurrence and Economic Impact of Plasmodiophora Brassicae and Clubroot Disease. J. Plant Growth Regul. 2009, 28, 194–202. [Google Scholar] [CrossRef]
- Javed, M.A.; Schwelm, A.; Zamani-Noor, N.; Salih, R.; Silvestre Vañó, M.; Wu, J.; González García, M.; Heick, T.M.; Luo, C.; Prakash, P.; et al. The Clubroot Pathogen Plasmodiophora Brassicae: A Profile Update. Mol. Plant Pathol. 2022, 24, 89–106. [Google Scholar] [CrossRef] [PubMed]
- Strelkov, S.E.; Tewari, J.P.; Smith-Degenhardt, E. Characterization of Plasmodiophora Brassicae Populations from Alberta, Canada. Can. J. Plant Pathol. 2006, 28, 467–474. [Google Scholar] [CrossRef]
- Kageyama, K.; Asano, T. Life Cycle of Plasmodiophora Brassicae. J. Plant Growth Regul. 2009, 28, 203–211. [Google Scholar] [CrossRef]
- Warwick, S.I. Brassicaceae in Agriculture. In Genetics and Genomics of the Brassicaceae; Schmidt, R., Bancroft, I., Eds.; Plant Genetics and Genomics: Crops and Models; Springer: New York, NY, USA, 2011; pp. 33–65. ISBN 978-1-4419-7118-0. [Google Scholar]
- Hasan, J.; Megha, S.; Rahman, H. Clubroot in Brassica: Recent Advances in Genomics, Breeding, and Disease Management. Genome 2021, 64, 735–760. [Google Scholar] [CrossRef] [PubMed]
- Strelkov, S.E.; Hwang, S.-F. Clubroot in the Canadian Canola Crop: 10 Years into the Outbreak. Can. J. Plant Pathol. 2014, 36, 27–36. [Google Scholar] [CrossRef]
- Strehlow, B.; De Mol, F.; Struck, C. Risk Potential of Clubroot Disease on Winter Oilseed Rape. Plant Dis. 2015, 99, 667–675. [Google Scholar] [CrossRef] [PubMed]
- Wallenhammar, A.-C. Prevalence of Plasmodiophora Brassicae in a Spring Oilseed Rape Growing Area in Central Sweden and Factors Influencing Soil Infestation Levels. Plant Pathol. 1996, 45, 710–719. [Google Scholar] [CrossRef]
- Dixon, G.R. Clubroot (Plasmodiophora Brassicae Woronin)—An Agricultural and Biological Challenge Worldwide. Can. J. Plant Pathol. 2014, 36, 5–18. [Google Scholar] [CrossRef]
- Strelkov, S.E.; Hwang, S.-F.; Manolii, V.P.; Cao, T.; Fredua-Agyeman, R.; Harding, M.W.; Peng, G.; Gossen, B.D.; Mcdonald, M.R.; Feindel, D. Virulence and Pathotype Classification of Plasmodiophora Brassicae Populations Collected from Clubroot Resistant Canola (Brassica Napus) in Canada. Can. J. Plant Pathol. 2018, 40, 284–298. [Google Scholar] [CrossRef]
- Hollman, K.B.; Manolii, V.P.; Aigu, Y.; Harding, M.W.; Hwang, S.-F.; Strelkov, S.E. Characterization of Plasmodiophora Brassicae Pathotypes from Western Canada in 2019–2020. Can. J. Plant Pathol. 2023, 45, 475–484. [Google Scholar] [CrossRef]
- Cornelsen, J.E.; Ort, N.W.; Gabert, R.K.; Epp, I.; Rempel, C.B. Current and Potential Pest Threats for Canola in the Canadian Prairies. Pest Manag. Sci. 2023, 80, 2220–2234. [Google Scholar] [CrossRef] [PubMed]
- Tewari, J.P.; Strelkov, S.E.; Orchard, D.; Hartman, M.; Lange, R.M.; Turkington, T.K. Identification of Clubroot of Crucifers on Canola (Brassica Napus) in Alberta. Can. J. Plant Pathol. 2005, 27, 143–144. [Google Scholar] [CrossRef]
- Strelkov, S.E.; Manolii, V.P.; Aigu, Y.; Harding, M.W.; Daniels, G.C.; Hill, T.B.; Hwang, S.F. The Occurrence and Spread of Clubroot on Canola in Alberta in 2022. Can. Plant Dis. Surv. 2023, 103, 117–120. [Google Scholar]
- Rahman, H.; Peng, G.; Yu, F.; Falk, K.C.; Kulkarni, M.; Selvaraj, G. Genetics and Breeding for Clubroot Resistance in Canadian Spring Canola (Brassica Napus L.). Can. J. Plant Pathol. 2014, 36, 122–134. [Google Scholar] [CrossRef]
- Mcdonald, M.R.; Al-Daoud, F.; Sedaghatkish, A.; Moran, M.; Cranmer, T.J.; Gossen, B.D. Changes in the Range and Virulence of Plasmodiophora Brassicae across Canada. Can. J. Plant Pathol. 2021, 43, 304–310. [Google Scholar] [CrossRef]
- Hollman, K.B.; Hwang, S.F.; Manolii, V.P.; Strelkov, S.E. Pathotypes of Plasmodiophora Brassicae Collected from Clubroot Resistant Canola (Brassica Napus L.) Cultivars in Western Canada in 2017-2018. Can. J. Plant Pathol. 2021, 43, 622–630. [Google Scholar] [CrossRef]
- Fredua-Agyeman, R.; Hwang, S.-F.; Strelkov, S.E.; Zhou, Q.; Feindel, D. Potential Loss of Clubroot Resistance Genes from Donor Parent Brassica Rapa Subsp. Rapifera (ECD 04) during Doubled Haploid Production. Plant Pathol. 2018, 67, 892–901. [Google Scholar] [CrossRef]
- Suwabe, K.; Tsukazaki, H.; Iketani, H.; Hatakeyama, K.; Fujimura, M.; Nunome, T.; Fukuoka, H.; Matsumoto, S.; Hirai, M. Identification of Two Loci for Resistance to Clubroot (Plasmodiophora Brassicae Woronin) in Brassica Rapa L. Theor. Appl. Genet. 2003, 107, 997–1002. [Google Scholar] [CrossRef] [PubMed]
- Fredua-Agyeman, R.; Yu, Z.; Hwang, S.-F.; Strelkov, S.E. Genome-Wide Mapping of Loci Associated with Resistance to Clubroot in Brassica Napus ssp. Napobrassica (Rutabaga) Accessions from Nordic Countries. Front. Plant Sci. 2020, 11, 491849. [Google Scholar] [CrossRef] [PubMed]
- Yu, Z.; Fredua-Agyeman, R.; Hwang, S.-F.; Strelkov, S.E. Molecular Genetic Diversity and Population Structure Analyses of Rutabaga Accessions from Nordic Countries as Revealed by Single Nucleotide Polymorphism Markers. BMC Genom. 2021, 22, 442. [Google Scholar] [CrossRef] [PubMed]
- Piao, Z.Y.; Deng, Y.Q.; Choi, S.R.; Park, Y.J.; Lim, Y.P. SCAR and CAPS Mapping of CRb, a Gene Conferring Resistance to Plasmodiophora Brassicae in Chinese Cabbage (Brassica Rapa ssp. Pekinensis). Theor. Appl. Genet. 2004, 108, 1458–1465. [Google Scholar] [CrossRef] [PubMed]
- Kato, T.; Hatakeyama, K.; Fukino, N.; Matsumoto, S. Fine Mapping of the Clubroot Resistance Gene CRb and Development of a Useful Selectable Marker in Brassica Rapa. Breed. Sci. 2013, 63, 116–124. [Google Scholar] [CrossRef] [PubMed]
- Rocherieux, J.; Glory, P.; Giboulot, A.; Boury, S.; Barbeyron, G.; Thomas, G.; Manzanares-Dauleux, M.J. Isolate-Specific and Broad-Spectrum QTLs Are Involved in the Control of Clubroot in Brassica Oleracea. Theor. Appl. Genet. 2004, 108, 1555–1563. [Google Scholar] [CrossRef] [PubMed]
- Voorrips, R.E.; Jongerius, M.C.; Kanne, H.J. Mapping of Two Genes for Resistance to Clubroot (Plasmodiophora Brassicae) in a Population of Doubled Haploid Lines of Brassica Oleracea by Means of RFLP and AFLP Markers. Theor. Appl. Genet. 1997, 94, 75–82. [Google Scholar] [CrossRef]
- Bolger, M.E.; Weisshaar, B.; Scholz, U.; Stein, N.; Usadel, B.; Mayer, K.F. Plant Genome Sequencing—Applications for Crop Improvement. Curr. Opin. Biotechnol. 2014, 26, 31–37. [Google Scholar] [CrossRef] [PubMed]
- Liu, S.; Yeh, C.-T.; Tang, H.M.; Nettleton, D.; Schnable, P.S. Gene Mapping via Bulked Segregant RNA-Seq (BSR-Seq). PLoS ONE 2012, 7, e36406. [Google Scholar] [CrossRef]
- Yu, F.; Zhang, X.; Huang, Z.; Chu, M.; Song, T.; Falk, K.C.; Deora, A.; Chen, Q.; Zhang, Y.; McGregor, L.; et al. Identification of Genome-Wide Variants and Discovery of Variants Associated with Brassica Rapa Clubroot Resistance Gene Rcr1 through Bulked Segregant RNA Sequencing. PLoS ONE 2016, 11, e0153218. [Google Scholar] [CrossRef] [PubMed]
- Huang, Z.; Peng, G.; Liu, X.; Deora, A.; Falk, K.C.; Gossen, B.D.; McDonald, M.R.; Yu, F. Fine Mapping of a Clubroot Resistance Gene in Chinese Cabbage Using SNP Markers Identified from Bulked Segregant RNA Sequencing. Front. Plant Sci. 2017, 8, 1448. [Google Scholar] [CrossRef] [PubMed]
- Chang, A.; Lamara, M.; Wei, Y.; Hu, H.; Parkin, I.A.P.; Gossen, B.D.; Peng, G.; Yu, F. Clubroot Resistance Gene Rcr6 in Brassica Nigra Resides in a Genomic Region Homologous to Chromosome A08 in B. Rapa. BMC Plant Biol. 2019, 19, 224. [Google Scholar] [CrossRef]
- Karim, M.M.; Dakouri, A.; Zhang, Y.; Chen, Q.; Peng, G.; Strelkov, S.E.; Gossen, B.D.; Yu, F. Two Clubroot-Resistance Genes, Rcr3 and Rcr9wa, Mapped in Brassica Rapa Using Bulk Segregant RNA Sequencing. Int. J. Mol. Sci. 2020, 21, 5033. [Google Scholar] [CrossRef]
- Williams, P.H. A System for the Determination of Races of Plasmodiophora Brassicae That Infect Cabbage and Rutabaga. Phytopathology 1966, 56, 624–626. [Google Scholar]
- Hasan, M.J.; Rahman, H. Genetics and Molecular Mapping of Resistance to Plasmodiophora Brassicae Pathotypes 2, 3, 5, 6, and 8 in Rutabaga (Brassica Napus Var. Napobrassica). Genome 2016, 59, 805–815. [Google Scholar] [CrossRef]
- Wang, Z.; Megha, S.; Kebede, B.; Kav, N.N.V.; Rahman, H. Genetic and Molecular Analysis Reveals That Two Major Loci and Their Interaction Confer Clubroot Resistance in Canola Introgressed from Rutabaga. Plant Genome 2022, 15, e20241. [Google Scholar] [CrossRef]
- Kuginuki, Y.; Yoshikawa, H.; Hirai, M. Variation in Virulence of Plasmodiophora Brassicae in Japan Tested with Clubroot-Resistant Cultivars of Chinese Cabbage (Brassica Rapa L. ssp. Pekinensis). Eur. J. Plant Pathol. 1999, 105, 327–332. [Google Scholar] [CrossRef]
- Fredua-Agyeman, R.; Jiang, J.; Hwang, S.-F.; Strelkov, S.E. QTL Mapping and Inheritance of Clubroot Resistance Genes Derived from Brassica Rapa subsp. Rapifera (ECD 02) Reveals Resistance Loci and Distorted Segregation Ratios in Two F2 Populations of Different Crosses. Front. Plant Sci. 2020, 11, 537416. [Google Scholar] [CrossRef]
- Takagi, H.; Abe, A.; Yoshida, K.; Kosugi, S.; Natsume, S.; Mitsuoka, C.; Uemura, A.; Utsushi, H.; Tamiru, M.; Takuno, S.; et al. QTL-Seq: Rapid Mapping of Quantitative Trait Loci in Rice by Whole Genome Resequencing of DNA from Two Bulked Populations. Plant J. 2013, 74, 174–183. [Google Scholar] [CrossRef]
- Østergaard, L.; King, G.J. Standardized Gene Nomenclature for the Brassica Genus. Plant Methods 2008, 4, 10. [Google Scholar] [CrossRef]
- Chisholm, S.T.; Coaker, G.; Day, B.; Staskawicz, B.J. Host-Microbe Interactions: Shaping the Evolution of the Plant Immune Response. Cell 2006, 124, 803–814. [Google Scholar] [CrossRef]
- Payá, C.; Belda-Palazón, B.; Vera-Sirera, F.; Pérez-Pérez, J.; Jordá, L.; Rodrigo, I.; Bellés, J.M.; López-Gresa, M.P.; Lisón, P. Signalling Mechanisms and Agricultural Applications of (Z)-3-Hexenyl Butyrate-Mediated Stomatal Closure. Hortic. Res. 2024, 11, uhad248. [Google Scholar] [CrossRef]
- Pusztahelyi, T. Chitin and Chitin-Related Compounds in Plant–Fungal Interactions. Mycology 2018, 9, 189–201. [Google Scholar] [CrossRef]
- Tauzin, A.S.; Giardina, T. Sucrose and Invertases, a Part of the Plant Defense Response to the Biotic Stresses. Front. Plant Sci. 2014, 5, 86818. [Google Scholar] [CrossRef]
- Buczacki, S.T.; Toxopeus, H.; Mattusch, P.; Johnston, T.D.; Dixon, G.R.; Hobolth, L.A. Study of Physiologic Specialization in Plasmodiophora Brassicae: Proposals for Attempted Rationalization through an International Approach. Trans. Br. Mycol. Soc. 1975, 65, 295–303. [Google Scholar] [CrossRef]
- Spaner, D. Agronomic and Horticultural Characters of Rutabaga in Eastern Canada. Can. J. Plant Sci. 2002, 82, 221–224. [Google Scholar] [CrossRef]
- Lammerink, J. The Inheritance of Clubroot Resistance in Brassica Napus L. N. Z. J. Agric. Res. 1967, 10, 109–115. [Google Scholar] [CrossRef]
- Ayers, G.W.; Lelacheur, K.E. Genetics of Resistance in Rutabaga to Two Races of Plasmodiophora Brassicae. Can. J. Plant Sci. 1972, 52, 897–900. [Google Scholar] [CrossRef]
- Gustafsson, M.; Falt, A.-S. Genetic Studies on Resistance to Clubroot in Brassica Napus. Ann. Appl. Biol. 1986, 108, 409–415. [Google Scholar] [CrossRef]
- Crute, I.R.; Phelps, K.; Barnes, A.; Buczacki, S.T.; Crisp, P. The Relationship between Genotypes of Three Brassica Species and Collections Oi Plasmodiophora Brassicae. Plant Pathol. 1983, 32, 405–420. [Google Scholar] [CrossRef]
- Piao, Z.; Ramchiary, N.; Lim, Y.P. Genetics of Clubroot Resistance in Brassica Species. J. Plant Growth Regul. 2009, 28, 252–264. [Google Scholar] [CrossRef]
- Nguyen, M.L.; Monakhos, G.F.; Komakhin, R.A.; Monakhos, S.G. The New Clubroot Resistance Locus Is Located on Chromosome A05 in Chinese Cabbage (Brassica Rapa L.). Russ. J. Genet. 2018, 54, 296–304. [Google Scholar] [CrossRef]
- Dakouri, A.; Zhang, X.; Peng, G.; Falk, K.C.; Gossen, B.D.; Strelkov, S.E.; Yu, F. Analysis of Genome-Wide Variants through Bulked Segregant RNA Sequencing Reveals a Major Gene for Resistance to Plasmodiophora Brassicae in Brassica Oleracea. Sci. Rep. 2018, 8, 17657. [Google Scholar] [CrossRef]
- Ce, F.; Mei, J.; He, H.; Zhao, Y.; Hu, W.; Yu, F.; Li, Q.; Ren, X.; Si, J.; Song, H.; et al. Identification of Candidate Genes for Clubroot-Resistance in Brassica Oleracea Using Quantitative Trait Loci-Sequencing. Front. Plant Sci. 2021, 12, 703520. [Google Scholar] [CrossRef]
- Yu, F.; Zhang, Y.; Wang, J.; Chen, Q.; Karim, M.M.; Gossen, B.D.; Peng, G. Identification of Two Major QTLs in Brassica Napus Lines with Introgressed Clubroot Resistance from Turnip Cultivar ECD01. Front. Plant Sci. 2022, 12, 785989. [Google Scholar] [CrossRef]
- Yu, F.; Zhang, X.; Peng, G.; Falk, K.C.; Strelkov, S.E.; Gossen, B.D. Genotyping-by-Sequencing Reveals Three QTL for Clubroot Resistance to Six Pathotypes of Plasmodiophora Brassicae in Brassica Rapa. Sci. Rep. 2017, 7, 4516. [Google Scholar] [CrossRef]
- Chen, J.; Jing, J.; Zhan, Z.; Zhang, T.; Zhang, C.; Piao, Z. Identification of Novel QTLs for Isolate-Specific Partial Resistance to Plasmodiophora Brassicae in Brassica Rapa. PLoS ONE 2013, 8, e85307. [Google Scholar] [CrossRef]
- Laila, R.; Park, J.-I.; Robin, A.H.K.; Natarajan, S.; Vijayakumar, H.; Shirasawa, K.; Isobe, S.; Kim, H.-T.; Nou, I.-S. Mapping of a Novel Clubroot Resistance QTL Using ddRAD-Seq in Chinese Cabbage (Brassica Rapa L.). BMC Plant Biol. 2019, 19, 13. [Google Scholar] [CrossRef]
- Karim, M.M.; Yu, F. Identification of QTLs for Resistance to 10 Pathotypes of Plasmodiophora Brassicae in Brassica Oleracea Cultivar ECD11 through Genotyping-by-Sequencing. Theor. Appl. Genet. 2023, 136, 249. [Google Scholar] [CrossRef]
- Dodds, P.N.; Rathjen, J.P. Plant Immunity: Towards an Integrated View of Plant–Pathogen Interactions. Nat. Rev. Genet. 2010, 11, 539–548. [Google Scholar] [CrossRef]
- Nagaraj, S.; Senthil-Kumar, M.; Ramu, V.S.; Wang, K.; Mysore, K.S. Plant Ribosomal Proteins, RPL12 and RPL19, Play a Role in Nonhost Disease Resistance against Bacterial Pathogens. Front. Plant Sci. 2016, 6, 160238. [Google Scholar] [CrossRef]
- Ramu, V.S.; Dawane, A.; Lee, S.; Oh, S.; Lee, H.; Sun, L.; Senthil-Kumar, M.; Mysore, K.S. Ribosomal Protein QM/RPL10 Positively Regulates Defence and Protein Translation Mechanisms during Nonhost Disease Resistance. Mol. Plant Pathol. 2020, 21, 1481–1494. [Google Scholar] [CrossRef]
- Soprano, A.S.; Smetana, J.H.C.; Benedetti, C.E. Regulation of tRNA Biogenesis in Plants and Its Link to Plant Growth and Response to Pathogens. Biochim. Biophys. Acta BBA Gene Regul. Mech. 2018, 1861, 344–353. [Google Scholar] [CrossRef]
- Zheng, X.; Chen, H.; Deng, Z.; Wu, Y.; Zhong, L.; Wu, C.; Yu, X.; Chen, Q.; Yan, S. The tRNA Thiolation-Mediated Translational Control Is Essential for Plant Immunity. eLife 2024, 13, e93517. [Google Scholar] [CrossRef]
- Cittadino, G.M.; Andrews, J.; Purewal, H.; Estanislao Acuña Avila, P.; Arnone, J.T. Functional Clustering of Metabolically Related Genes Is Conserved across Dikarya. J. Fungi 2023, 9, 523. [Google Scholar] [CrossRef]
- Hasanuzzaman, M.; Hossain, M.S.; Bhuyan, M.H.M.B.; Al Mahmud, J.; Nahar, K.; Fujita, M. The Role of Sulfur in Plant Abiotic Stress Tolerance: Molecular Interactions and Defense Mechanisms. In Plant Nutrients and Abiotic Stress Tolerance; Hasanuzzaman, M., Fujita, M., Oku, H., Nahar, K., Hawrylak-Nowak, B., Eds.; Springer: Singapore, 2018; pp. 221–252. ISBN 978-981-10-9044-8. [Google Scholar]
- Henty-Ridilla, J.L.; Shimono, M.; Li, J.; Chang, J.H.; Day, B.; Staiger, C.J. The Plant Actin Cytoskeleton Responds to Signals from Microbe-Associated Molecular Patterns. PLOS Pathog. 2013, 9, e1003290. [Google Scholar] [CrossRef]
- Rojas, C.M.; Senthil-Kumar, M.; Tzin, V.; Mysore, K. Regulation of Primary Plant Metabolism during Plant-Pathogen Interactions and Its Contribution to Plant Defense. Front. Plant Sci. 2014, 5, 17. [Google Scholar] [CrossRef]
- Zhai, K.; Liang, D.; Li, H.; Jiao, F.; Yan, B.; Liu, J.; Lei, Z.; Huang, L.; Gong, X.; Wang, X.; et al. NLRs Guard Metabolism to Coordinate Pattern- and Effector-Triggered Immunity. Nature 2022, 601, 245–251. [Google Scholar] [CrossRef]
- Williams, S.P.; Gillaspy, G.E.; Perera, I.Y. Biosynthesis and Possible Functions of Inositol Pyrophosphates in Plants. Front. Plant Sci. 2015, 6, 127764. [Google Scholar] [CrossRef]
- Seth, T.; Asija, S.; Umar, S.; Gupta, R. The Intricate Role of Lipids in Orchestrating Plant Defense Responses. Plant Sci. 2024, 338, 111904. [Google Scholar] [CrossRef]
- Gullner, G.; Zechmann, B.; Künstler, A.; Király, L. The Signaling Roles of Glutathione in Plant Disease Resistance. In Glutathione in Plant Growth, Development, and Stress Tolerance; Hossain, M.A., Mostofa, M.G., Diaz-Vivancos, P., Burritt, D.J., Fujita, M., Tran, L.-S.P., Eds.; Springer: Berlin/Heidelberg, Germany, 2017; pp. 331–357. ISBN 978-3-319-66682-2. [Google Scholar]
- Dixon, R.A.; Achnine, L.; Kota, P.; Liu, C.-J.; Reddy, M.S.S.; Wang, L. The Phenylpropanoid Pathway and Plant Defence—A Genomics Perspective. Mol. Plant Pathol. 2002, 3, 371–390. [Google Scholar] [CrossRef]
- Park, C.-J.; Seo, Y.-S. Heat Shock Proteins: A Review of the Molecular Chaperones for Plant Immunity. Plant Pathol. J. 2015, 31, 323–333. [Google Scholar] [CrossRef]
- Zhang, Y.; Zeng, L. Crosstalk between Ubiquitination and Other Post-Translational Protein Modifications in Plant Immunity. Plant Commun. 2020, 1, 100041. [Google Scholar] [CrossRef]
- Yang, C.-L.; Huang, Y.-T.; Schmidt, W.; Klein, P.; Chan, M.-T.; Pan, I.-C. Ethylene Response Factor109 Attunes Immunity, Photosynthesis, and Iron Homeostasis in Arabidopsis Leaves. Front. Plant Sci. 2022, 13, 841366. [Google Scholar] [CrossRef]
- Fakih, Z.; Plourde, M.B.; Germain, H. Differential Participation of Plant Ribosomal Proteins from the Small Ribosomal Subunit in Protein Translation under Stress. Biomolecules 2023, 13, 1160. [Google Scholar] [CrossRef]
- García-Cano, E.; Hak, H.; Magori, S.; Lazarowitz, S.G.; Citovsky, V. The Agrobacterium F-Box Protein Effector VirF Destabilizes the Arabidopsis GLABROUS1 Enhancer/Binding Protein-Like Transcription Factor VFP4, a Transcriptional Activator of Defense Response Genes. Mol. Plant-Microbe Interact. 2018, 31, 576–586. [Google Scholar] [CrossRef]
- Lukan, T.; Pompe-Novak, M.; Baebler, Š.; Tušek-Žnidarič, M.; Kladnik, A.; Križnik, M.; Blejec, A.; Zagorščak, M.; Stare, K.; Dušak, B. Spatial Accumulation of Salicylic Acid Is Regulated by RBOHD in Potato Immunity against Viruses. BioRxiv 2020. [Google Scholar]
- Xing, L.; Gao, L.; Chen, Q.; Pei, H.; Di, Z.; Xiao, J.; Wang, H.; Ma, L.; Chen, P.; Cao, A.; et al. Over-Expressing a UDP-Glucosyltransferase Gene (Ta-UGT3) Enhances Fusarium Head Blight Resistance of Wheat. Plant Growth Regul. 2018, 84, 561–571. [Google Scholar] [CrossRef]
- Zeilmaker, T.; Ludwig, N.R.; Elberse, J.; Seidl, M.F.; Berke, L.; Van Doorn, A.; Schuurink, R.C.; Snel, B.; Van den Ackerveken, G. DOWNY MILDEW RESISTANT 6 and DMR6-LIKE OXYGENASE 1 Are Partially Redundant but Distinct Suppressors of Immunity in Arabidopsis. Plant J. 2015, 81, 210–222. [Google Scholar] [CrossRef]
- Zhou, Q.; Galindo-González, L.; Manolii, V.; Hwang, S.-F.; Strelkov, S.E. Comparative Transcriptome Analysis of Rutabaga (Brassica Napus) Cultivars Indicates Activation of Salicylic Acid and Ethylene-Mediated Defenses in Response to Plasmodiophora Brassicae. Int. J. Mol. Sci. 2020, 21, 8381. [Google Scholar] [CrossRef]
- Fredua-Agyeman, R.; Hwang, S.F.; Strelkov, S.E.; Zhou, Q.; Manolii, V.P.; Feindel, D. Identification of Brassica Accessions Resistant to ‘Old’ and ‘New’ Pathotypes of Plasmodiophora Brassicae from Canada. Plant Pathol. 2019, 68, 708–718. [Google Scholar] [CrossRef]
- Strelkov, S.E.; Hwang, S.-F.; Manolii, V.P.; Cao, T.; Feindel, D. Emergence of New Virulence Phenotypes of Plasmodiophora Brassicae on Canola (Brassica Napus) in Alberta, Canada. Eur. J. Plant Pathol. 2016, 145, 517–529. [Google Scholar] [CrossRef]
- McKenna, A.; Hanna, M.; Banks, E.; Sivachenko, A.; Cibulskis, K.; Kernytsky, A.; Garimella, K.; Altshuler, D.; Gabriel, S.; Daly, M.; et al. The Genome Analysis Toolkit: A MapReduce Framework for Analyzing next-Generation DNA Sequencing Data. Genome Res. 2010, 20, 1297–1303. [Google Scholar] [CrossRef]
- Dobin, A.; Davis, C.A.; Schlesinger, F.; Drenkow, J.; Zaleski, C.; Jha, S.; Batut, P.; Chaisson, M.; Gingeras, T.R. STAR: Ultrafast Universal RNA-Seq Aligner. Bioinformatics 2013, 29, 15–21. [Google Scholar] [CrossRef]
- Li, B.; Dewey, C.N. RSEM: Accurate Transcript Quantification from RNA-Seq Data with or without a Reference Genome. BMC Bioinformatics 2011, 12, 323. [Google Scholar] [CrossRef]
- Love, M.I.; Huber, W.; Anders, S. Moderated Estimation of Fold Change and Dispersion for RNA-Seq Data with DESeq2. Genome Biol. 2014, 15, 550. [Google Scholar] [CrossRef]
- McDermaid, A.; Monier, B.; Zhao, J.; Ma, Q. ViDGER: An R Package for Integrative Interpretation of Differential Gene Expression Results of RNA-Seq Data. BioRxiv 2018, 268896. [Google Scholar]
- Cantalapiedra, C.P.; Hernández-Plaza, A.; Letunic, I.; Bork, P.; Huerta-Cepas, J. eggNOG-Mapper v2: Functional Annotation, Orthology Assignments, and Domain Prediction at the Metagenomic Scale. Mol. Biol. Evol. 2021, 38, 5825–5829. [Google Scholar] [CrossRef]
- Bu, D.; Luo, H.; Huo, P.; Wang, Z.; Zhang, S.; He, Z.; Wu, Y.; Zhao, L.; Liu, J.; Guo, J.; et al. KOBAS-i: Intelligent Prioritization and Exploratory Visualization of Biological Functions for Gene Enrichment Analysis. Nucleic Acids Res. 2021, 49, W317–W325. [Google Scholar] [CrossRef]
- Poplin, R.; Ruano-Rubio, V.; DePristo, M.A.; Fennell, T.J.; Carneiro, M.O.; Auwera, G.A.V.d.; Kling, D.E.; Gauthier, L.D.; Levy-Moonshine, A.; Roazen, D.; et al. Scaling Accurate Genetic Variant Discovery to Tens of Thousands of Samples. BioRxiv 2018, 201178. [Google Scholar]
- Wu, L.; Fredua-Agyeman, R.; Strelkov, S.E.; Chang, K.-F.; Hwang, S.-F. Identification of Novel Genes Associated with Partial Resistance to Aphanomyces Root Rot in Field Pea by BSR-Seq Analysis. Int. J. Mol. Sci. 2022, 23, 9744. [Google Scholar] [CrossRef]
- Mansfeld, B.N.; Grumet, R. QTLseqr: An R Package for Bulk Segregant Analysis with Next-Generation Sequencing. Plant Genome 2018, 11, 180006. [Google Scholar] [CrossRef]
- Voorrips, R.E. MapChart: Software for the Graphical Presentation of Linkage Maps and QTLs. J. Hered. 2002, 93, 77–78. [Google Scholar] [CrossRef] [PubMed]


| Pathotype | Total | R (0 + 1) | S (2 + 3) | R:S Ratio 1 | Chi-Square | p-Value | R (0) | S (1 + 2 + 3) | R:S Ratio 2 | Chi-Square | p-Value |
|---|---|---|---|---|---|---|---|---|---|---|---|
| 3A | 408 | 80 | 328 | 3R:1S | 667.6601 | <0.00001 | 50 | 358 | 3R:1S | 856.6797 | <0.00001 |
| 1R:3S | 6.326797 | 0.01189 | 1R:3S | 35.34641 | <0.00001 | ||||||
| 9R:7S | 222.5982 | <0.00001 | 9R:7S | 320.8988 | <0.00001 | ||||||
| 7R:9S | 96.62994 | <0.00001 | 7R:9S | 164.4544 | <0.00001 | ||||||
| 5R:11S | 25.73975 | <0.00001 | 5R:11S | 68.5205 | <0.00001 | ||||||
| 11R:5S | 458.6125 | <0.00001 | 11R:5S | 606.1205 | <0.00001 | ||||||
| 13R:3S | 1017.633 | <0.00001 | 13R:3S | 1274.888 | <0.00001 | ||||||
| 3R:13S | 0.197084 | 0.65708 | 3R:13S | 11.29814 | 0.00078 | ||||||
| 15R:1S | 3827.712 | <0.00001 | 15R:1S | 4624.575 | <0.00001 | ||||||
| 1R:15S | 124.2458 | <0.00001 | 1R:15S | 25.1085 | <0.00001 | ||||||
| 3D | 411 | 168 | 243 | 3R:1S | 255.2482 | <0.00001 | 121 | 290 | 3R:1S | 454.9886 | <0.00001 |
| 1R:3S | 55.24818 | <0.00001 | 1R:3S | 4.321979 | 0.03762 | ||||||
| 9R:7S | 39.4748 | <0.00001 | 9R:7S | 120.039 | <0.00001 | ||||||
| 7R:9S | 1.379562 | 0.24018 | 7R:9S | 34.1977 | <0.00001 | ||||||
| 5R:11S | 17.72568 | 0.00003 | 5R:11S | 0.626454 | 0.42866 | ||||||
| 11R:5S | 148.6348 | <0.00001 | 11R:5S | 295.6083 | <0.00001 | ||||||
| 13R:3S | 439.767 | <0.00001 | 13R:3S | 724.1655 | <0.00001 | ||||||
| 3R:13S | 132.0747 | <0.00001 | 3R:13S | 30.83218 | <0.00001 | ||||||
| 15R:1S | 1960.994 | <0.00001 | 15R:1S | 2900.964 | <0.00001 | ||||||
| 1R:15S | 840.9942 | <0.00001 | 1R:15S | 377.2303 | <0.00001 | ||||||
| 3H | 439 | 144 | 295 | 3R:1S | 416.918 | <0.00001 | 101 | 338 | 3R:1S | 632.9301 | <0.00001 |
| 1R:3S | 14.25133 | 0.00016 | 1R:3S | 0.930144 | 0.33483 | ||||||
| 9R:7S | 98.08038 | <0.00001 | 9R:7S | 197.1373 | <0.00001 | ||||||
| 7R:9S | 21.38196 | <0.00001 | 7R:9S | 76.7563 | <0.00001 | ||||||
| 5R:11S | 0.492069 | 0.48301 | 5R:11S | 13.88449 | 0.00019 | ||||||
| 11R:5S | 264.0557 | <0.00001 | 11R:5S | 427.5572 | <0.00001 | ||||||
| 13R:3S | 676.3863 | <0.00001 | 13R:3S | 977.5294 | <0.00001 | ||||||
| 3R:13S | 56.89907 | <0.00001 | 3R:13S | 5.221716 | 0.02231 | ||||||
| 15R:1S | 2783.138 | <0.00001 | 15R:1S | 3749.576 | <0.00001 | ||||||
| 1R:15S | 528.2043 | <0.00001 | 1R:15S | 210.3765 | <0.00001 |
| Pathotype | 3A | 3D | 3H | |||
|---|---|---|---|---|---|---|
| Chromosome | # SNP 1 | SNP/Mb 2 | # SNP | SNP/Mb | # SNP | SNP/Mb |
| A01 | 20,939 | 584.52 | 20,597 | 574.97 | 19,994 | 558.14 |
| A02 | 22,146 | 626.78 | 21,668 | 613.25 | 21,502 | 608.56 |
| A03 | 31,343 | 637.84 | 30,494 | 620.56 | 29,862 | 607.70 |
| A04 | 12,572 | 533.69 | 12,345 | 524.05 | 12,040 | 511.11 |
| A05 | 16,995 | 539.98 | 16,512 | 524.63 | 16,373 | 520.22 |
| A06 | 20,115 | 557.50 | 19,809 | 549.02 | 19,356 | 536.46 |
| A07 | 15,927 | 580.71 | 15,526 | 566.09 | 15,439 | 562.91 |
| A08 | 11,782 | 424.70 | 11,737 | 423.08 | 11,348 | 409.06 |
| A09 | 23,060 | 501.92 | 22,594 | 491.78 | 22,382 | 487.16 |
| A10 | 16,270 | 732.31 | 15,976 | 719.08 | 15,380 | 692.25 |
| C01 | 11,826 | 232.90 | 11,388 | 224.28 | 11,236 | 221.28 |
| C02 | 13,049 | 190.78 | 12,795 | 187.07 | 12,937 | 189.15 |
| C03 | 26,556 | 330.38 | 26,055 | 324.15 | 25,843 | 321.51 |
| C04 | 16,072 | 227.80 | 16,025 | 227.14 | 15,571 | 220.70 |
| C05 | 12,100 | 274.10 | 11,924 | 270.11 | 11,722 | 265.54 |
| C06 | 11,473 | 252.12 | 11,417 | 250.89 | 11,086 | 243.62 |
| C07 | 13,456 | 215.49 | 12,956 | 207.49 | 12,986 | 207.97 |
| C08 | 13,499 | 291.26 | 13,316 | 287.31 | 12,989 | 280.26 |
| C09 | 10,939 | 211.59 | 10,503 | 203.16 | 10,074 | 194.86 |
| Scaffolds | 18,058 | NA | 17,707 | NA | 17,503 | NA |
| QTL | Chromosome | Position | Gene ID | Gene Name | Overlapping QTL | |
|---|---|---|---|---|---|---|
| Start | End | |||||
| BnaA5P3A.CRX1.1 (Major) | A05 | 12272166 | 12272166 | 106362025 | hsp70-Hsp90 organizing protein 3 | |
| BnaC7P3A.CRX1.1 | C07 | 45670744 | 46185588 | 106406248 | 60S ribosomal protein L26-1 | |
| (Major) | 111208271 | alpha-humulene/(-)-(E)-beta-caryophyllene synthase-like | ||||
| BnaA1P3D.CRX1.1 (Minor) | A01 | 14059868 | 14060851 | 106361131 | cilia- and flagella-associated protein 251 | |
| BnaA5P3D.CRX1.1 (Minor) | A05 | 13623271 | 13623271 | 106411554 | proteasome subunit alpha type-4-A-like | |
| BnaA8P3D.CRX1.1 (Major) | A08 | 7443712 | 7443835 | 106396583 | enoyl-CoA delta isomerase 2, peroxisomal | |
| BnaA8P3D.RCr91.2 (Major) | A08 | 10275090 | 11076201 | 106418916 | transcription initiation factor TFIID subunit 1 | |
| BnaA8P3D.Crr11.3 | A08 | 16016864 | 16050956 | 106361045 | UDP-glucosyl transferase 73B2-like | BnaA8P3H.Crr11.3 |
| (Major) | 106361049 | polyubiquitin 11 | BnaA8P3H.Crr11.3 | |||
| 106361048 | polyadenylate-binding protein 2 | BnaA8P3H.Crr11.3 | ||||
| BnaA8P3D.qBrCR381.4 (Major) | A08 | 17871036 | 20312633 | 106361356 | probable beta-1,3-galactosyltransferase 4 | |
| 106361316 | 31 kDa ribonucleoprotein, chloroplastic | |||||
| 106361308 | heat shock 70 kDa protein 6, chloroplastic-like | BnaA8P3H.qBrCR381.4 | ||||
| 106361304 | 3-oxo-Delta(4,5)-steroid 5-beta-reductase-like | BnaA8P3H.qBrCR381.4 | ||||
| 106361295 | aconitate hydratase 1 | |||||
| 106361282 | phosphoserine aminotransferase 1, chloroplastic | BnaA8P3H.qBrCR381.4 | ||||
| 106361274 | 50S ribosomal protein L25-like | |||||
| 106405582 | protein PLASTID MOVEMENT IMPAIRED 1 | BnaA8P3H.qBrCR381.4 | ||||
| 106361258 | bZIP transcription factor 60 | BnaA8P3H.qBrCR381.4 | ||||
| 106451550 | GLABROUS1 enhancer-binding protein-like 1 | |||||
| 106384864 | uncharacterized LOC106384864 | |||||
| 106384865 | uncharacterized LOC106384865 | |||||
| 106361389 | NAD(P)H-quinone oxidoreductase subunit M, chloroplastic | |||||
| 106361360 | apoptotic chromatin condensation inducer in the nucleus | |||||
| BnaC7P3D.CRX1.1 (Minor) | C07 | 34501975 | 34509210 | 106418155 | serine/threonine-protein kinase prp4 | |
| 106418157 | uncharacterized LOC106418157 | |||||
| BnaC9P3D.CRX1.1 (Minor) | C09 | 31610782 | 31611253 | 106418720 | vicilin-like seed storage protein At2g18540 | BnaC9P3H.CRX1.1 |
| BnaA8P3H.RCr91.2 (Major) | A08 | 11310428 | 12506566 | 106390924 | selenium-binding protein 1 | |
| 106397231 | UDP-glycosyltransferase 75C1-like | |||||
| 106422372 | 5-amino-6-(5-phospho-D-ribitylamino)uracil phosphatase, chloroplastic-like | |||||
| BnaA8P3H.Crr11.3 | A08 | 15908289 | 16050956 | 106361033 | ethylene-responsive transcription factor ERF109 | |
| (Major) | 106361045 | UDP-glucosyl transferase 73B2-like | BnaA8P3D.Crr11.3 | |||
| 106361049 | polyubiquitin 11 | BnaA8P3D.Crr11.3 | ||||
| 106361048 | polyadenylate-binding protein 2 | BnaA8P3D.Crr11.3 | ||||
| BnaA8P3H.qBrCR381.4 | A08 | 18281327 | 18872996 | 106361308 | heat shock 70 kDa protein 6, chloroplastic-like | BnaA8P3D.qBrCR381.4 |
| (Major) | 106361304 | 3-oxo-Delta(4,5)-steroid 5-beta-reductase-like | BnaA8P3D.qBrCR381.4 | |||
| 106361282 | phosphoserine aminotransferase 1, chloroplastic | BnaA8P3D.qBrCR381.4 | ||||
| 106405582 | protein PLASTID MOVEMENT IMPAIRED 1 | BnaA8P3D.qBrCR381.4 | ||||
| 106361258 | bZIP transcription factor 60 | BnaA8P3D.qBrCR381.4 | ||||
| BnaC1P3H.CRX1.1 (Minor) | C01 | 17677705 | 17678086 | 106376056 | GLABROUS1 enhancer-binding protein-like | |
| BnaC1P3H.CRX1.2 (Major) | C01 | 26237303 | 26648486 | 106349084 | polyubiquitin 11 | |
| 106349049 | uncharacterized LOC106349049 | |||||
| BnaC1P3H.CRX1.3 (Minor) | C01 | 42700048 | 42700048 | 111202359 | 60S ribosomal protein L27-3 | |
| BnaC9P3H.CRX1.1 (Minor) | C09 | 31610782 | 32261061 | 106418720 | vicilin-like seed storage protein At2g18540 | BnaC9P3D.CRX1.1 |
| 106392952 | uncharacterized LOC106392952 | |||||
| Gene ID | Symbol | Chromosome | QTL | DEG Pathotype | Description of Gene Functions (Gene Name) |
|---|---|---|---|---|---|
| 106360694 | LOC106360694 | A08 | BnaA8P3D.RCr91.2 | 3H | RGG repeats nuclear RNA binding protein A |
| 106381656 | LOC106381656 | A08 | BnaA8P3D.RCr91.2 | 3H | ethylene-responsive transcription factor 1A-like |
| 106416269 | LOC106416269 | A08 | BnaA8P3D.qBrCR381.4 | 3H | cysteine protease XCP2 |
| 106407096 | LOC106407096 | C07 | BnaC7P3A.CRX1.1 | 3D | SMAX1-LIKE 3 protein |
| 106348481 | LOC106348481 | C07 | BnaC7P3A.CRX1.1 | 3A | downy mildew resistance 6 protein |
| 106348764 | LOC106348764 | C07 | BnaC7P3A.CRX1.1 | 3D, 3H | tesmin/TSO1-like CXC 7 protein |
| 106348998 | LOC106348998 | C07 | BnaC7P3A.CRX1.1 | 3A | peptidyl-prolyl cis-trans isomerase FKBP65 |
| 106349452 | LOC106349452 | C07 | BnaC7P3D.CRX1.1 | 3H | 60S ribosomal protein L7-2 |
| 106390302 | LOC106390302 | C07 | BnaC7P3D.CRX1.1 | 3A | LOB domain-containing protein 37-like |
| 106410495 | LOC106410495 | C07 | BnaC7P3A.CRX1.1 | 3A | glycine-rich protein 5-like |
| 106410578 | LOC106410578 | C07 | BnaC7P3A.CRX1.1 | 3A | pectinesterase inhibitor 7-like |
| 106410663 | LOC106410663 | C07 | BnaC7P3A.CRX1.1 | 3A | bark storage protein A |
| 106410664 | LOC106410664 | C07 | BnaC7P3D.CRX1.1 | 3A | tonoplast dicarboxylate transporter |
| 106440113 | LOC106440113 | C07 | BnaC7P3A.CRX1.1 | 3H | protein CHAPERONE-LIKE PROTEIN OF POR1, chloroplastic |
| 111198409 | LOC111198409 | C07 | BnaC7P3A.CRX1.1 | 3A | heat stress transcription factor A-7a-like |
| 111204564 | LOC111204564 | C07 | BnaC7P3A.CRX1.1 | 3H | ATP-dependent Clp protease ATP-binding subunit CLPT1, chloroplastic-like |
Disclaimer/Publisher’s Note: The statements, opinions and data contained in all publications are solely those of the individual author(s) and contributor(s) and not of MDPI and/or the editor(s). MDPI and/or the editor(s) disclaim responsibility for any injury to people or property resulting from any ideas, methods, instructions or products referred to in the content. |
© 2024 by the authors. Licensee MDPI, Basel, Switzerland. This article is an open access article distributed under the terms and conditions of the Creative Commons Attribution (CC BY) license (https://creativecommons.org/licenses/by/4.0/).
Share and Cite
Yu, Z.; Fredua-Agyeman, R.; Strelkov, S.E.; Hwang, S.-F. RNA-Seq Bulked Segregant Analysis of an Exotic B. napus ssp. napobrassica (Rutabaga) F2 Population Reveals Novel QTLs for Breeding Clubroot-Resistant Canola. Int. J. Mol. Sci. 2024, 25, 4596. https://doi.org/10.3390/ijms25094596
Yu Z, Fredua-Agyeman R, Strelkov SE, Hwang S-F. RNA-Seq Bulked Segregant Analysis of an Exotic B. napus ssp. napobrassica (Rutabaga) F2 Population Reveals Novel QTLs for Breeding Clubroot-Resistant Canola. International Journal of Molecular Sciences. 2024; 25(9):4596. https://doi.org/10.3390/ijms25094596
Chicago/Turabian StyleYu, Zhiyu, Rudolph Fredua-Agyeman, Stephen E. Strelkov, and Sheau-Fang Hwang. 2024. "RNA-Seq Bulked Segregant Analysis of an Exotic B. napus ssp. napobrassica (Rutabaga) F2 Population Reveals Novel QTLs for Breeding Clubroot-Resistant Canola" International Journal of Molecular Sciences 25, no. 9: 4596. https://doi.org/10.3390/ijms25094596