
HLA-DR Expression in Natural Killer Cells Marks Distinct Functional States, Depending on Cell Differentiation Stage
 , , , , ,
Abstract
:1. Introduction
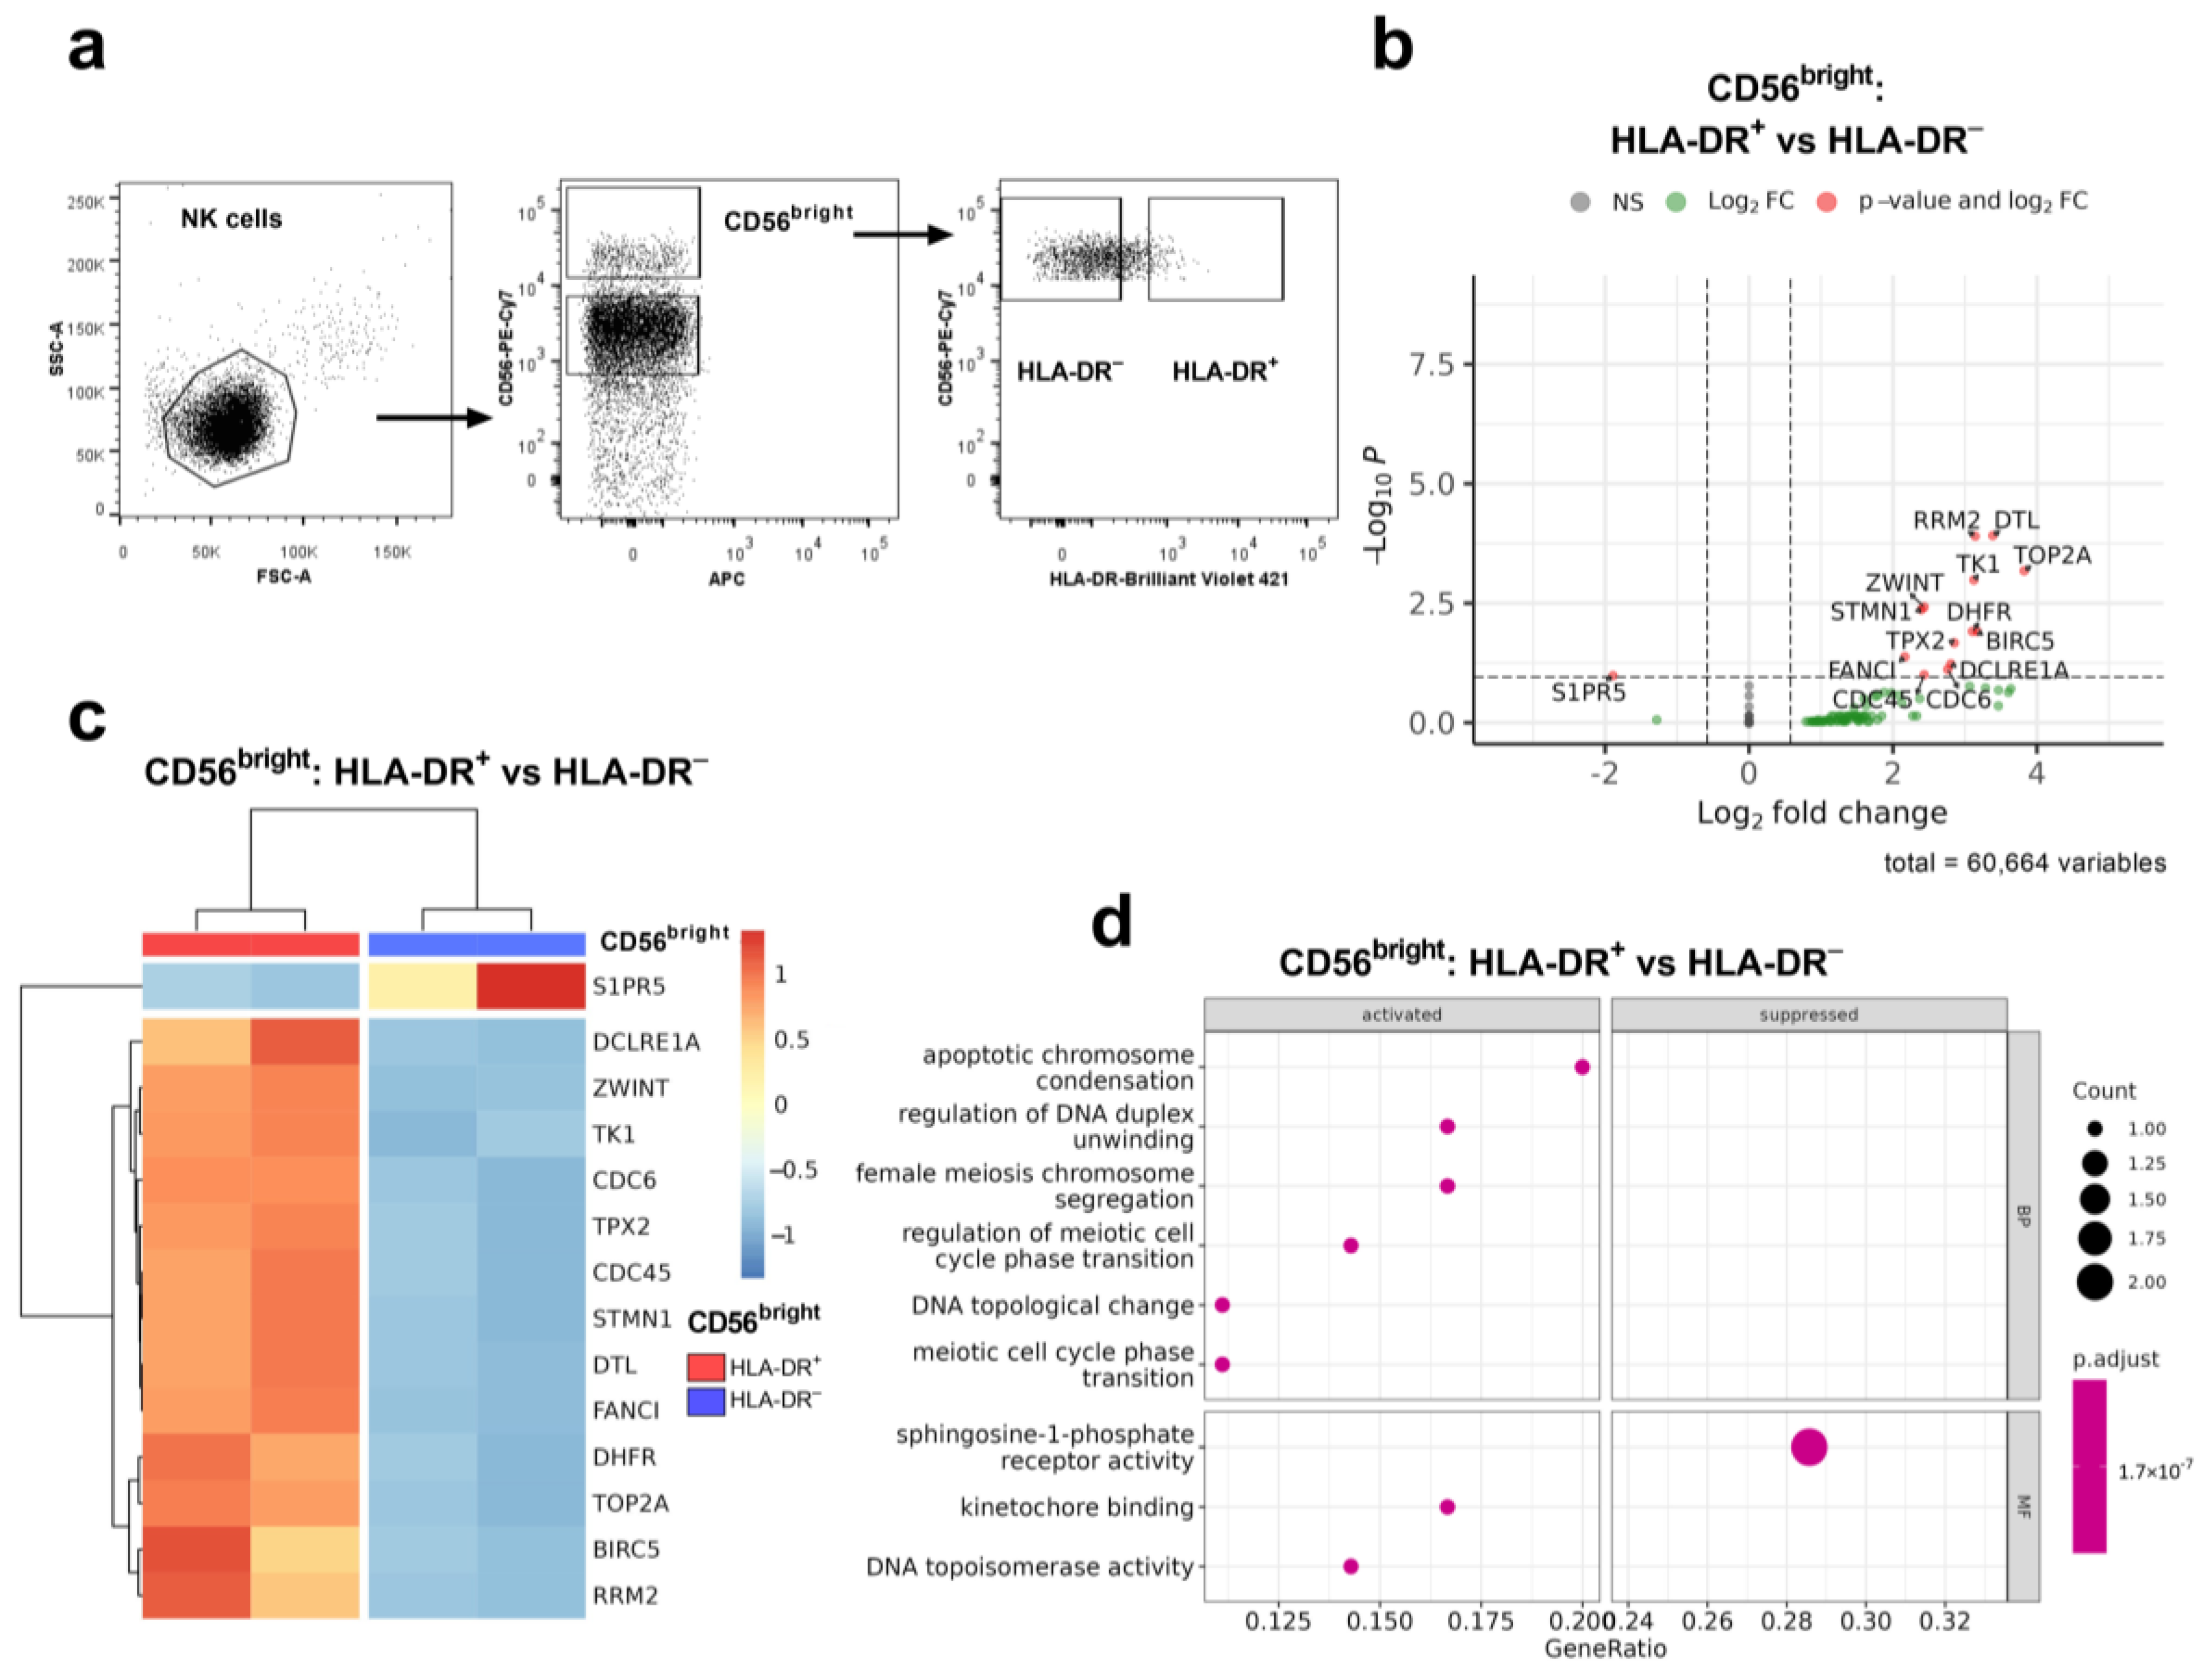
2. Results
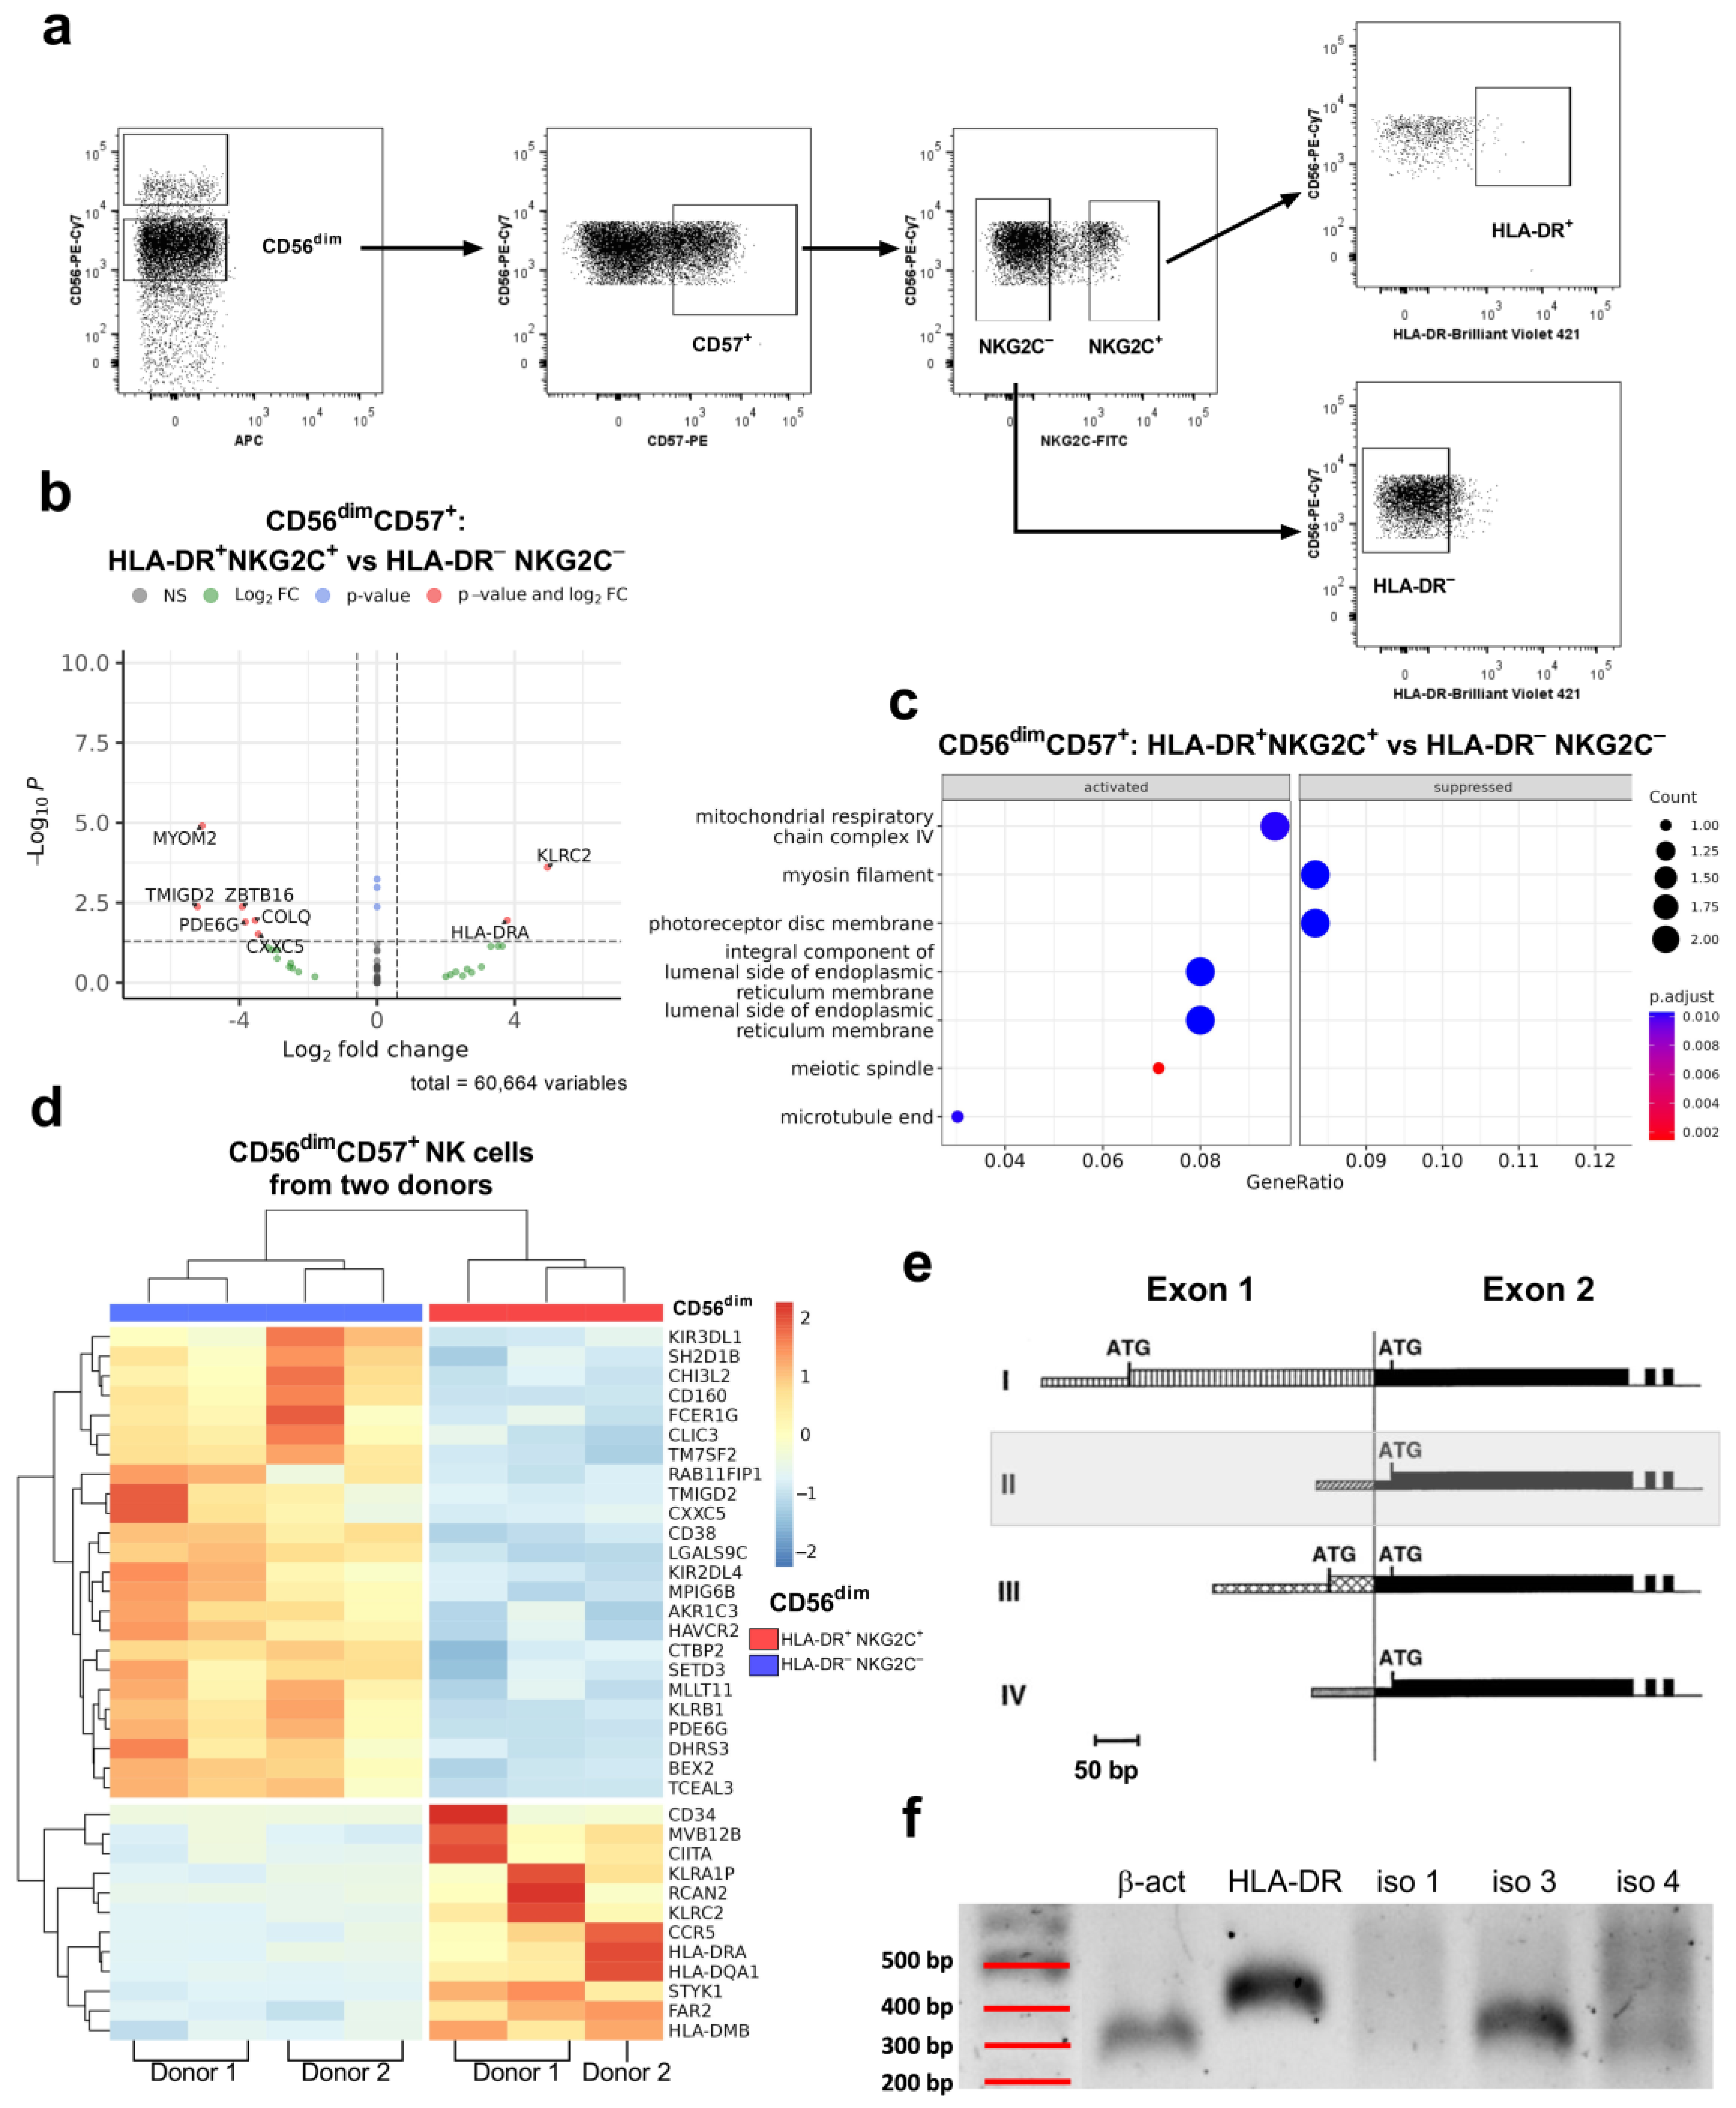
2.1. HLA-DR Expression in NK Cells Is Regulated by Isoform 3 of the Transcription Factor CIITA
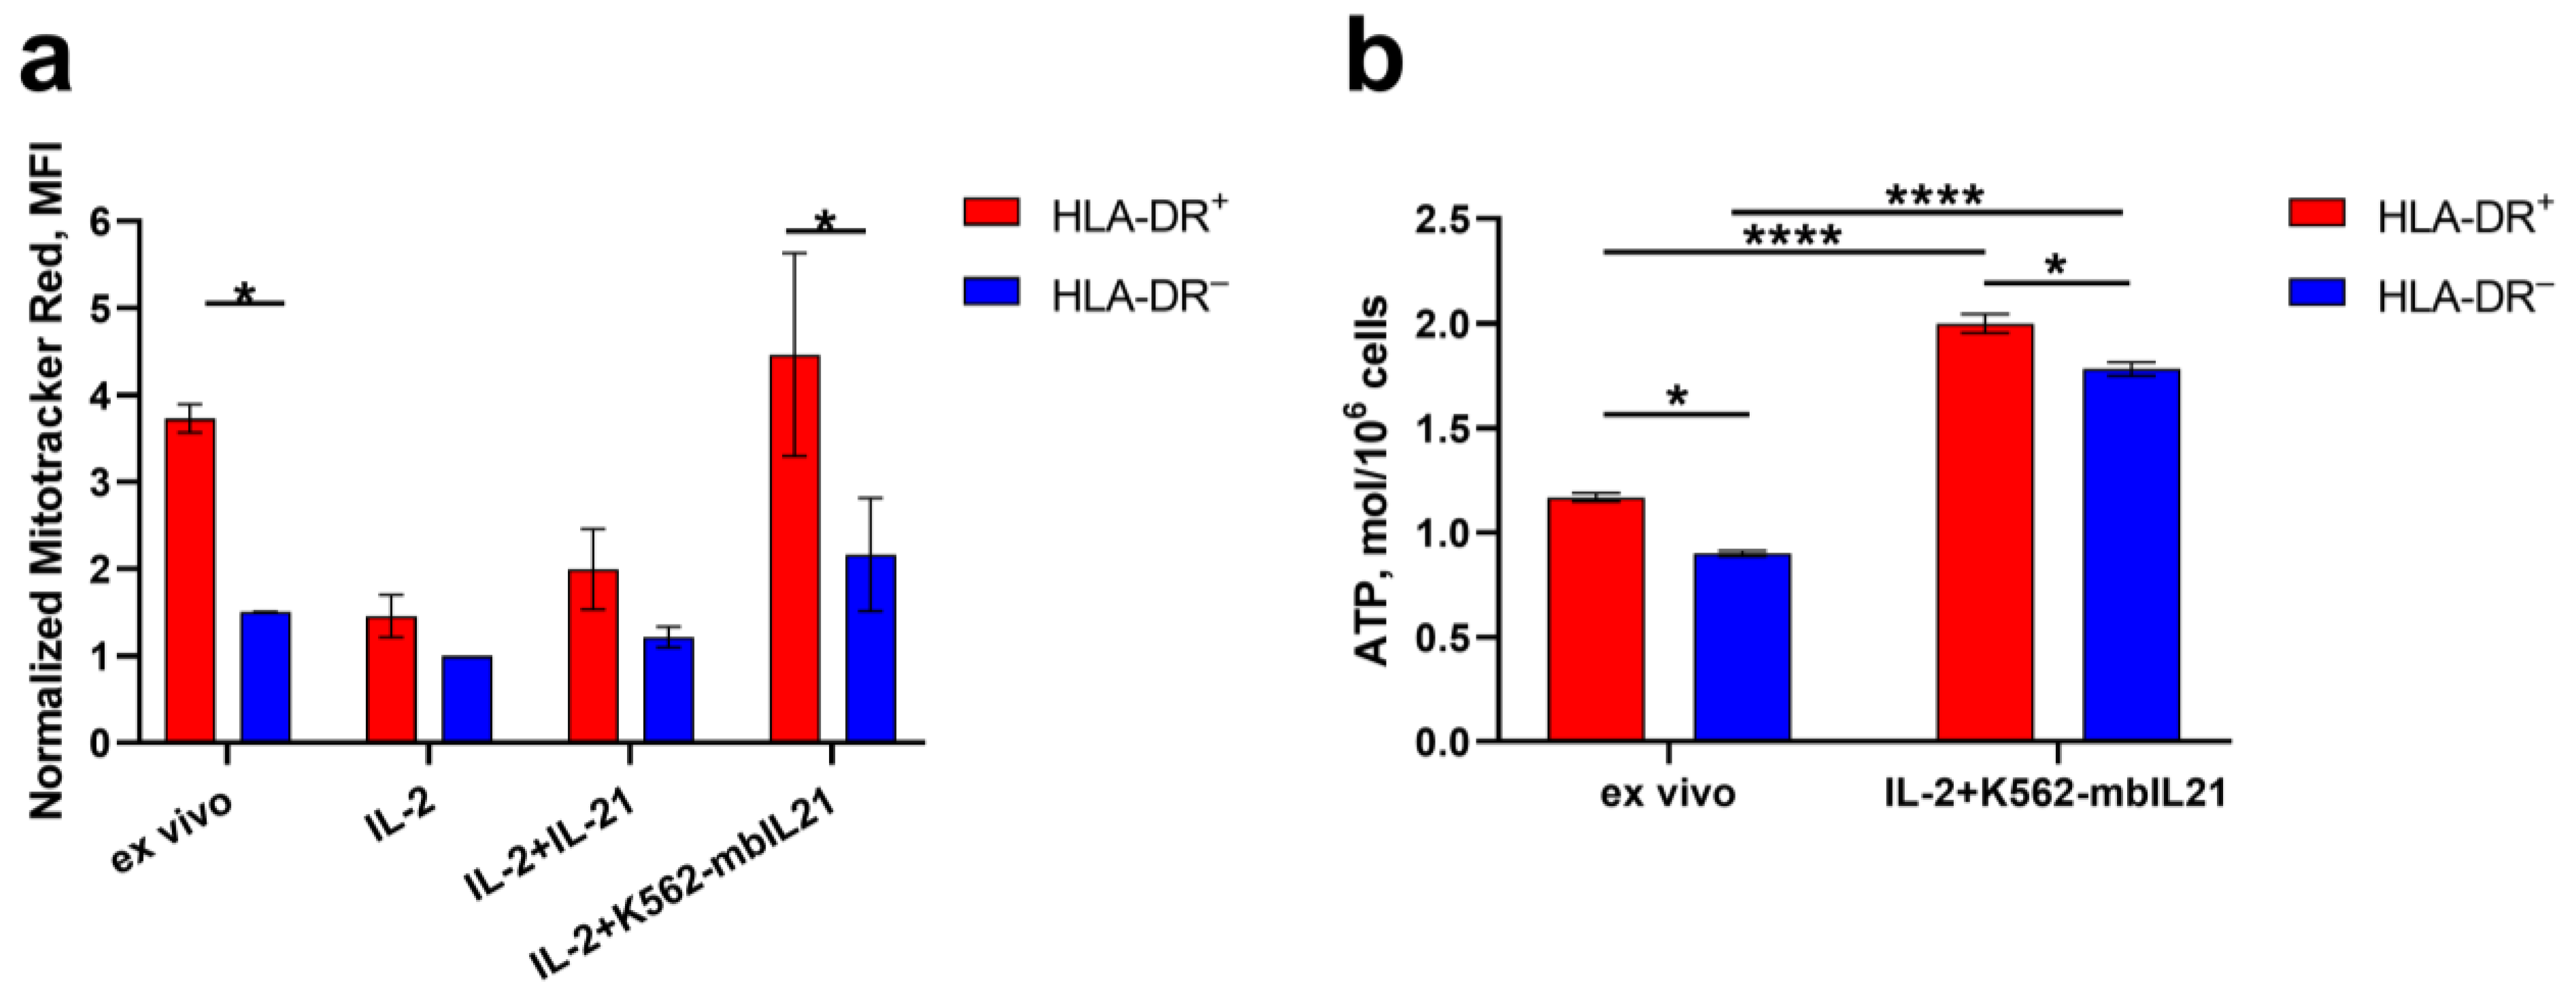
2.2. HLA-DR Expression in NK Cells Is Associated Not Only with IFNg Production, but Also with Metabolic Activation
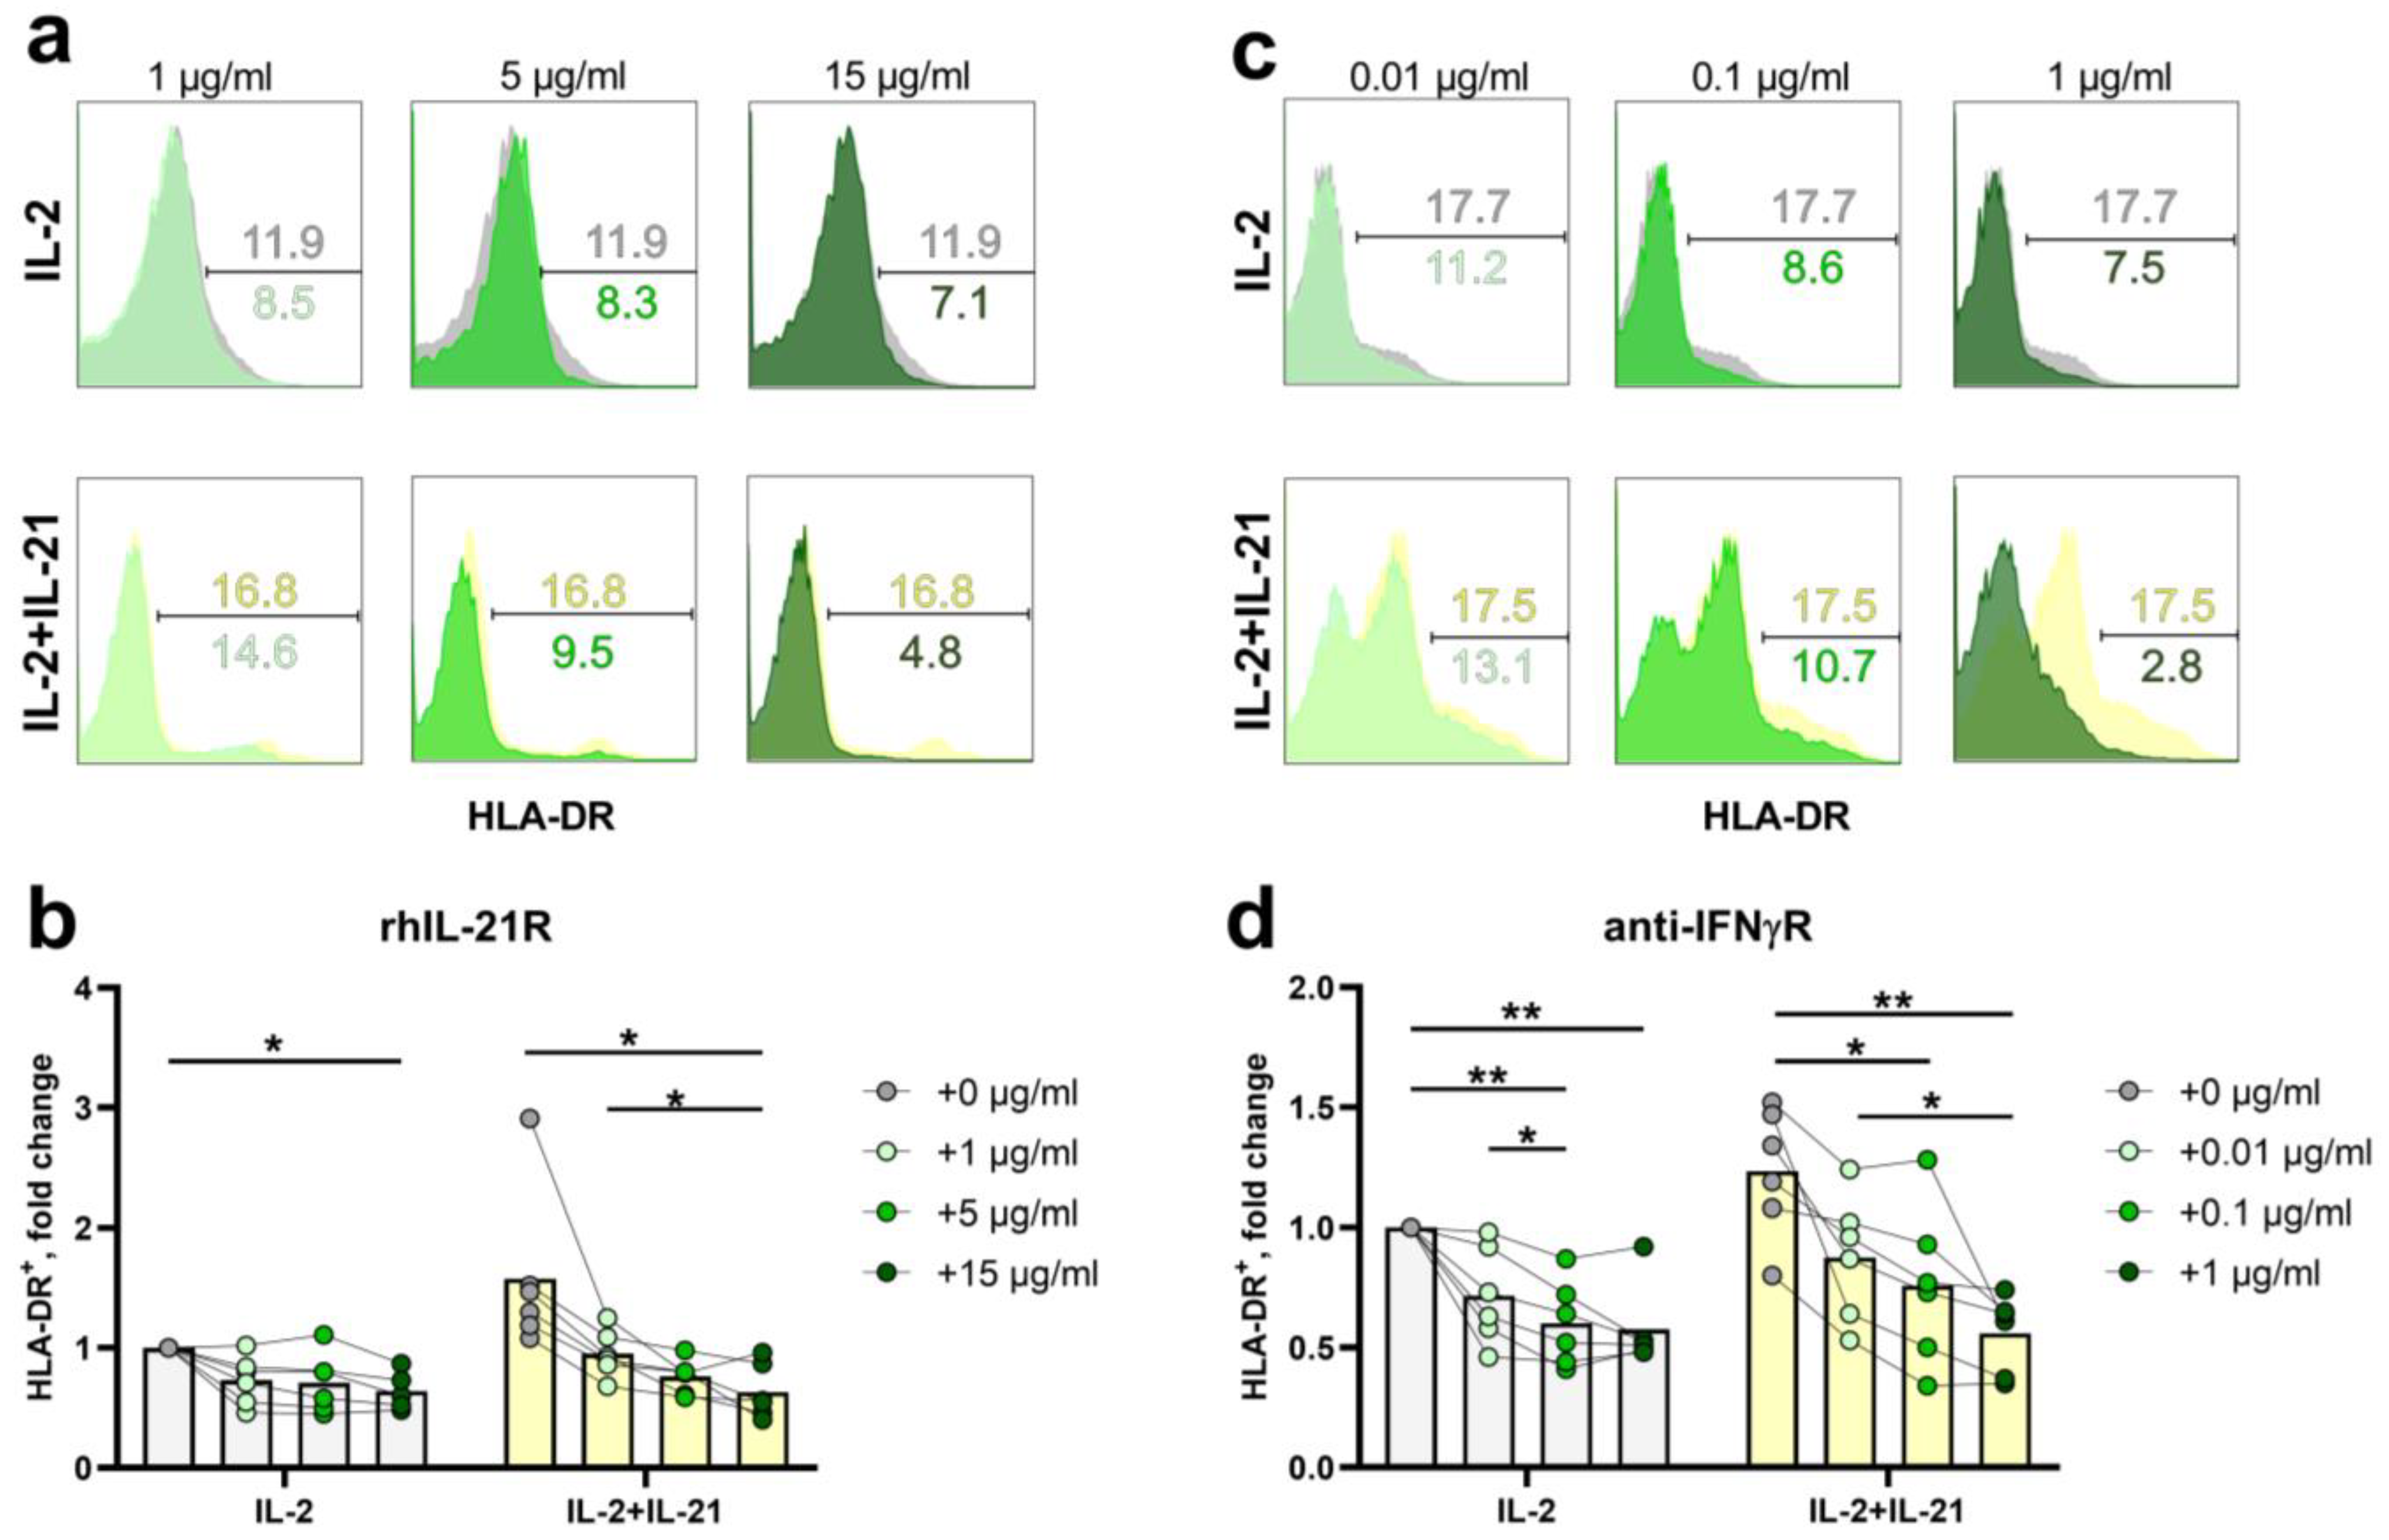
2.3. HLA-DR Expression in NK-Cells Depends Both on Exogenous IL-21 and Endogenous IFNγ
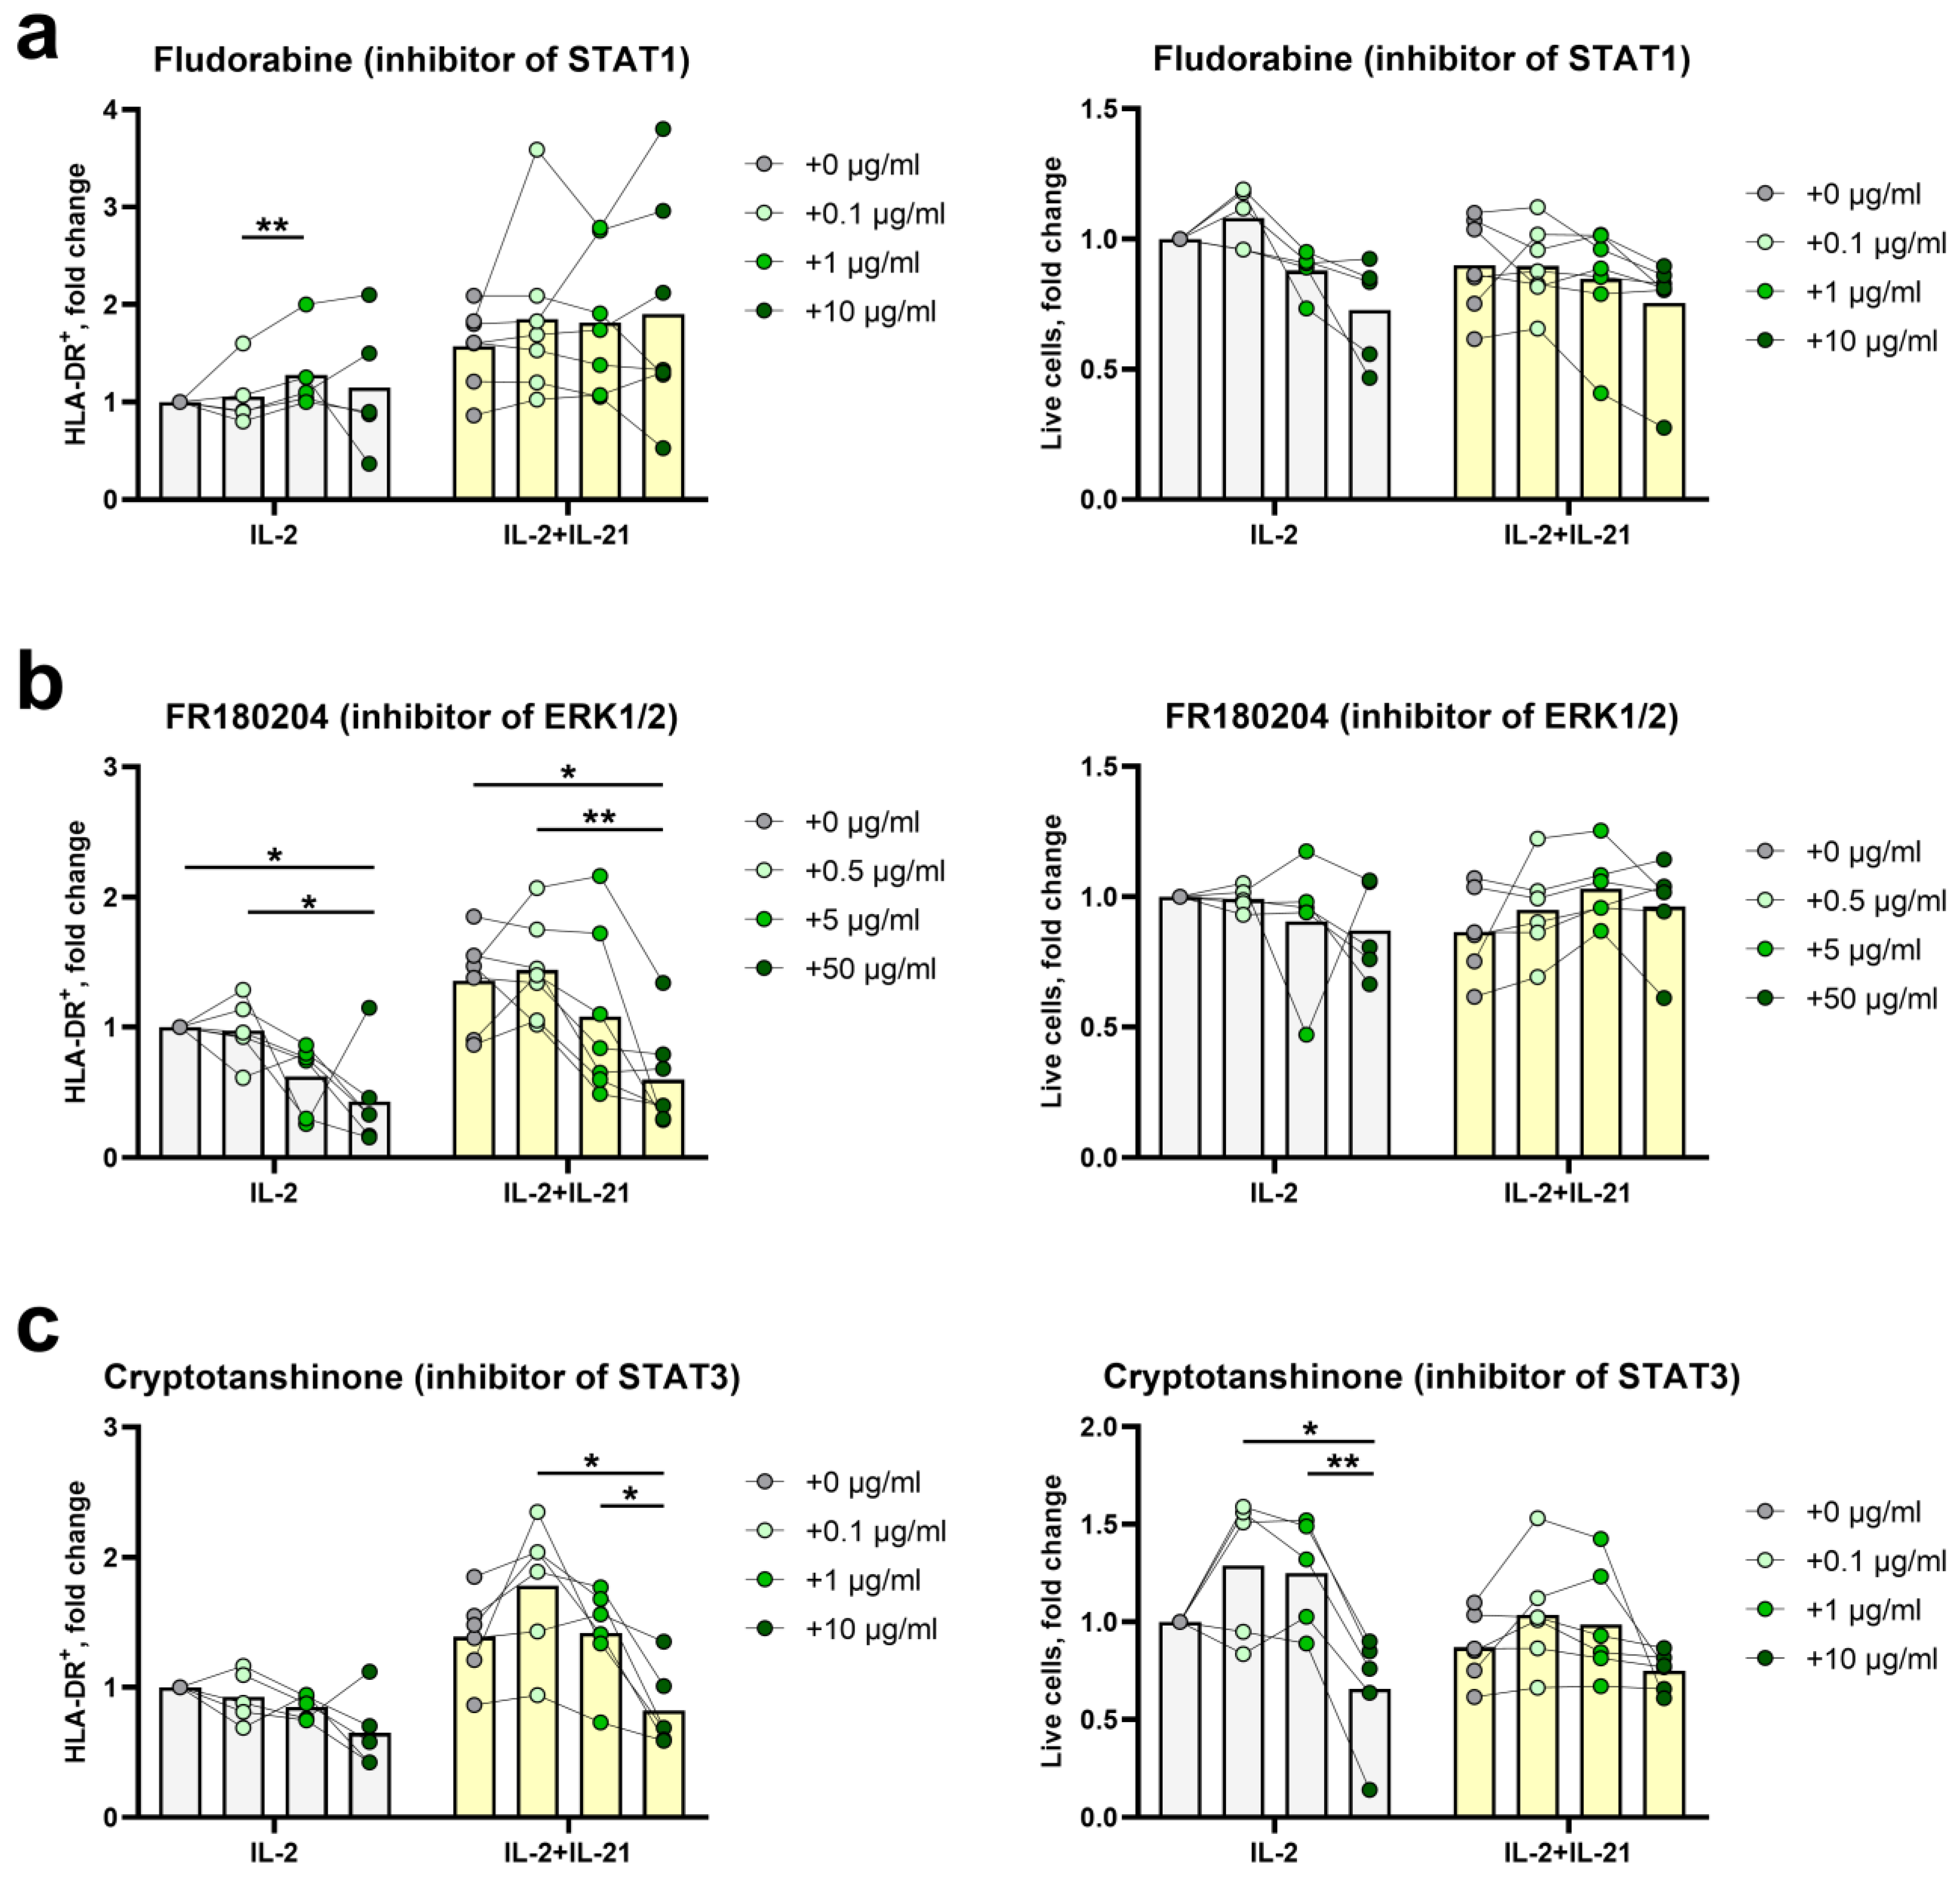
2.4. STAT3- and ERK1/2-Mediated Signal Transduction Pathways Participate in HLA-DR Induction in NK Cells
3. Discussion
4. Materials and Methods
4.1. Cell Lines
4.2. NK Cell Cultures
4.3. Flow Cytometry
4.4. NK Cell Sorting
4.5. NK Cell Cultivation with IL-21 Blocker (rhIL-21R) and IFNγR1 Blocker (Anti-IFNγR1 Antibody)
4.6. Cultivation of NK Cells with Transcription Factor Inhibitors
4.7. Evaluation of Mitochondrial Mass Volume
4.8. Measurement of ATP Content in NK Cells
4.9. RNA Preparation and Sequencing
4.10. Sequence Analysis
4.11. PCR for CIITA Isoform Identification
4.12. Statistical Analysis
Supplementary Materials
Author Contributions
Funding
Institutional Review Board Statement
Informed Consent Statement
Data Availability Statement
Conflicts of Interest
References
- Luo, Z.; Li, Z.; Martin, L.; Hu, Z.; Wu, H.; Wan, Z.; Kilby, M.; Heath, S.L.; Huang, L.; Jiang, W. Increased Natural Killer Cell Activation in HIV-Infected Immunologic Non-Responders Correlates with CD4+ T Cell Recovery after Antiretroviral Therapy and Viral Suppression. PLoS ONE 2017, 12, e0167640. [Google Scholar] [CrossRef]
- Aranami, T.; Miyake, S.; Yamamura, T. Differential Expression of CD11c by Peripheral Blood NK Cells Reflects Temporal Activity of Multiple Sclerosis. J. Immunol. 2006, 177, 5659–5667. [Google Scholar] [CrossRef]
- Pokkali, S.; Das, S.D.; Selvaraj, A. Differential Upregulation of Chemokine Receptors on CD56 NK Cells and Their Transmigration to the Site of Infection in Tuberculous Pleurisy. FEMS Immunol. Med. Microbiol. 2009, 55, 352–360. [Google Scholar] [CrossRef]
- Maucourant, C.; Filipovic, I.; Ponzetta, A.; Aleman, S.; Cornillet, M.; Hertwig, L.; Strunz, B.; Lentini, A.; Reinius, B.; Brownlie, D.; et al. Natural Killer Cell Immunotypes Related to COVID-19 Disease Severity. Sci. Immunol. 2020, 5, 6832. [Google Scholar] [CrossRef] [PubMed]
- Ustiuzhanina, M.O.; Vavilova, J.D.; Boyko, A.A.; Streltsova, M.A.; Kust, S.A.; Kanevskiy, L.M.; Sapozhnikov, A.M.; Iskhakov, R.N.; Gubernatorova, E.O.; Drutskaya, M.S.; et al. Coordinated Loss and Acquisition of NK Cell Surface Markers Accompanied by Generalized Cytokine Dysregulation in COVID-19. Int. J. Mol. Sci. 2023, 24, 1996. [Google Scholar] [CrossRef]
- Evans, R.L.; Faldetta, T.J.; Humphreys, R.E.; Pratt, D.M.; Yunis, E.J.; Schlossman, S.F. Peripheral Human T Cells Sensitized in Mixed Leukocyte Culture Synthesize and Express Ia-like Antigens. J. Exp. Med. 1978, 148, 1440. [Google Scholar] [CrossRef]
- Loyon, R.; Picard, E.; Mauvais, O.; Queiroz, L.; Mougey, V.; Pallandre, J.-R.; Galaine, J.; Mercier-Letondal, P.; Kellerman, G.; Chaput, N.; et al. IL-21-Induced MHC Class II+ NK Cells Promote the Expansion of Human Uncommitted CD4+ Central Memory T Cells in a Macrophage Migration Inhibitory Factor-Dependent Manner. J. Immunol. 2016, 197, 85–96. [Google Scholar] [CrossRef]
- Rock, K.L.; Reits, E.; Neefjes, J. Present Yourself! By MHC Class I and MHC Class II Molecules. Trends Immunol. 2016, 37, 724. [Google Scholar] [CrossRef]
- Kust, S.A.; Streltsova, M.A.; Panteleev, A.V.; Karpina, N.L.; Lyadova, I.V.; Sapozhnikov, A.M.; Kovalenko, E.I. HLA-DR-Positive NK Cells Expand in Response to Mycobacterium Tuberculosis Antigens and Mediate Mycobacteria-Induced T Cell Activation. Front. Immunol. 2021, 12, 662128. [Google Scholar] [CrossRef]
- Costa-García, M.; Ataya, M.; Moraru, M.; Vilches, C.; López-Botet, M.; Muntasell, A. Human Cytomegalovirus Antigen Presentation by HLA-DR+ NKG2C+ Adaptive NK Cells Specifically Activates Polyfunctional Effector Memory CD4+ T Lymphocytes. Front. Immunol. 2019, 10, 424481. [Google Scholar] [CrossRef]
- Burt, B.M.; Plitas, G.; Nguyen, H.M.; Stableford, J.A.; Bamboat, Z.M.; DeMatteo, R.P. Circulating HLA-DR+ Natural Killer Cells Have Potent Lytic Ability and Weak Antigen-Presenting Cell Function. Hum. Immunol. 2008, 69, 469–474. [Google Scholar] [CrossRef]
- Erokhina, S.A.; Streltsova, M.A.; Kanevskiy, L.M.; Telford, W.G.; Sapozhnikov, A.M.; Kovalenko, E.I. HLA-DR+ NK Cells Are Mostly Characterized by Less Mature Phenotype and High Functional Activity. Immunol. Cell Biol. 2018, 96, 212. [Google Scholar] [CrossRef]
- Evans, J.H.; Horowitz, A.; Mehrabi, M.; Wise, E.L.; Pease, J.E.; Riley, E.M.; Davis, D.M. A Distinct Subset of Human NK Cells Expressing HLA-DR Expand in Response to IL-2 and Can Aid Immune Responses to BCG. Eur. J. Immunol. 2011, 41, 1924. [Google Scholar] [CrossRef]
- Zeng, R.; Spolski, R.; Casas, E.; Zhu, W.; Levy, D.E.; Leonard, W.J. The Molecular Basis of IL-21–Mediated Proliferation. Blood 2007, 109, 4135. [Google Scholar] [CrossRef]
- Streltsova, M.A.; Erokhina, S.A.; Kanevskiy, L.M.; Grechikhina, M.V.; Kobyzeva, P.A.; Lee, D.A.; Telford, W.G.; Sapozhnikov, A.M.; Kovalenko, E.I. Recurrent Stimulation of Natural Killer Cell Clones with K562 Expressing Membrane-Bound Interleukin-21 Affects Their Phenotype, Interferon-γ Production, and Lifespan. Int. J. Mol. Sci. 2019, 20, 443. [Google Scholar] [CrossRef]
- Muhlethaler-Mottet, A.; Di Berardino, W.; Otten, L.A.; Mach, B. Activation of the MHC Class II Transactivator CIITA by Interferon-Gamma Requires Cooperative Interaction between Stat1 and USF-1. Immunity 1998, 8, 157–166. [Google Scholar] [CrossRef]
- Park, Y.K.; Shin, D.J.; Cho, D.; Kim, S.K.; Lee, J.J.; Shin, M.G.; Ryang, D.W.; Lee, J.S.; Park, M.H.; Yoon, J.H.; et al. Interleukin-21 Increases Direct Cytotoxicity and IFN-γ Production of Ex Vivo Expanded NK Cells towards Breast Cancer Cells. Anticancer Res. 2012, 32, 839–846. [Google Scholar]
- Ivashkiv, L.B. IFNγ: Signalling, Epigenetics and Roles in Immunity, Metabolism, Disease and Cancer Immunotherapy. Nat. Rev. Immunol. 2018, 18, 545. [Google Scholar] [CrossRef]
- LeibundGut-Landmann, S.; Waldburger, J.M.; Krawczyk, M.; Otten, L.A.; Suter, T.; Fontana, A.; Acha-Orbea, H.; Reith, W. Mini-Review: Specificity and Expression of CIITA, the Master Regulator of MHC Class II Genes. Eur. J. Immunol. 2004, 34, 1513–1525. [Google Scholar] [CrossRef]
- Muhlethaler-Mottet, A.; Otten, L.A.; Steimle, V.; Mach, B. Expression of MHC Class II Molecules in Different Cellular and Functional Compartments Is Controlled by Differential Usage of Multiple Promoters of the Transactivator CIITA. EMBO J. 1997, 16, 2851. [Google Scholar] [CrossRef] [PubMed]
- León Machado, J.A.; Steimle, V. The MHC Class II Transactivator CIITA: Not (Quite) the Odd-One-Out Anymore among NLR Proteins. Int. J. Mol. Sci. 2021, 22, 1074. [Google Scholar] [CrossRef]
- Voong, L.N.; Slater, A.R.; Kratovac, S.; Cressman, D.E. Mitogen-Activated Protein Kinase ERK1/2 Regulates the Class II Transactivator. J. Biol. Chem. 2008, 283, 9031. [Google Scholar] [CrossRef]
- Gardiner, C.M.; Finlay, D.K. What Fuels Natural Killers? Metabolism and NK Cell Responses. Front. Immunol. 2017, 8, 367. [Google Scholar] [CrossRef]
- O’Brien, K.L.; Finlay, D.K. Immunometabolism and Natural Killer Cell Responses. Nat. Rev. Immunol. 2019, 19, 282–290. [Google Scholar] [CrossRef] [PubMed]
- Gumá, M.; Budt, M.; Sáez, A.; Brckalo, T.; Hengel, H.; Angulo, A.; López-Botet, M. Expansion of CD94/NKG2C+ NK Cells in Response to Human Cytomegalovirus-Infected Fibroblasts. Blood 2006, 107, 3624–3631. [Google Scholar] [CrossRef] [PubMed]
- Ustiuzhanina, M.O.; Streltsova, M.A.; Timofeev, N.D.; Kryukov, M.A.; Chudakov, D.M.; Kovalenko, E.I. Autologous T-Cell-Free Antigen Presentation System Unveils HCMV-Specific NK Cell Response. Cells 2024, 13, 530. [Google Scholar] [CrossRef]
- Lee, J.; Zhang, T.; Hwang, I.; Kim, A.; Nitschke, L.; Kim, M.J.; Scott, J.M.; Kamimura, Y.; Lanier, L.L.; Kim, S. Epigenetic Modification and Antibody-Dependent Expansion of Memory-like NK Cells in Human Cytomegalovirus-Infected Individuals. Immunity 2015, 42, 431. [Google Scholar] [CrossRef] [PubMed]
- Qi, C.; Liu, F.; Zhang, W.; Han, Y.; Zhang, N.; Liu, Q.; Li, H. Alzheimer’s Disease Alters the Transcriptomic Profile of Natural Killer Cells at Single-Cell Resolution. Front. Immunol. 2022, 13, 1004885. [Google Scholar] [CrossRef]
- Keating, S.E.; Zaiatz-Bittencourt, V.; Loftus, R.M.; Keane, C.; Brennan, K.; Finlay, D.K.; Gardiner, C.M. Metabolic Reprogramming Supports IFN-γ Production by CD56bright NK Cells. J. Immunol. 2016, 196, 2552–2560. [Google Scholar] [CrossRef]
- Cichocki, F.; Wu, C.Y.; Zhang, B.; Felices, M.; Tesi, B.; Tuininga, K.; Dougherty, P.; Taras, E.; Hinderlie, P.; Blazar, B.R.; et al. ARID5B Regulates Metabolic Programming in Human Adaptive NK Cells. J. Exp. Med. 2018, 215, 2379. [Google Scholar] [CrossRef]
- Thornton, S.; Kuhn, K.A.; Finkelman, F.D.; Hirsch, R. NK Cells Secrete High Levels of IFN-γ in Response to In Vivo Administration of IL-2. Eur. J. Immunol. 2001, 31, 3355–3360. [Google Scholar] [CrossRef]
- Gough, D.J.; Levy, D.E.; Johnstone, R.W.; Clarke, C.J. IFNgamma Signaling-Does It Mean JAK-STAT? Cytokine Growth Factor Rev. 2008, 19, 383–394. [Google Scholar] [CrossRef] [PubMed]
- Hanafi, L.A.; Gauchat, D.; Godin-Ethier, J.; Possamaï, D.; Duvignaud, J.B.; Leclerc, D.; Grandvaux, N.; Lapointe, R. Fludarabine Downregulates Indoleamine 2,3-Dioxygenase in Tumors via a Proteasome-Mediated Degradation Mechanism. PLoS ONE 2014, 9, 99211. [Google Scholar] [CrossRef]
- Honda, M.; Kanno, T.; Fujita, Y.; Gotoh, A.; Nakano, T.; Nishizaki, T. Mesothelioma Cell Proliferation through Autocrine Activation of PDGF-Ββ Receptor. Cell. Physiol. Biochem. 2012, 29, 667–674. [Google Scholar] [CrossRef]
- Li, X.; Chen, M.; Wan, Y.; Zhong, L.; Han, X.; Chen, X.; Xiao, F.; Liu, J.; Zhang, Y.; Zhu, D.; et al. Single-cell Transcriptome Profiling Reveals the Key Role of ZNF683 in Natural Killer Cell Exhaustion in Multiple Myeloma. Clin. Transl. Med. 2022, 12, e1065. [Google Scholar] [CrossRef]
- Schlums, H.; Cichocki, F.; Tesi, B.; Theorell, J.; Beziat, V.; Holmes, T.D.; Han, H.; Chiang, S.C.C.; Foley, B.; Mattsson, K.; et al. Cytomegalovirus Infection Drives Adaptive Epigenetic Diversification of NK Cells with Altered Signaling and Effector Function. Immunity 2015, 42, 443. [Google Scholar] [CrossRef] [PubMed]
- Shemesh, A.; Su, Y.; Calabrese, D.R.; Chen, D.; Arakawa-Hoyt, J.; Roybal, K.T.; Heath, J.R.; Greenland, J.R.; Lanier, L.L. Diminished Cell Proliferation Promotes Natural Killer Cell Adaptive-like Phenotype by Limiting FcεRIγ Expression. J. Exp. Med. 2022, 219, e20220551. [Google Scholar] [CrossRef]
- Sun, Z.; Li, Y.; Zhang, Z.; Fu, Y.; Han, X.; Hu, Q.; Ding, H.; Shang, H.; Jiang, Y. CD160 Promotes NK Cell Functions by Upregulating Glucose Metabolism and Negatively Correlates With HIV Disease Progression. Front. Immunol. 2022, 13, 854432. [Google Scholar] [CrossRef] [PubMed]
- Yang, C.; Siebert, J.R.; Burns, R.; Gerbec, Z.J.; Bonacci, B.; Rymaszewski, A.; Rau, M.; Riese, M.J.; Rao, S.; Carlson, K.S.; et al. Heterogeneity of Human Bone Marrow and Blood Natural Killer Cells Defined by Single-Cell Transcriptome. Nat. Commun. 2019, 10, 3931. [Google Scholar] [CrossRef]
- Dao, T.N.; Utturkar, S.; Lanman, N.A.; Matosevic, S. TIM-3 Expression Is Downregulated on Human NK Cells in Response to Cancer Targets in Synergy with Activation. Cancers 2020, 12, 2417. [Google Scholar] [CrossRef]
- Abel, A.M.; Yang, C.; Thakar, M.S.; Malarkannan, S. Natural Killer Cells: Development, Maturation, and Clinical Utilization. Front. Immunol. 2018, 9, 396989. [Google Scholar] [CrossRef] [PubMed]
- Ustiuzhanina, M.O.; Britanova, O.V.; Kovalenko, E.I. The Impact of SARS-CoV-2 Peptides on Activation of NK Cells. Med. Acad. J. 2022, 22, 261–268. [Google Scholar] [CrossRef]
- Zhuang, X.; Long, E.O. CD28 Homolog Is a Strong Activator of Natural Killer Cells for Lysis of B7H7+ Tumor Cells. Cancer Immunol. Res. 2019, 7, 939. [Google Scholar] [CrossRef] [PubMed]
- Crespo, J.; Vatan, L.; Maj, T.; Liu, R.; Kryczek, I.; Zou, W. Phenotype and Tissue Distribution of CD28H+ Immune Cell Subsets. Oncoimmunology 2017, 6, e1362529. [Google Scholar] [CrossRef] [PubMed]
- Ran, G.H.; Lin, Y.Q.; Tian, L.; Zhang, T.; Yan, D.M.; Yu, J.H.; Deng, Y.C. Natural Killer Cell Homing and Trafficking in Tissues and Tumors: From Biology to Application. Signal Transduct. Target. Ther. 2022, 7, 205. [Google Scholar] [CrossRef]
- Miller, J.S.; Alley, K.A.; Mcglave, P. Differentiation of Natural Killer (NK) Cells from Human Primitive Marrow Progenitors in a Stroma-Based Long-Term Culture System: Identification of a CD34+7+ NK Progenitor. Blood 1994, 83, 2594–2601. [Google Scholar] [CrossRef]
- Bezman, N.A.; Kim, C.C.; Sun, J.C.; Min-Oo, G.; Hendricks, D.W.; Kamimura, Y.; Best, J.A.; Goldrath, A.W.; Lanier, L.L.; Gautier, E.L.; et al. ImmGen Report: Molecular Definition of Natural Killer Cell Identity and Activation. Nat. Immunol. 2012, 13, 1000. [Google Scholar] [CrossRef] [PubMed]
- Coquet, J.M.; Kyparissoudis, K.; Pellicci, D.G.; Besra, G.; Berzins, S.P.; Smyth, M.J.; Godfrey, D.I. IL-21 Is Produced by NKT Cells and Modulates NKT Cell Activation and Cytokine Production. J. Immunol. 2007, 178, 2827–2834. [Google Scholar] [CrossRef] [PubMed]
- Morgan, J.E.; Shanderson, R.L.; Boyd, N.H.; Cacan, E.; Greer, S.F. The Class II Transactivator (CIITA) Is Regulated by Post-Translational Modification Cross-Talk between ERK1/2 Phosphorylation, Mono-Ubiquitination and Lys63 Ubiquitination. Biosci. Rep. 2015, 35, 233. [Google Scholar] [CrossRef]
- Kim, H.; Suh, J.M.; Hwang, E.S.; Kim, D.W.; Chung, H.K.; Song, J.H.; Hwang, J.H.; Park, K.C.; Ro, H.K.; Jo, E.-K.; et al. Thyrotropin-Mediated Repression of Class II Trans-Activator Expression in Thyroid Cells: Involvement of STAT3 and Suppressor of Cytokine Signaling. J. Immunol. 2003, 171, 616–627. [Google Scholar] [CrossRef]
- Erokhina, S.A.; Streltsova, M.A.; Kanevskiy, L.M.; Grechikhina, M.V.; Sapozhnikov, A.M.; Kovalenko, E.I. HLA-DR-Expressing NK Cells: Effective Killers Suspected for Antigen Presentation. J. Leukoc. Biol. 2021, 109, 327–337. [Google Scholar] [CrossRef] [PubMed]
- Suto, A.; Nakajima, H.; Hirose, K.; Suzuki, K.; Kagami, S.I.; Seto, Y.; Hoshimoto, A.; Saito, Y.; Foster, D.C.; Iwamoto, I. Interleukin 21 Prevents Antigen-Induced IgE Production by Inhibiting Germ Line C(Epsilon) Transcription of IL-4-Stimulated B Cells. Blood 2002, 100, 4565–4573. [Google Scholar] [CrossRef] [PubMed]
- Huang, Z.; Chu, M.; Chen, X.; Wang, Z.; Jiang, L.; Ma, Y.; Wang, Y. Th2A Cells: The Pathogenic Players in Allergic Diseases. Front. Immunol. 2022, 13, 916778. [Google Scholar] [CrossRef] [PubMed]
- Dobin, A.; Davis, C.A.; Schlesinger, F.; Drenkow, J.; Zaleski, C.; Jha, S.; Batut, P.; Chaisson, M.; Gingeras, T.R. STAR: Ultrafast Universal RNA-Seq Aligner. Bioinformatics 2013, 29, 15–21. [Google Scholar] [CrossRef] [PubMed]
- Liao, Y.; Smyth, G.K.; Shi, W. FeatureCounts: An Efficient General Purpose Program for Assigning Sequence Reads to Genomic Features. Bioinformatics 2014, 30, 923–930. [Google Scholar] [CrossRef]
- Love, M.I.; Huber, W.; Anders, S. Moderated Estimation of Fold Change and Dispersion for RNA-Seq Data with DESeq2. Genome Biol. 2014, 15, 550. [Google Scholar] [CrossRef]
- Zhu, A.; Ibrahim, J.G.; Love, M.I. Heavy-Tailed Prior Distributions for Sequence Count Data: Removing the Noise and Preserving Large Differences. Bioinformatics 2019, 35, 2084–2092. [Google Scholar] [CrossRef]
Disclaimer/Publisher’s Note: The statements, opinions and data contained in all publications are solely those of the individual author(s) and contributor(s) and not of MDPI and/or the editor(s). MDPI and/or the editor(s) disclaim responsibility for any injury to people or property resulting from any ideas, methods, instructions or products referred to in the content. |
© 2024 by the authors. Licensee MDPI, Basel, Switzerland. This article is an open access article distributed under the terms and conditions of the Creative Commons Attribution (CC BY) license (https://creativecommons.org/licenses/by/4.0/).
Share and Cite
Kust, S.A.; Ustiuzhanina, M.O.; Streltsova, M.A.; Shelyakin, P.V.; Kryukov, M.A.; Lutsenko, G.V.; Sudarikova, A.V.; Merzlyak, E.M.; Britanova, O.V.; Sapozhnikov, A.M.; et al. HLA-DR Expression in Natural Killer Cells Marks Distinct Functional States, Depending on Cell Differentiation Stage. Int. J. Mol. Sci. 2024, 25, 4609. https://doi.org/10.3390/ijms25094609
Kust SA, Ustiuzhanina MO, Streltsova MA, Shelyakin PV, Kryukov MA, Lutsenko GV, Sudarikova AV, Merzlyak EM, Britanova OV, Sapozhnikov AM, et al. HLA-DR Expression in Natural Killer Cells Marks Distinct Functional States, Depending on Cell Differentiation Stage. International Journal of Molecular Sciences. 2024; 25(9):4609. https://doi.org/10.3390/ijms25094609
Chicago/Turabian StyleKust, Sofya A., Maria O. Ustiuzhanina, Maria A. Streltsova, Pavel V. Shelyakin, Maxim A. Kryukov, Gennady V. Lutsenko, Anna V. Sudarikova, Ekaterina M. Merzlyak, Olga V. Britanova, Alexandr M. Sapozhnikov, and et al. 2024. "HLA-DR Expression in Natural Killer Cells Marks Distinct Functional States, Depending on Cell Differentiation Stage" International Journal of Molecular Sciences 25, no. 9: 4609. https://doi.org/10.3390/ijms25094609