2.1. Optimization of Extraction Parameters
In order to enhance extraction efficiency, it is imperative to optimize the extraction parameters. The extraction process may be multifaceted due to the presence of various bioactive compounds, which can lead to variations in solubility and polarity [
25]. Moreover, the extraction technique and diverse processing parameters exert a significant influence on the extract yield and antioxidant capacity. Hence, it is vital to increase the performance of this process [
26]. Recently, there has been remarkable growth in the development of extraction methods that reduce the reliance on harmful and toxic solvents, preserve human well-being, and require minimal energy. The incorporation of an environmentally sustainable solvent is vital for the efficient execution of this methodology [
27]. Water is a readily accessible and sustainable solvent due to its exceptional efficacy in extracting polar compounds, cost-effectiveness, and non-toxicity towards humans [
27]. Considering all these, and to achieve maximum recovery of bioactive compounds, various parameters such as extraction temperature and duration, pressure, and liquid-to-solid ratio were examined. These parameters were examined in combination, as shown in
Table 1.
Table 1 also shows the values of TPC, total flavonoid content (TFC), ferric reducing antioxidant power (FRAP), 2,2-diphenyl-1-picrylhydrazyl (DPPH), and anti-hydrogen peroxide activity (AHPA), which were used as criteria to optimize the extraction process. Additional parameters evaluated for optimization were ascorbic acid content (AAC) and albumin denaturation inhibition (ADI), which are shown in
Table 2 along with the color analysis of each extract.
According to the results displayed in
Table 1, it can be remarked that the liquid-to-solid ratio impacts the extraction performance, since when the ratio increases, the recovery of bioactive compounds increases too. Regarding pressure, lower values do not seem to favor the recovery of bioactive compounds, while higher values appear to increase the recovery, suggesting that the combination of high temperature and high-pressure conditions can significantly diminish the strong interaction between the solute and the matrix, which arises from van der Waals forces or hydrogen bonds, as well as the dipole attraction between solute molecules and the active sites of the sample matrix [
28]. This enhances the efficiency of extracting solute molecules, decreases the energy required for analysis, and lowers the viscosity of the solvent. Consequently, it reduces the solvent resistance to the sample matrix and facilitates its diffusion into the sample [
28]. The color analyses in
Table 2 indicate that the higher the ratio, the lighter the color of the extracts. Also, it can be observed that intermediate pressure values lead to high albumin denaturation inhibition of the extracts, which could imply a possible anti-inflammatory activity of the extracts, while the ascorbic acid content is not considerably affected by the pressure value at which the extraction takes place.
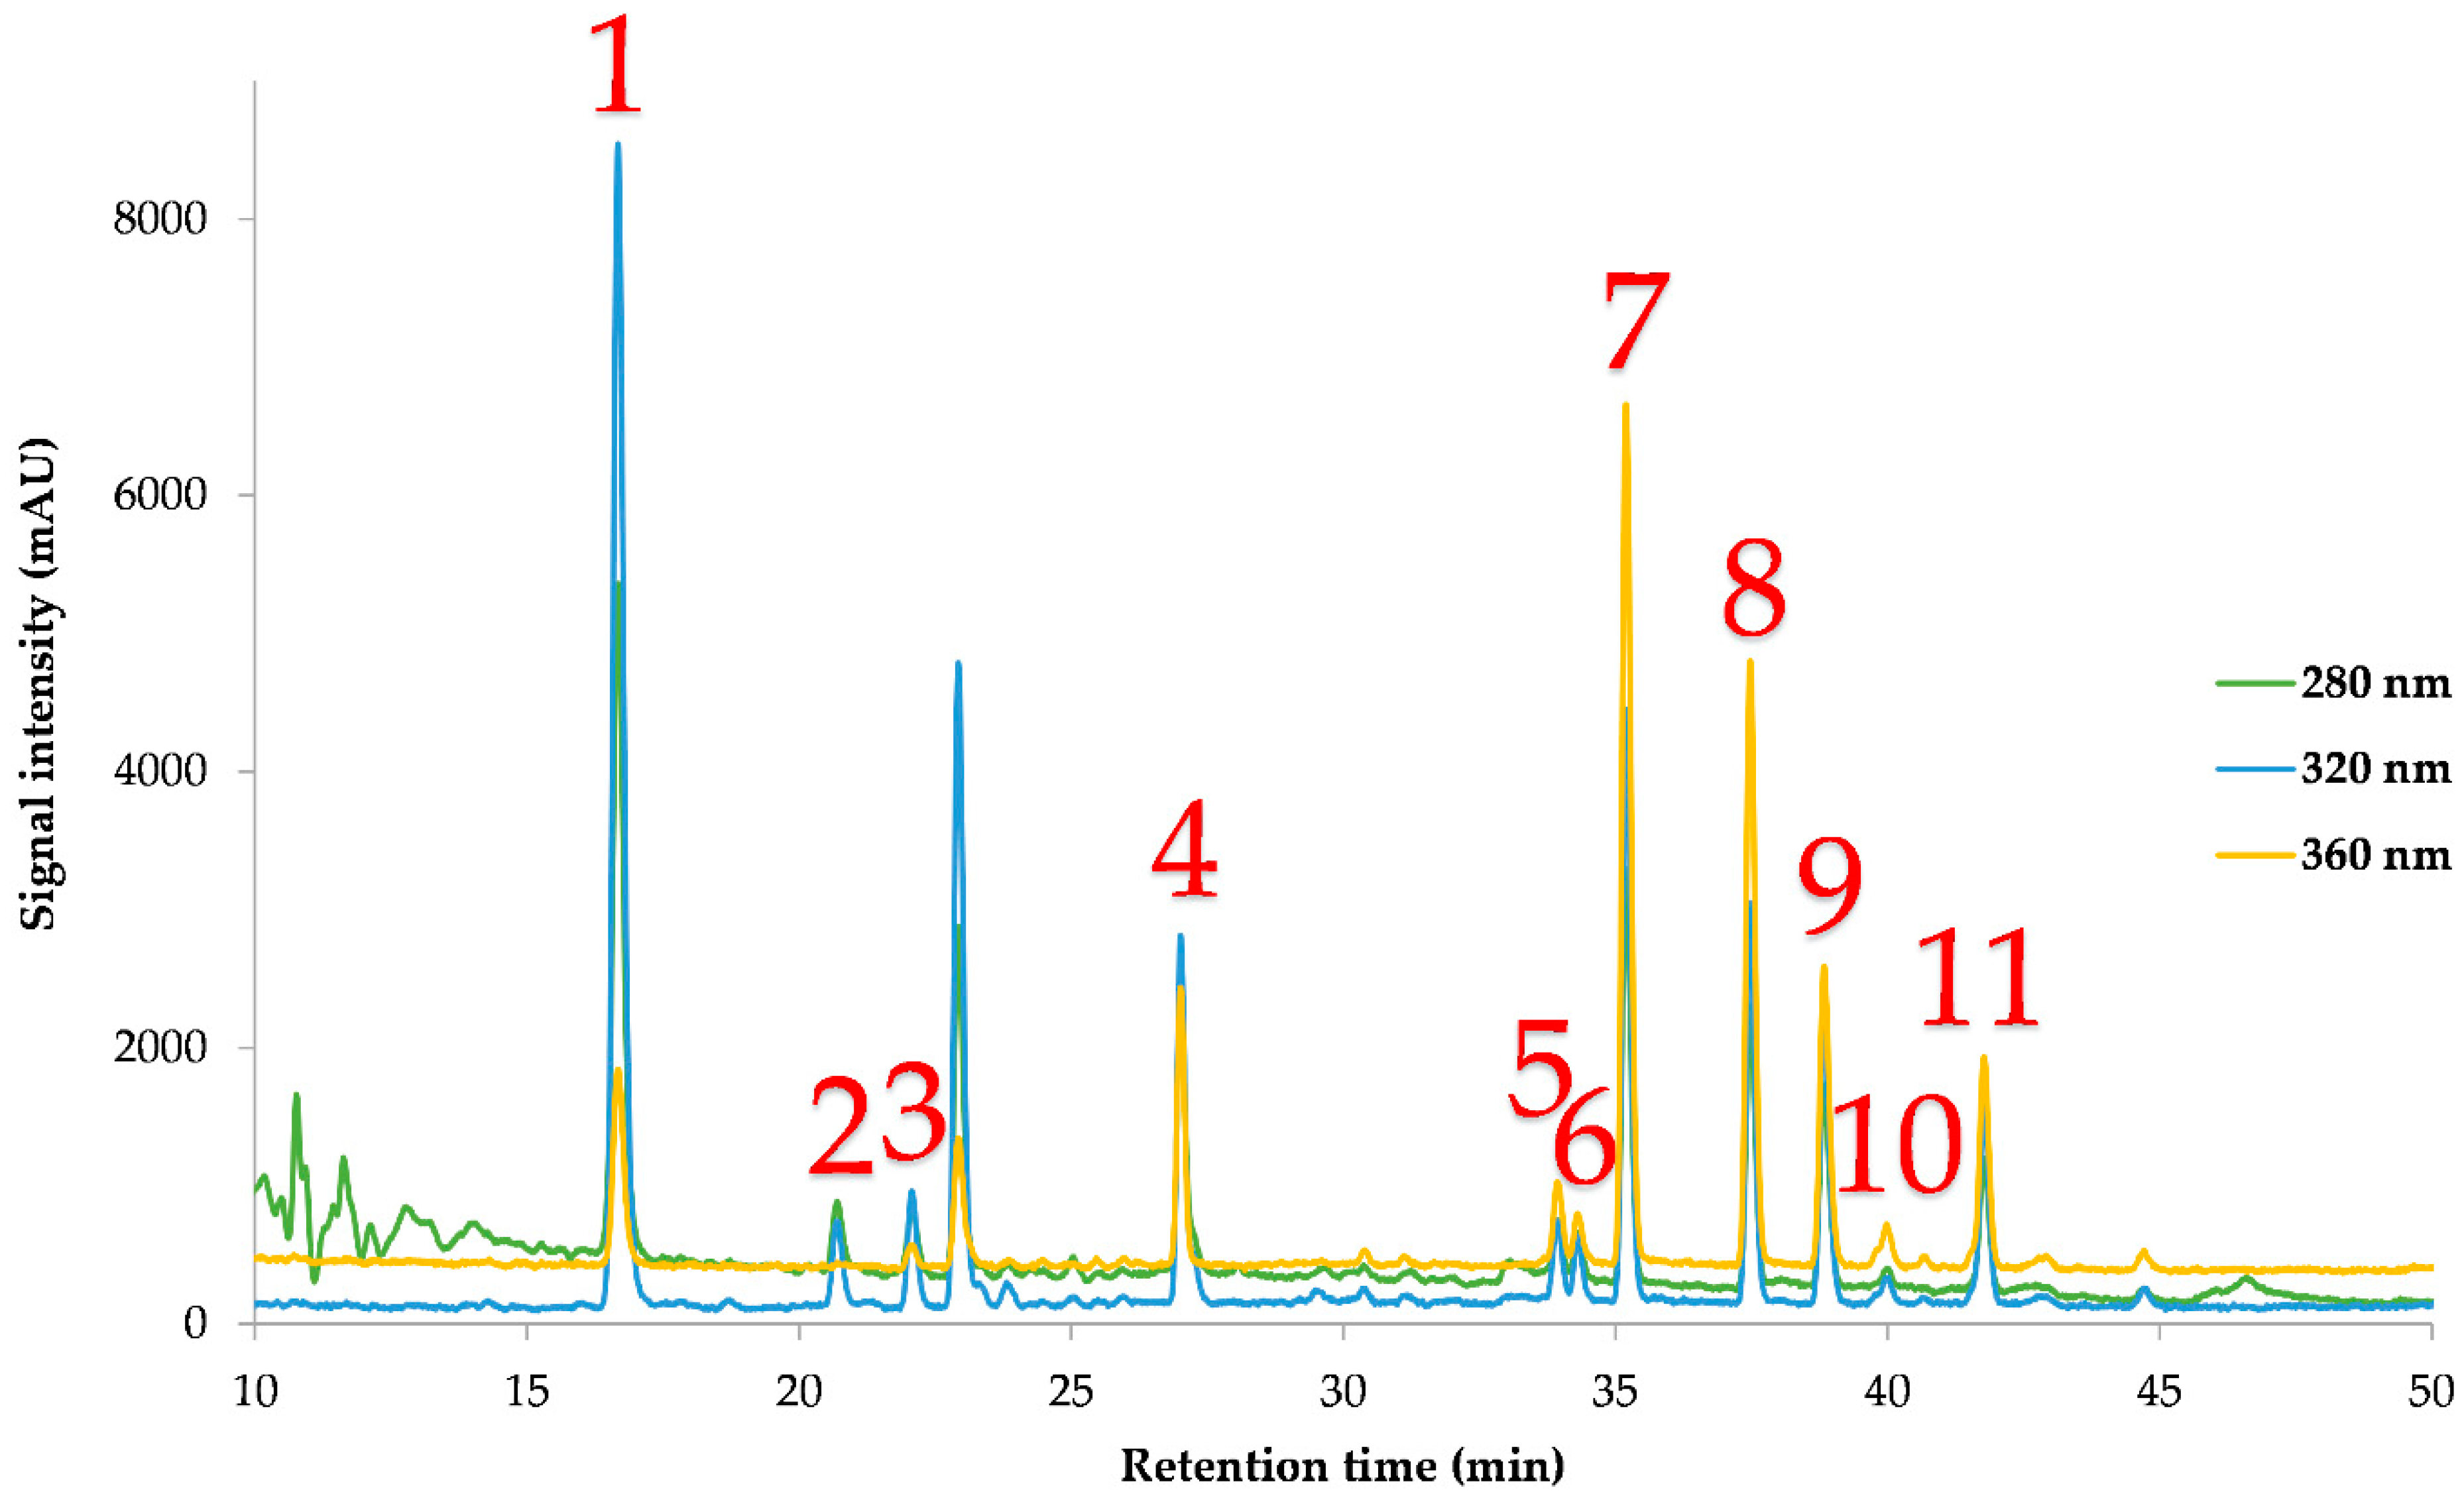
Table 3 shows the concentrations of the individual polyphenols determined by HPLC-DAD from each analysis under different PLE conditions, and
Figure 1 shows a representative chromatogram of an MO extract. Based on the findings presented in
Table 3, it can be inferred that neochlorogenic acid is the main compound in the MO PLE extracts, followed by quercetin-3-β-
D-glucoside and myricetin and kaempferol-3-glucoside. These results are in line with other studies [
6,
29], in which these polyphenols have been detected, too. More specifically, Nouman et al. [
29] also reported neochlorogenic acid (3-caffeoylquinic acid) to be the main compound in MO leaf extracts through liquid chromatography-mass spectrometry, followed by kaempferol-3-glucoside. As can be seen in
Figure 1, there are some unidentified peaks. According to the literature, the unidentified peak at ~23 min could possibly be attributed to the presence of cryptochlorogenic acid, as the absorbance spectrum is similar to that of the unknown compound, which is known to exist in MO leaves in sufficient amounts [
30,
31,
32]. In
Figure S1, the UV spectra of the unknown peak are depicted, and they match the UV spectra for cryptochlorogenic acid, provided in an earlier study [
32], strengthening our tentative identification.
Table S1 displays the statistical parameters, second-order polynomial equations (models), and coefficients (coefficients > 0.92) derived for each model, indicating a strong match for the developed models.
Figures S2–S6 provide plots comparing the actual response to the projected response for each parameter under examination, along with the desirability functions.
Figures S7–S11 exhibit three-dimensional response plots for all responses under investigation.
Taking into consideration
Figure S2, it is apparent that there is an excellent fit of the developed model to the responses of the TPC of the extracts, with the desirability function being ~0.99. In
Figure S3, it can be observed that the developed models predicting the responses of the TFC have a good fit, too. The same conclusion can be drawn by observing
Figures S4–S6, which refer to the antioxidant capacity of the extracts through DPPH assay, FRAP assay, and AHPA assay, respectively, demonstrating high desirability functions, too.
Figures S7–S11 point out that higher values of pressure, temperature, and ratio were considerably effective for achieving the maximum yield, even at short extraction durations, across all parameters examined (TPC, TFC, FRAP, DPPH, and AHPA). Optimizing extraction length and temperature is crucial for minimizing the consumption of energy in the extraction process. Given the verified efficacy of both brief and extended extraction periods in previous studies, an in-depth investigation is necessary to assess the impact of time on extraction [
27]. Elevated temperatures assist in improving extraction processes by increasing the solubility of solutes and increasing diffusion coefficients [
33]. It has been reported that the application of water as an extraction solvent is enhanced by the significant alterations in its physical–chemical properties, particularly in its dielectric constant (
ε), when subjected to elevated temperatures and pressures [
34]. This is attributed to the fact that the dielectric constant serves as an indicator of the polarity of the solvent and plays a pivotal role in defining the interactions between solutes and solvents. In the case of water, raising the temperature under moderate pressure can lead to a substantial reduction in this constant [
35].
2.4. Multiple Factor Analysis (MFA) and Multivariate Correlation Analysis (MCA)
Multiple Factor Analysis (MFA) is a technique that extends Principal Components Analysis to data sets with multiple variables measured on the same items. It allows the comparison of the views of different participants by transforming the variables into orthogonal factors. These factors reveal the similarities and differences among the items based on the participants ratings. We performed MFA to examine the relationships among the measured variables.
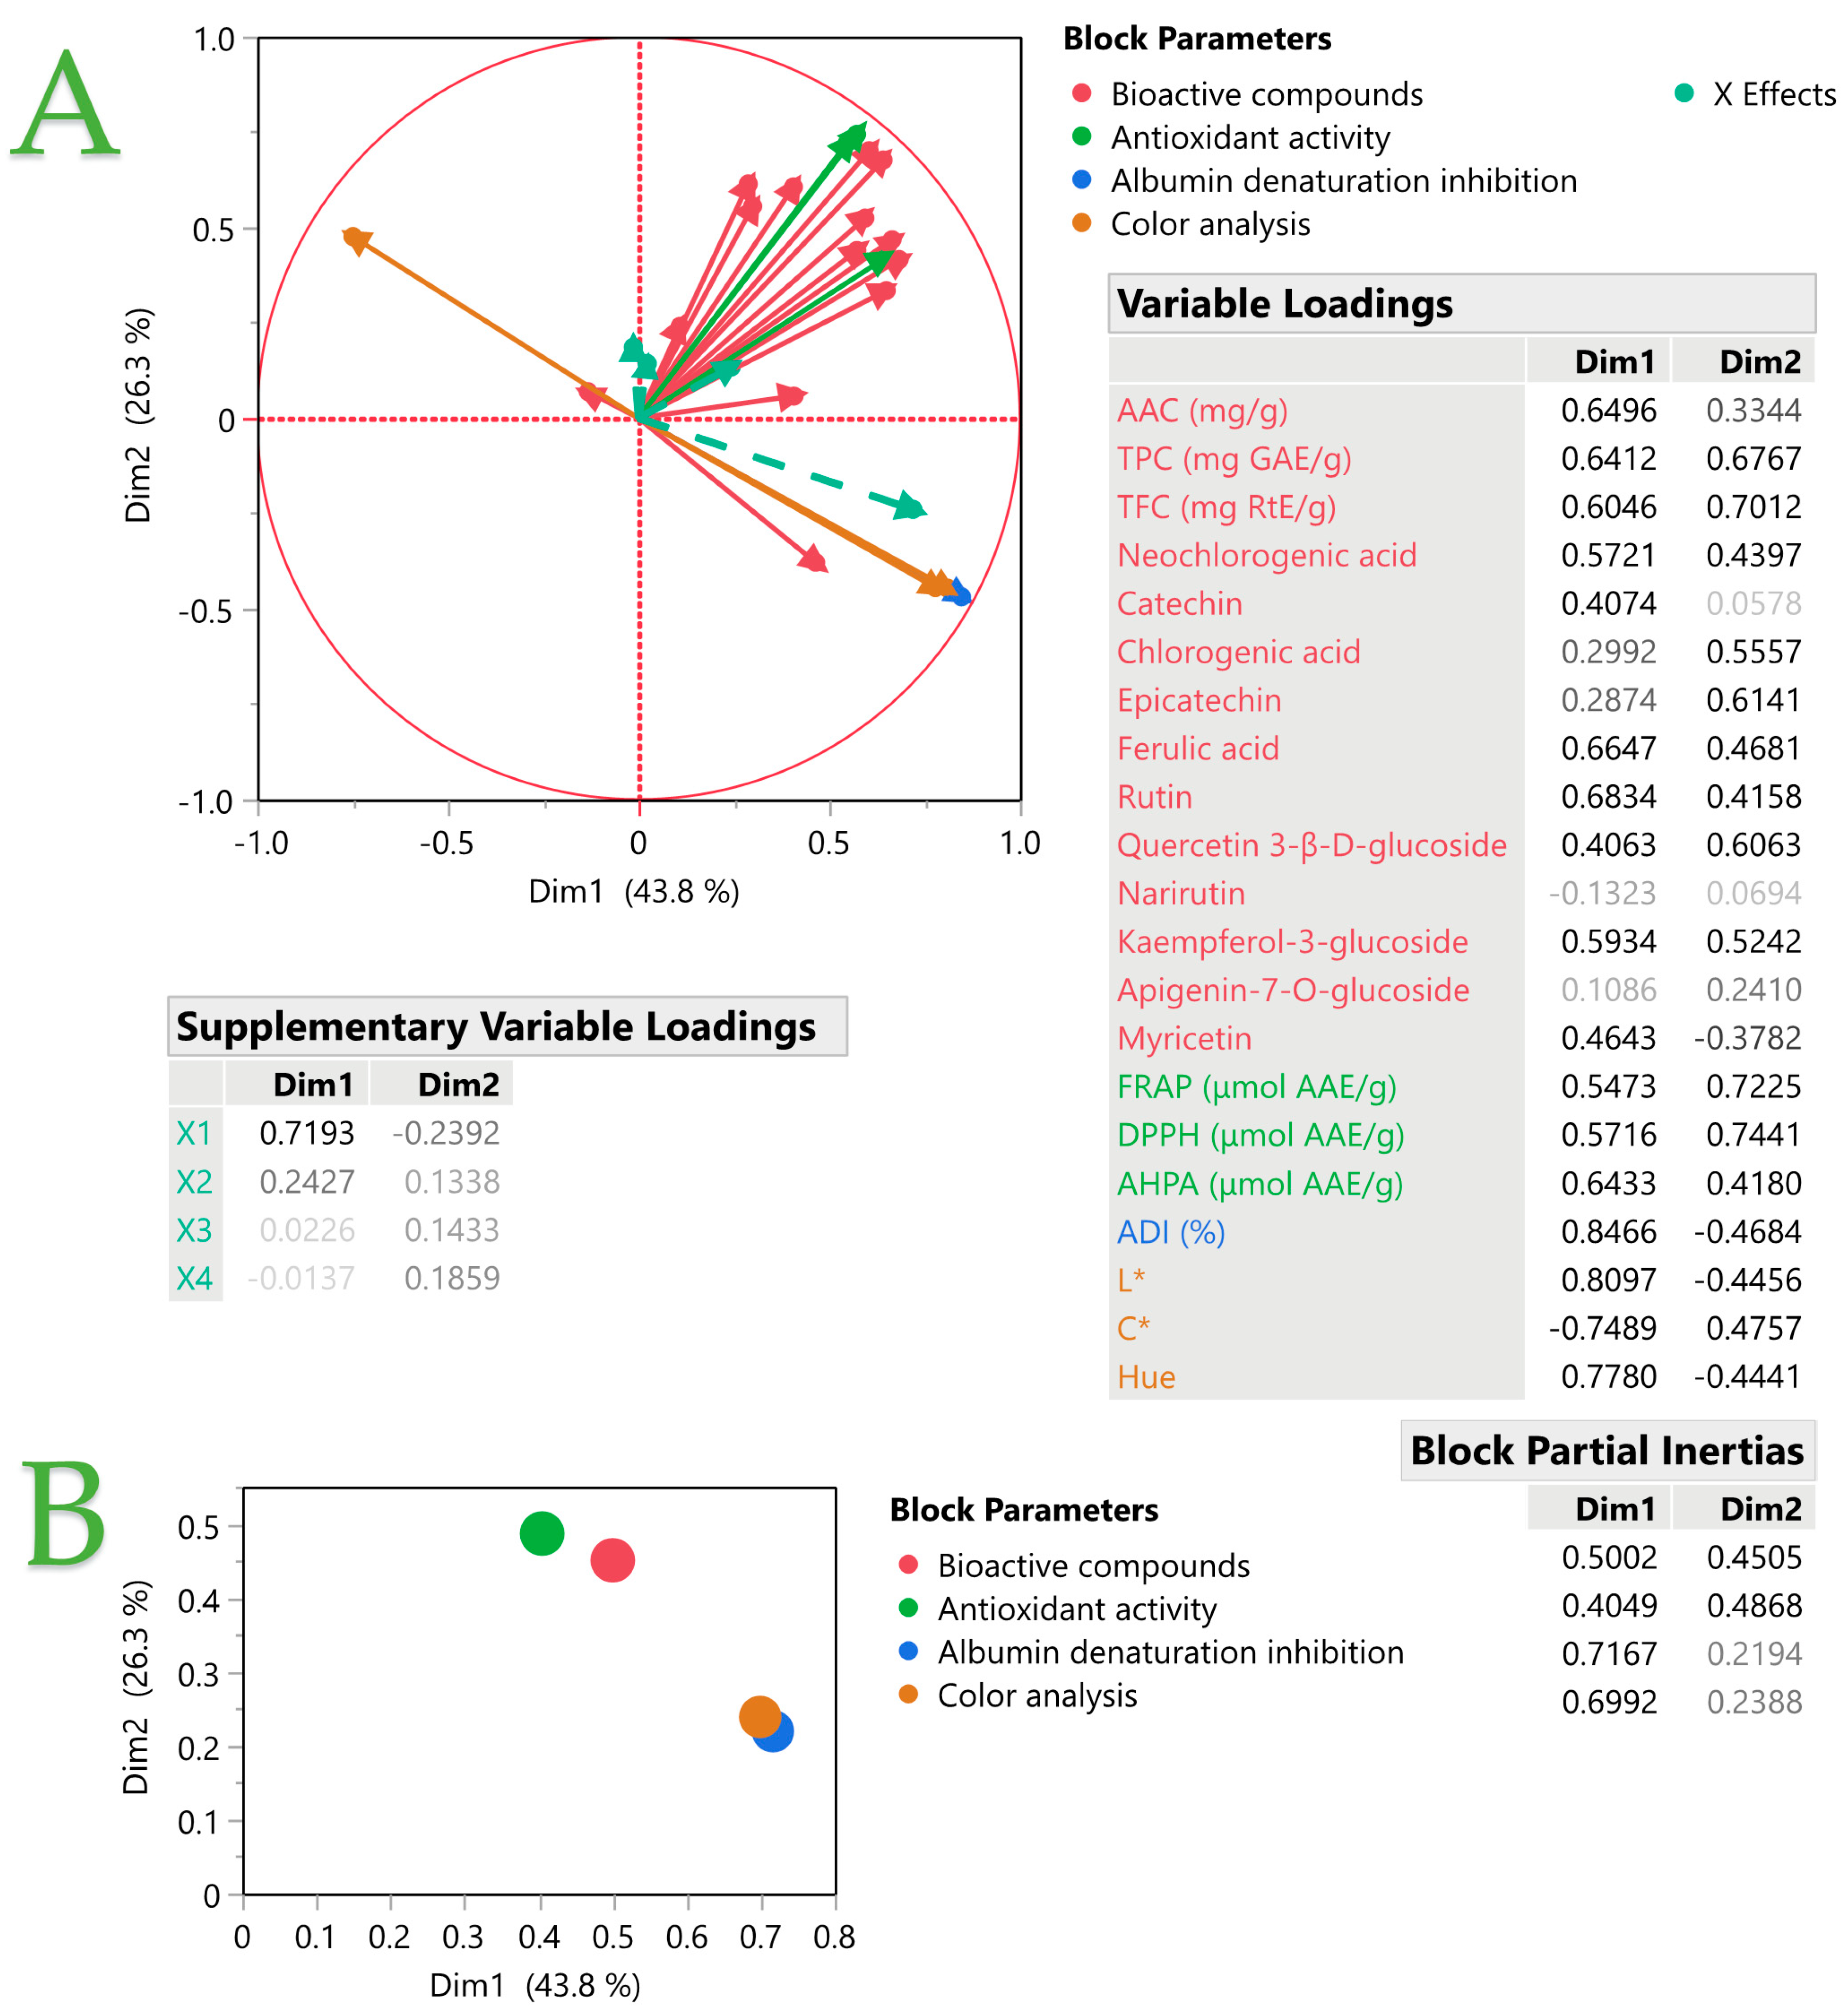
Figure 3 shows the results of the MFA.
Figure 3A shows the factor scores of each measurement variable on the first two dimensions, which explain 43.8% and 26.3% of the total variance, respectively. The plot also includes examined variables (
X1–
X4), which are marked according to their levels. The plot reveals blocks of items that are similar (or familiar) to each other based on their proximity in the factor space.
Figure 3B Plot (B) shows the block partial inertia, which measures the contribution of each set of variables to each dimension. It is calculated by multiplying the block partial inertia by the eigenvalue and dividing by 100. This helps to assess how much each block contributes to the overall structure of the data. The inset tables provide the variable loadings, which indicate the correlations between the variables and the components. The colors in both plots represent the block parameters of the variables, which reflect their relative importance in each set of variables.
Bioactive compounds play a crucial role in our health, and some of them exhibit anti-inflammatory properties. Phenolic acids, such as neochlorogenic acid and chlorogenic acid, have been reported to exhibit strong medicinal activities, including antioxidant, anti-inflammatory, antifungal, and antibacterial properties, among others [
2]. Catechins, which are typically found in tea leaves, belong to the flavonoid family and exhibit potent antioxidant properties and notable physiological activity [
36]. They are also recognized for their significant anti-inflammatory, antioxidant, and chemopreventive properties [
37]. Myricetin is also classified as a flavonol, which is a type of flavonoid [
2]. Myricetin is currently recognized for its various biological properties, including antioxidant [
37] and anti-inflammatory [
37] activity. Another compound with promising bioactive effects is quercetin and its derivatives, which are naturally occurring flavonols [
2]. Quercetins have been reported to possess antioxidant and anti-inflammatory activity [
2]. All these compounds are present in MO leaf extracts emerging via PLE, as already presented in
Table 3.
Considering
Figure 3 and the MFA, it is noticed that when the liquid-to-solid ratio increases, which means the amount of solid MO used during extraction is reduced, this leads to an increase in the ADI. Hence, it could mean that the high solid amount in the extraction leads to high solid dispersion into the solution, which leads to higher stability of the solid phase, thus proving to exhibit pre-inflammatory activity [
38]. On the other hand, when the solid amount is decreased, the intensity of the extract color also decreases. The MO extracts through PLE exhibit considerable albumin denaturation inhibition, and this could be attributed to the presence of flavonoids [
39], and, more specifically, myricetin and catechin in the extracts. Another study by Shervington et al. [
40] indicated that the high anti-inflammatory activity in MO leaves was due to its flavonoids, and the main flavonoids they determined were myricetin and quercetin, along with kaempferol. Moreover, the antioxidant activity of the extract displays a positive correlation with all the bioactive compounds found in it. These observations are further reinforced by the multivariate correlation analysis (MCA) analysis in
Figure 4. In
Figure S12, a multivariate color map of the
p-values of measured variables is illustrated, where the pink color denotes the statistically significant differences (
p < 0.05) of the variables. As can be seen, TPC, TFC, FRAP, and DPPH are all positively correlated with each other, while they all correlate negatively with coordinate
C*. This leads to the conclusion that when the color of the extracts was intense, the measured TCP, TFC, FRAP, and DPPH values were low. It is also noteworthy that the presence of myricetin, AAC, and AHPA negatively correlates with coordinate
C* in color determination. Enhancing this observation, coordinate
C* also correlates negatively with neochlorogenic acid, which is proven to be the main compound in MO extracts determined via HPLC-DAD.
2.5. Partial Least Squares (PLS) Analysis
To determine the significance of the extraction parameters (
X1,
X2,
X3, and
X4), a PLS model was applied. The utilization of the PLS model to generate a correlation loading plot, as illustrated in
Figure 5, visually represents the influence of extraction conditions on MO leaves. When the projection factor is greater than 0.8, it denotes a more significant contribution from the specified variable. In this case, it can be concluded that the optimal liquid-to-solid ratio (
X1) is the highest one, namely 70, in all cases, while the optimal pressure value (
X2) is 1700 psi, the temperature (
X3) that leads to the maximum yield is 150 °C, and the optimal duration of the extraction (
X4) is 15 min.
The experimental results and the PLS model predictions are in excellent agreement, as evidenced by the high correlation coefficient of 0.9985 and the high determination coefficient (R
2) of 0.997. A
p-value of <0.0001 indicates that the deviations between the observed and predicted values are not significant.
Table 4 displays the predicted values of PLS together with the corresponding experimental values for TPC, TFC, and antioxidant assays, employing the optimal conditions.
Table 5 summarizes the values of several individual antioxidant compounds and the color properties of the extract under optimal extraction conditions.
The optimal TPC was measured to be 24.28 mg GAE/g dw, which is in strong agreement with the PLS model value. Rodríguez-Pérez et al. [
17] also reported a TPC of 24.3 mg GAE/g dry leaf on MO maceration extracts, while the TPC obtained by ultrasound-assisted extraction was ~26% lower. Naeem et al. [
41] determined 12.28–13.65 mg GAE/g dw on MO leaves through solvent extraction, almost ~78% lower than the yield given via PLE. Pollini et al. [
42] employed ultrasound-assisted extraction on MO leaves, and the TPC they measured was also ~82% lower than in our case. Nobossé et al. [
43] also determined 21.6 mg GAE/g dw in 60-day leaf aqueous extracts through stirring, thus enhancing the notion that PLE is an effective process to extract polyphenols from MO leaves. The TFC was determined at 17.20 mg RtE/g dw, which is close to the PLS model, too. The FRAP value of the optimal extract was 122.97 μmol AAE/g dw, once again close to the PLS model. Karageorgou et al. [
44] also reported a similar FRAP value of 131.67 μmol AAE/g dw of MO leaf extract. Karthivashan et al. [
45] reported a value that was ~17% lower than ours. The DPPH value was measured at 127.21 μmol AAE/g dw, which is also not far from the predicted PLS value. The AHPA was determined to be 230.14 μmol AAE/g dw, which was also close to the predicted one.
Sreelatha and Padma [
16] reported a similar AAC value of 5.81 and 6.60 mg/g dw on MO tender and mature leaves, respectively. The color intensity in the optimal extract was weak, as the highest ratio was applied. Therefore, the extract exhibits high albumin denaturation inhibition, confirming the statistical models applied and discussed above. The most abundant polyphenol determined in the optimal extract was neochlorogenic acid, with a quantity of 5.59 mg/g dw, followed by kaempferol-3-glucoside and myricetin, at 3.32 and 2.27 mg/g dw, respectively. Sibhat et al. [
46] determined less than 2 mg/g of both neochlorogenic acid and kaempferol-3-glucoside in
Moringa stenopetala leaves.


 ,
, 


