Article

Studies on the Thermal Decomposition Course of Nitrogen-Rich Heterocyclic Esters as Potential Drug Candidates and Evaluation of Their Thermal Stability and Properties

by
Marta Worzakowska
1,
Krzysztof Sztanke
2 and
Małgorzata Sztanke
3,*
1
Department of Polymer Chemistry, Institute of Chemical Sciences, Faculty of Chemistry, Maria Curie-Sklodowska University in Lublin, 33 Gliniana Street, 20-614 Lublin, Poland
2
Laboratory of Bioorganic Compounds Synthesis and Analysis, Medical University of Lublin, 4A Chodźki Street, 20-093 Lublin, Poland
3
Department of Medical Chemistry, Medical University of Lublin, 4A Chodźki Street, 20-093 Lublin, Poland
*
Author to whom correspondence should be addressed.
Int. J. Mol. Sci. 2024, 25(9), 4768; https://doi.org/10.3390/ijms25094768
Submission received: 14 March 2024 / Revised: 22 April 2024 / Accepted: 25 April 2024 / Published: 27 April 2024
(This article belongs to the Special Issue Techniques and Strategies in Drug Design and Discovery, 2nd Edition)

Abstract

:
Drug candidates must undergo thermal evaluation as early as possible in the preclinical phase of drug development because undesirable changes in their structure and physicochemical properties may result in decreased pharmacological activity or enhanced toxicity. Hence, the detailed evaluation of nitrogen-rich heterocyclic esters as potential drug candidates, i.e., imidazolidinoannelated triazinylformic acid ethyl esters 13 (where R1 = 4–CH3 or 4–OCH3 or 4–Cl, and R2 = –COOC2H5) and imidazolidinoannelated triazinylacetic acid methyl esters 46 (where R1 = 4–CH3 or 4–OCH3 or 4–Cl, and R2 = –CH2COOCH3)—in terms of their melting points, melting enthalpy values, thermal stabilities, pyrolysis, and oxidative decomposition course—has been carried out, using the simultaneous thermal analysis methods (TG/DTG/DSC) coupled with spectroscopic techniques (FTIR and QMS). It was found that the melting process (documented as one sharp peak related to the solid–liquid phase transition) of the investigated esters proceeded without their thermal decomposition. It was confirmed that the melting points of the tested compounds increased in relation to R1 and R2 as follows: 2 (R1 = 4–OCH3; R2 = –COOC2H5) < 6 (R1 = 4–Cl; R2 = –CH2COOCH3) < 5 (R1 = 4–OCH3; R2 = –CH2COOCH3) < 3 (R1 = 4–Cl; R2 = –COOC2H5) < 1 (R1 = 4–CH3; R2 = –COOC2H5) < 4 (R1 = 4–CH3; R2 = –CH2COOCH3). All polynitrogenated heterocyclic esters proved to be thermally stable up to 250 °C in inert and oxidising conditions, although 13 were characterised by higher thermal stability compared to 46. The results confirmed that both the pyrolysis and the oxidative decomposition of heterocyclic ethyl formates/methyl acetates with para-substitutions at the phenyl moiety proceed according to the radical mechanism. In inert conditions, the pyrolysis process of the studied molecules occurred with the homolytic breaking of the C–C, C–N, and C–O bonds. This led to the emission of alcohol (ethanol in the case of 13 or methanol in the case of 46), NH3, HCN, HNCO, aldehydes, CO2, CH4, HCl, aromatics, and H2O. In turn, in the presence of air, cleavage of the C–C, C–N, and C–O bonds connected with some oxidation and combustion processes took place. This led to the emission of the corresponding alcohol depending on the analysed class of heterocyclic esters, NH3, HCN, HNCO, aldehydes, N2, NO/NO2, CO, CO2, HCl, aromatics, and H2O. Additionally, after some biological tests, it was proven that all nitrogen-rich heterocyclic esters—as potential drug candidates—are safe for erythrocytes, and some of them are able to protect red blood cells from oxidative stress-induced damage.

1. Introduction

Imidazolidinoannelated triazinylformic acid ethyl esters (13) and imidazolidinoannelated triazinylacetic acid methyl esters (46) (Figure 1) belong to two important classes of molecules with the prospective antitumour or antinociceptive field of relevance, respectively, whose structures in solution and solid state have been established [1,2,3,4,5,6]. They were designed as functionalised isosteric isomers of azacytosine. Having the amino nitrogen locked up in an imidazolidine ring, these innovative small molecules may be of biochemical interest as they are suspected to be resistant to enzymatic deamination, unlike short-acting cytosine- or azacytosine-based drugs (such as cytarabine, gemcitabine, or azacytidine, respectively), which are susceptible to inactivation by cytidine deaminase [7,8,9]. Therefore, their development may contribute to the discovery of more effective and metabolically stable azaisocytosine-based drugs for anticancer chemotherapy. To enter the individual tumour cells or the central nervous system, their structures had to be hydrophobic enough to cross the biological membranes, including the blood–brain barrier. In this case, the presence of a certain number of non-polar moieties and a temporarily masked polar group were required. The possibility of using two types of nitrogen-rich heterocyclic esters (13 and 46) as potential future drugs has previously been extensively studied [1,2,3,4,5,6]. It was found that these two types of compounds reveal a low toxicity in vitro and in vivo [1,2,3,5]. Among heterocyclic ethyl formates, the structure 2—bearing a para-methoxy-substituted phenyl moiety—has been disclosed as the most promising anticancer agent candidate. In the 5-bromo-2′-deoxyuridine-based assay assessing DNA synthesis and cell proliferation, this compound was low in toxicity for normal HSF (human skin fibroblast) cells, evoked an antiproliferative effect in human breast carcinoma (T47D) and cervical carcinoma (HeLa) cells higher than that of a clinically used anticancer drug pemetrexed, and was also potent at inhibiting the growth of both thalidomide-resistant and thalidomide-susceptible human multiple myeloma cells (MM1R and MM1S, respectively). The flow cytometric analysis showed that the mode of its anticancer action was connected with the cell cycle arrest (at the S and G2/M phases) in human cervical (HeLa), ovarian (TOV112D—human ovarian primary malignant adenocarcinoma cells) and breast (T47D) tumour cells. Moreover, by observing the stained cells under a confocal microscope, it was confirmed that the death of cervical carcinoma cells induced by this compound is necrosis-dependent [3]. In addition, the molecule 2 was used to design a non-selective adenosine A2A receptor antagonist, which was then patented as a drug [10]. The first analytical method for the quantitative determination of the potential drug candidate 2 in human serum samples was recently developed as well [6]. Among heterocyclic methyl acetates, the structure 4—containing a para-methyl-substituted phenyl moiety—proved to be the most promising analgesic agent candidate. This small molecule with relatively low toxicity in mice showed significant in vivo antinociceptive activity after intraperitoneally induced hyperalgesia [5]. Reliable QSAR models and the statistically significant correlations between lipophilicity indices and pharmacokinetic descriptors—which have been developed in our previous chromatographic studies—predict that both groups of heterocyclic esters (13 and 46) have good bioavailability and high permeability through biological barriers, including cell membranes [4,5]. Because of favourable biopharmaceutical properties, they may be promising anticancer agent candidates or potential analgesics deserving further research.
On the other hand, a number of molecules having the protected acid function as an ester are prodrugs used to increase permeability through biological membranes and consequently bioavailability. The following are only a few examples of ester prodrugs used in medicine: oseltamivir (the ethyl ester prodrug of an antiviral oseltamivir acid), tenofovir disoproxil fumarate (a prodrug of tenofovir with antiviral activity), pivampicillin, talampicillin, bacampicillin (prodrugs being acyloxymethyl esters of an antibiotic ampicillin), sultamicillin (a hybrid ester prodrug of an ampicillin—aminopenicillin and sulbactam—a β-lactamase inhibitor), candoxatril (the indanyl ester prodrug of a protease inhibitor candoxatrilate) or enalapril (the ethyl ester prodrug of an antihypertensive agent enalaprilate). These more lipophilic molecules, due to the attachment of less polar ester moiety, easily cross cell membranes and are finally activated via hydrolysis in the blood by esterases, releasing the parent drugs with free acid function [11,12,13].
Thermal analysis methods, such as differential scanning calorimetry (DSC) and thermogravimetry/differential thermogravimetry (TG/DTG), are helpful in the design and development of potential drugs. They allow for the testing of a whole range of biomolecules, both organic and inorganic. The DSC method is commonly used to study the stability of molecules, the course of melting, denaturation, gelling, evaporation, crystallisation, polymorphic transformations, and heat of transformation. The TG/DTG technique primarily enables the investigation of the behaviour of compounds during heating, the identification of degradation products, as well as the understanding the thermal decomposition mechanism [14].
The literature survey revealed a limited number of studies on the thermal behaviour of 1,2,4-triazine derivatives containing the ester functionality. Thermal stability and volatile decomposition products emitted during the pyrolysis of methyl (3,4-disubstituted-5-oxo-4,5-dihydro-1,2,4-triazin-6(1H)ylidene)acetates were disclosed [15]. High thermal stability has been demonstrated for the designed ethyl 7-chloro- or 7-methyl-1-(4-nitrophenyl)-1,4-dihydrobenzo[e][1,2,4]triazine-3-carboxylates [16]. Thermal characterisation and mesomorphic behaviour of a hybrid 1,2,4-triazine molecule containing an azomethine bridge, which was obtained by condensing 1,2,4-triazine-3-amine with 4-(3-cholesteryloxycarbonyl)benzaldehyde, was reported [17]. However, there is still a research gap in these studies as the mechanism of thermal degradation and detailed thermal properties of nitrogen-rich heterocyclic esters with the para-R1-substitution at the phenyl moiety and the ethoxycarbonyl or methoxycarbonylmethylene moiety at R2 (13 and 46, respectively) (Figure 1) are unknown. Therefore, the detailed thermal characterisation of these potential drug candidates is needed in the preclinical phase of drug development. To establish the appropriate conditions during storage, processing, and thermal utilisation, it is necessary to know about their thermal behaviour.
The purpose of the present paper is to evaluate, for the first time, both classes of heterocyclic esters (i.e., imidazolidinoannelated triazinylformates (13) and imidazolidinoannelated triazinylacetates (46)) in terms of their thermal stability, melting points and enthalpy values, and their eventual polymorphic transformations. The subsequent aim is to determine their thermal decomposition course during pyrolysis carried out under inert and oxidative conditions on the basis of the identified volatile degradants. Understanding the thermal decomposition profiles of the investigated compounds will be of high practical utility when establishing the appropriate storage, processing, and utilisation conditions. For the current comparative thermal studies, we have chosen derivatives from both classes of nitrogen-rich heterocyclic esters (i.e., ethyl formates 13 and methyl acetates 46) that have the same para-substitution at the phenyl moiety denoted as R1 and diverse functional moieties marked as R2 (Figure 1). In our studies, we have applied the simultaneous TG/DTG/DSC coupled with spectroscopic methods (i.e., FTIR and QMS), because these reliable techniques are preferred in the thermal analyses of medicines and therapeutic agent candidates in the preclinical phase of drug development. They enable the determination of thermal stability, heat of fusion, the identification of volatile degradation products, as well as checking the purity (including a content of water and solvents used in the crystallisation process) and possible solid–solid transitions [14,15,18,19,20,21,22,23]. This entire research is aimed at understanding the beneficial thermal properties of these compounds, which may increase their usefulness as potential candidates for pharmaceutical applications.

2. Results and Discussion

2.1. The Melting Points and the Melting Enthalpies Evaluated by the DSC

Figure 2 shows the DSC curves for the tested compounds collected in an inert atmosphere. The values of melting points (Tonset and Tmelt) and the melting enthalpies (ΔH) determined in helium and air atmospheres are presented in Table 1.
The solid–liquid phase transition of each tested nitrogen-rich heterocyclic ester is visible as one sharp endothermic peak (Figure 2), confirming that each analysed molecule has been synthesised as a pure compound. This is as expected since high purity of the investigated compounds has previously been confirmed based on spectral, HPLC, and electrochemical results [1,2,4,5,6]. The obtained results indicate that the studied esters have the melting point above 170 °C in both atmospheres, and they do not decompose because no mass loss is observed during their melting. In addition, the melting point values for the investigated compounds do not depend on the type of experimental atmosphere and are similar in inert and oxidising conditions. In the case of ethyl formates 13 with the para-R1-substitution at the phenyl moiety, the highest melting point is observed for compound 1 containing –CH3. This molecule begins to melt at a temperature of 212–213 °C, with the maximum melting temperature at 215 °C. In turn, compound 2 containing –OCH3 has the lowest onset and maximum melting point (170–171 °C and 172–173 °C, respectively). Summing up, the onset and maximum melting points for ethyl formates 13 depend on R1 and increase in the following order: 2 (R1 = –OCH3) < 3 (R1 = –Cl) < 1 (R1 = –CH3). However, the DSC results show that for methyl acetates 46 with the para-R1-substitution at the phenyl ring, the melting points depend on the molecular mass. As the molar mass increases, a decrease in the melting point is observed. Among these heterocyclic esters, compound 4 containing –CH3 shows the highest melting point (Tmelt 217–221 °C). However, compound 6 with –Cl is characterised by the lowest melting point (Tmelt 182–185 °C). To sum up, the onset and maximum melting points for methyl acetates 46 depend on R1 and increase in the following order: 6 (R1 = –Cl) < 5 (R1 = –OCH3) < 4 (R1 = –CH3). As it is well visible, all the para-R1-substituted esters have slightly lower values of melting enthalpies (ΔH) in an inert atmosphere compared to ΔH values in an oxidative atmosphere. The difference in ΔH values between furnace atmospheres is from 8.3 J/g to 11.5 J/g. In addition, in both atmospheres, the highest ΔH value among ethyl formates 13 is observed for compound 2 containing –OCH3. A similar situation is in the case of methyl acetates 46, among which compound 5 containing –OCH3 has the highest ΔH value, Table 1. While comparing both series of esters (13 with 46), it turns out that ethyl formates 13 show slightly higher ΔH values (the difference is from 8.4 J/g to 11.5 J/g). This means that slightly more energy must be supplied in the form of heat to melt 1 g of a substance [24].
Furthermore, the analysed heterocyclic esters 16 did not undergo any polymorphic transformations when screened for polymorphic behaviour at a low heating rate. This is their advantage because it is known that such crystalline compounds should be characterised by higher stability than amorphous pharmaceutical substances that are prone to polymorphic transformations [23]. The most likely reason for this is that during the recrystallisation process from organic solvents, they were able to crystallise into the most thermodynamically stable solid phase. The beneficial thermal behaviour of the investigated compounds makes them suitable for future pharmaceutical applications. Screening for polymorphism is very important, and therefore should be performed in the preclinical phase of drug development. It is known that polymorphs may differ in their physicochemical properties (i.e., melting point, solubility, and dissolution rate) which in turn may affect their pharmacological activity, pharmacodynamics, and stability. To design an appropriate and acceptable solid form of an active pharmaceutical substance, it is necessary to perform polymorphism screening in accordance with FDA recommendations [25,26]. Therefore, in the case of our nitrogen-rich heterocyclic esters 16 with prospective medical utility, this study was carried out in the early phase of drug development.

2.2. The TG/DTG Analyses (Inert Conditions)

Figure 3 presents the TG/DTG curves of the tested nitrogen-rich heterocyclic esters for their analyses made in an inert atmosphere. Additionally, the results obtained from TG/DTG analyses are placed in Table 2. These data confirm that the para-substituted compounds studied are characterised by high thermal stability. Their decomposition in an inert atmosphere starts above 270 °C in the case of ethyl formates 13, and above 250 °C in the case of methyl acetates 46. This clearly shows that compounds 13 are characterised by approximately 13–23 °C higher thermal stability as compared to molecules 46.
If one looks at the course of the TG/DTG curves, one can see that the thermal decomposition of the tested para-R1-substituted heterocyclic esters 16 occurs in two basic stages. The first decomposition stage between T5% and 540 °C is clearly visible. This stage is composed of at least two/three thermal steps for ethyl formates 13. However, for methyl acetates 46, at least three/four thermal steps can be highlighted. This course of the TG/DTG curves indicates that the major bond breaking reactions occur one after another and/or at the same time in this temperature range. Thus, it means that the bonds contained in the structure of para-R1-substituted derivatives of the ester molecules are characterised by similar or slightly different thermal decomposition energy.
The first decomposition step between T5% and 334 °C with Tmax1 at 298–301 °C and with the comparable mass loss (Δm1) in the range of 36.9–40.0% for compounds 13 is observed. This temperature range and the comparable values of mass loss for para-R1-substituted ethyl formates 13 mainly indicate the breaking of one type of the bonds present in their structure. Above the temperature of 334 °C, the pyrolysis of subsequent bonds in the structure of tested compounds begins. This pyrolysis step is visible on the TG/DTG curves as another poorly resolved DTG signal with lower intensity compared to the previous one. This step spreads from 334 °C to 514 °C with Tmax1a and the mass loss (Δm1a) in the range of 31.8–37.1%. Finally, heating the compounds 13 above 514 °C results in the appearance of the second decomposition stage, with Tmax2 at 715–733 °C and with the mass loss (Δm2) from 24.2% to 31.3%. These compounds decompose completely when heated to 900 °C.
However, the decomposition course of methyl acetates 46 is characterised by a very poor separation of individual steps in the first pyrolysis stage. This indicates very small differences in the energy of thermal decomposition of the individual bonds in their structure. Despite this, weakly marked maxima can be distinguished on the DTG curves, as shown in Table 2. This decomposition stage spreads from T5% to 560 °C with the mass loss (Δm1 + Δm1a) in the range of 63.1–68.4%. Heating the compounds 46 above 560 °C does not result in the occurrence of the second DTG peak, and only a slight slow mass loss up to 900 °C is observed. The mass loss in the second decomposition stage is from 4.0% to 9.3%. These heterocyclic esters do not decompose completely when heated to 900 °C. The residual mass is comparable for particular compounds and is from 25.3% to 27.6%. This confirms the formation of derivatives with higher molecular masses during their pyrolysis. Such derivatives require higher temperatures to evaporate or decompose.
Comparing the results from TG/DTG analyses obtained for ethyl formates 13 and methyl acetates 46, it is concluded that the decomposition of these two groups of molecules, despite their similar structure, may occur in a slightly different way, particularly after heating them to a temperature above 560 °C.

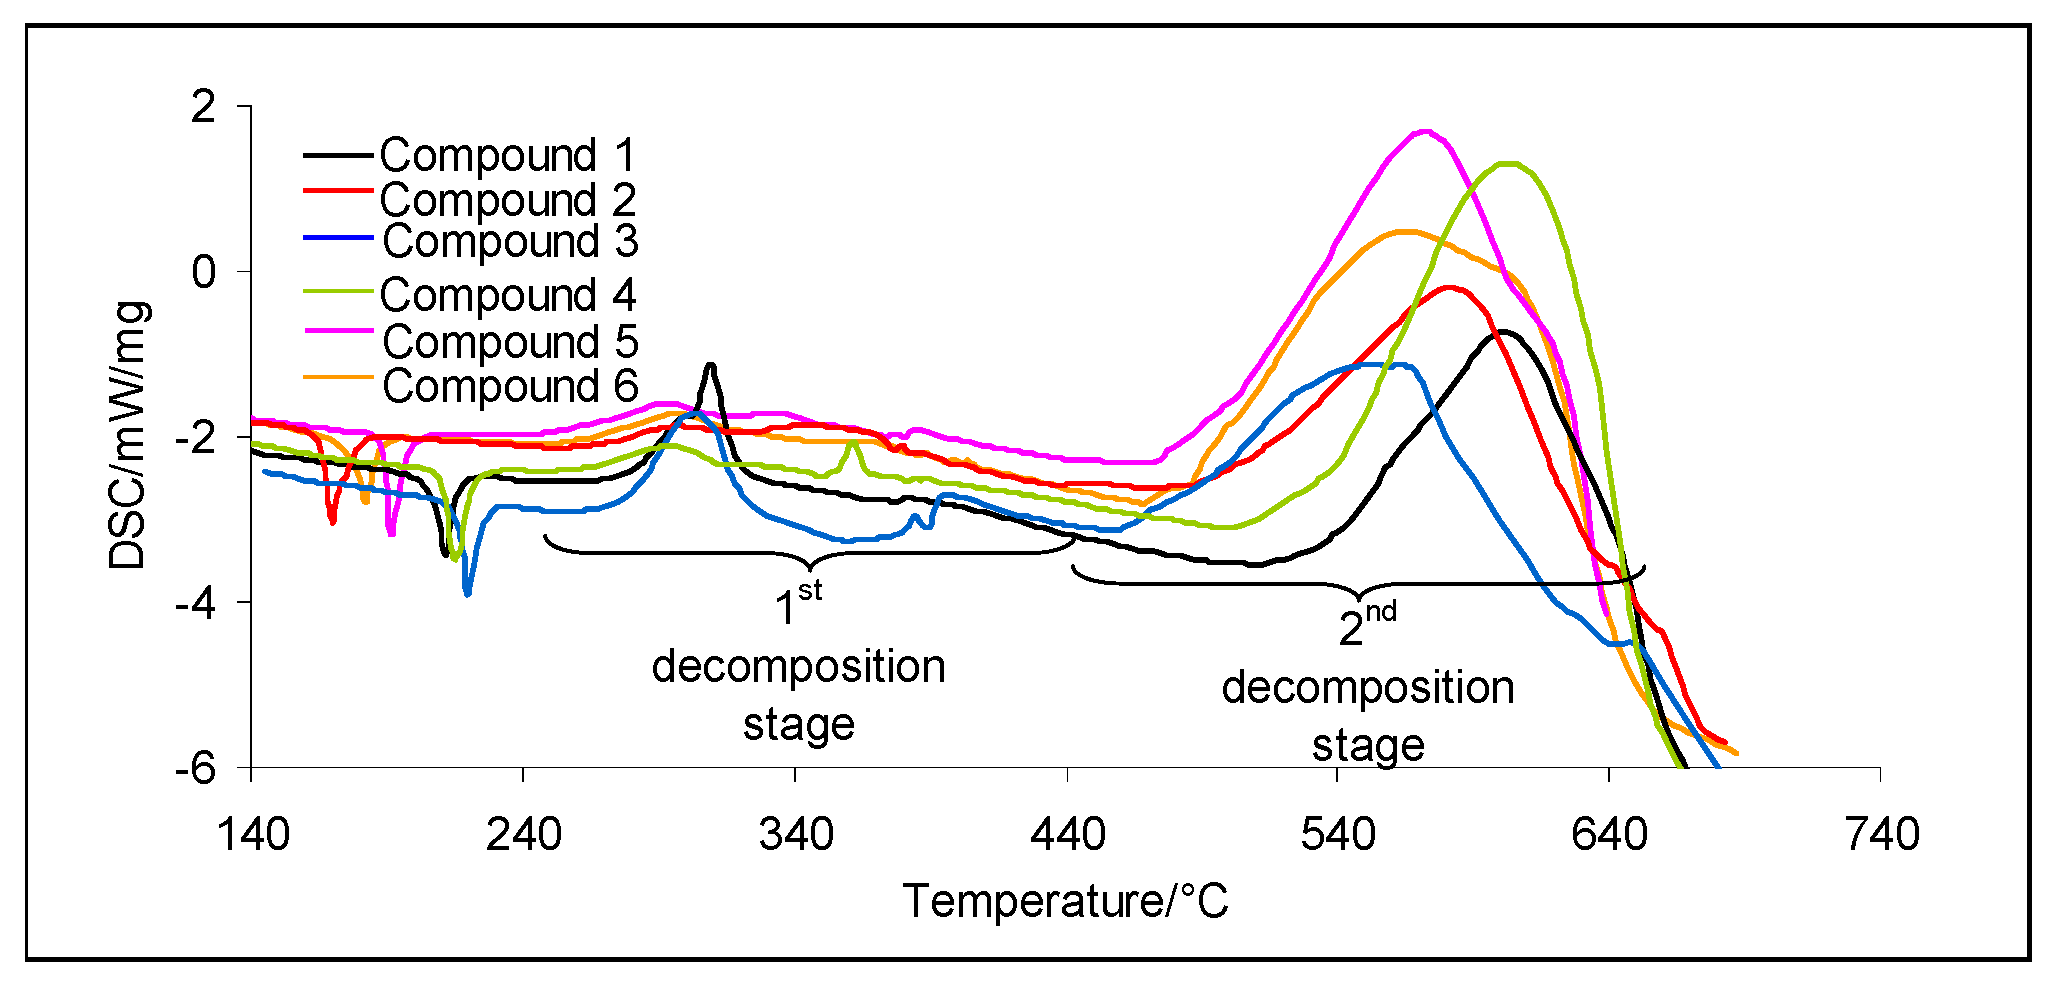
2.3. The Decomposition Course of the Tested Compounds in Inert Conditions

Figure 4 presents the gaseous FTIR spectra collected at the maximum characteristic temperatures obtained as a result of the heating of the tested para-substituted at the phenyl moiety ethyl formates 13 or methyl acetates 46. According to the results obtained from the FTIR analysis, it can be concluded that the first decomposition step (Tmax1) is mainly related to the emission of alcohol, i.e., ethanol for ethyl formates 13 or methanol for methyl acetates 46. This means that this stage is related to the pyrolysis of the ester bonds present in the structure of the tested compounds. Thus, it confirms that the ester bonds are characterised by the lowest energy of thermal decomposition among all bonds present in the structure of the analysed compounds. The formation of an alcohol molecule is confirmed by the presence of characteristic absorption vibrations for the functional groups present in the structure of heterocycles studied. In the case of ethyl formates 13, the stretching vibrations for the OH (above 3600 cm−1), the stretching vibrations for the C–H (above 2780 cm−1 with the maximum at 2964 cm−1), the deformation vibrations for the C–H (1342–1390 cm−1), and the stretching vibrations for the C–O (1045–1230 cm−1) prove the formation of ethanol [27]. Meanwhile, the stretching vibrations for the OH (above 3600 cm−1), the stretching vibrations for the C–H (2809–2954 cm−1), the deformation vibrations for the C–H (1330–1345 cm−1), and the stretching vibrations for the C–O (998–1054 cm−1) indicate the emission of methanol [28] as a result of decomposition process of methyl acetates 46.
Additionally, the QMS results clearly confirm the formation of suitable alcohol as a result of the cleavage of the ester bonds in the structure of the tested compounds, as shown in Figure 5. The m/z ions characteristic of ethanol (compounds 13) and methanol (compounds 46) are well visible from the QMS spectra. The ionization of ethanol leads to the formation of the m/z ions 31 (CH2OH+), 45 (C2H5O+), and 46 (C2H5OH+) [29], as shown in Figure 5, while the appearance of the m/z ions 29 (CHO+), 30 (CH2O+), 31 (CH3O+), and 32 (CH3OH+) confirms the emission of methanol [30] under the heating of compounds 46. The FTIR spectra clearly indicate that alcohol with the appropriate structure is the main decomposition product of the tested compounds at Tmax1. At this temperature, the presence of CO2 as a gaseous decomposition product is also well visible. However, looking at the QMS spectra, it can be seen that in addition to alcohol, other gaseous decomposition products also begin to evolve at Tmax1. This indicates that the absorption bands of alcohol and CO2 cover the absorption bands of other volatiles due to their high intensity. Up to the temperature Tmax1a for compounds 13 and Tmax1′ for compounds 46, the absorption bands for the other gaseous products are clearly visible in the FTIR spectra, i.e., when the emission of alcohol is no longer observed. However, the additional QMS test confirms, which is not visible in the FTIR spectra, that a larger variety of gaseous decomposition products is already emitted from the temperature Tmax1. This indicates that the energies of thermal decomposition of other bonds present in the structure of the tested compounds are not much different from the energy of thermal decomposition of the ester bonds. Together with the emission of alcohol, the formation of NH3, HNCO, HCN, methanal, and ethene with the maximum intensity at Tmax1a for compounds 13 and Tmax1′ for compounds 46 is observed. The formation of NH3 is confirmed by the presence of two absorption bands, one at 931 cm−1 and the other at 966 cm−1, which are characteristic of the deformation vibrations of N–H groups [31,32,33,34] and the attendance of m/z ion 15, due to the creation of NH+ species after the ionisation of NH3, as shown in Figure 4 and Figure 5. As the results indicate, the emission of ammonia is visible up to a temperature of approximately 440 °C. Also at this temperature range, the formation of HCN is confirmed by the absorption band at 713 cm−1 and the m/z ions 26 (CN+) and 27 (HCN+) [35,36]. As it is well seen from the QMS spectra, its emission up to approximately 500 °C is observed. However, the presence of HNCO in the mixture of gaseous products is confirmed by the absorption bands at 2270–2290 cm−1 [37,38,39] and the m/z ions 42 (NCO+) and 43 (HNCO+). Similarly to the emission of HCN, the release of HNCO extends to a temperature of about 500 °C. At this maximum temperature, the creation of some aldehyde compounds by the presence of the absorption bands at 1680 cm−1 and low intensity bands at 1720–1771 cm−1 responsible for the stretching vibrations for the C=O is suspected. The absorption bands at 1720–1771 cm−1 are characteristic of the C=O stretching vibrations of gaseous methanal. The creation of this gas is also confirmed based on presence of the m/z ion 30 in the QMS spectra. In addition to the emission of this aldehyde, the formation of other aldehyde-type compounds, which are formed as a result of radical reactions between different decomposition fragments is also observed (the absorption band at 1680 cm−1). Moreover, in the case of compounds containing –Cl at the phenyl moiety (compounds 3 and 6), the formation of HCl is clearly seen from the gaseous FTIR spectra. Its emission by the presence of the absorption bands in the range of 2100–3100 cm−1 as characteristic “noises” is confirmed [40,41]. The emission of HCl for compounds 3 and 6 spreads from 400 °C to 550 °C with the maximum intensity at 480 °C.
In addition, the creation of CH4 (the band of a low intensity at 3014 cm−1) [41,42] for compounds 46 with the –CH2COOCH3 formation as R2 (46), between the temperatures Tmax1′ and Tmax1a is observed. The emission of methane is caused by a partial cleavage of the bonds in R2, resulting in the emission of this gaseous decomposition product, as marked in Scheme 1.
The beginning of the emission of aromatic compounds from Tmax1a for ethyl formates 13 and Tmax1′ for methyl acetates 46 is well seen from the gaseous FTIR spectra, shown in Figure 4. Their emission is confirmed by the appearance of the stretching vibrations of the CAr-H at 3050–3079 cm−1, the stretching vibrations of the CAr=CAr at 1510–1580 cm−1, and the out-of-plane deformation vibrations of the CAr-H at 780–867 cm−1 [43,44,45]. The emission of aromatic fragments is visible to temperatures of 500–540 °C for all the tested compounds. However, in the gaseous FTIR spectra for compounds 13, at temperatures above 500–540 °C, the signals coming for aromatic compounds are still visible, but they are not visible in the QMS spectra. This is caused by the emission of aromatic compounds with higher molecular masses (the formation of biphenyl compounds) which, due to their molar masses, are not detected by the QMS analyser. As it is confirmed based on the performed FTIR and QMS analyses, in Figure 4 and Figure 5, the main decomposition aromatic product for the tested molecules 1 and 4, containing at the phenyl moiety –CH3, is toluene. The presence of the characteristic absorption bands at 3043–3074 cm−1, 2882–2935 cm−1, 1506–1607 cm−1, 694–728 cm−1, and the m/z ions 91 (C7H7+) and 92 (C7H8+) indicates the formation of this aromatic compound [46]. However, anisole is the main decomposition aromatic product in the case of compounds 2 and 5 that have the para –OCH3 group. Its formation by the occurrence of the absorption bands at 3000–3078 cm−1, 1502–1600 cm−1, 1178–1294 cm−1, 690–1048 cm−1, and the m/z ions 108 (C7H8O+) and 78 (C6H6+) is verified [47]. In turn, benzene is the main aromatic decomposition product for compounds 3 and 6 with –Cl as R1. The presence of the absorption bands at 3047–3085 cm−1, 1482–1500 cm−1, 660–1052 cm−1, and the m/z ions 77 (C6H5+) and 78 (C6H6+) that are characteristic of benzene ionisation are clearly visible from the QMS spectra collected for the tested compounds [48]. Heating the tested compounds above 500–540 °C results also in the emission of CO2 (the absorption bands at 669 cm−1 and 2300–2365 cm−1 and m/z 44) and H2O (the absorption bands at the range of 1100–1600 cm−1 and above 3500 cm−1 and m/z 18).
Taking into account the type of volatiles released, a simplified pyrolysis course of the tested compounds is presented in Scheme 1.

2.4. The TG/DTG Analyses (Oxidative Conditions)

Figure 6 shows the TG/DTG curves for the tested para-substituted heterocyclic esters 16 obtained in an oxidising atmosphere. The TG/DTG results are collected in Table 3.
As it is well visible, all the analysed compounds are characterised by high thermal stability in the presence of a synthetic air. This property may be important in the case of their approval as pharmaceuticals. Because they are stable at temperatures much higher than ambient temperature, their storage within a wide temperature range should not affect their expiration period. Previous studies on the kinetics of thermal decomposition have confirmed that highly thermally stable molecular pharmaceuticals, such as amiodarone hydrochloride or acyclovir, can be stored at temperatures ranging from 25 to 40 °C in air without shortening their shelf life [49,50]. Therefore, the high thermal stability of all nitrogen-rich heterocyclic ester derivatives (16) demonstrated in this study may enhance their utility as potential drug candidates and will be desirable during their processing. Additionally, these molecules may be useful for the design of highly thermally stable potential pharmaceuticals.
The decomposition of compounds with the –COOC2H5 moiety as R2 (13) begins (T5%) at temperatures of 276–280 °C. In turn, the thermal stability of compounds with the –CH2COOCH3 moiety as R2 (46) is above 250 °C. These results on the thermal stability of the tested compounds obtained in oxidative conditions are similar to those received in inert conditions. The difference in thermal stability (T5%) is only 0–4 °C for both atmospheres. This means that the type of experimental atmosphere does not affect the beginning of the decomposition of the tested compounds and thus the value of the initial decomposition energy. Ethyl formates 13 are more thermally stable compared to the methyl acetates 46. This finding is analogous to the results obtained in an atmosphere without the addition of oxygen.
For all the analysed compounds, two clearly marked decomposition stages are seen. The first decomposition stage is composed of at least two or three steps for all the molecules tested. In the case of compounds 13, the first step from T5% to 330 °C with Tmax1 at 297–299 °C and the mass loss (Δm1) in the range of 33.5–38.6% is observed. The second step from 330 °C to 450 °C with Tmax1a and the mass loss (Δm1a) in the range of 29.5–31.9% also appeared. Moreover, the second decomposition stage is spread from 450 °C to 680 °C with Tmax2 at 562–611 °C and the comparable mass loss (Δm2) from 34.2% to 35.3%.
As in an inert experimental atmosphere, the first decomposition stage for compounds 46 is composed of several poorly resolved DTG signals. At this decomposition stage, one can distinguish three relatively clearly visible DTG peaks with the maxima given in Table 3. The mass loss (Δm1) between T5% and the temperature of 400 °C is similar for this class of compounds and is 33.5–38.8%. The mass loss in the second step (Δm1a) visible from 400 °C to 460 °C is from 9.7% to 16.8%. For compounds 46 tested in the synthetic air atmosphere, the second decomposition stage with Tmax2 at 577–609 °C and the mass loss (Δm2) in the range of 46.4–56.8% is clearly visible. All the tested compounds are completely decomposed under oxidising conditions because no residual mass is observed.

2.5. The Decomposition Course of the Tested Compounds in Oxidative Conditions

The gaseous FTIR spectra collected at Tmax1, Tmax1′, Tmax1a, and Tmax2 are presented in Figure 7. Additionally, the QMS spectra for the characteristic m/z ions of the emitted volatiles are placed in Figure 8. The gaseous FTIR spectra confirm that at Tmax1, the suitable alcohol (methanol or ethanol) is emitted. For ethyl formates 13, the formation of ethanol by the appearance of the stretching vibrations for the OH (above 3600 cm−1), the stretching vibrations for the C–H (above 2780 cm−1 with the maximum at 2964 cm−1), the deformation vibrations for the C–H (1342–1390 cm−1), and the stretching vibrations for the C–O (1045–1230 cm−1) is clearly visible [27,28]. However, in the case of methyl acetates 46, the emission of methanol by the presence the stretching vibrations for the C–H (2809–2954 cm−1), the deformation vibrations for the C–H (1330–1345 cm−1), and the stretching vibrations for the C–O (998–1054 cm−1) on the FTIR spectra is confirmed. In addition, the performed QMS analysis showed the presence of m/z ions formed during ionisation of these alcohols, i.e., ethanol (m/z 31, 45, 36) and methanol (m/z 29, 30, 31) [29,30]. This clearly indicates the emission of these alcohols during the oxidative decomposition of the tested compounds at Tmax1. From the FTIR spectra collected at Tmax1, apart from the emission of alcohol with the appropriate structure, no emission of other compounds is observed. This may indicate, as in the case of an inert atmosphere, that the emission of other gases by the absorption signals of alcohol is obscured. The collected QMS spectra prove that the volatile emission at Tmax1 is more diverse. Just like in an inert atmosphere, in this temperature range, HCN (FTIR: the absorption signal at 713 cm−1; m/z: 27 (HCN+) and 26 (CN+)), HNCO (FTIR: peaks at 2270–2290 cm−1, m/z ions: 43 (HNCO+), 42 (NCO+)), NH3 (FTIR: two bands at 931 cm−1 and 966 cm−1; m/z: 15 (NH+)), and some amounts of CO (FTIR: the peaks at 2088–2167 cm−1; m/z: 28 CO+), CO2 (FTIR: the peaks at 2300–2365 cm−1 and 669 cm−1; m/z: 44 CO2+), H2O (FTIR: the signals at 3450–4000 cm−1; m/z: 18 H2O+), 17 (OH+)), and N2 (m/z: 28 (N2+) are also formed [51,52].
Comparing the emission intensity of gaseous organic compounds in an inert atmosphere and in an oxidising atmosphere, it can be concluded that it is lower in the air atmosphere. This may indicate that gaseous organic compounds combustion reactions partially occur in the presence of oxygen.
At Tmax1a (compounds 13) and Tmax1′ (compounds 46) the continuous emission of HCN, HNCO, NH3, and N2 based on the FTIR and QMS is confirmed. The emission of these organic gases stops at ca. 440 °C. Additionally, at Tmax1a (compounds 13) and Tmax1′ (compounds 46), the emission of aromatic and carbonyl compounds begins, as evidenced by the presence of the following FTIR absorption bands: 1675–1681 cm−1 (the stretching vibrations for the C=O characteristic for carbonyl compounds) and 780–850 cm−1 (the out-of-plane deformation vibrations of the CAr-H), 1510–1602 cm−1 (the stretching vibrations of the CAr=CAr), and 3050–3060 cm−1 (the stretching vibrations of the CAr-H).
As the heating temperature increases above 440 °C, the creation of CO, CO2, H2O, and especially the formation of nitrogen oxides (FTIR: 1858–1950 cm−1 (the stretching vibrations of the NO in nitrogen monoxide) and 1564–1633 cm−1 (the stretching vibrations of the NO in nitrogen dioxide, QMS: m/z ion 30 NO+)) and N2 (m/z: 28) confirms the earlier supposition that some of the emitted volatiles undergo oxidation reactions. As it is well visible from the gaseous FTIR and QMS spectra, the emission of nitrogen oxides starts at lower temperatures (ca. 340 °C). However, at this temperature, their emission is low. Their high emission at temperatures above 500 °C is observed. This confirms that oxidation reactions of gaseous decomposition products containing nitrogen in their structure occur at a higher rate at higher temperatures. This also proves that at lower temperatures, intermediate products resulting from the reaction between radicals and oxygen are formed.
In addition, no methane emission in the case of the decomposition process of compounds 46 is observed. This confirms that methane under this analysis conditions is not formed or that it is burned to CO2 and H2O. Moreover, the creation of HCl for compounds 3 and 6—containing –Cl at the phenyl moiety—at Tmax1a as characteristic “noises” in the range of 2100–3100 cm−1 is confirmed [40,41].
In order to prove the oxidation reactions in the gaseous phase of emitted volatiles and/or formed residues, the course of the DSC curves collected in an air atmosphere up to 740 °C is presented in Figure 9. These DSC curves show the presence of mainly exothermic signals connected with the decomposition process of the tested compounds. The first exothermic DSC signal between 240 °C and 440 °C is observed. This exothermic DSC signal of temperature range covers with the first decomposition stage temperature range appointed from the TG/DTG analysis. These results confirm that the chemical reactions of the volatiles/residues with oxygen already occur at this temperature range. The second exothermic DSC signal with high intensity above 440 °C is observed. This proves the previous assumptions that volatiles oxidation/combustion reactions occur more efficiently at higher temperatures, as shown in Scheme 2.

2.6. Haemolytic Activity of the Investigated Heterocyclic Esters (16)

The effect of active newly synthesised compounds on living cells, such as blood cells, is a key factor in drug design and development. At this stage of research, it is necessary to carry out a preliminary screening for the toxicity profile of each potential drug. Various tests can be used for this purpose. An alternative tool for evaluating drug candidates’ toxicity is to perform a haemolysis assay on red blood cells. Mammalian erythrocytes, the most numerous cells in the blood, seem to be an excellent model for studying this cytotoxicity. They are widely used, due to not only their easy availability, but also the similarity of the erythrocyte membrane to other cell membranes. The haemolytic activity of potential drug candidates is an indicator of overall cytotoxicity to normal cells. Therefore, measuring haemolysis is an important tool in many fields, including the development of potential drugs. Additionally, testing the haemolytic potential (haemocompatibility) is necessary for active pharmaceutical ingredients and their carriers intended for intravenous injection because it provides a direct indication of the toxicity of these injectable preparations [53,54,55,56,57]. We applied a haemolysis test to evaluate the toxicity of potential ester drugs (16) to important blood components, i.e., red blood cells. The haemolytic activity of the tested compounds was compared with that of Triton X-100 in the same erythrocyte model. As shown in Table 4, Triton induced complete haemolysis, while all the tested compounds 16 were not toxic to red blood cells as they did not promote any haemolytic effects at a concentration at which they were pharmacologically active. The results of this study confirmed a good haemocompatibility of the tested esters (a haemolytic activity lower than 3.5%), which would make them suitable candidates for further in vivo investigations.

2.7. Protective Effect of the Investigated Heterocyclic Esters (16) against Haemolysis Induced by Oxidative Stress

The ability of the investigated heterocyclic esters (16) to counteract oxidative stress-induced haemolysis was studied in a model of erythrocytes exposed to AAPH-derived peroxyl radicals or hydrogen peroxides. These oxidative agents induce protein oxidation and lipid peroxidation, leading to membrane damage of red blood cells and ultimately, to haemolysis. Some compounds may prevent oxidation damage to membrane proteins and lipids and thus inhibit haemolysis. As shown in Table 4, the inhibition of oxidative haemolysis was dependent on the type of oxidant (peroxyl radicals or hydrogen peroxides) and the structure of the tested compound. The investigated molecules were better at preventing oxidative damage to erythrocytes caused by peroxyl radicals than by hydrogen peroxides. Among heterocyclic ethyl formates (13), the most active in inhibiting AAPH-generated oxidative haemolysis proved to be compounds 1 and 3, bearing the methyl and chloro group at the phenyl ring, respectively. In addition, the compound 2 (with the methoxy substituent) was almost equally effective in counteracting the haemolysis caused by these radicals. In turn, among heterocyclic methyl acetates (46), the compound 6 (with the chloro group) was the most effective in protecting red blood cells from AAPH-induced damage. The most active in inhibiting the haemolysis induced by H2O2 turned out to be two structures—both with methyl substitution—1 (the ethyl formate derivative) and 4 (the methyl acetate derivative). These results show that the above-mentioned esters may protect cell membranes from oxidative stress-induced damage as they inhibit haemolysis in erythrocytes exposed to oxidative agents.
Both the lack of haemolytic activity (which is an indicator of general cytotoxicity to normal cells) and the protection of red blood cells from oxidative damage are beneficial properties of the heterocyclic esters evaluated in the preclinical phase of drug development, which may increase the potential therapeutic utility of these drug candidates. Additionally, these molecules can serve as lead structures for the design of agents to prevent oxidative stress-mediated diseases.

3. Materials and Methods

3.1. Heterocyclic Esters (16)

Ethyl 4-oxo-8-[4-(R-phenyl)]-4,6,7,8-tetrahydroimidazo[2,1-c][1,2,4]triazine-3-carboxylates (13) were synthesised from 2-hydrazinylidene-1-[4-(R-phenyl)]imidazolidine (where R denotes –CH3 or –CH3O or –Cl) and diethyl 2-(hydroxyimino)malonate, using a previously patented and published synthesis method [1,2]. In turn, methyl {4-oxo-8-[4-(R-phenyl)]-4,6,7,8-tetrahydroimidazo[2,1-c][1,2,4]triazin-3-yl}acetates (46) were prepared from 2-hydrazinylidene-1-[4-(R-phenyl)]imidazolidine (where R denotes –CH3 or –CH3O or –Cl) and dimethyl but-2-ynedioate, as earlier reported [5]. The correct structures of these heterocyclic esters 16 have previously been established using spectroscopic data (1H NMR, IR and EI-MS spectra) and elemental analyses within ±0.4% of the theoretical values for C, H, N [1,2,5].

3.2. Differential Scanning Calorimetry (DSC)

The results from the DSC made it possible to determine the melting temperatures of the tested compounds including the onset melting temperatures (Tonset) and the maximum melting temperatures (Tmelt) as well as the melting enthalpy (ΔH). The DSC analyses with a use of a DSC 204 Phoenix apparatus (Netzsch, Selb, Germany) were applied. The tested compounds (a sample mass of approx. 10 mg) in the aluminium crucible with a pierced lid were heated from 20 °C to 250 °C. The heating rate was 10 °C min−1. The course of melting was studied in inert and oxidative atmospheres. For an inert atmosphere, helium with a flow rate of 40 mL min−1 was used. For an oxidative atmosphere, a synthetic air with a flow rate of 40 mL min−1 was applied.

3.3. Thermogravimetric Analysis/Differential Scanning Calorimetry Coupled On-Line with FTIR and QMS Analysers (TG/DTG/DSC/FTIR/QMS)

The TG/DTG/DSC analyses were performed with the use of a STA 449 Jupiter F1 instrument produced by Netzsch, Selb, Germany. All the compounds (a sample mass of approx. 10 mg) in the solid form in open corundum crucibles were placed and heated from 40 °C to 900 °C. The applied heating rate was 10 °C min−1. The analyses in an inert atmosphere (helium with a flow rate of 40 mL min−1) and in an oxidative atmosphere (a synthetic air with a flow rate of 100 mL min−1) were carried out. The results obtained from the TG/DTG curves allowed for the determination of the following values: the initial decomposition temperature marked as a 5% of mass loss (T5%), peak maximum decomposition temperatures (Tmax), mass losses in each decomposition stage (Δm), and the residual mass after heating to 900 °C (rm). In turn, the additional DSC curves made it possible to evaluate the exothermic/endothermic changes that occurred in the samples during heating.
In addition, a STA 449 Jupiter F1 instrument was connected on-line with two gas analysers, namely a Fourier Transform Infrared Spectrometer (a FTIR TGA 585, Bruker, Mannheim, Germany) and a Quadrupole Mass Spectrometer (a QMS 403 C Aëolos, Netzsch, Selb, Germany). This connection of the TG/DTG/DSC apparatus with gas analysers allowed for the qualitative identification of volatile products released during the decomposition of the tested compounds. Thus, the decomposition path of the tested compounds was proposed. In the case of the FTIR analyser, the gaseous FTIR spectra within the wavenumber range of 600–4000 cm−1, with a resolution of 4 cm−1, and 32 scans per spectrum were collected. In turn, the gaseous QMS spectra between 10 and 150 amu were gathered. Both analysers were equipped with the heated cell and transfer line in order to minimise the effect of condensation of volatiles. An IR cell and a Teflon transfer line were heated to 200 °C. A QMS inlet system was heated to 200 °C and the quartz capillary line to 300 °C.

3.4. Haemolytic Activity Assay

The ability of the investigated heterocyclic esters 16 to induce haemolysis was assessed ex vivo in a mammalian red blood cell model. The blood was collected from two rats (male Wistar rats; 8 weeks old; weighing 240–250 g; the Experimental Medicine Centre, Medical University of Lublin, Poland) into tubes containing heparin (Li-Heparin: 16 IU mL−1) as an anticoagulant. The tubes were centrifuged at 1000 rpm for 10 min at 4 °C, the supernatant and buffy coat were carefully removed, and the erythrocytes were resuspended with phosphate-buffered saline (PBS; pH 7.4; Biomed, Lublin, Poland) and centrifuged as previously indicated. The washing procedure was repeated until a transparent supernatant was obtained. The washed red blood cells were finally resuspended in PBS to a final concentration of 4%. Such a suspension was used for further studies. Each compound at a concentration of 0.15 mM was added to the erythrocyte suspension. Red blood cells in PBS and in 1% Triton X-100 solution (Sigma-Aldrich, Saint Louis, MO, USA) were considered negative (0% lysis) and positive (100% lysis) controls, respectively. The reaction mixtures were gently shaken in a water bath at 37 °C for 60 min. Then, the samples were centrifuged at 1500 rpm for 10 min and the absorbance of the supernatants was measured at λmax = 540 nm on a Hitachi U2800 spectrophotometer (Hitachi, Tokyo, Japan). The experiment was repeated three times, and the results are given as the average of three replicates.

3.5. Oxidative Haemolysis Inhibition Assay

The ability of the investigated heterocyclic esters 16 to counteract haemolysis induced by oxidative stress was evaluated ex vivo in a mammalian erythrocyte model. For this purpose, each compound at a concentration of 0.15 mM was incubated for 60 min in a water bath at 37 °C with a suspension of red blood cells prepared as described in the haemolysis assay. Freshly prepared ice-cold solutions of 40 mM 2,2′-azobis(2-amidinopropane)dihydrochloride (AAPH; Sigma-Aldrich, Saint Louis, MO, USA) or 75 mM hydrogen peroxide (H2O2; Sigma-Aldrich, Saint Louis, MO, USA) in PBS were then added to each sample. The reaction mixtures were gently shaken in a water bath at 37 °C for 210 min (samples with AAPH) or 180 min (samples with H2O2). After incubation, the samples were centrifuged at 1500 rpm for 5 min and the absorbance of the supernatants containing AAPH or H2O2 was measured spectrophotometrically at λmax = 524 or 540 nm, respectively. The experiment was repeated three times, and the results are given as the average of three replicates. The antihaemolytic activity of the tested compounds was calculated in relation to antioxidant standards, i.e., ascorbic acid or Trolox.

4. Conclusions

This paper presented the thermal properties and decomposition course of two types of para-R1-substituted nitrogen-rich heterocyclic esters with prospective pharmaceutical utility. The detailed thermal characterisation of these small molecules was carried out during the preclinical phase of drug development. The DSC analysis proved high purity of all the tested compounds and showed that they melted above 170 °C in both atmospheres (inert and oxidising). Among all the studied esters, those with a methyl group at the para position of the phenyl moiety exhibited the highest melting temperature. TG/DTG analyses confirmed the high thermal stability (above 250 °C) of all the tested compounds in helium and air. Ethyl formates 13 were characterised by ca. 13–23 °C higher thermal stability compared to methyl acetates 46 in both atmospheres. The decomposition process of the tested molecules was multi-stage, including at least two main stages in which two/three thermal steps were distinguished. The simultaneous TG/FTIR/QMS analyses proved that the pyrolysis and the oxidative decomposition were complicated processes and occurred as simultaneous decomposition reactions of various bonds with the same or similar decomposition activation energies. In inert conditions, mainly the homolytic decomposition of the C–C, C–N, and C–O bonds was confirmed, leading to the formation of radicals based on the type of the volatiles formed. As a result, the emission of alcohol (ethanol (in the case of ethyl formates 13) or methanol (in the case of methyl acetates 46)), NH3, HNCO, HCN, aldehydes, ethane, CO2, H2O, CH4, HCl and aromatics was confirmed. In turn, under oxidative conditions, the concentration of emitted volatiles, namely ethanol (in the case of ethyl formates 13) or methanol (in the case of methyl acetates 46), NH3, HNCO, HCN, HCl, aldehydes, ethane, and aromatic compounds, was lower as compared to inert conditions. In the case of compounds 46, no emission of CH4 was observed. In addition, the formation of new gaseous products, such as NO/NO2, CO, and N2, as a result of some oxidation and combustion processes, was confirmed. This proved that the decomposition course of the studied compounds in air was more complicated than in an oxygen-free atmosphere. The obtained results proved the high thermal stability, purity, and no polymorphic transformations (when screened for polymorphic behaviour at a low heating rate) of the tested compounds. Therefore, the performed studies are an important contribution to the current knowledge and will be of practical significance when establishing the storage and processing conditions of the investigated molecules, as well as their impact on the environment in the event of thermal utilisation. The beneficial thermal properties of the studied compounds may increase interest in these potential drug candidates. The lack of polymorphic transformations in the solid state of the investigated heterocyclic esters, as well as their high thermostability and purity seem to predispose them to future pharmaceutical applications. Additionally, all the tested nitrogen-rich heterocyclic esters proved to be safe for red blood cells, and some of them protected erythrocytes from AAPH- and H2O2-induced stress, which is an important feature of potential drug candidates. This research resulted in the documentation of beneficial thermal behaviour and biological properties of a number of original structures that represent an excellent material for the future development and implementation of these potential drugs.

Author Contributions

Conceptualization, M.W., K.S. and M.S.; methodology, M.W., K.S. and M.S.; investigation, M.W., K.S. and M.S.; resources, M.W., K.S. and M.S.; writing—original draft preparation, M.W., K.S. and M.S.; writing—review and editing, M.W., K.S. and M.S.; funding acquisition, M.S. All authors have read and agreed to the published version of the manuscript.

Funding

This research received no external funding.

Institutional Review Board Statement

Not applicable.

Informed Consent Statement

Not applicable.

Data Availability Statement

The data presented in this study are available on request from the authors.

Conflicts of Interest

The authors declare no conflicts of interest.

References

  1. Sztanke, K., inventor; Medical University of Lublin, assignee. New Ethyl Esters of 7,8-Dihydro-6H-imidazo[2,1-c][1,2,4]triazin-4-oxo-3-carboxylic Acid and Method for Their Manufacture. Polish Patent 196751, 31 January 2008. [Google Scholar]
  2. Sztanke, K.; Rzymowska, J.; Niemczyk, M.; Dybała, I.; Kozioł, A.E. Synthesis, crystal structure and anticancer activity of novel derivatives of ethyl 1-(4-oxo-8-aryl-4,6,7,8-tetrahydroimidazo[2,1-c][1,2,4]triazin-3-yl)formate. Eur. J. Med. Chem. 2006, 41, 539–547. [Google Scholar] [CrossRef]
  3. Sztanke, M.; Rzymowska, J.; Sztanke, K. In vitro effects of a new fused azaisocytosine-like congener on relative cell proliferation, necrosis and cell cycle in cancer and normal cell cultures. Mol. Cell. Biochem. 2016, 418, 179–188. [Google Scholar] [CrossRef]
  4. Janicka, M.; Mycka, A.; Sztanke, M.; Sztanke, K. Predicting pharmacokinetic properties of potential anticancer agents via their chromatographic behavior on different reversed phase materials. Int. J. Mol. Sci. 2021, 22, 4257. [Google Scholar] [CrossRef] [PubMed]
  5. Sztanke, M.; Tuzimski, T.; Janicka, M.; Sztanke, K. Structure-retention behaviour of biologically active fused 1,2,4-triazinones—Correlation with in silico molecular properties. Eur. J. Pharm. Sci. 2015, 68, 114–126. [Google Scholar] [CrossRef] [PubMed]
  6. Tyszczuk-Rotko, K.; Kozak, J.; Sztanke, M.; Sztanke, K.; Sadok, I. A screen-printed sensor coupled with flow system for quantitative determination of a novel promising anticancer agent candidate. Sensors 2020, 20, 5217. [Google Scholar] [CrossRef]
  7. Tzeng, C.-C.; Hwang, L.-C.; Wang, C.-J.; Lee, G.-H.; Wang, Y. Synthesis and structure assignment o 1-[(2-hydroxyethoxy)methyl]- and 1-[(1,3-dihydroxy-2-propoxy)methyl]-6-azaisocytosine. Heterocycles 1995, 41, 293. [Google Scholar] [CrossRef]
  8. Zálešák, F.; Slouka, J.; Stýskala, J. General synthesis of 1-aryl-6-azaisocytosines and their utilization for the preparation of related condensed 1,2,4-triazines. Molecules 2019, 24, 3558. [Google Scholar] [CrossRef]
  9. Mahfouz, R.Z.; Jankowska, A.; Ebrahem, Q.; Gu, X.; Visconte, V.; Tabarroki, A.; Terse, P.; Covey, J.; Chan, K.; Ling, Y.; et al. Increased CDA expression/activity in males contributes to decreased cytidine analog half-life and likely contributes to worse outcomes with 5-azacytidine or decitabine therapy. Clin. Cancer Res. 2013, 19, 938–948. [Google Scholar] [CrossRef]
  10. Kandefer-Szerszeń, M.; Szuster-Ciesielska, A.; Sztanke, K.; Pasternak, K., inventors; Maria Curie-Sklodowska University in Lublin, Medical University of Lublin, assignees. 8-(4-Methoxyphenyl)-4-oxo-4,6,7,8-tetrahydroimidazo[2,1-c][1,2,4]triazin-3-formic acid hydrazide used as a drug for liver diseases. Polish Patent 216264, 31 March 2014. [Google Scholar]
  11. Patrick, G.L. An Introduction to Medicinal Chemistry; Oxford University Press Inc.: New York, NY, USA, 2009. [Google Scholar]
  12. Rathore, M.S.; Kumar, S. Prodrug design and development for improved bioavailability across biological barriers. Int. J. Pharm. Pharm. Res. 2016, 7, 187–220. [Google Scholar]
  13. Hong, X.; Cai, Z.; Zhou, F.; Jin, X.; Wang, G.; Ouyang, B.; Zhang, J. Improved pharmacokinetics of tenofovir ester prodrugs strengthened the inhibition of HBV replication and the rebalance of hepatocellular metabolism in preclinical models. Front. Pharmacol. 2022, 13, 932934. [Google Scholar] [CrossRef]
  14. Wesolowski, M.; Leyk, E. Coupled and simultaneous thermal analysis techniques in the study of pharmaceuticals. Pharmaceutics 2023, 15, 1596. [Google Scholar] [CrossRef] [PubMed]
  15. Sikorska-Iwan, M.; Modzelewska-Banachiewicz, B. Thermal behaviour of 1,2,4-triazole and 1,2,4-triazine derivatives. J. Therm. Anal. Calorim. 2005, 81, 119–123. [Google Scholar] [CrossRef]
  16. Epishina, M.A.; Kulikov, A.S.; Fershtat, L.L. Revisiting the synthesis of functionally substituted 1,4-dihydrobenzo[e][1,2,4]triazines. Molecules 2022, 27, 2575. [Google Scholar] [CrossRef] [PubMed]
  17. Pandey, A.; Singh, B. Mesogens based on cholesterol derivatives: Synthesis and characterization. Mol. Cryst. Liq. Cryst. 2012, 562, 166–176. [Google Scholar] [CrossRef]
  18. Wang, X.; You, J. Study on the thermal decomposition of capecitabine. J. Therm. Anal. Calorim. 2016, 123, 2485–2497. [Google Scholar] [CrossRef]
  19. Attia, A.K.; Abdel-Moety, M.M.; Abdel-Hamid, S.G. Thermal analysis study of antihypertensive drug doxazosin mesilate. Arabian J. Chem. 2017, 10, S334–S338. [Google Scholar] [CrossRef]
  20. Hsieh, W.H.; Cheng, W.T.; Chen, L.C.; Lin, S.Y. Non-isothermal dehydration kinetic study of aspartame hemihydrate using DSC, TGA and DSC-FTIR microspectroscopy. Asian J. Pharm. Sci. 2018, 13, 212–219. [Google Scholar] [CrossRef]
  21. Sangeetha Margreat, S.; Ramalingam, S.; Sebastian, S.; Xavier, S.; Periandy, S.; Joseph, C.D.; Maria Julie, M. DFT, spectroscopic, DSC/TGA, electronic, biological and molecular docking investigation of 2,5-thiophenedicarboxylic acid: A promising anticancer agent. J. Mol. Struct. 2020, 1200, 127099. [Google Scholar] [CrossRef]
  22. Terekhov, R.P.; Selivanova, I.A.; Tyukavkina, N.A.; Ilyasov, I.R.; Zhevlakova, A.K.; Dzuban, A.V.; Bogdanov, A.G.; Davidovich, G.N.; Shylov, G.V.; Utenishev, A.N.; et al. Assembling the puzzle of taxifolin polymorphism. Molecules 2020, 25, 5437. [Google Scholar] [CrossRef]
  23. Yoshioka, S.; Stella, V.J. Stability of Drugs and Dosage Forms; Kluwer Academic Publisher: New York, NY, USA; Boston, MA, USA; Dordrecht, The Netherlands; London, UK; Moscow, Russia, 2002. [Google Scholar]
  24. Hogge, J.W.; Long, E.A.; Christian, M.L.; Fankhauser, A.D.; Quist, N.L.; Rice, D.M.; Wilding, W.V.; Knotts IV, T.A. Melting point, enthalpy of fusion and heat capacity measurements of several polyfunctional, industraially important compounds by differential scanning calorimetry. J. Chem. Eng. Data 2018, 63, 2500–2511. [Google Scholar] [CrossRef]
  25. Giron, D.; Mutz, M.; Garnier, S. Solid-state of pharmaceutical compounds. J. Therm. Anal. Calorim. 2004, 77, 709–747. [Google Scholar] [CrossRef]
  26. Guo, Y. Impact of solid-state characteristics to the physical stability of drug substance and drug product. In Handbook of Stability Testing in Pharmaceutical Development; Huynh-Ba, K., Ed.; Springer Science+Business Media, LLC: New York, NY, USA, 2009. [Google Scholar]
  27. Available online: https://webbook.nist.gov/cgi/cbook.cgi?ID=C64175&Type=IR-SPEC&Index=0#IR-SPEC (accessed on 27 February 2024).
  28. Available online: https://webbook.nist.gov/cgi/cbook.cgi?ID=C67561&Units=SI&Type=IR-SPEC&Index=0#IR-SPEC (accessed on 27 February 2024).
  29. Kerpel dos Santos, M.; Tassi Borille, B.; Flores Cruz, G.N.; Coppe, B.C.; Comiran, E.; Kaiser, S.; Fröehlich, P.E.; Limberger, R.P. Extraction optimization using Box-Behnken design and method validation for ethanol in oral fluid. Anal. Methods 2014, 6, 6095–6104. [Google Scholar] [CrossRef]
  30. Beynon, J.H.; Fontaine, A.E.; Lester, G.R. Mass spectrometry: The mass spectrum of methanol. Part I. Thermochemical information. Int. J. Mass Spectrom. Ion Physics 1968, 1, 1–24. [Google Scholar] [CrossRef]
  31. Giechaskiel, B.; Clairotte, M. Fourier Transform Infrared (FTIR) spectroscopy for measurements of vehicle exhaust emissions: A review. Appl. Sci. 2021, 11, 7416. [Google Scholar] [CrossRef]
  32. Dammers, E.; Vigouroux, C.; Palm, M.; Mahieu, E.; Warneke, T.; Smale, D.; Langerock, B.; Franco, B.; Van Damme, M.; Schaap, M.; et al. Retrieval of ammonia from ground-based FTIR solar spectra. Atmos. Chem. Phys. 2015, 15, 12789–12803. [Google Scholar] [CrossRef]
  33. Griffith, D.W.T.; Galle, B. Flux measurements of NH3, N2O and CO2 using dual beam FTIR spectroscopy and the flux–gradient technique. Atmos. Environ. 2000, 34, 1087–1098. [Google Scholar] [CrossRef]
  34. Bai, M.; Suter, H.; Lam, S.K.; Davies, R.; Flesch, T.K.; Chen, D. Gaseous emissions from an intensive vegetable farm measured with slant-path FTIR technique. Agric. Forest. Meteorol. 2018, 258, 50–55. [Google Scholar] [CrossRef]
  35. Mellau, G.C.; Winnewisser, B.P.; Winnewisser, M. Near infrared emission spectrum of HCN. J. Mol. Spectrosc. 2008, 249, 23–42. [Google Scholar] [CrossRef]
  36. Choi, K.N.; Barker, E.F. Infrared absorption spectrum of hydrogen cyanide. Phys. Rev. 1932, 42, 777–785. [Google Scholar] [CrossRef]
  37. Gibier, M.; Girods, P.; Rogaume, Y. Development of an original and easy method for isocyanic acid (HNCO) calibration on FTIR spectrometer. Vib. Spectrosc. 2021, 116, 103290. [Google Scholar] [CrossRef]
  38. Li, J.; Wang, Z.; Yang, X.; Hu, L.; Liu, Y.; Wang, C. Evaluate the pyrolysis pathway of glycine and glycylglycine by TG–FTIR. J. Anal. Appl. Pyrolysis 2007, 80, 247–253. [Google Scholar] [CrossRef]
  39. Ruzi, M.; Anderson, D.T. Photodissociation of N-methylformamide isolated in solid parahydrogen. J. Chem. Phys. 2012, 137, 194313. [Google Scholar] [CrossRef] [PubMed]
  40. Fox, R.E. Threshold ionization of HCl by electron impact. J. Chem. Phys. 1960, 32, 385–386. [Google Scholar] [CrossRef]
  41. Ngohang, F.E.; Fontaine, G.; Gay, L.; Bourbigot, S. Revisited investigation of fire behavior of ethylene vinyl acetate/aluminum trihydroxide using a combination of mass loss cone, Fourier transform infrared spectroscopy and electrical low pressure impactor. Polym. Degrad. Stabil. 2014, 106, 26–35. [Google Scholar] [CrossRef]
  42. Galle, B.; Samuelsson, J.; Svensson, B.H.; Borjesson, G. Measurements of methane emissions from landfills using a time correlation tracer method based on FTIR absorption spectroscopy. Environ. Sci. Technol. 2001, 35, 21–25. [Google Scholar] [CrossRef] [PubMed]
  43. Yuan, Y.; Yu, B.; Shi, Y.; Mao, L.; Xie, J.; Pan, H.; Liu, Y.; Wang, W. Insight into hyper-branched aluminum phosphonate in combination with multiple phosphorus synergies for fire-safe epoxy resin composites. Polymers 2020, 12, 64. [Google Scholar] [CrossRef] [PubMed]
  44. Xu, Z.; Xu, Z.; Tao, R.; Mao, L.; Zhan, J.; Xiao, J.; Yu, T. Combustion and thermal properties of flame retardant polyurethane foam with ammonium polyphosphate synergized by phosphomolybdic acid. Front. Mater. Sci. 2022, 9, 944368. [Google Scholar] [CrossRef]
  45. Hao, J.; Che, Y.; Tian, Y.; Li, D.; Zhang, J.; Qiao, Y. Thermal cracking characteristics and kinetics of oil sand bitumen and its SARA fractions by TG–FTIR. Energ. Fuel. 2017, 31, 1295–1309. [Google Scholar] [CrossRef]
  46. Knaanie, R.; Sebek, J.; Tsuge, M.; Myllys, N.; Khriachtchev, L.; Rasanen, M.; Albee, B.; Potma, E.O.; Gerber, R.B. Infrared spectrum of toluene: Comparison of anharmonic isolated-molecule calculations and experiments in liquid phase and in a Ne matrix. J. Phys. Chem. A 2016, 120, 3380–3389. [Google Scholar] [CrossRef]
  47. Gellini, C.; Moroni, L.; Muniz-Miranda, M. High overtones of the C-H stretching vibrations in anisole and thioanisole. J. Phys. Chem. A 2002, 106, 10999–11007. [Google Scholar] [CrossRef]
  48. Chen, W.; Cazier, F.; Tittel, F.; Boucher, D. Measurements of benzene concentration by difference-frequency laser absorption spectroscopy. Appl. Opt. 2000, 39, 6238–6242. [Google Scholar] [CrossRef] [PubMed]
  49. Shamsipur, M.; Pourmortazavi, S.M.; Beigi, A.A.M.; Heydari, R.; Khatibi, M. Thermal stability and decomposition kinetic studies of acyclovir and zidovudine drug compounds. AAPS PharmSciTech 2013, 14, 287–293. [Google Scholar] [CrossRef] [PubMed]
  50. Yoshida, M.I.; Gomes, E.C.; Soares, C.D.; Oliveira, M.A. Thermal behavior study and decomposition kinetics of amiodarone hydrochloride under isothermal conditions. Drug Dev. Ind. Pharm. 2011, 37, 638–647. [Google Scholar] [CrossRef] [PubMed]
  51. Yang, W.; Zou, L.; Shao, H.; Zhao, Q.; Wang, Y. Research on thermal behaviors and NOx release properties during combustion of sewage sludge, sawdust, and their blends. ASC Omega 2022, 7, 20172–20185. [Google Scholar] [CrossRef] [PubMed]
  52. Gao, P.; Zheng, M.; Li, K.; Wang, H.; Wang, J.; Bao, G.; Wang, L. Characteristics of nitrogen oxide emissions from combustion synthesis of a CuO oxygen carrier. Fuel Process. Technol. 2022, 233, 107295. [Google Scholar] [CrossRef]
  53. Pagano, M.; Faggio, C. The use of erythrocyte fragility to assess xenobiotic cytotoxicity. Cell Biochem. Funct. 2015, 33, 351–355. [Google Scholar] [CrossRef] [PubMed]
  54. Sæbø, I.P.; Bjørås, M.; Franzyk, H.; Helgesen, E.; Booth, J.A. Optimization of the hemolysis assay for the assessment of cytotoxicity. Int. J. Mol. Sci. 2023, 24, 2914. [Google Scholar] [CrossRef] [PubMed]
  55. Tzankova, D.; Vladimirova, S.; Aluani, D.; Yordanov, Y.; Peikova, L.; Georgieva, M. Synthesis, in vitro safety and antioxidant activity of new pyrrole hydrazones. Acta Pharm. 2020, 70, 303–324. [Google Scholar] [CrossRef]
  56. Séguy, L.; Groo, A.-C.; Goux, D.; Hennequin, D.; Malzert-Fréon, A. Design of non-haemolytic nanoemulsions for intravenous administration of hydrophobic APIs. Pharmaceutics 2020, 12, 1141. [Google Scholar] [CrossRef]
  57. Kundishora, A.; Sithole, S.; Mukanganyama, S. Determination of the cytotoxic effect of different leaf extracts from Parinari curatellifolia (Chrysobalanaceae). J. Toxicol. 2020, 2020, 8831545. [Google Scholar] [CrossRef]
Figure 1. Structures of ethyl 4-oxo-8-[4-(R-phenyl)]-4,6,7,8-tetrahydroimidazo[2,1-c][1,2,4]triazine-3-carboxylates (13) and methyl 2-{4-oxo-8-[4-(R-phenyl)]-4,6,7,8-tetrahydroimidazo[2,1-c][1,2,4]triazin-3-yl}acetates (46), which have been thermally evaluated in this article.
Ijms 25 04768 g001
Figure 2. The DSC curves for the tested compounds (16) collected in a synthetic air atmosphere.
Ijms 25 04768 g002
Figure 3. TG (a) and DTG (b) curves for the tested compounds (16) (inert conditions).
Ijms 25 04768 g003
Figure 4. The gaseous FTIR spectra for compounds 16 collected in an inert atmosphere.
Ijms 25 04768 g004
Figure 5. The QMS spectra for compounds 16 collected in an inert atmosphere.
Ijms 25 04768 g005aIjms 25 04768 g005b
Scheme 1. A simplified course of pyrolysis of the tested compounds (16) in an inert atmosphere.
Ijms 25 04768 sch001
Figure 6. The course of the TG (a) and DTG (b) curves for the tested compounds (16) in an oxidative atmosphere.
Ijms 25 04768 g006
Figure 7. The gaseous FTIR spectra for compounds 16 collected in oxidative conditions.
Ijms 25 04768 g007
Figure 8. The QMS spectra for compounds 16 collected in oxidative conditions.
Ijms 25 04768 g008aIjms 25 04768 g008bIjms 25 04768 g008c
Figure 9. The course of the DSC curves of compounds 16 in an air atmosphere.
Ijms 25 04768 g009
Scheme 2. The emitted volatile compounds in an oxidative atmosphere.
Ijms 25 04768 sch002
Table 1. The DSC results for the tested compounds (16).
Ijms 25 04768 i001
CompoundInert AtmosphereOxidative Atmosphere
Tonset/°CTmelt/°CΔH/J/gTonset/°CTmelt/°CΔH/J/g
1213215135.8212215147.3
2171173152.2170172161.6
3207210143.6206211151.9
4218220123.8217221134.3
5194196135.1194196143.9
6183185126.7182185135.1
Table 2. TG/DTG data for the tested compounds (16) (inert conditions).
Ijms 25 04768 i002
CompoundDecomposition Process
First Decomposition StageSecond Decomposition Stage
T5%/°CTmax1/°CΔm1/%Tmax1a/°CΔm1a/%Tmax2/°CΔm2/%rm/%
127830140.0354/44832.072628.00
227329836.9345/49831.871531.30
328030038.738237.173324.20
T5%/°CTmax1/Tmax1′°C-Tmax1a/ °CΔm1 + Δm1a/%Tmax2/°CΔm2/%rm/%
4260288/309-40765.7-9.025.3
5256278/326-48668.4-4.027.6
6257280/335-381/40163.1-9.327.5
Table 3. TG/DTG data collected for the tested compounds (16) (oxidising conditions).
Ijms 25 04768 i003
CompoundDecomposition Process
First Decomposition StageSecond Decomposition Stage
T5%/°CTmax1/Tmax1′/°CΔm1/%Tmax1a/°CΔm1a/%Tmax2/°CΔm2/%
128029738.6359/43129.561135.2
227729933.9357/42231.959534.2
327629733.5364/39331.256235.3
4259281/32636.843316.860946.4
5252274/33933.53839.757756.8
6257279/33738.840313.858147.4
Table 4. Haemolytic and antihaemolytic activities of the investigated heterocyclic esters (16).
Ijms 25 04768 i004
Compound/ControlHaemolytic Activity (%) aInhibition (%) of Oxidative Haemolysis
Induced by AAPH bInduced by H2O2 c
13.08 ± 0.2281 ± 6.775 ± 7.0
23.29 ± 0.2477 ± 5.548 ± 3.3
32.64 ± 0.1181 ± 5.840 ± 3.8
43.13 ± 0.1964 ± 4.082 ± 7.1
53.46 ± 0.2561 ± 4.853 ± 3.8
63.05 ± 0.2479 ± 6.152 ± 4.1
Triton X-100100--
Ascorbic acid-100-
Trolox--100
AAPH—2,2′-azobis(2-methylpropionamidine)dihydrochloride; H2O2—hydrogen peroxide; Trolox—6-hydroxy-2,5,7,8-tetramethylchroman-2-carboxylic acid; a—haemolytic activity of compounds 16 in relation to a positive control, i.e., 1% Triton X-100 solution; b—antihaemolytic activity (in the model of rat erythrocytes exposed to AAPH) of compounds 16 in relation to ascorbic acid; c—antihaemolytic activity (in the model of rat erythrocytes exposed to H2O2) of compounds 16 in relation to Trolox. Compounds were tested at a concentration of 0.15 mM. Data (from three independent experiments) are shown as the mean ± standard deviation.
Disclaimer/Publisher’s Note: The statements, opinions and data contained in all publications are solely those of the individual author(s) and contributor(s) and not of MDPI and/or the editor(s). MDPI and/or the editor(s) disclaim responsibility for any injury to people or property resulting from any ideas, methods, instructions or products referred to in the content.

