Article

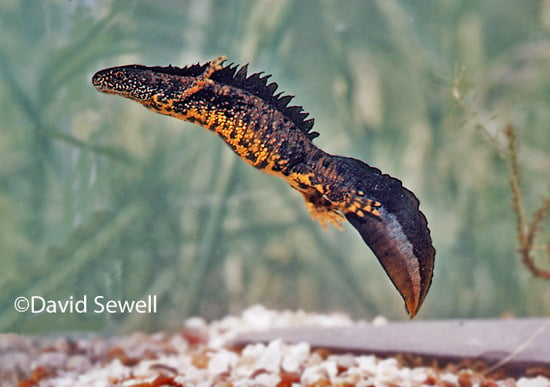
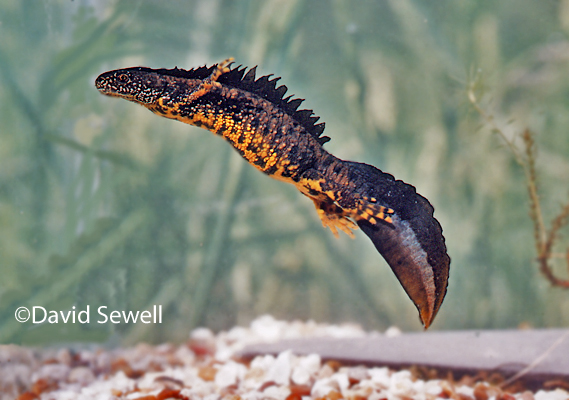
Can a Single Amphibian Species Be a Good Biodiversity Indicator?

Durrell Institute of Conservation and Ecology, School of Anthropology and Conservation, University of Kent, Marlowe Building, Canterbury, Kent CT2 7NR, UK
*
Author to whom correspondence should be addressed.
Diversity 2009, 1(2), 102-117; https://doi.org/10.3390/d1020102
Submission received: 27 September 2009 / Accepted: 11 November 2009 / Published: 13 November 2009
(This article belongs to the Special Issue Amphibian Conservation)

Abstract

:
Although amphibians have been widely promoted as indicators of biodiversity and environmental change, rigorous tests are lacking. Here key indicator criteria are distilled from published papers, and a species that has been promoted as a bioindicator, the great crested newt, is tested against them. Although a link was established between the presence of great crested newts and aquatic plant diversity, this was not repeated with the diversity of macroinvertebrates. Equally, amphibians do not meet many of the published criteria of bioindicators. Our research suggests that a suite of indicators, rather than a single species, will usually be required.

Graphical Abstract

1. Introduction

Resources to monitor and protect species are restricted by logistics and funding. Surrogate taxa may therefore be chosen on the basis that protecting these will protect other species facing similar threats. Surrogate species are used in several ways to monitor or solve conservation problems, but a number of the terms in common usage are employed inconsistently [1]. Although some taxa are frequently referred to as ‘indicator species’ there is actually no consensus on what they are supposed to indicate. Equally, other terms such as ‘umbrella species’ (where the protection of one species also protects many other species sharing the same habitat) utilize notions that are “a matter of faith rather than research” [2]. Here we examine one of these terms, indicator species, and follow an earlier precedent in recognising two types [3]. A type (i) indicator reflects community composition, whilst a type (ii) indicator reflects environmental change. The term bioindicator is sometimes used as a synonym, especially for type (ii) indicators, (e.g., [4,5,6,7,8]). Many of these studies utilize a single species as an indicator of environmental change or pollution. Several authors define the characteristics of good indicator species [1,9,10,11,12,13,14]. Many of the papers defining the characteristics of good indicators are more than a decade old, but the confusion in terms continues [15,16]. Disorder has been compounded by the additional application of the term in policy making, where the term ‘headline indicator’ has been proposed to describe an indicator that is simple to comprehend and intended to inform decision makers and the general public [16,17]. The characteristics of headline indicators are defined elsewhere, and include using as many species in a taxon as possible, as well as being stakeholder driven, and policy relevant [17]. As such, they are different in nature to the type (i) and (ii) indicators considered here, and are not considered further, except to examine the resulting confusion when the term ‘indicator’ is loosely used without further qualification.
In recent years, research into indicators of biodiversity has concentrated on the use of multiple species as indicators, either taken from within a single taxon or across a range of taxa, with varying results. It has been noted that areas of richness of rare species across different taxa are larger in South America than in other biodiversity hotspots [18]. It is perhaps, therefore, unsurprising that some recent studies from this continent have suggested that certain groups are good indicators [19,20], whilst studies examining the diversity in temperate regions have found less support for one taxon indicating richness in another [21,22].
Amphibians have been promoted as biological indicators on the basis that their sensitive skins and use of both aquatic and terrestrial habitats makes them vulnerable to environmental change (e.g., [23,24,25]). Promotion of amphibians as indicators dates back to the late 1980s when there was a resurgence of interest in amphibian declines (e.g., [23,24,26,27]). Despite the paucity of supporting data, this advocacy has continued [28,29,30,31]. In contrast, it has been argued that there is little evidence supporting the notion that amphibians are particularly sensitive indicators [32]. The skin of amphibians is an effective protective covering for many species, whilst others show resistance to pesticides [33]. Even when species are adversely affected by pollution, it has been pointed out that this does not necessarily imply that a large number of other species are similarly affected [2]. Tests of the effects of insecticides and herbicides on amphibian larvae have shown that whilst some species are adversely affected, others may benefit as the chemicals used have differential effects on predators or competitors [34,35]. An examination of the sensitivity of amphibians to environmental contaminants has suggested that far from being “canaries in a coal mine”, they are rather “miners in a coal mine”, i.e., they are no more sensitive to chemical contamination than many other taxa [36]. There may be difficulty in distinguishing between population changes caused by environmental stressors and those due to natural fluctuations [37].
Previous studies have not clearly evaluated amphibians against the criteria for indicator species. Mostly, amphibians have been suggested as type (ii) indicators [38,39,40], although great crested newts (Triturus cristatus) have been suggested as indicating higher amphibian species richness in ponds that they occupy [41]. In a study based on a small sample of ponds it was suggested that the species may also be a type (i) indicator of aquatic plant diversity [42].
The great crested newt is a declining species and is protected in Europe under the Bern Convention 1979 and is also listed in Appendices II and IV of the EU Habitats Directive. Since the 1990s, it has been promoted as an ‘indicator’ species of UK environmental health, or as an umbrella species, protecting other species in the habitat it occupies [43,44,45].
The aim of the current paper is threefold. Firstly, we seek to examine the extent to which one species can meet the requirements of an indicator by comparing the diversity of aquatic plants and invertebrates in ponds with and without great crested newts. We believe this to be the first study to examine a single amphibian species as a type (i) indicator for multiple taxa against published criteria. The only similar study we are aware of [46] examines amphibians as type (ii) indicators, and only considers a set of criteria given by one pair of authors [14]. Secondly, we evaluate the great crested newt against explicit criteria for indicator species that we distilled from the literature. Thirdly, we discuss the evidence that amphibians in general meet the criteria for indicator species.

2. Methods

2.1. Analysis of Indicator Criteria

A number of papers setting out criteria for the selection of indicators [1,9,10,11,12,13,14] were examined, and criteria that were common to two or more papers were retained. Both explicit and implicit criteria were included: for example, one paper [12] does not explicitly say that a suite of indicators may be better than a single indicator species, yet the entire paper is built around communities of organisms as bioindicators, and the paper additionally states that indicators may have a physical or chemical basis instead of a biological one. It has also been attempted to assign these criteria as relevant to type (i), biodiversity, or type (ii), environmental indicators, or as both, following earlier precedence [3].

2.2. Study Area

The study site comprised a 5 km × 5 km grid, situated near Canterbury in southeast England, UK. The area comprised a mixed landscape of woodland fragments and agricultural land. There were also built up areas, including several villages and a University campus. Ponds were located from an Ordnance Survey 1:10,000 scale plan, from local knowledge, and from a previous study [47]. Small garden ponds were excluded due to time constraints and the relatively low suitability of such ponds for great crested newts. Study ponds varied between 2 and 1,045 m2 in area. The initial sample was 74 ponds, but this was reduced for both aquatic plant and macroinvertebrate surveys, as described below.

2.3. Data Collection

Great crested newts were located using funnel traps spaced at 2 m intervals around the pond shoreline [48,49] and by night time visual surveys using a 500,000 candlepower torch. At most sites, we used both methods but torchlight surveys were impossible at some ponds on certain survey dates due to water turbidity, whilst at some others public access precluded trap use. Three visits were made to each pond during the breeding seasons of 2004/5. Where netting surveys for invertebrates (see below) yielded additional information such as the presence of eggs or larvae, we incorporated these into the results.
Methods of data collection for aquatic plants followed established methods [50]. Each pond was surveyed three times by daylight. Plants found within the outer boundary of the pond were included, and estimates of abundance made. Vegetation surveys could not be completed at all ponds, including two that were destroyed before the vegetation surveys began. The reduced sample size was 65, comprising 21 ponds occupied by great crested newts and 44 unoccupied by the species.
The cover of each plant species was recorded on all visits, and expressed as a percentage of pond area. The maximum extent of cover for each species was used in the analysis. Cover of each species was calculated by multiplying pond area (m2) by the estimated coverage of the species for each pond.
To facilitate plant identification, 35 common species were chosen from a list of aquatic plants [50]. Plants were identified using several identification guides [51,52,53] and a local flora [54]. For two genera (Lemna and Callitriche) where several similar species existed, identification was only to genus level.
Data collection methods for invertebrates again followed established methods for pond surveys [50], and utilized a three-minute sweep of a hand net (2 mm mesh) at each pond, except in the case of small ponds where 100% coverage could be achieved in fewer sweeps. To cover areas that would be missed by the netting effort, such as the water surface or under stones, we made an additional quick visual search of 1 minute per pond. Sampling was carried out twice at each site, once each in summer and autumn. The intensive effort involved meant that only a small number of ponds could be sampled. The total number of ponds in the macroinvertebrate sample was therefore reduced to 27, 13 occupied and 14 unoccupied by great crested newts.
Each macroinvertebrate sample was sorted on the bank of the pond and the organisms returned to the water. Some taxa included in the sample, such as some of those within the Diptera, could not be identified with certainty to species level at the larval stage [55,56]. All comparisons and analysis were therefore carried out from a list of pond invertebrate families [57]. Zooplankton, such as Cladocera (water fleas), were sometimes encountered in large numbers but were excluded from analysis, as the mesh size used was not designed for retaining such taxa.

2.4. Data Analysis

For most analyses, we compared ponds occupied by great crested newts to those that were unoccupied. The species is known to favour larger ponds in the range 500–700 m2 [58,59]. Therefore, the effects of pond size on aquatic plant presence were also examined, even though pond size is sometimes considered unimportant for aquatic plant diversity [60]. Heterogeneity in each occupied and unoccupied pond was determined using both the Shannon–Wiener function and the reciprocal of Simpson’s index. Differences in diversity between occupied and unoccupied ponds were compared using an ANCOVA with pond size as the covariate, and with Simpson’s indices arcsin transformed. Levene’s test was used to check for equality of variances between the two samples.
The probability of detecting great crested newt occupancy in ponds was examined using the software program PRESENCE [61]. Rarefaction analysis was used to determine whether the sampling effort adequately captured the diversity of invertebrates and aquatic plants present [62,63,64].

3. Results and Discussion

3.1. Indicator Criteria

Eight key criteria for indicator species were distilled from the literature and are listed in Table 1. Of these, the only criterion common to all seven papers was the value in using a suite of species as opposed to just one. The second ranking criterion was that an indicator species should be easy and cost effective to monitor, common to six of the seven papers examined. However, Table 1 also shows that these criteria are common to both type (i) and type (ii) indicators. Greater numbers of occurrences would logically be expected for criteria that are common to both, compared to those only applicable to one type.
Table 1. Criteria for type (i) and type (ii) indicator species.
CriteriaApplicable to type (i) or type (ii) indicator, or bothNumber of occurrences
1. The species should be easy and cost effective to observe, identify and monitorBoth6
2. Patterns of species richness should be closely correlated with those of other, non-related groups Type (i)3
3. The species should be sufficiently sensitive to provide early warning of change in the environmentType (ii)4
4. Species should be capable of providing a continuous assessment over a wide range of stresses, including anthropogenic stressesType (ii)4
5. It should be possible to differentiate between the species responses to natural and anthropogenic stressesType (ii)4
6. The species should be distributed over a broad geographical area, if the indicator is at family or higher level, ideally worldwideBoth4
7. It may be better to use a number of species rather than have just one Both7
8. The indicator should be relevant to ecologically significant phenomenaBoth2
Criteria in the tables are distilled from seven published papers [1,9,10,11,12,13,14].

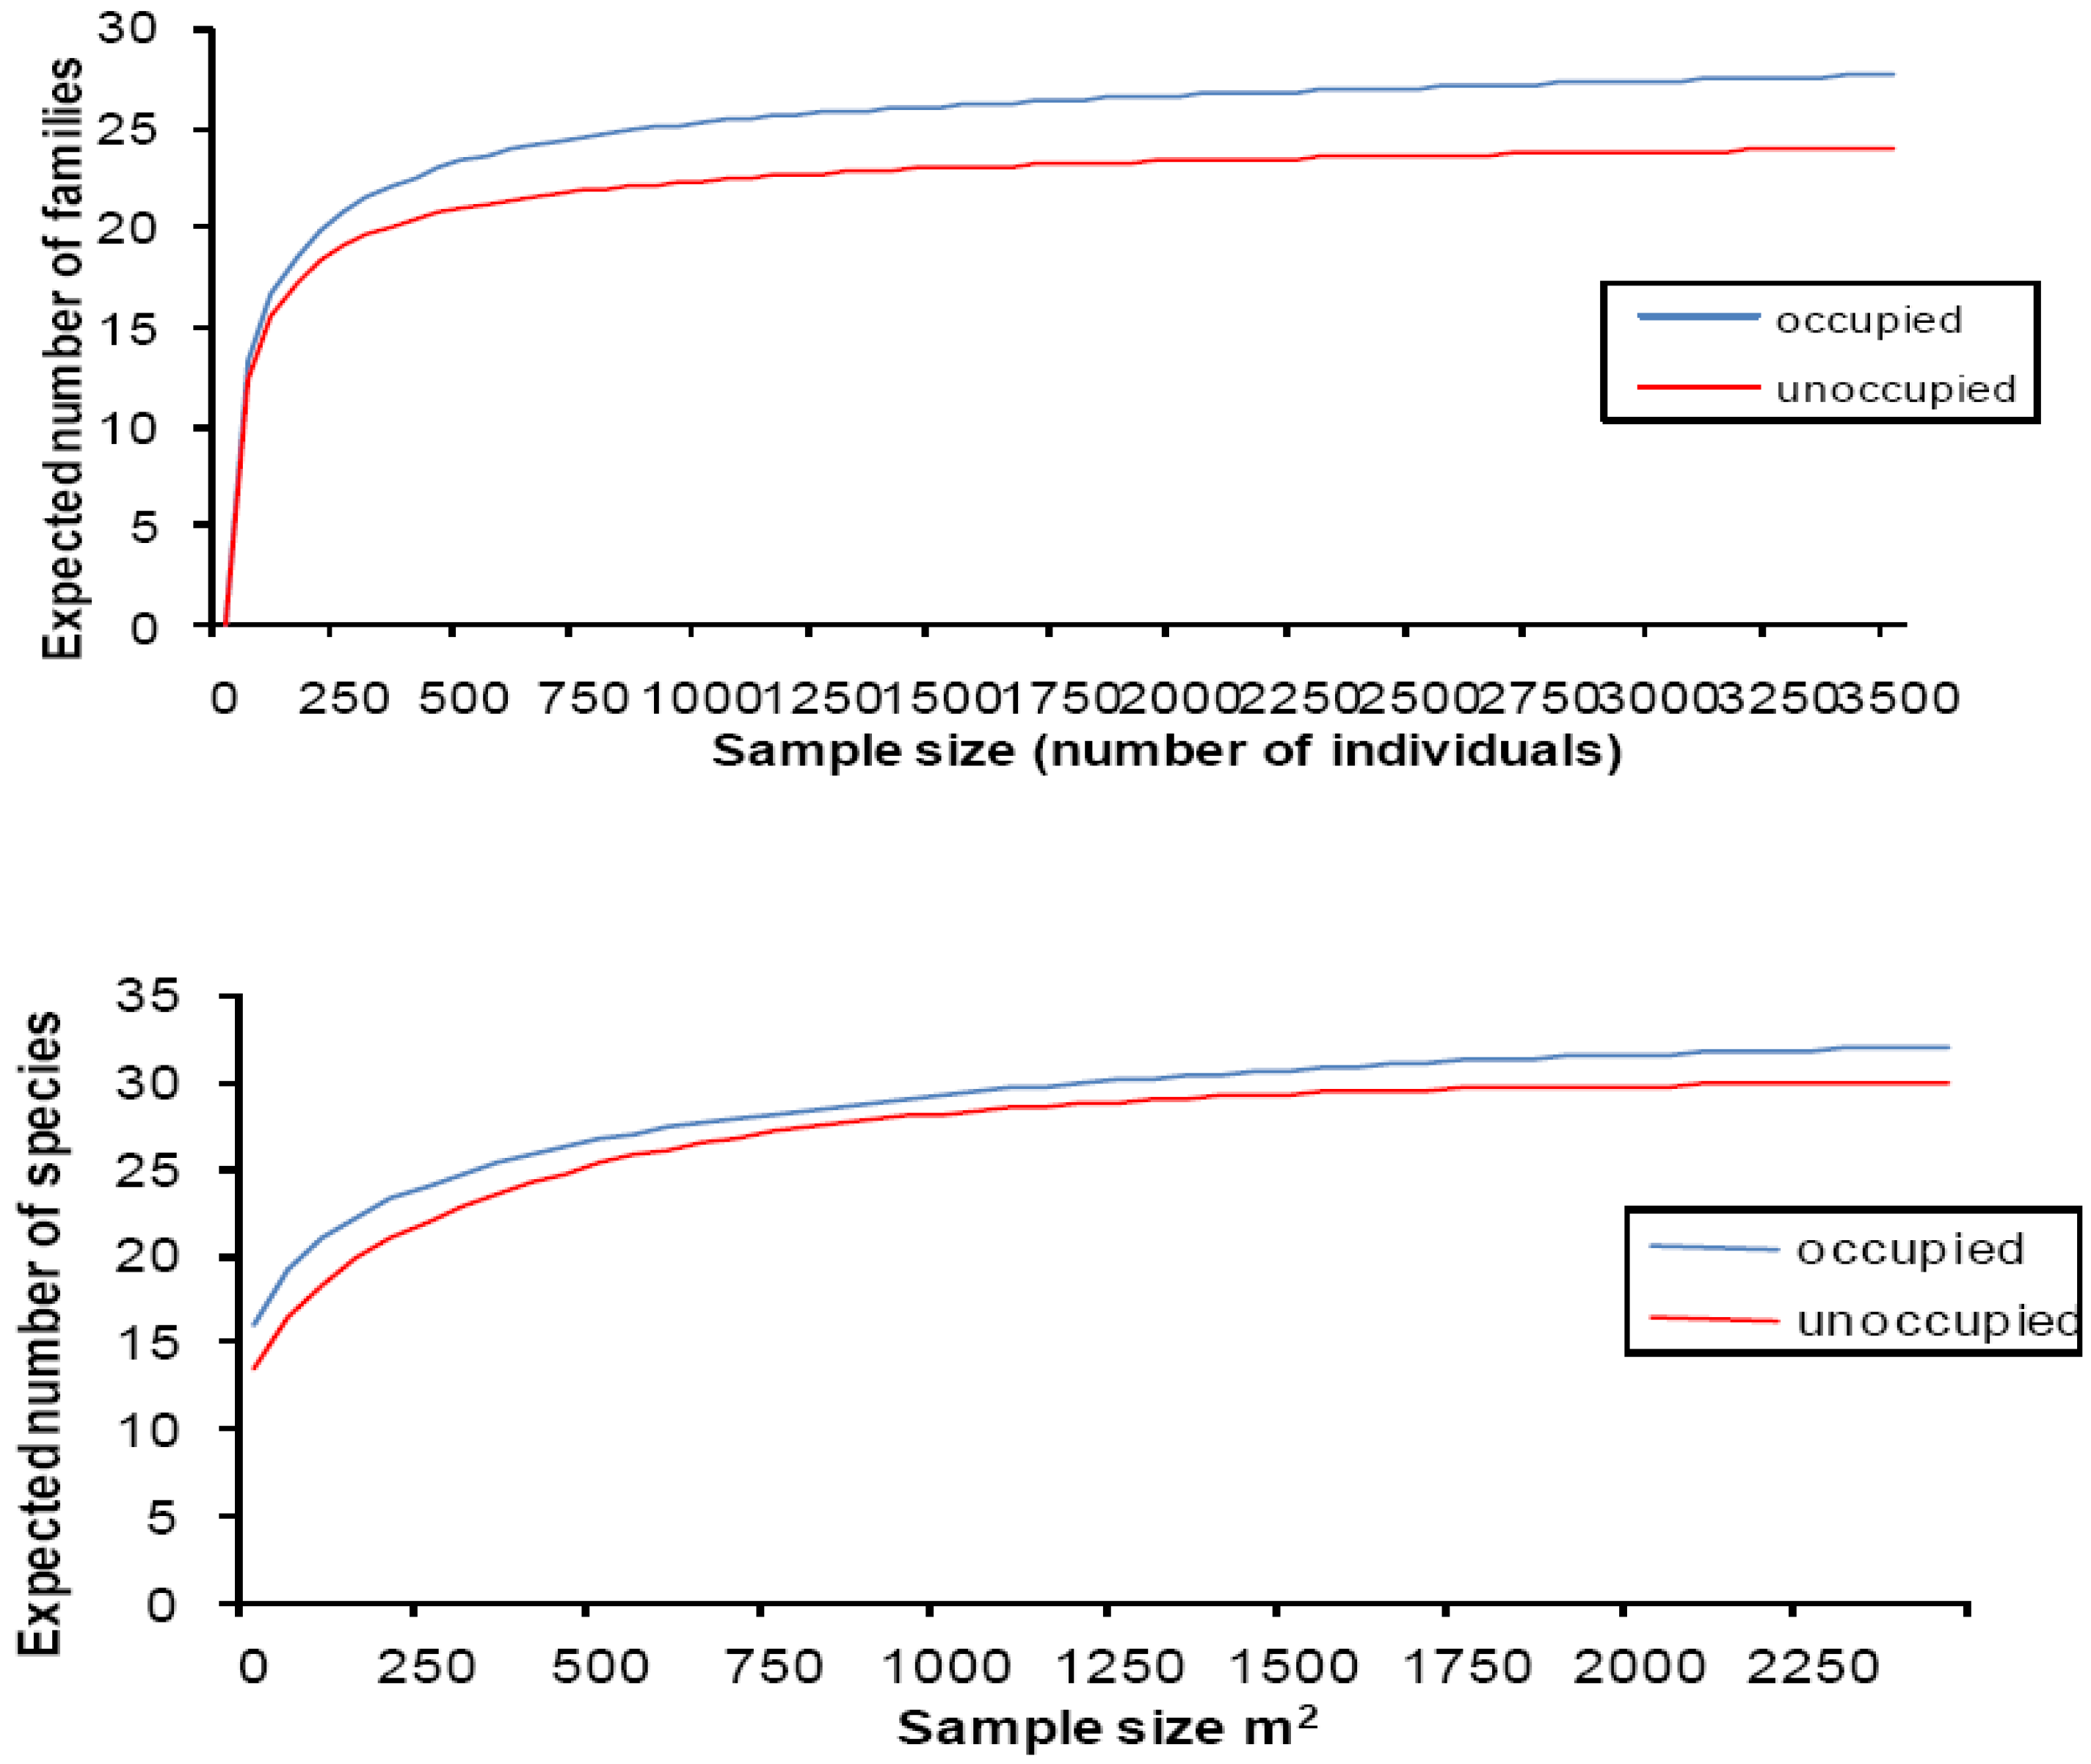
3.2. Relationship between Newts and Plant and Invertebrate Diversity

Great crested newts were found at 22 sites by night time surveys (i.e., trapping and torch counts), whilst netting added an additional site. The species was therefore located in 23 out of 74 sites. This gave a naïve (naïve in the sense that the species is assumed to only be present at sites where it was actually detected) occupation rate of 0.30, or 0.31 if the extra site revealed by netting is incorporated. Various models were tested in PRESENCE as part of a related study [65]. The most parsimonious model estimated occupancy at 0.32 (SE = 0.041). This suggests that the actual number of occupied ponds in the sample of 74 was 23.7 (SE = 3.03). As this is nearly identical to the naïve estimate of 23 occupied ponds, it was assumed that occupied and unoccupied ponds had been correctly identified.
At least one plant species was found in 58 out of the 65 ponds surveyed. In most cases, ponds without plants were in woods with dense shade and quantities of dead leaves in the water. Most ponds without aquatic plants were unoccupied by great crested newts, but one occupied pond was located. Of the 35 plant species examined, 21 species occurred in five or fewer ponds. Only two species occurred at more than 30 sites (Epilobium hirsutum and Juncus effusus). No species of plant appeared to show a particular association with either occupied or unoccupied ponds.
Individuals representing 28 families were located during the survey of aquatic macroinvertebrates. Up to 19 families were located in a single pond, although there was seasonal variation. Of the 28 families encountered, all were found during the summer survey of ponds occupied by great crested newts compared to 23 families in unoccupied ponds. The autumn survey located 22 families in occupied ponds and 21 in unoccupied ponds.
The most frequently encountered macroinvertebrate family was Asellidae (freshwater hog lice), with 2787 individuals encountered, 36.5% of the combined invertebrate sample. The second most frequently encountered family was Corixidae (water boatmen), with 861 individuals.
Table 2. Diversity of aquatic plants and macroinvertebrates in ponds with and without great crested newts.
Occupied ponds mean ± SDUnoccupied ponds mean ± SDANCOVA with pond area as a covariate
Aquatic plants
Number of species per pond6.9 ± 3.853.8 ± 3.11F 1, 62 = 19.22 ***
Percentage cover per pond45.2 ± 24.0025.6 ± 28.97 F 1, 62 = 0.05 NS
Shannon–Wiener function1.1 ± 0.670.67 ± 0.65F 1, 62 = 19.30 ***
Simpson's index0.54 ± 0.350.36 ± 0.36F 1, 62 = 12.82 ***
Macroinvertebrates
Number of families per pond12.6 ± 3.3611.6 ± 3.86F 1,24 = 0.04 NS
Individuals per pond276.8 ± 125.30287.7 ± 265.44F 1,24 = 0.002 NS
Shannon–Wiener function3.36 ± 0.883.05 ± 0.93F 1,24 = 0.04 NS
Simpson's index0.71 ± 0.120.67 ± 0.15F 1,24 = 0.026 NS
n = 65 (21 occupied and 44 unoccupied) for aquatic plant sample and 27 (13 occupied, 14 unoccupied) for macroinvertebrate sample. NS, *P > 0.05; **P < 0.01; ***P < 0.001. Levene’s test confirmed homogeneity of variances in all ANCOVAs.
The mean (±SD) areas of occupied and unoccupied ponds in the aquatic plant survey were 200.7 ± 212.93 m2 and 146.9 ± 224.94 m2 respectively, but the difference was not significant. (F1,63 = 0.841, P = 0.36). There was a correlation between pond area and the number of plant species recorded in the overall sample of occupied and unoccupied ponds combined (r = 0.49, df = 64, P = 0.001). The mean number of plant species per pond was significantly higher in occupied ponds than in unoccupied ponds (Table 2). Occupied ponds had a significantly greater percentage of aquatic plant cover than unoccupied ponds.
In the macroinvertebrate survey, the mean (±SD) area of occupied ponds (260.2 ± 250.26 m2) did not differ significantly from the mean area (349.9 ± 312.39 m2) of unoccupied ponds (F1, 25 = 0.673, P = 0.42). The increase in mean pond areas in both categories over the earlier aquatic plant survey was as a result of the drying of small ponds between the sampling periods. This had a greater effect on unoccupied than occupied ponds. There was no correlation between pond area and the number of macroinvertebrate families present (r = –0.60, df = 26, P = 0.77). Neither the number of macroinvertebrate families, nor the number of macroinvertebrate individuals, differed significantly between ponds with and without great crested newts (Table 2).
For both aquatic plants and macroinvertebrates, rarefaction curves for both occupied and unoccupied ponds levelled off at about 1,500 m2 and 1,500 individuals respectively (Figure 1). The combined sum of areas of plant cover at 2,463 m2 (occupied ponds) and 3,022 m2 (unoccupied ponds) was therefore adequate, as was the total sample of individual macroinvertebrates, comprising 3,598 individuals (occupied ponds) and 4,028 individuals (unoccupied ponds).
Figure 1. Rarefaction curves for macroinvertebrate families (above) and aquatic plant species (below) comparing ponds occupied or not occupied by great crested newts.
Diversity 01 00102 g001
When pond area was included as a covariate, comparisons using both the Shannon–Wiener function and Simpson’s Index revealed higher levels of aquatic plant heterogeneity in occupied than in unoccupied ponds (Table 2). In contrast, there were no differences between occupied and unoccupied ponds in terms of heterogeneity of macroinvertebrates using either the Shannon–Wiener function or Simpson’s index, even when pond area was included as a covariate (Table 2).
In summary, ponds containing great crested newts had significantly more aquatic plant species and plant cover than ponds where they were absent. Measures of plant diversity showed the same trend when pond area was included as a covariate. These patterns were not, however, repeated when macroinvertebrate diversity was examined.
As a typical temperate pond-breeding amphibian, does the great crested newt meet the characteristics of an indicator species? This will be examined in terms of the criteria laid down for indicator species shown in Table 1.
(1) The species should be easy and cost effective to observe, identify and monitor
Twenty-two occupied sites were located during the three night time surveys. The location of only one additional site by netting suggested that these three surveys were nearly sufficient to detect all populations of the species. Multiple surveys are therefore required. With the added caveat that most detection methods require night time fieldwork, and that detection rates for amphibians are variable [60,65,66,67,68] the species meets this requirement, as long as sufficient repeat surveys are incorporated.
(2) Patterns of species richness should be closely correlated with those of other, non-related groups
When only a single species has been examined, it is impossible to explore relationships between amphibian species richness and different, non-related groups. The species examined here does show a relationship with aquatic plant species richness, as has been noted by others [42], but this pattern is not repeated with macroinvertebrates. This difference between groups has been noted previously. An earlier study examined six taxa and only found significant relationships between woody plants and birds; Orthoptera and terrestrial herpetofauna; and birds with aquatic herpetofauna, with woody plants the best biodiversity indicator overall [70]. Another study found a lack of congruence between taxa, but shows that selecting priority forests on the basis of data on a single taxon also captures species richness in other groups with the same efficiency as using all studied taxa at once [13]. The great crested newt therefore only partially meets these requirements.
(3) The species should be sufficiently sensitive to provide early warning of change in the environment
As they respond rapidly to environmental change, arthropods may make good indicator species [11], although, conversely, others have suggested they make poor indicators for exactly the same reason [15]. Like many other amphibians, great crested newts, in contrast, are relatively long-lived, and breed repeatedly during their lives [71]. It is therefore possible that the species may persist at a site long after it has deteriorated, as a pond within our study area demonstrates. In 1994, good terrestrial habitat, comprising an orchard and rough grassland, adjacent to a pond was replaced by an arable field [47], whilst the area directly around the pond became increasingly shaded. Although conditions in both the terrestrial and aquatic phases of the newts’ annual cycle had deteriorated, the species declined slowly before extinction at the site in 2002 [65]. Great crested newts, and possibly other long-lived amphibians, do not, therefore, meet this criterion as they may be present in a pond for some years after deterioration in the environment has occurred. More generally, a recent study suggests that amphibians are no more sensitive to environmental contaminants than many other taxa [36], and are therefore unlikely to provide an early warning of change.
(4) Species should be capable of providing a continuous assessment over a wide range of stresses, including anthropogenic stresses
For both type (i) [9] and type (ii) [14] indicators, the use of multiple indicators is envisaged, indeed all the papers examined for indicator criteria considered the use of a suite of indicators to some extent. It is not necessary that all of these complementary indicators need be species [9]. This criterion applies when a number of indicators are being tested together, as it suggests that they should be chosen for complementarity in what they indicate rather than relatedness to each other. It has already been noted under item 2, above, that multiple indicators may be necessary, and that is again the case here.
(5) It should be possible to differentiate between the species’ responses to natural and anthropogenic stresses
As a species that is generally associated with medium to large farm ponds and those associated with mineral workings [72], many of the stresses suffered by great crested newts are anthropogenic, resulting from a lack of management of the pond and surrounding environment or other stresses, such as isolation of populations. These issues apply to many amphibian species, and natural population fluctuations coupled with complex synergies between different factors that regulate populations [28,73,74], may make disentangling natural and anthropogenic stressors problematical [75]. Although this was not tested in our study, great crested newts, as well as other amphibians that respond in complex ways to stressors, may therefore only partly meet this criterion.
(6) The species should be distributed over a broad geographical area, if the indicator is at family or higher level the distribution should ideally be worldwide
Within the UK, great crested newts are widely distributed in lowland areas, whilst European distribution extends to Russia [58]. The species therefore meets this requirement, which may make it useful as an indicator up to the European level. At a higher level, the Order Caudata, is absent from most of Africa, Australasia, and much of Asia and South America [72]. At these levels the Order does not meet the requirements of an indicator. Choices of indicator should therefore be appropriate to the scale of the biodiversity issue under consideration.
(7) It may be better to use a number of species rather than have just one indicator
The concept of using more than one species as an indicator has been made on numerous occasions in addition to the papers examined in this study (e.g., [76,77]). Although the utility of using multiple indicators is clear [9], it has also been argued that use of too many indicators can result in nothing being left to indicate [2]. Amongst the questions examined here, numbers 2, 4, and 6 have already shown the value of using more than one species in an indicator suite. Whether all additional indicators need to be species is debatable [9]. If the additional indicators are species, complementarity is probably more useful than relatedness, for example an invertebrate species showing a speedy reaction to environmental change would probably be more useful than another amphibian species with similar weaknesses as an indicator to great crested newts.
(8) The indicator should be relevant to ecologically significant phenomena
Great crested newts have been examined here in their aquatic phase. Ponds are important wildlife habitats, collectively rich in species and supporting populations of about half of the UK’s Red Data Book wetland plant and animal species [78]. Ponds have a biodiversity value probably higher than any other aquatic habitat in the UK [79]. However, great crested newts have particular aquatic habitat preferences, including pond area and permanence [59]. Other studies [60,80,81] have shown that ponds of varying sizes and permanence all have strong conservation value. The presence of a single species with a comparatively narrow range of habitat preferences therefore only indicates a subset of pond diversity. The protection of the species throughout its range is therefore valuable to a wide range of other species, but not the entire range of pond biodiversity. Whether this implies that the species is valuable as an indicator or as an umbrella [3] is more debatable.

4. Conclusions

In Table 1, criteria 1, 2, 6, 7, and 8 were applied to type (i) indicators, whilst 1, 3, 4, 5, 6, 7 and 8 were applied to type (ii) indicators. Great crested newts—and probably many other amphibian species—fail to meet several of these criteria. It is difficult to meet either criterion 2 or 4 with a single species in isolation, as both envisage the use of multiple species. Like other long-lived amphibians, great crested newts may respond relatively slowly to changes in the environment, and therefore fail criterion 3. The wide and complex variation in amphibian population sizes means that it is difficult to separate natural and anthropogenic stresses (criterion 5) in many species. The species examined here may well be a typical example. Based on existing knowledge of amphibians, it appears that few, if any, species could adequately meet all criteria for either type (i) or (ii) indicators.
We therefore agree with a number of other studies [9,21,82], that multiple indicators should be used, and would choose these on the basis of complementarity rather than relatedness. The use of the term ‘indicator species’ may therefore be misleading when a single amphibian species is used in isolation, but may have more merit when used in combination with other taxa. Indeed, it is notable that of the eight criteria examined, the use of multiple indicators was the only one common to all seven papers (Table 1). We therefore find little support for the concept of a single species as an indicator. Despite the number of papers being published quoting a single species as a type (ii) indicator of some form of environmental change, we suggest that suites of indicators are essential for both uses. For type (i) indicators the situation is slightly better as most recent papers either suggest use of multiple species from a single taxon [16,17,19] or species from a number of taxa [20,21]. Particularly intriguing is the discovery that not only do indicator taxa with a high number of species tend to perform better than taxa with few, but that indicator groups drawn across a range of taxa tended to perform better than those of similar size drawn from a single taxon. This suggests that some taxa previously highlighted as good indicators might have appeared so simply because they were species rich, rather than having good indicator qualities per se [82].
Confusion in terminology has also arisen as a result of a schism in the interpretation of what an indicator species is between policy makers and scientists. A key criterion of an indicator in policymaking is that it is relevant both to policymaking itself and to management practice [16,17,83]. Those working in the area appear to find the use of large-scale indicator suites effective, but there are increasing calls from policy makers for a single biodiversity indicator, presenting clear messages for the general public [17]. We find the term less confusing when the qualifier ‘headline indicator’ [17] is used, but as yet this is rarely the case in general usage. The general use of the term ‘indicators’ or ‘indicator species’ by statutory bodies, conservation agencies, and funding campaigns is therefore often poorly defined. For example, this broad interpretation of ‘indicator species’ is used in the UK Biodiversity Action Plan, and by UK government departments [84,85,86,87]. In a case from the USA, emphasising amphibians as ‘indicators’ of environmental health gained government funding for amphibian conservation [88]. Such usage contrasts with the strict ecological criteria demanded of indicators by scientists when referring to type (i) and (ii) indicators (Table 1). Indeed, scientists view those species that primarily serve strategic, as opposed to ecological, functions as ‘flagships’ rather than indicators [1,2,3]. The schism is occasionally breached when the strategic use of the term permeates the scientific literature, without the use of qualifying terms (e.g., ‘headline’), propagating confusion and debate. Improved communication between conservation scientists and practitioners is needed if a consensus is to be achieved. Until then we advise against the advocacy of amphibians, or any other taxon, as indicator species unless the appropriate ecological criteria are tested, or strategic indicators are explicitly defined.

Acknowledgements

We would like to thank the many landowners who allowed access to their ponds. All surveys were carried out under the terms of a licence granted by English Nature (now Natural England). We would also like to thank three anonymous referees for their helpful suggestions, which have improved the paper.

References

  1. Caro, T.M.; O’Doherty, G. On the use of surrogate species in conservation biology. Conserv. Biol. 1999, 13, 805–814. [Google Scholar] [CrossRef]
  2. Simberloff, D. Flagships, umbrellas and keystones: is single species management passé in the landscape era? Biol. Conserv. 1998, 83, 247–257. [Google Scholar] [CrossRef]
  3. Leader-Williams, N.; Dublin, H.T. Charismatic megafauna as ‘flagship species’. In Priorities for the Conservation of Mammalian Diversity: Has the Panda had its Day? Entwistle, A., Dunstone, N., Eds.; Cambridge University Press: Cambridge, UK, 2000; pp. 53–81. [Google Scholar]
  4. Akutsu, K.; Khen, C.V.; Toda, M.J. Assessment of higher insect taxa as bioindicators for different logging-disturbance regimes in lowland tropical rain forest in Sabah, Malaysia. Ecol. Res. 2007, 22, 542–550. [Google Scholar] [CrossRef]
  5. Espinosa, F.; Guerra-Garcia, J.M.; Garcia-Gomez, J.C. Sewage pollution and extinction risk: an endangered limpet as a bioindicator? Biodivers. Conserv. 2007, 16, 377–397. [Google Scholar] [CrossRef]
  6. Limaverde, A.M.; Wagener, A.D.L.R.; Fernandez, M.A.; Schofield, A.D.L.; Coutinho, R. Stramonita haemastoma as a bioindicator for organotin contamination in coastal environments. Mar. Environ. Res. 2007, 64, 384–398. [Google Scholar] [CrossRef]
  7. Moganti, S.; Richardson, B.J.; McClellan, K.; Martin, M.; Lam, P.K.S.; Zheng, G.J. Use of the clam Asaphis deflorata as a potential indicator of organochlorine bioaccumulation in Hong Kong coastal sediments. Mar. Pollut. Bull. 2008, 57, 672–680. [Google Scholar] [CrossRef]
  8. Ugolini, A.; Ungherese, G.; Somigli, S.; Galanti, G.; Baroni, D.; Borghini, F.; Cipriani, N.; Nebbiai, M.; Passaponti, M.; Focardi, S. The amphipod Talitrus saltator as a bioindicator of human trampling on sandy beaches. Mar. Environ. Res. 2008, 65, 349–357. [Google Scholar] [CrossRef]
  9. Noss, R.F. Indicators for monitoring biodiversity: a hierarchical approach. Conserv. Biol. 1990, 4, 355–364. [Google Scholar] [CrossRef]
  10. Pearson, D.L.; Cassola, F. World-wide species richness patterns of tiger beetles (Coleoptera: Cicindelidae): indicator taxon for biodiversity and conservation studies. Conserv. Biol. 1992, 6, 376–391. [Google Scholar]
  11. Kremen, C.; Colwell, R.K.; Erwin, T.L.; Murphy, D.D.; Noss, R.F.; Sanjayan, M.A. Terrestrial arthropod assemblages: their use in conservation planning. Conserv. Biol. 1993, 7, 794–808. [Google Scholar]
  12. Brooks, R.P.; O’Connell, T.J.; Wardrop, D.H.; Jackson, L.E. Towards a regional index of biological integrity: the example of forested riparian ecosystems. Environ. Monit. Assess. 1998, 51, 131–143. [Google Scholar] [CrossRef]
  13. Howard, P.C.; Viscanic, P.; Davenport, T.R.B.; Kigenyi, F.W.; Baltzer, M.; Dickinson, C.J.; Lwanga, J.S.; Matthews, R.A.; Balmford, A. Complementarity and the use of indicator groups for reserve selection in Uganda. Nature 1998, 394, 472–475. [Google Scholar] [CrossRef]
  14. Dale, V.H.; Beyeler, S.C. Changes in the development and use of ecological indicators. Ecol. Indic. 2001, 1, 3–10. [Google Scholar] [CrossRef]
  15. Fleishman, E.; Murphy, D.D. A realistic assessment of the Indicator potential of butterflies and other charismatic taxonomic groups. Conserv. Biol. 2009, 23, 1109–1116. [Google Scholar] [CrossRef]
  16. Gregory, R.D.; van Strien, A.; Vorisek, P.; Gmelig Meyling, A.W.; Noble, D.G.; Foppen, R.P.B.; Gibbons, D.W. Developing indicators for European birds. Phil. Trans. R. Soc. B. 2005, 360, 269–288. [Google Scholar] [CrossRef]
  17. Gregory, R.D.; Vořišek, P.; Noble, D.G.; van Strien, A.; Klvaňová, A.; Eaton, M.; Gmelig Meyling, A.W.; Joys, A.; Foppen, R.P.B.; Burfield, I.J. The generation and use of bird population indicators in Europe. Bird Conserv. Int. 2008, 18, S223–S244. [Google Scholar]
  18. Grenyer, R.; Orme, C.D.L.; Jackson, S.F.; Thomas, G.H.; Davies, R.G.; Davies, T.J.; Jones, K.E.; Olson, V.A.; Ridgely, R.S.; Rasmussen, P.C.; Ding, T.S.; Bennett, P.M.; Blackburn, T.M.; Gaston, K.J.; Gittleman, J.L.; Owens, I.P.F. Global distribution and conservation of rare and threatened vertebrates. Nature 2006, 444, 93–96. [Google Scholar] [CrossRef]
  19. Sebastiăo, H.; Grelle, C.E.V. Taxon surrogates among Amazonian mammals: Can total species richness be predicted by single orders? Ecol. Indic. 2009, 9, 160–166. [Google Scholar] [CrossRef]
  20. Loyola, R.D.; Kubota, U.; Lewinsohn, T.M. Endemic vertebrates are the most effective surrogates for identifying conservation priorities among Brazilian ecoregions. Diversity Distrib. 2007, 13, 389–396. [Google Scholar] [CrossRef]
  21. Franco, A.M.A.; Anderson, B.J.; Roy, D.B.; Gillings, S.; Fox, R.; Moilanen, A.; Thomas, C.D. Surrogacy and persistence in reserve selection: landscape prioritization for multiple taxa in Britain. J. Appl. Ecol. 2009, 46, 82–91. [Google Scholar] [CrossRef]
  22. Smith, G.F.; Gittings, T.; Wilson, M.; French, L.; Oxbrough, A.; O’Donoghue, S.; O’Halloran, J.; Kelly, D.L.; Mitchell, F.J.G.; Kelly, T.; Iremonger, S.; McKee, A.-M.; Giller, P. Identifying practical indicators of biodiversity for stand-level management of plantation forests. Biodivers. Conserv. 2008, 17, 991–1015. [Google Scholar] [CrossRef]
  23. Blaustein, A.R.; Wake, D.B. Declining amphibian populations: a global phenomenon. Trends Ecol. Evol. 1990, 5, 203–204. [Google Scholar] [CrossRef]
  24. Wyman, R.L. What’s happening to the amphibians? Conserv. Biol. 1990, 4, 350–352. [Google Scholar] [CrossRef]
  25. Lips, K.R. Decline of a tropical montane amphibian fauna. Conserv. Biol. 1998, 12, 106–112. [Google Scholar] [CrossRef]
  26. Vitt, L.J.; Caldwell, J.P.; Wilbur, H.M.; Smith, D.C. Amphibians as harbingers of decay. Bioscience 1990, 40, 417. [Google Scholar]
  27. Wake, D.B. Declining amphibian populations. Science 1991, 253, 860. [Google Scholar] [CrossRef]
  28. Collins, J.P.; Storfer, A. Global amphibian declines: sorting the hypotheses. Divers. Distrib. 2003, 9, 89–98. [Google Scholar] [CrossRef]
  29. Storfer, A. Amphibian declines: future directions. Divers. Distrib. 2003, 9, 151–163. [Google Scholar] [CrossRef]
  30. Blaustein, A.R.; Romansic, J.M.; Kiesecker, J.M.; Hatch, A.C. Ultraviolet radiation, toxic chemicals and amphibian population declines. Divers. Distrib. 2003, 9, 123–140. [Google Scholar] [CrossRef]
  31. Gascon, C.; Collins, J.P.; Moore, R.D.; Church, D.R.; McKay, J.E.; Mendelson, J.R., III (Eds.) Amphibian Conservation Action Plan; IUCN/SSC Amphibian Specialist Group: Gland, Switzerland, 2008; pp. 17–19.
  32. Pechmann, J.H.K.; Wilbur, H.M. Putting declining amphibian populations in perspective: natural fluctuations and human impacts. Herpetologica 1994, 50, 65–84. [Google Scholar]
  33. Halliday, T. Do frogs make good canaries? Biologist 2000, 47, 143–146. [Google Scholar]
  34. Relyea, R.A.; Schoeppner, N.M.; Hoverman, J.T. Pesticides and amphibians: The importance of community context. Ecol. Appl. 2005, 15, 1125–1134. [Google Scholar] [CrossRef]
  35. Relyea, R.A. A cocktail of contaminants: how mixtures of pesticides at low concentrations affect aquatic communities. Oecologia 2009, 159, 363–376. [Google Scholar] [CrossRef]
  36. Kerby, J.L.; Richards-Hrdlicka, K.L.; Storfer, A.; Skelly, D.K. An examination of amphibian sensitivity to environmental contaminants: are amphibians poor canaries? Ecol. Lett. 2009, 12, 1–8. [Google Scholar]
  37. Beebee, T.J.C.; Griffiths, R.A. The amphibian decline crisis: A watershed for conservation biology? Biol. Conserv. 2005, 125, 271–285. [Google Scholar] [CrossRef]
  38. DeGarady, C.J.; Halbrook, R.S. Using anurans as bioindicators of PCB contaminated streams. J. Herpetol. 2006, 40, 127–130. [Google Scholar] [CrossRef]
  39. Lebboroni, M.; Ricchiardino, G.; Bellavita, M.; Chelazzi, G. Potential use of anurans as indicators of biological quality in upstreams of central Italy. Amphibia-Reptilia 2006, 27, 73–79. [Google Scholar] [CrossRef]
  40. Capaldo, A.; Gay, F.; DeFalco, M.; Virgilio, F.; Valiante, S.; Laforgia, V.; Varano, L. The newt Triturus carnifex as a model for monitoring the ecotoxic impact of the fungicide thiophanate methyl: adverse effects on the adrenal gland. Comp. Biochem. Phys. C 2006, 143, 86–93. [Google Scholar]
  41. Maletzky, A.; Kyek, M.; Goldschmid, A. Monitoring status, habitat features and amphibian species richness of Crested newt (Triturus cristatus superspecies) ponds at the edge of the species range (Salzburg, Austria). Ann. Limnol. Int. J. Lim. 2007, 43, 107–115. [Google Scholar] [CrossRef]
  42. Gustafson, D.H.; Pettersson, C.J.; Malmgren, J.C. Great crested newts (Triturus cristatus) as indicators of aquatic plant diversity. Herpetol. J. 2007, 16, 347–352. [Google Scholar]
  43. Corbett, K. European perspective and status. In Conservation and Management of Great Crested Newts, Proceedings of a Symposium, Kew Gardens, Richmond, Surrey, 11 January 1994; Gent, A., Bray, R., Eds.; English Nature: Peterborough, UK, 1994; pp. 7–17. [Google Scholar]
  44. Wildcare. Farm Wildlife Habitat Scheme. Available online: http://www.wildcare.co.uk/species.asp?navid=3 (accessed 22 June 2009).
  45. Jehle, R. The terrestrial summer habitat of radio-tracked great crested newts (Triturus cristatus) and marbled newts (T. mamoratus). Herpetol. J. 2000, 10, 137–142. [Google Scholar]
  46. Waddle, J.H. Use of Amphibians as Ecosystem Indicator Species. PhD thesis, University of Florida, Gainesville, FL, USA, 2006. [Google Scholar]
  47. Williams, C. Metapopulation Dynamics of the Crested Newt (Triturus cristatus). PhD thesis, University of Kent, Canterbury, UK, 1999. [Google Scholar]
  48. Griffiths, R.A. A simple funnel trap for studying newt populations and an evaluation of trap behaviour in smooth and palmate newts, Triturus vulgaris and T. helveticus. Herpetol. J. 1985, 1, 5–10. [Google Scholar]
  49. Griffiths, R.A.; Raper, S.J.; Brady, L.D. Evaluation of a Standard Method for Surveying Common Frogs Rana temporaria and Newts Triturus cristatus, T. helveticus and T. vulgaris; JNCC Report no. 259; Joint Nature Conservation Committee: Peterborough, UK, 1996. [Google Scholar]
  50. Biggs, J.; Fox, G.; Nicolet, P.; Walker, D.; Whitfield, M.; Williams, P. A Guide to the Methods of the National Pond Survey; Pond Action: Oxford, UK, 1998. [Google Scholar]
  51. Bursche, E.M. A Handbook of Water Plants; Frederick Warne & Co.: London, UK, 1971; pp. 1–126. [Google Scholar]
  52. Fitter, R.; Fitter, A.; Blamey, M. The Wild Flowers of Britain and Northern Europe, 3rd ed.; Collins: London, UK, 1978. [Google Scholar]
  53. Preston, C.D.; Croft, J.M. Aquatic Plants in Britain and Ireland; Harley Books: Colchester, UK, 1997. [Google Scholar]
  54. Philp, E.G. Atlas of the Kent Flora; Kent Field Club: West Malling, UK, 1982. [Google Scholar]
  55. Croft, P.S. A Key to the Major Groups of British Freshwater Invertebrates; Field Studies Council: Preston Montford, UK, 1986. [Google Scholar]
  56. Olsen, L.-H.; Sunesen, J.; Pedersen, B.V. Small Freshwater Creatures; Oxford University Press: Oxford, UK, 2001. [Google Scholar]
  57. Henderson, P.A. Practical Methods in Ecology; Blackwell Science: Malden, MA, USA, 2003; pp. 126–128. [Google Scholar]
  58. Beebee, T.J.C.; Griffiths, R.A. Amphibians and Reptiles; Harper Collins: London, UK, 2000; pp. 63–72. [Google Scholar]
  59. Oldham, R.S.; Keeble, J.; Swan, M.J.S.; Jeffcote, M. Evaluating the suitability of habitat for the great crested newt (Triturus cristatus). Herpetol. J. 2000, 10, 143–155. [Google Scholar]
  60. Oertli, B.; Joye, D.A.; Castella, E.; Juge, R.; Cambin, D.; Lachavanne, J.-B. Does size matter? The relationship between pond area and biodiversity. Biol. Conserv. 2002, 104, 59–70. [Google Scholar] [CrossRef]
  61. MacKenzie, D.I.; Nichols, J.D.; Lachman, G.B.; Droege, S.; Royle, J.A.; Langtim, C.A. Estimating site occupancy rates when detection probabilities are less than one. Ecology 2002, 83, 2248–2255. [Google Scholar] [CrossRef]
  62. Sanders, H.L. Marine benthic diversity: a comparative study. Am. Nat. 1968, 102, 243–282. [Google Scholar]
  63. Hurlbert, S.H. The non-concept of species diversity: a critique and alternative parameters. Ecology 1971, 52, 577–586. [Google Scholar] [CrossRef]
  64. Simberloff, D.S. Properties of the rarefaction diversity measurement. Am. Nat. 1972, 106, 414–418. [Google Scholar]
  65. Sewell, D.L. Great Crested Newts (Triturus cristatus) as Indicators of Pond Biodiversity. PhD thesis, University of Kent, Canterbury, UK, 2006. [Google Scholar]
  66. MacKenzie, D.I.; Nichols, J.D.; Hines, J.E.; Knutson, M.G.; Franklin, A.B. Estimating site occupancy, colonization, and local extinction when a species is detected imperfectly. Ecology 2003, 84, 2200–2207. [Google Scholar] [CrossRef]
  67. Schmidt, B.R. Count data, detection probabilities, and the demography, dynamics, distribution and declines of amphibians. C. R. Biol. 2003, 326, S119–S124. [Google Scholar] [CrossRef]
  68. Schmidt, B.R. Declining amphibian populations: the pitfalls of count data in the study of diversity, distributions, dynamics and demography. Herpetol. J. 2004, 14, 167–174. [Google Scholar]
  69. Schmidt, B.R. Monitoring the distribution of pond-breeding amphibians when species are detected imperfectly. Aquat. Conserv. 2005, 15, 681–692. [Google Scholar] [CrossRef]
  70. Kati, V.; DeVilliers, P.; Dufrêne, M.; Legakis, A.; Vokou, D.; Lebrun, P. Testing the value of six taxonomic groups as biodiversity indicators at a local scale. Conserv. Biol. 2004, 18, 667–675. [Google Scholar] [CrossRef]
  71. Francillon-Vieillot, H.; Arntzen, J.W.; Geraudie, J. Age, growth and longevity of sympatric Triturus cristatus, T. mamoratus and their hybrids (Amphibia: Urodela): a skeletochronological comparison. J. Herpetol. 1990, 24, 13–22. [Google Scholar] [CrossRef]
  72. Griffiths, R.A. Newts and Salamanders of Europe; Academic Press: San Diego, CA, USA, 1996; pp. 143–144. [Google Scholar]
  73. Marsh, D.M. Fluctuations in amphibian populations: a meta-analysis. Biol. Conserv. 2001, 101, 327–335. [Google Scholar] [CrossRef]
  74. Green, D.M. The ecology of extinction: population fluctuation and decline in amphibians. Biol. Conserv. 2003, 111, 331–343. [Google Scholar] [CrossRef]
  75. Pechmann, J.H.K.; Scott, D.E.; Semlitsch, R.D.; Caldwell, J.P.; Vitt, L.J.; Gibbons, J.W. Declining amphibian populations—the problem of separating human impacts from natural fluctuations. Science 1991, 253, 892–895. [Google Scholar] [CrossRef]
  76. Lambeck, R.J. Focal species: a multi-species umbrella for nature conservation. Conserv. Biol. 1997, 11, 849–856. [Google Scholar]
  77. Lindenmayer, D.B.; Margules, C.R.; Botkin, D.B. Indicators of biodiversity for ecologically sustainable forest management. Conserv. Biol. 2000, 14, 941–950. [Google Scholar] [CrossRef]
  78. Biggs, J.; Williams, P.J.; Corfield, A.; Whitfield, M.A.; Barr, C.J.; Cummins, C.P. Pond Survey 1996 Stage 1 Scoping Survey; Pond Action: Oxford, UK, 1996. [Google Scholar]
  79. Environment Agency. The National Pond Monitoring Network, a Strategy for Pond Monitoring, Surveillance and Inventory Development; Ponds Conservation Trust: Oxford, UK, 2003. [Google Scholar]
  80. Collinson, N.H.; Biggs, J.; Corfield, A.; Hodson, M.J.; Walker, D.; Whitfield, M.; Williams, P.J. Temporary and permanent ponds: An assessment of the effects of drying out on the conservation value of aquatic macroinvertebrate communities. Biol. Conserv. 1995, 74, 125–133. [Google Scholar] [CrossRef]
  81. Bazzanti, M.; Della Bella, V.; Seminara, M. Factors affecting macroinvertebrate communities in astatic ponds in central Italy. J. Freshwater Ecol. 2003, 18, 537–548. [Google Scholar] [CrossRef]
  82. Larsen, F.W.; Bladt, J.; Rahbek, C. Indicator taxa revisited: useful for conservation planning? Diversity Distrib. 2009, 15, 70–79. [Google Scholar] [CrossRef]
  83. Everard, M. Selection of taxa as indicators of river and freshwater wetland quality in the U.K. Aquat. Conserv. 2008, 18, 1052–1061. [Google Scholar] [CrossRef]
  84. DETR. Indicators of Sustainable Development: Quality of Life Counts; Department of Environment, Transport and the Regions: London, UK, 1999.
  85. Department of the Environment, Food and Rural Affairs (Defra). Working with the Grain of Nature: a Biodiversity Strategy for England; Defra Publications: London, UK, 2002.
  86. Department of the Environment, Food and Rural Affairs (Defra). The UK Biodiversity Action Plan: Highlights from the 2005 Reporting Round; Defra Publications: London, UK, 2006. [Google Scholar]
  87. UK Biodiversity Partnership. A Biodiversity Strategy for England–Part Two: Indicators. Draft report. 2003. Available online: http://www.ukbap.org.uk/ebg/library/ebg/ebg-03-01.pdf (accessed 29 July, 2009).
  88. Gibbons, D.W. Societal values and attitudes: Their history and sociological influences on amphibian conservation problems. In Amphibian Conservation; Semlitsch, R.D., Ed.; Smithsonian Institution Press: Washington, DC, USA, 2003; pp. 214–222. [Google Scholar]

