Better Resilient than Resistant—Regeneration Dynamics of Storm-Disturbed Mangrove Forests on the Bay Island of Guanaja (Honduras) during the First Two Decades after Hurricane Mitch (October 1998)


Abstract
:
1. Introduction
2. Materials and Methods
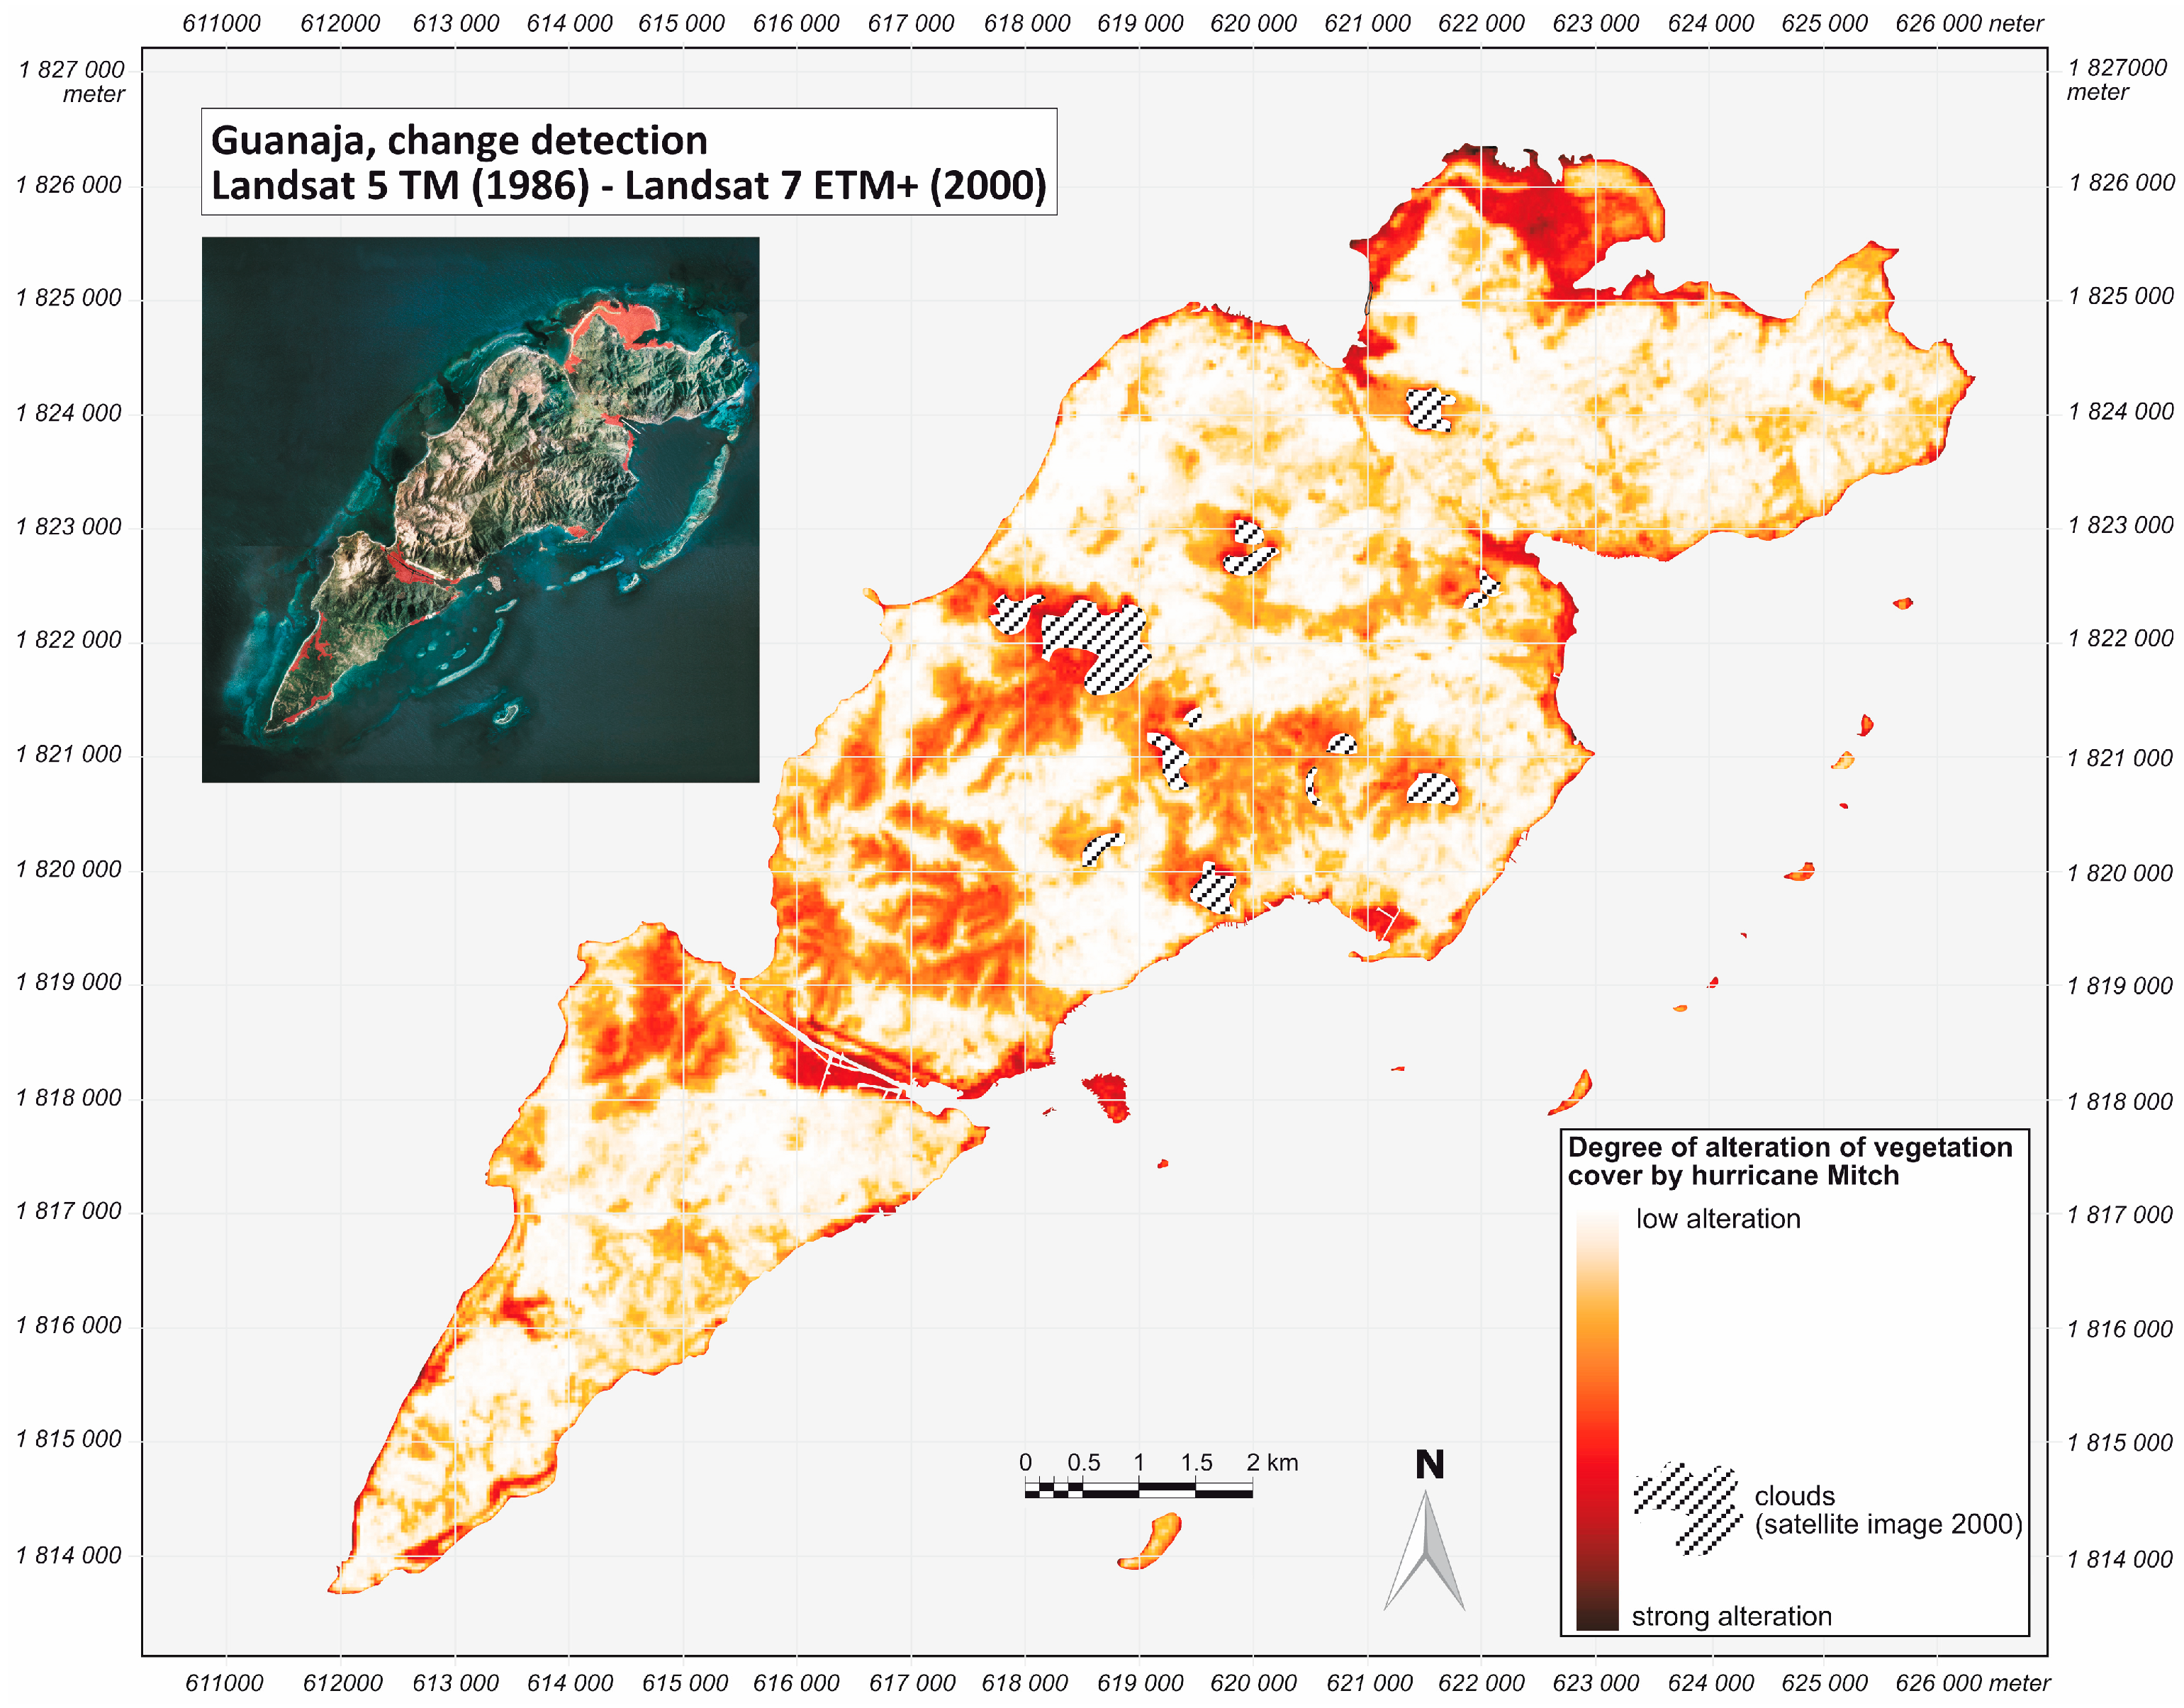
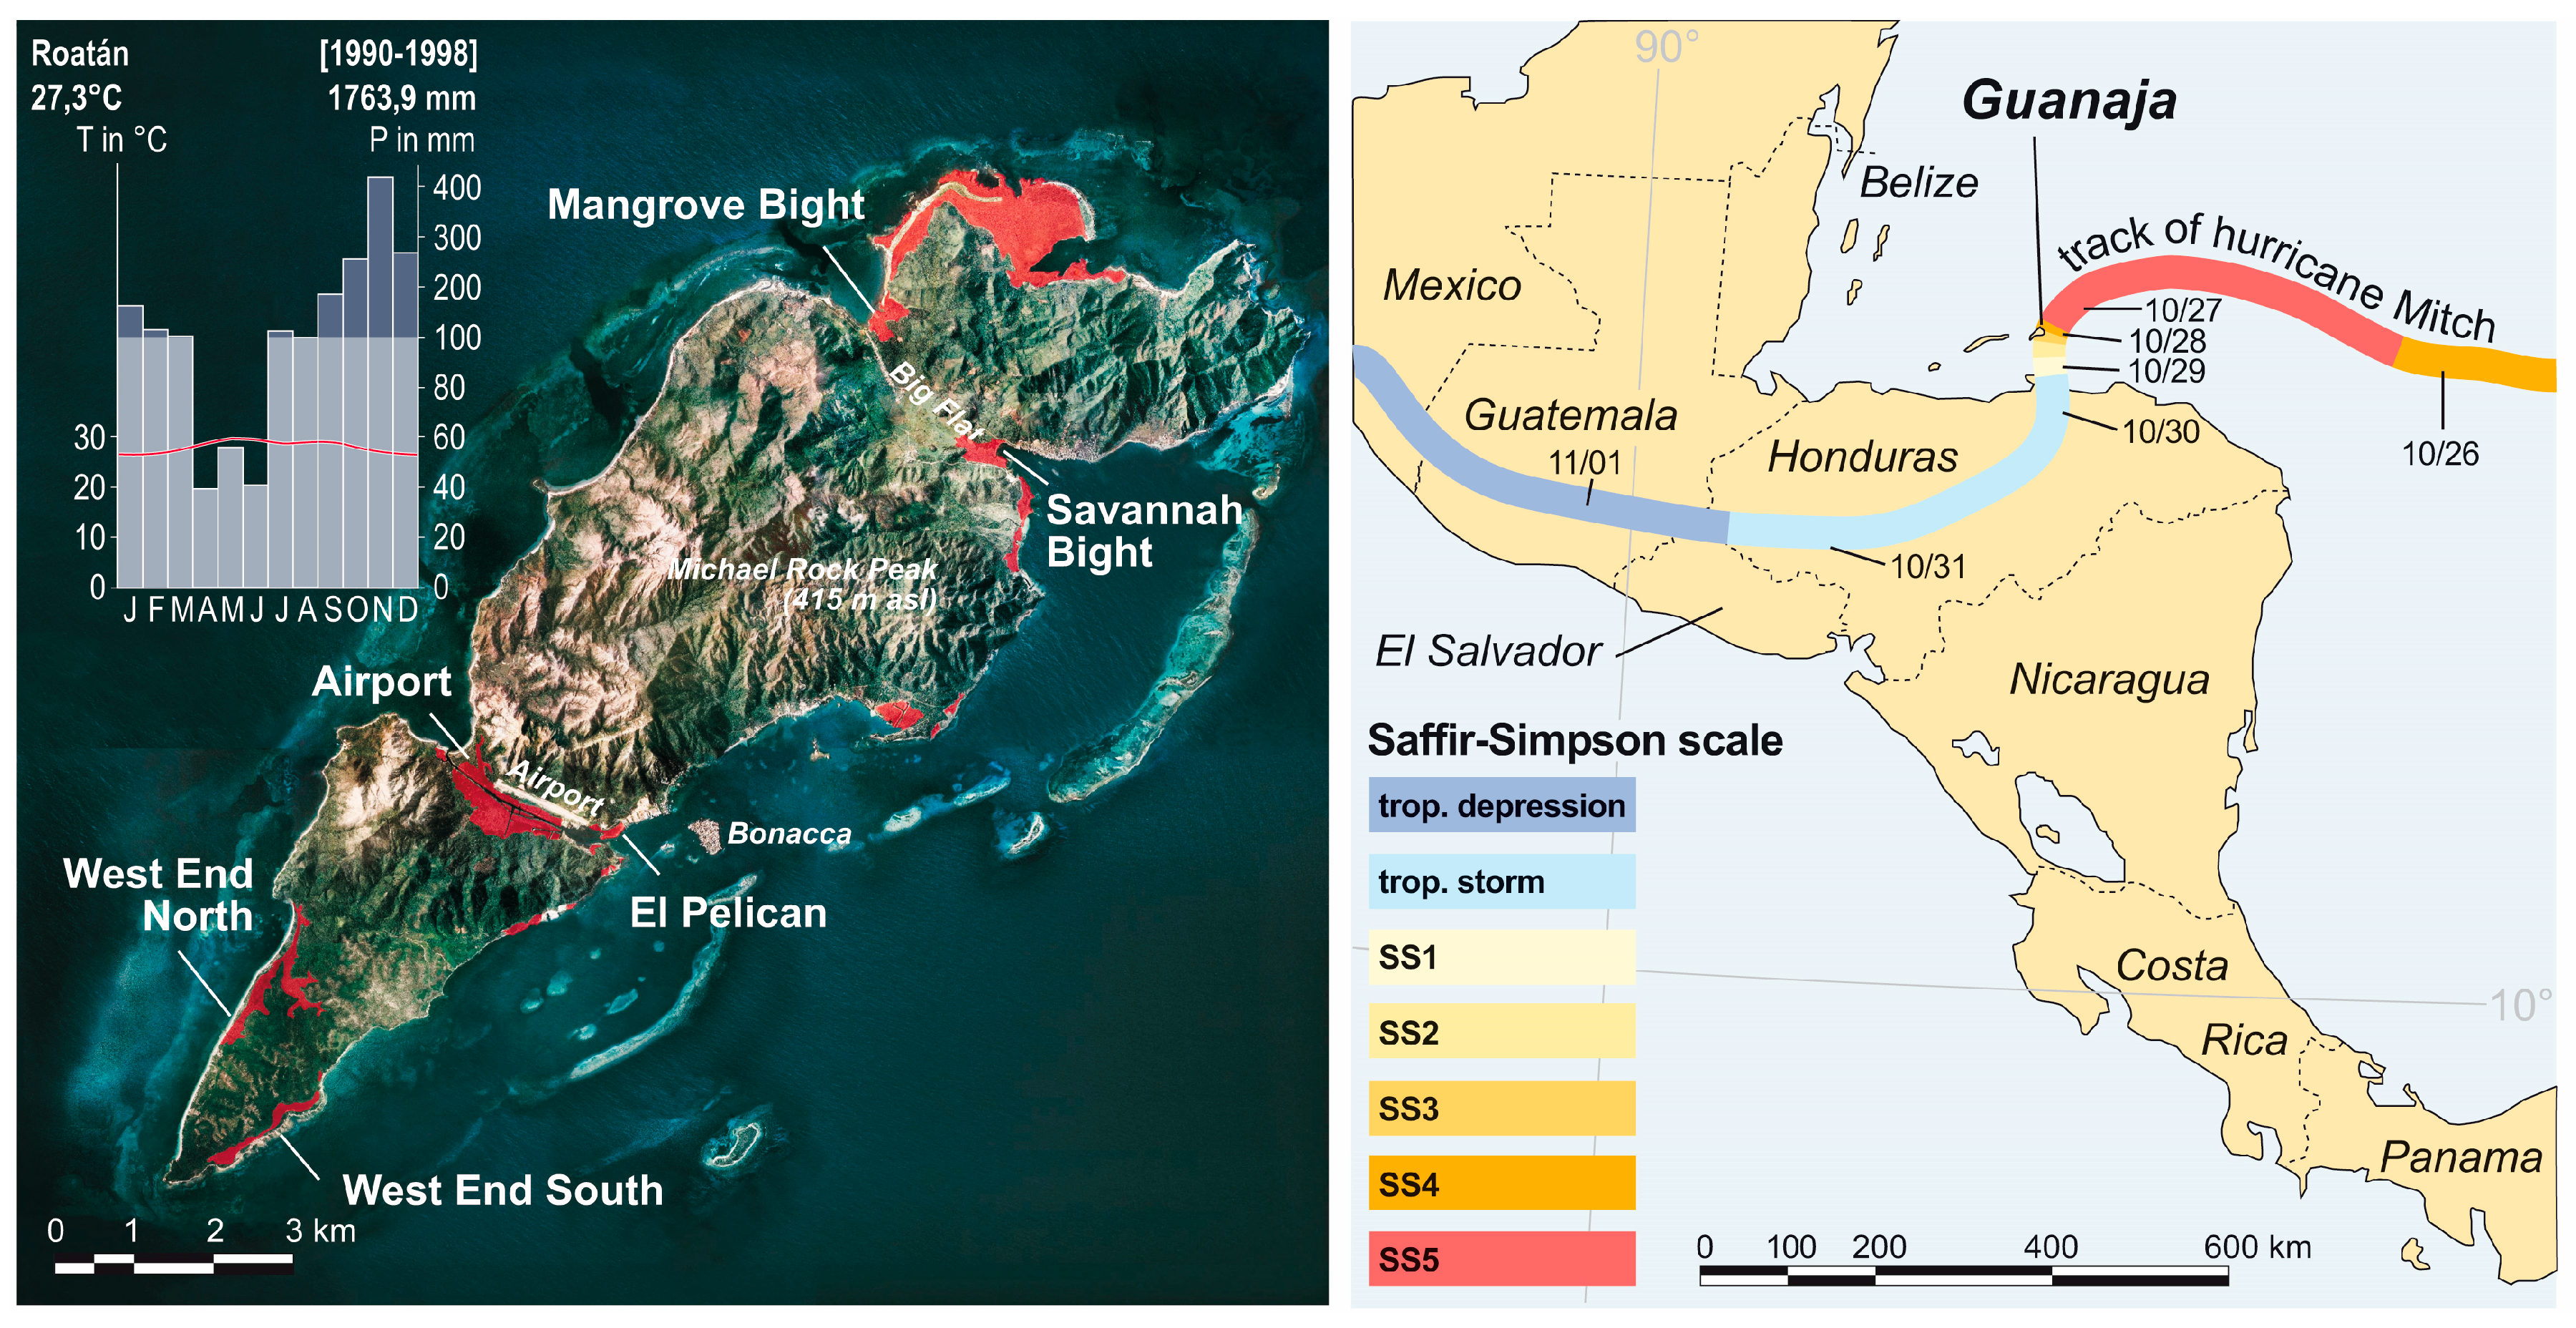
2.1. Study Area
2.2. Hurricane Mitch
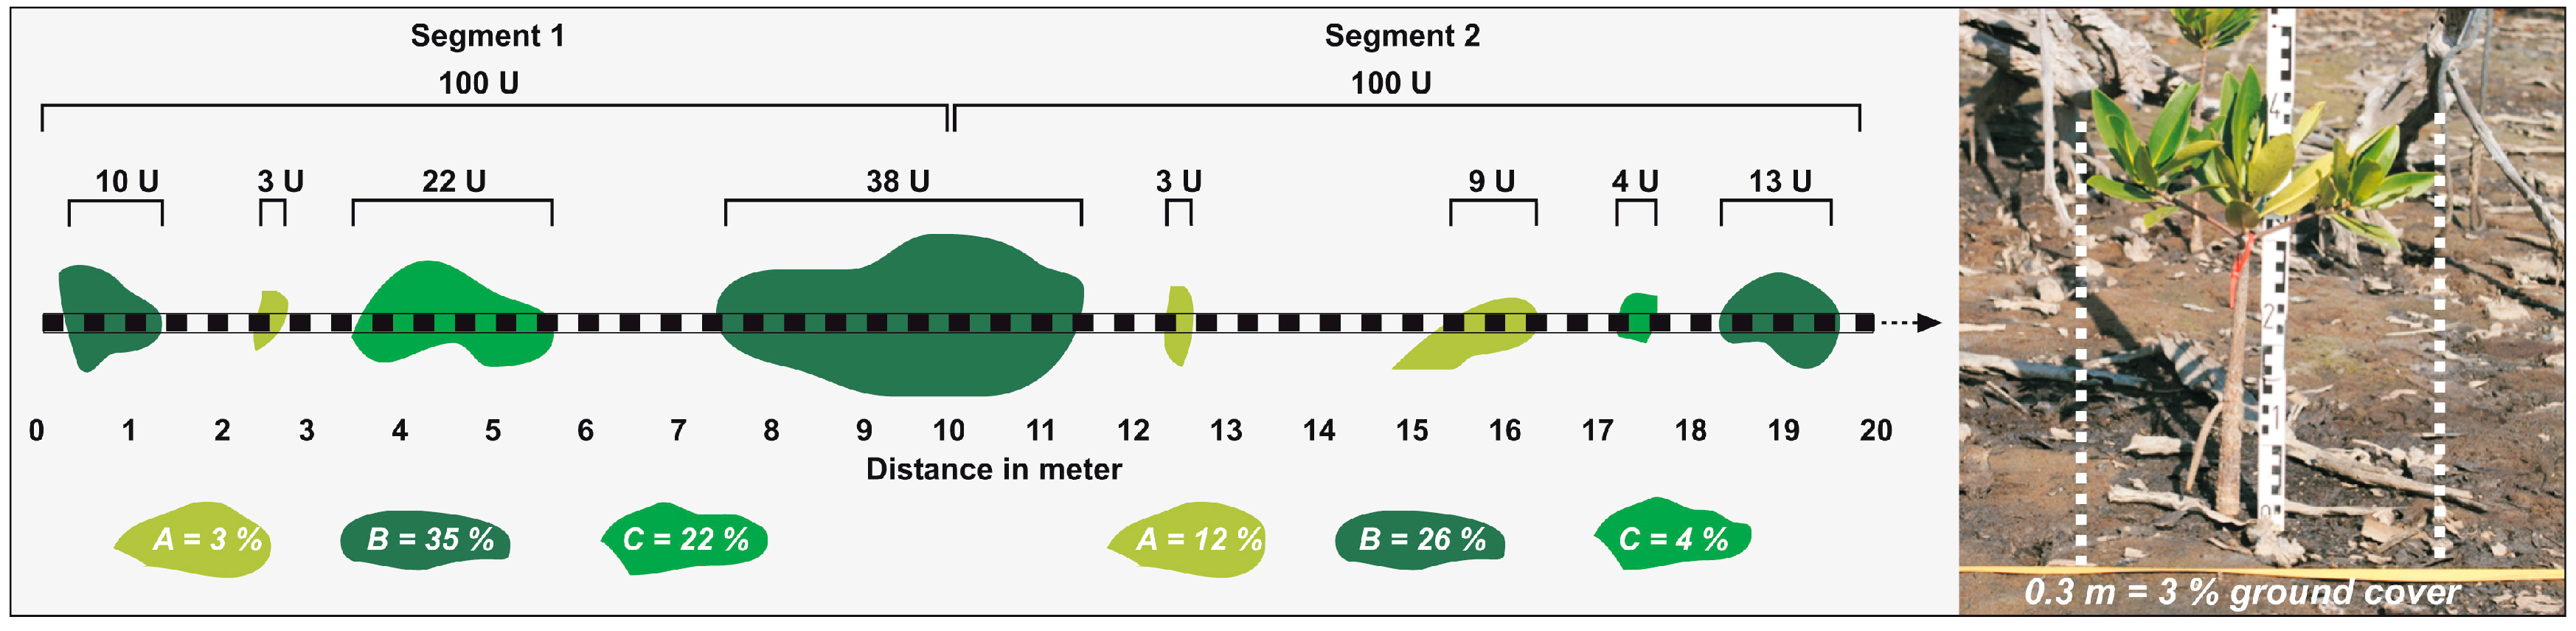
2.3. Data and Methods
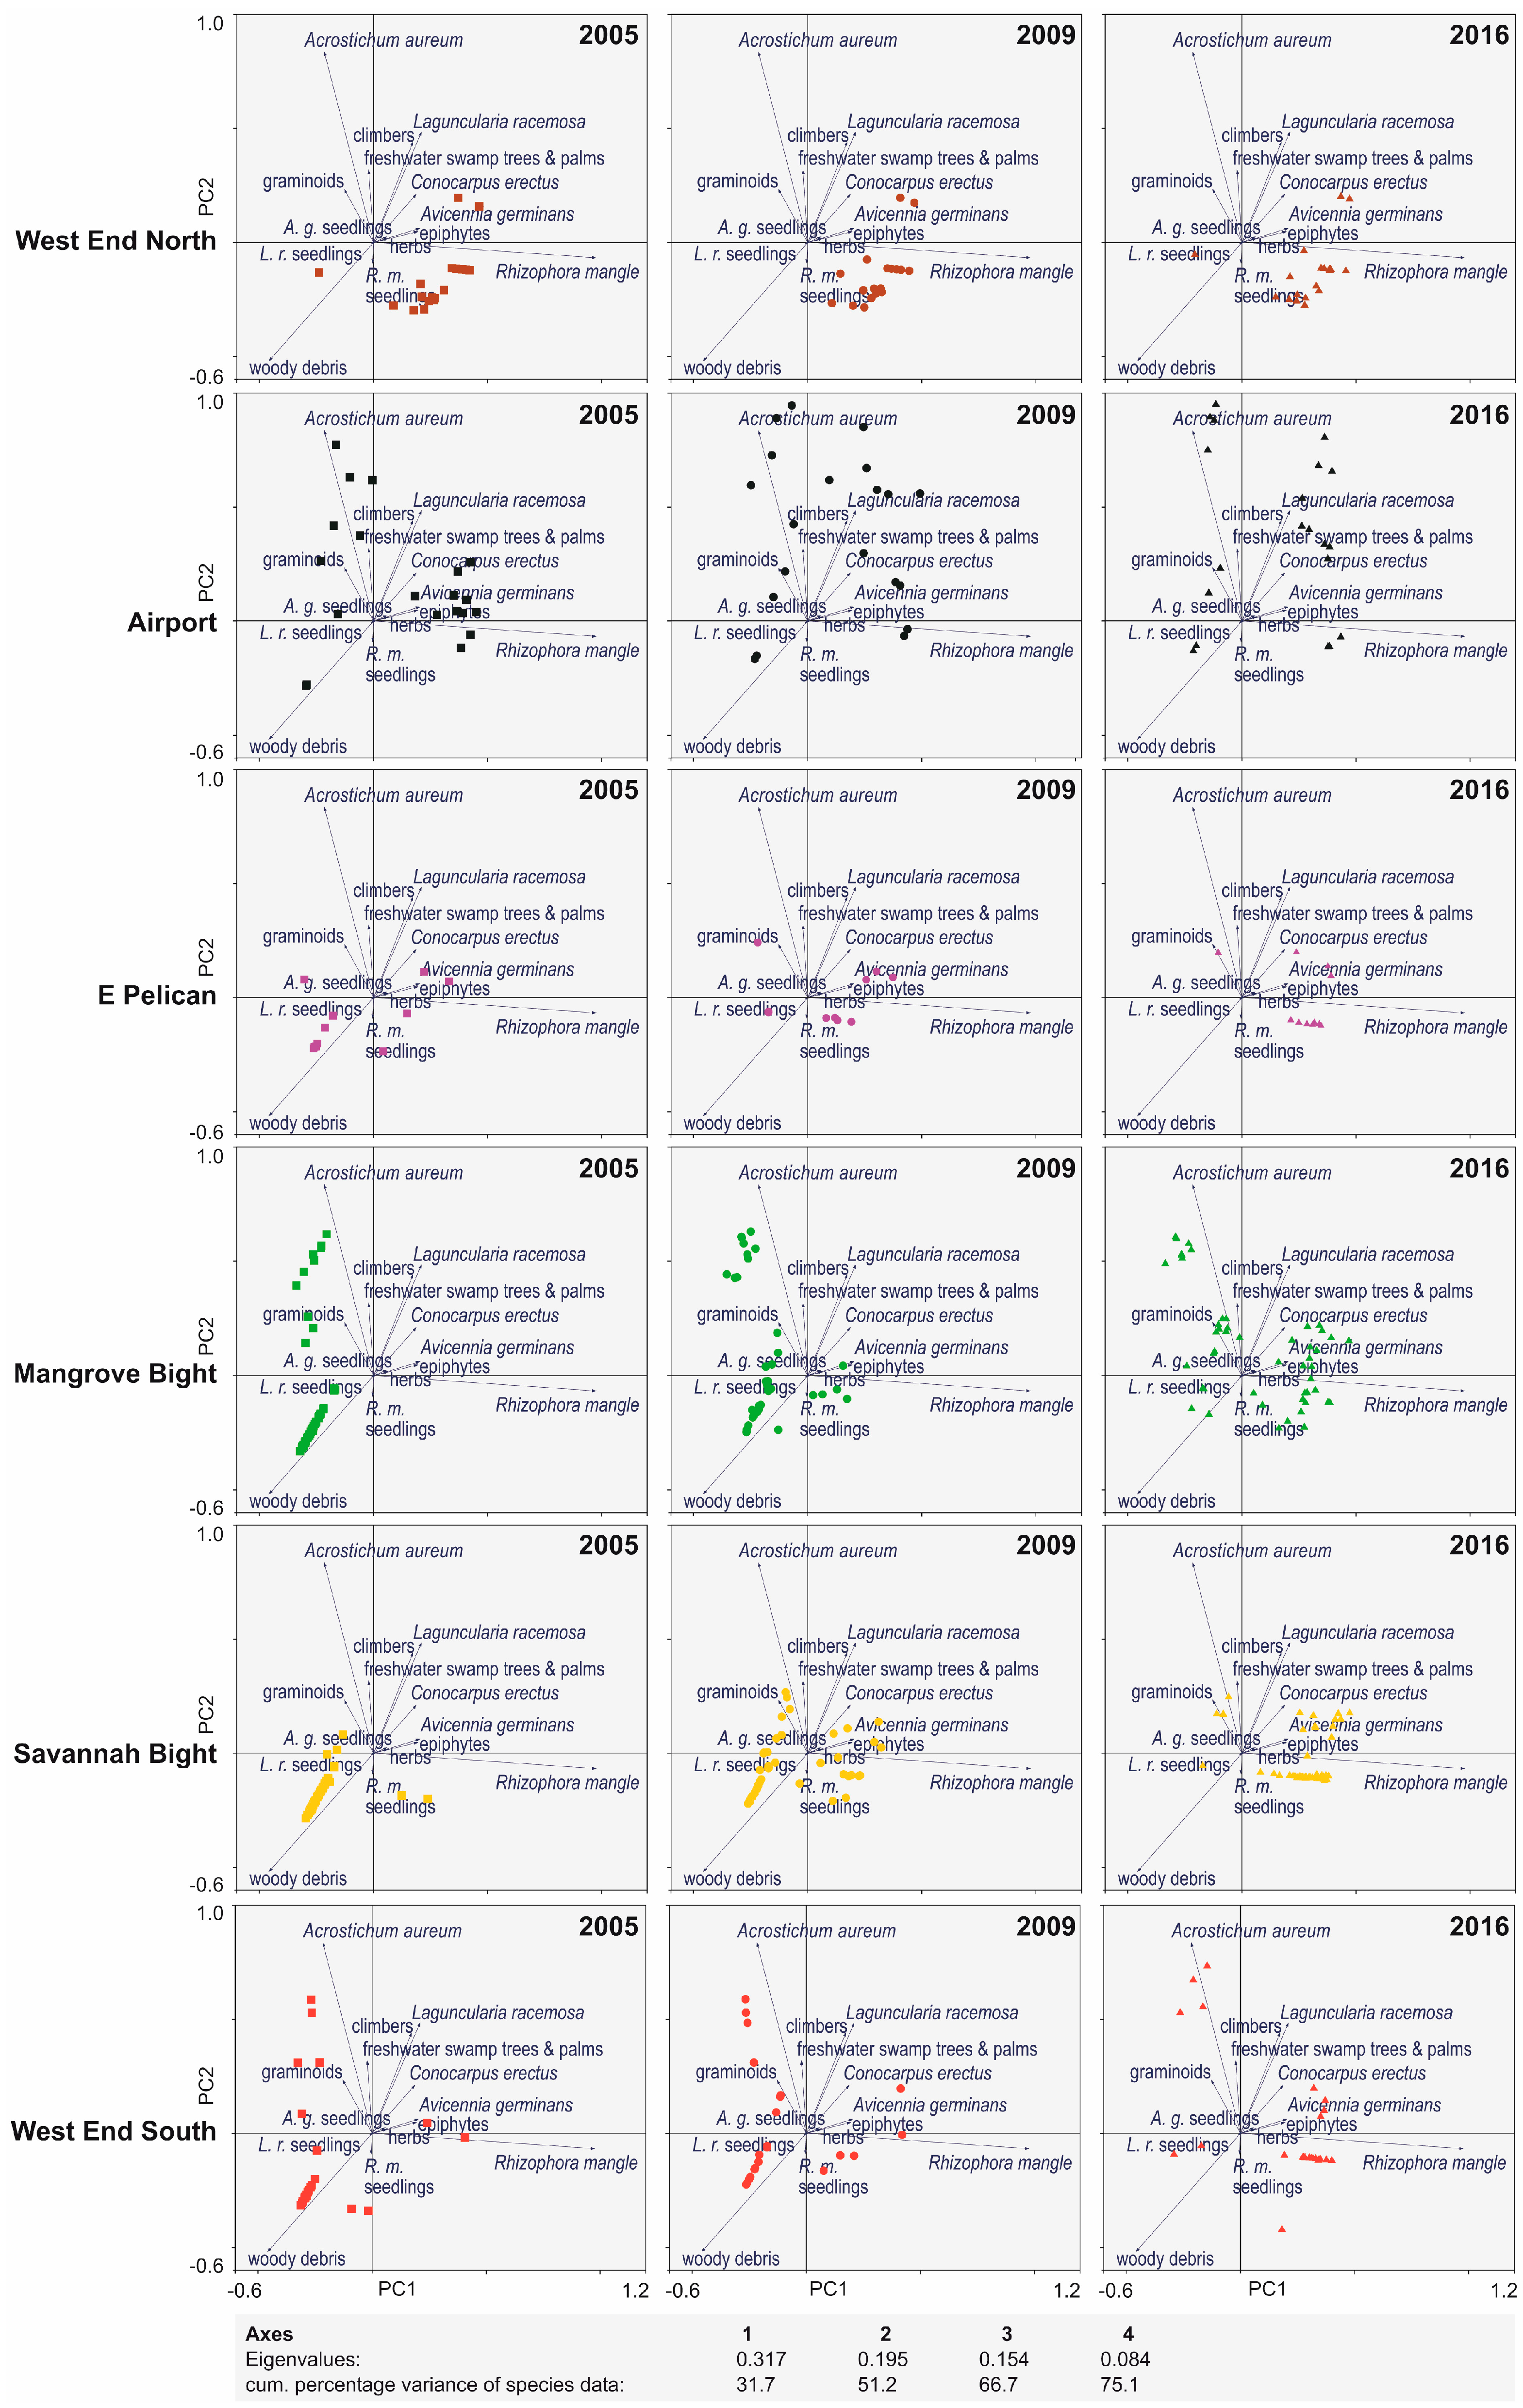
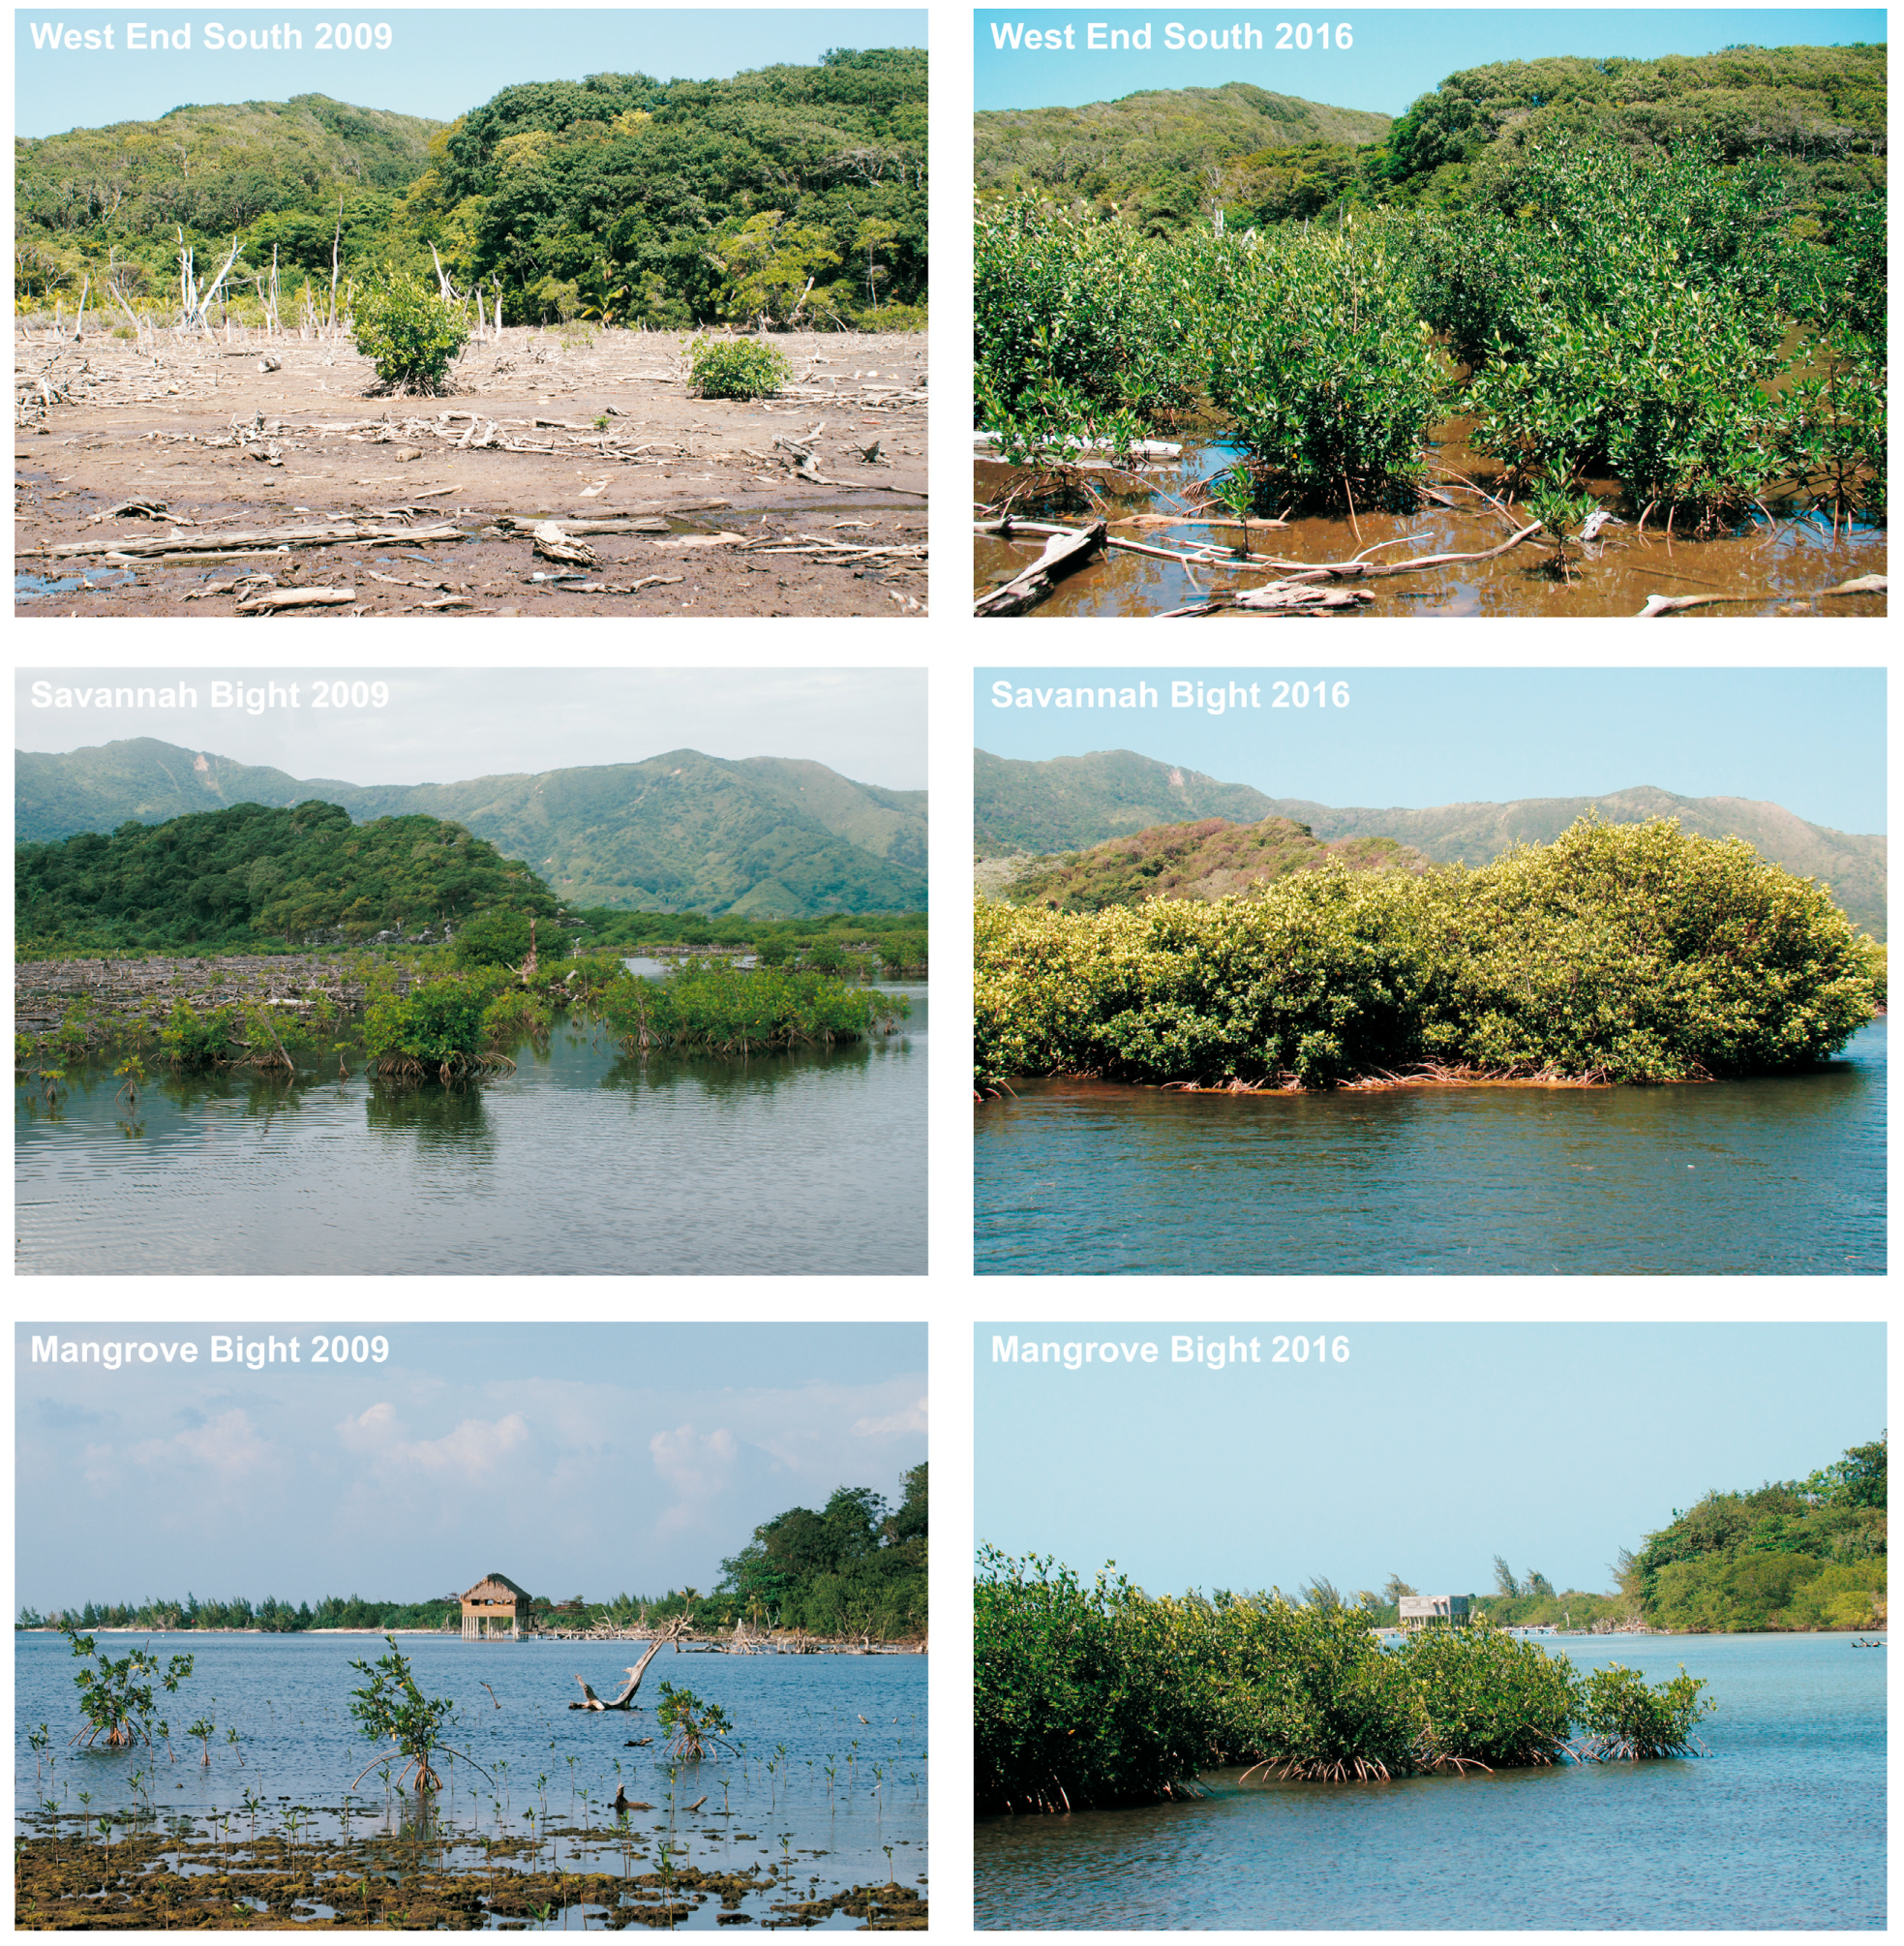
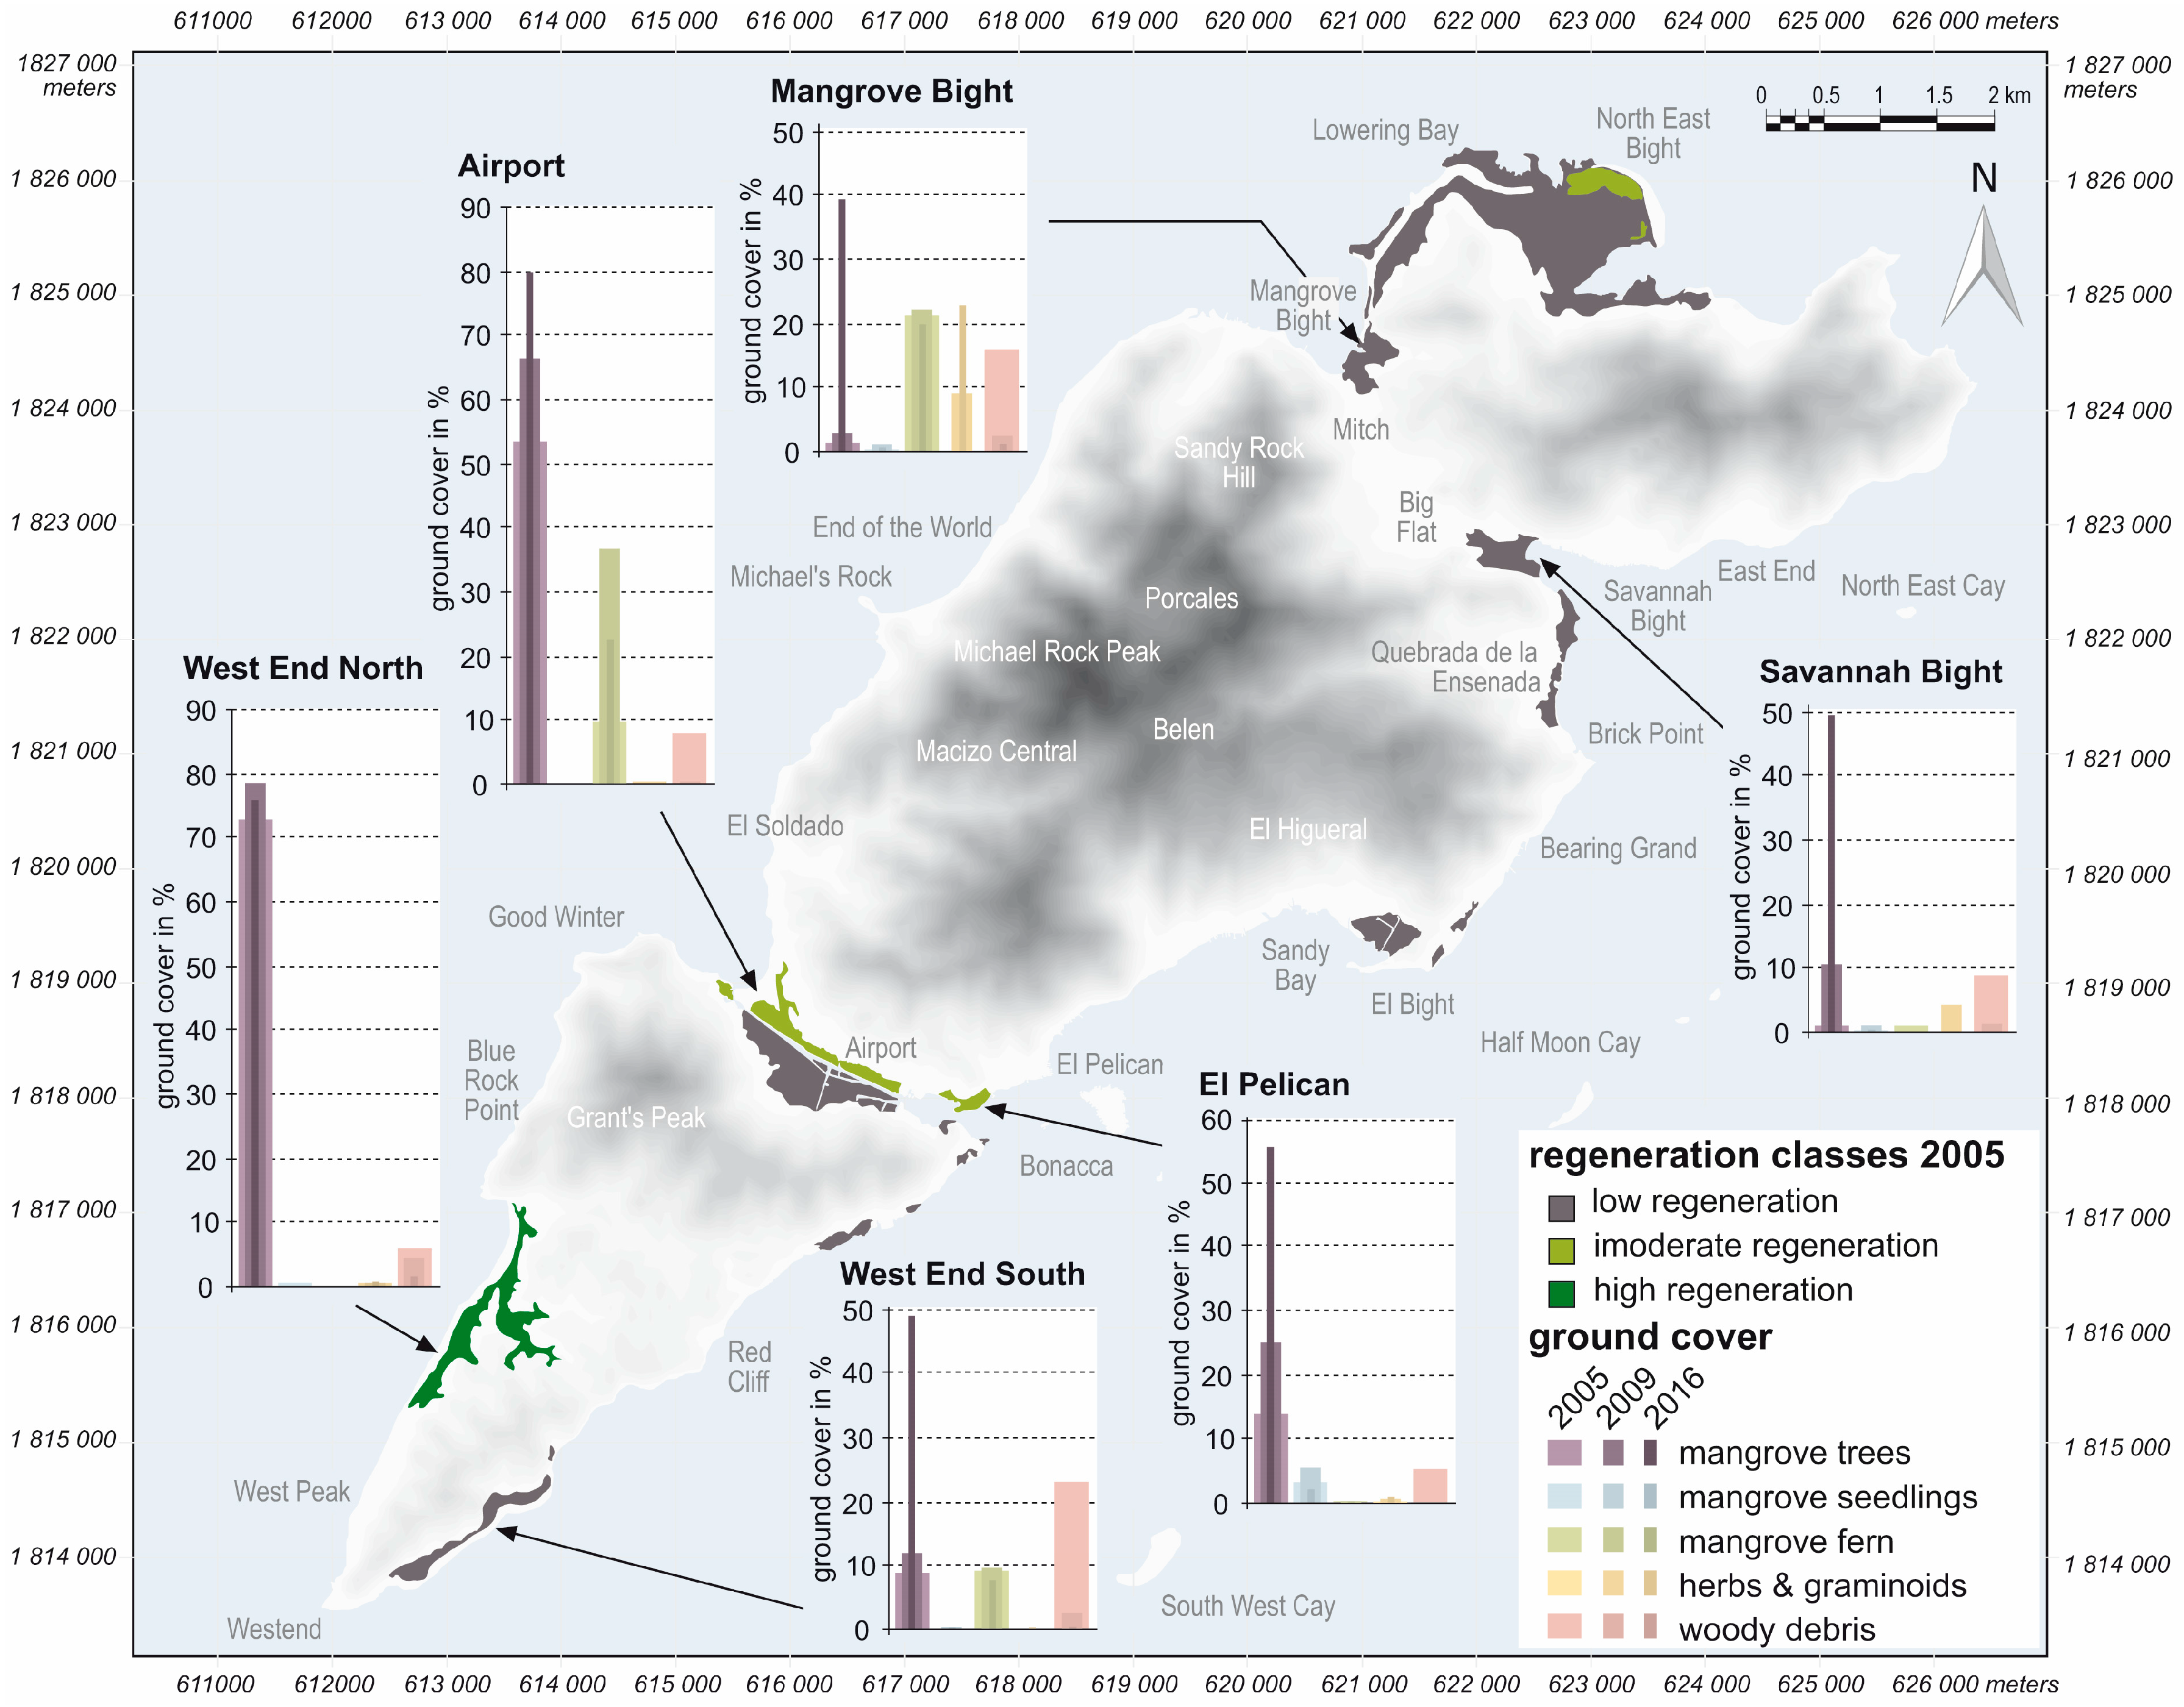
3. Results
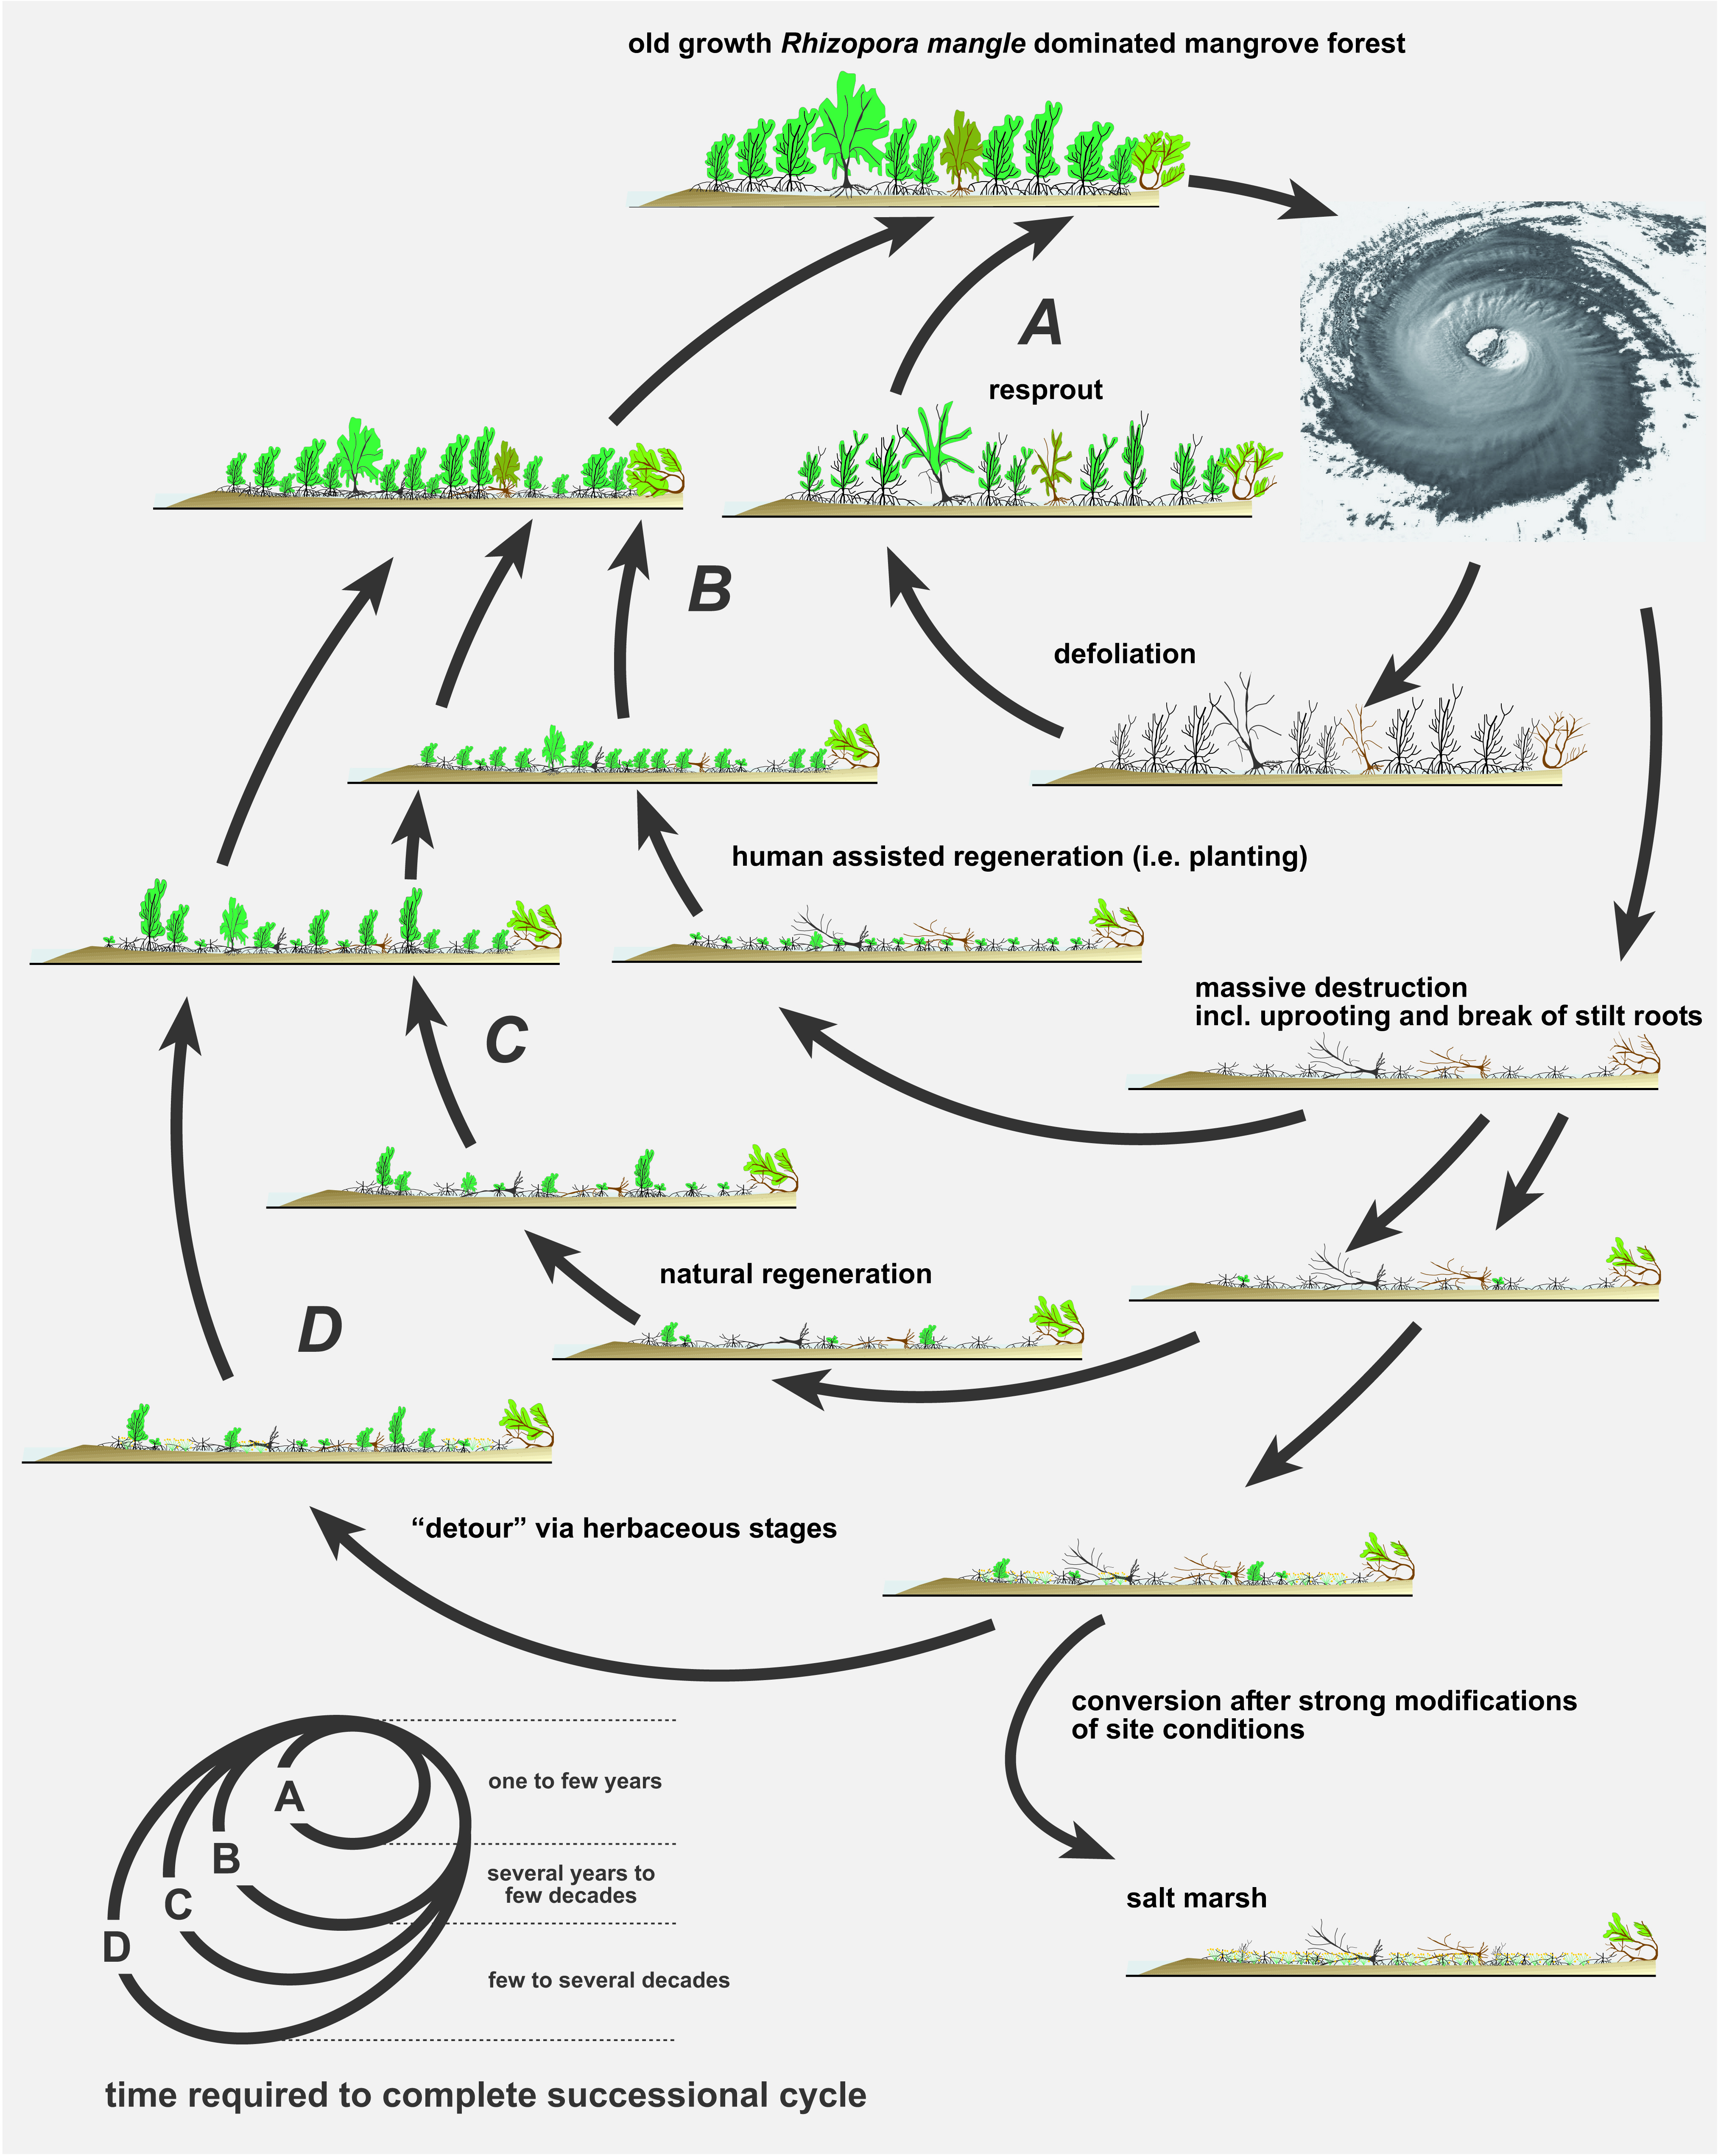
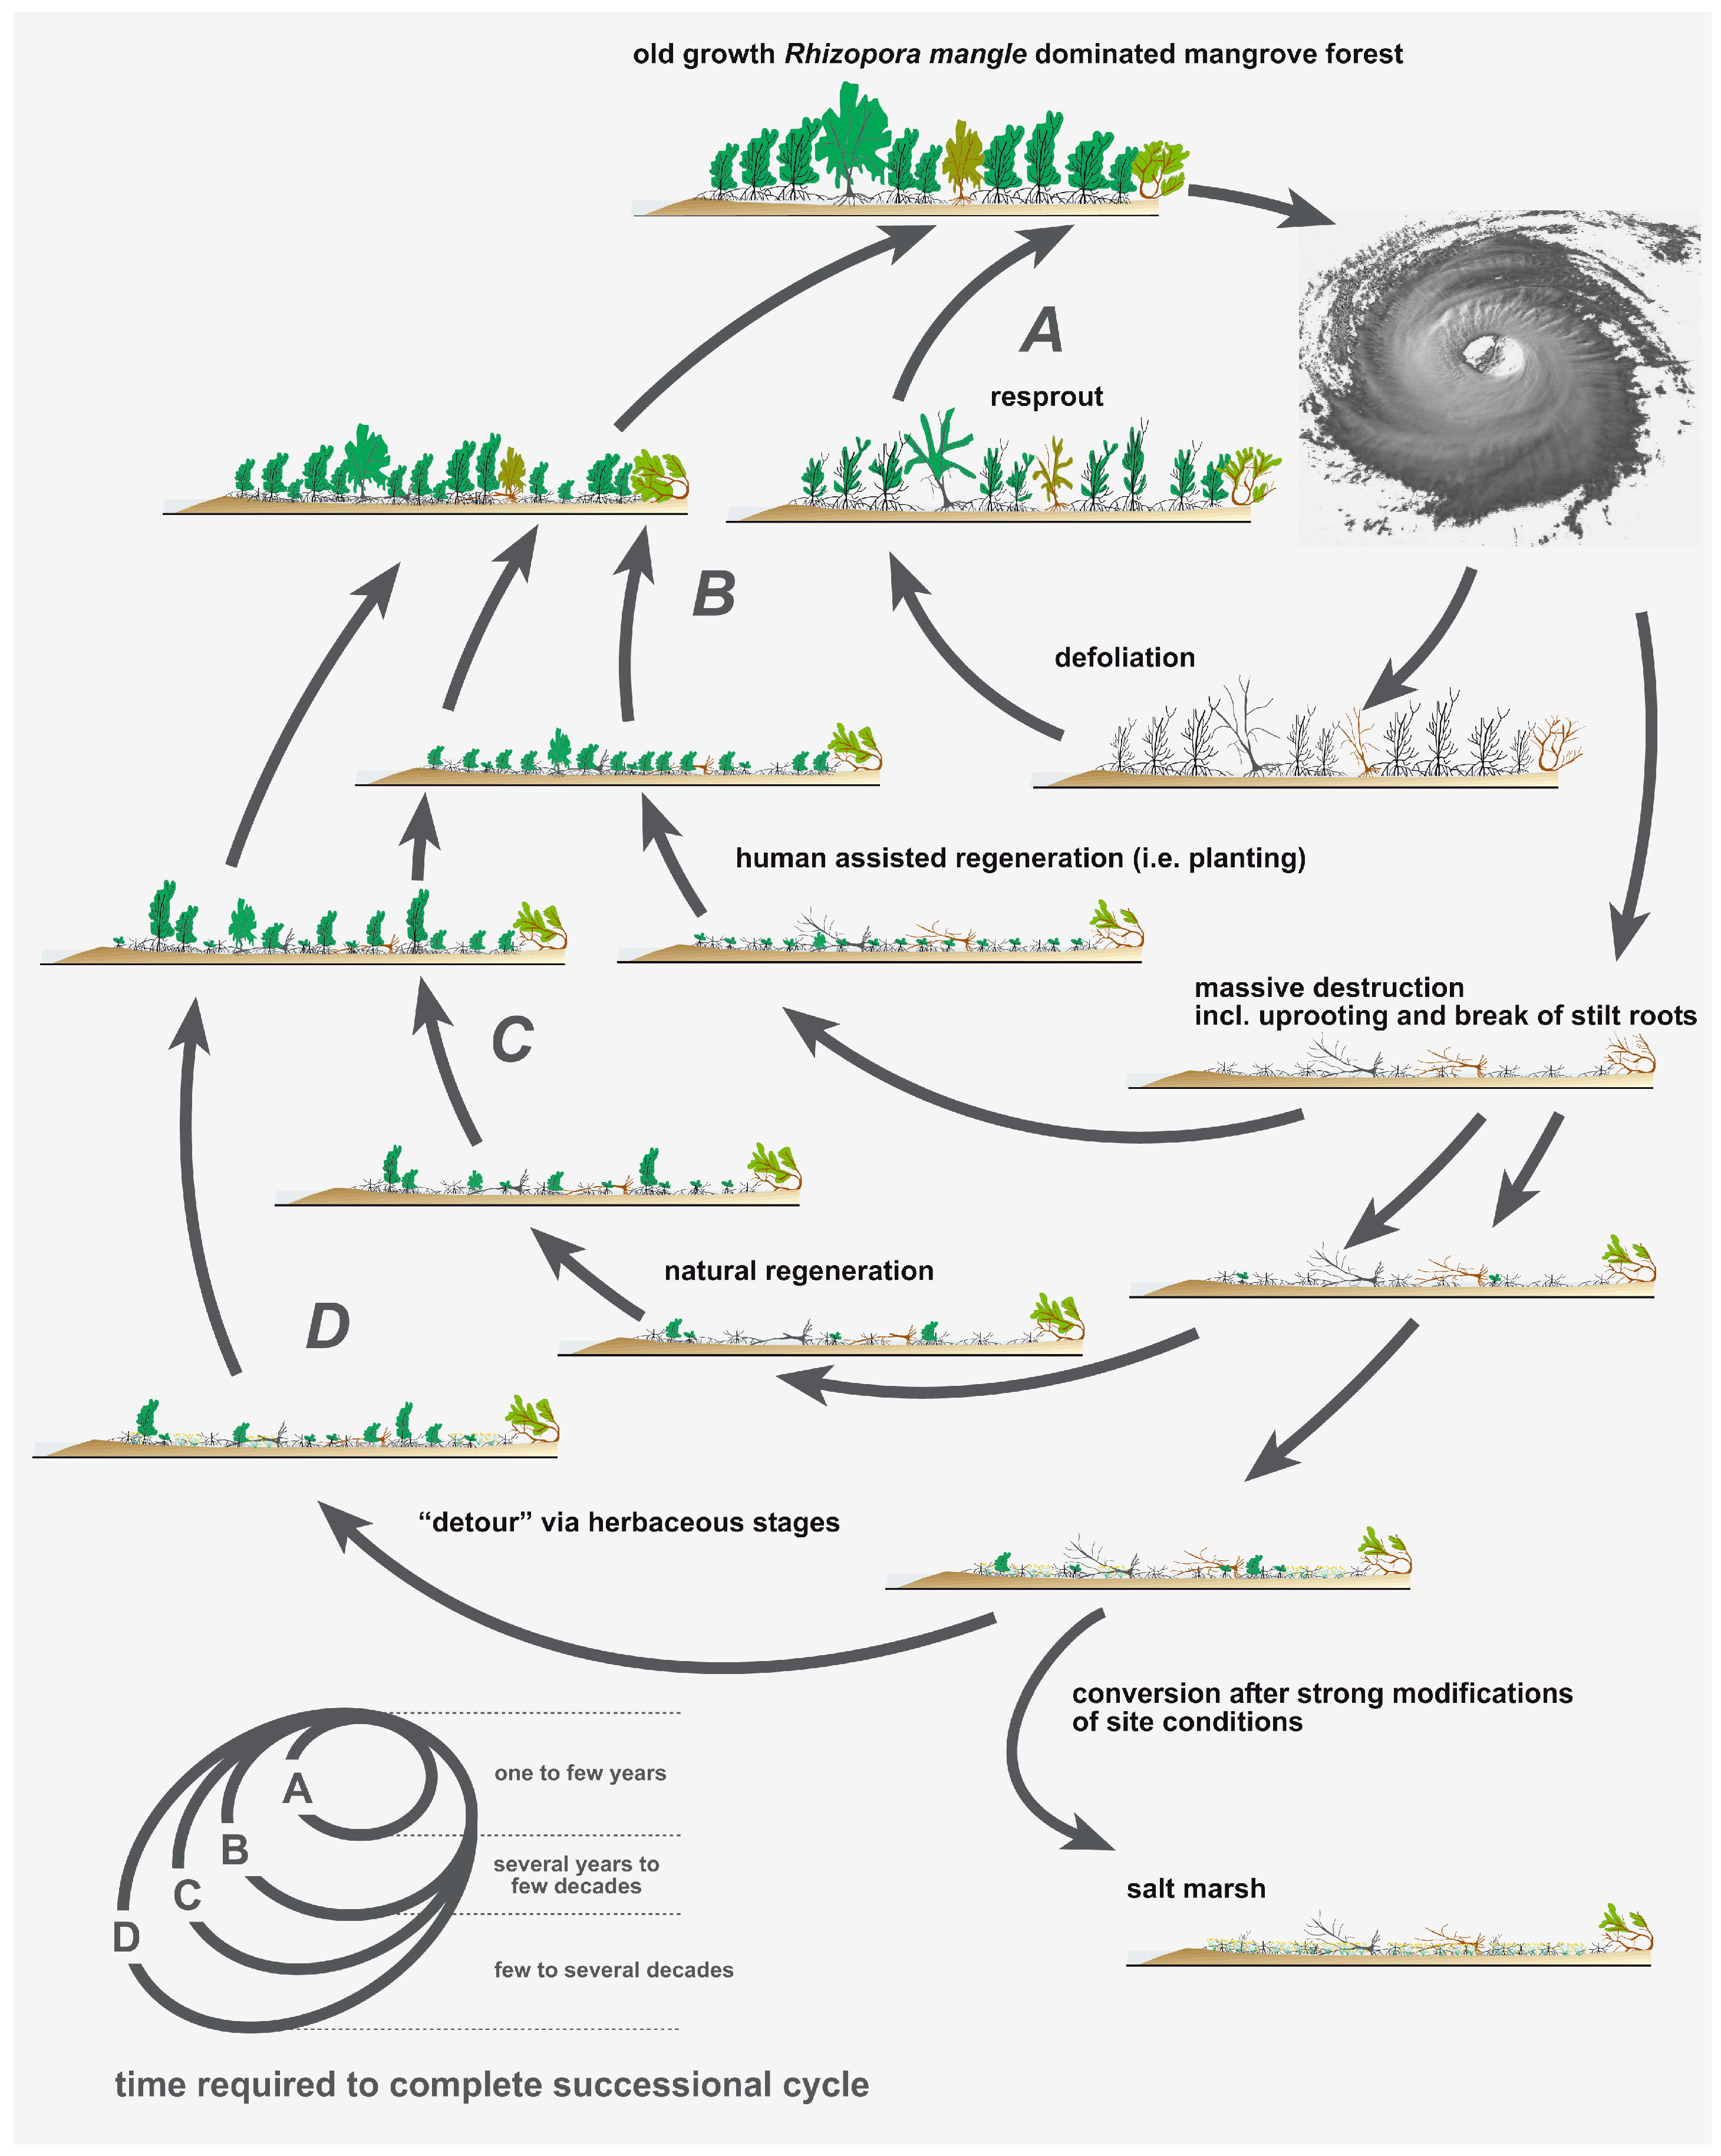
4. Discussion
5. Conclusions
Acknowledgments
Conflicts of Interest
References
- Costanza, R.; d’Arge, R.; de Groot, R.; Farber, S.; Grasso, M.; Hannon, B.; Limburg, K.; Naeem, S.; Oneill, R.V.; Paruelo, J.; et al. The value of the world’s ecosystem services and natural capital. Nature 1997, 387, 253–260. [Google Scholar] [CrossRef]
- Costanza, R.; de Groot, R.; van der Ploeg, S.; Anderson, S.J.; Kubiszewski, I.; Farber, S.; Turner, R.K. Changes in the global value of ecosystem services. Glob. Environ. Chang. 2014, 26, 152–158. [Google Scholar] [CrossRef]
- Ewel, K.C.; Twilley, R.R.; Ong, J.E. Different kinds of mangrove forests provide different goods and services. Glob. Ecol. Biogeogr. 1998, 7, 83–94. [Google Scholar] [CrossRef]
- Saenger, P. Mangrove Ecology, Silviculture and Conservation; Springer: Dordrecht, The Netherlands; Boston, MA, USA; London, UK, 2002; p. 360. [Google Scholar]
- Nagelkerken, I.; Blaber, S.J.M.; Bouillon, S.; Green, P.; Haywood, M.; Kirton, L.G.; Meynecke, J.-O.; Pawlik, J.; Penrose, H.M.; Sasekumar, A.; et al. The habitat function of mangroves for terrestrial and marine fauna: A review. Aquat. Bot. 2008, 89, 155–185. [Google Scholar] [CrossRef]
- Farber, S. The value of coastal wetlands for protection of property against hurricane wind damage. J. Environ. Econ. Manag. 1987, 14, 143–151. [Google Scholar] [CrossRef]
- Imamura, F.; Van To, D. Flood and typhoon disasters in Viet Nam in the Half Century since 1950. Nat. Hazards 1997, 15, 71–87. [Google Scholar] [CrossRef]
- Walters, B.B.; Rönnbäck, P.; Kovacs, J.M.; Crona, B.; Hussain, S.A.; Badola, R.; Primavera, J.H.; Barbier, E.; Dahdouh-Guebas, F. Ethnobiology, socioeconomics and management of mangrove forests: A review. Aquat. Bot. 2008, 89, 220–236. [Google Scholar] [CrossRef]
- The UN Environment World Conservation Monitoring Centre (UNEP-WCMC). The Front Line: Shoreline Protection and Other Ecosystem Services from Mangroves and Coral Reefs; UNEP-WCMC: Cambridge, UK, 2006; p. 33. [Google Scholar]
- Roth, L.C. Hurricanes and mangrove regeneration: Effects of Hurricane Joan, October 1988, on the vegetation of Isla del Venado, Bluefields, Nicaragua. Biotropica 1992, 24, 375–384. [Google Scholar] [CrossRef]
- Baldwin, A.; Egnotovich, M.; Ford, M.; Platt, W. Regeneration in fringe mangrove forests damaged by Hurricane Andrew. Plant Ecol. 2001, 157, 149–162. [Google Scholar] [CrossRef]
- Sherman, R.E.; Fahey, T.J.; Martinez, J.P. Hurricane impacts on a mangrove forest in the Dominican Republic: Damage patterns and early recovery. Biotropica 2001, 33, 393–408. [Google Scholar] [CrossRef]
- Imbert, D. Impact des ouragans sur la structure et la dynamique forestières dans les mangroves des Antilles. Bois For. Trop. 2002, 273, 69–78. [Google Scholar]
- Piou, C.; Feller, I.C.; Berger, U.; Chi, F. Zonation patterns of Belizean offshore mangrove forests 41 years after a catastrophic hurricane. Biotropica 2006, 38, 365–374. [Google Scholar] [CrossRef]
- Lugo, A.E. Mangrove ecosystems: Successional or steady state? Biotropica 1980, 12, 65–72. [Google Scholar] [CrossRef]
- Lugo, A.E. Mangrove forests: A tough system to invade but an easy one to rehabilitate. Mar. Pollut. Bull. 1998, 37, 427–430. [Google Scholar] [CrossRef]
- Lugo, A.E.; Zimmerman, J.K. Ecological life histories of tropical trees with emphasis on disturbance effects. In Tropical Tree Seed Manual; Vosso, J., Ed.; USDA Forest Service: Washington, DC, USA, 2003; pp. 191–213. [Google Scholar]
- Alongi, D.M. Mangrove forests: Resilience, protection from tsunamis, and responses to global climate change. Estuar. Coast. Shelf Sci. 2008, 76, 1–13. [Google Scholar] [CrossRef]
- McKee, K.L.; Rooth, J.E.; Feller, I.C. Mangrove recruitment after forest disturbance is facilitated by herbaceous species in the Caribbean. Ecol. Appl. 2007, 17, 1678–1693. [Google Scholar] [CrossRef] [PubMed]
- González, C.; Urrego, L.E.; Martínez, J.I.; Polanía, J.; Yokoyama, Y. Mangrove dynamics in the southwestern Caribbean since the ‘Little Ice Age’: A history of human and natural disturbances. Holocene 2010, 20, 849–861. [Google Scholar] [CrossRef]
- Biswas, S.R.; Khan, M.S.I.; Mallik, A.U. Invaders’ control on post-disturbance succession in coastal mangroves. J. Plant Ecol. 2012, 5, 157–166. [Google Scholar] [CrossRef]
- Wanless, H.R.; Parkinson, R.W.; Tedesco, L.P. Sea level control on stability of Everglades wetlands. In Everglades: The Ecosystem and Its Restoration; Davis, S.M., Ogden, J.C., Eds.; St. Lucie Press: Boca Raton, FL, USA, 1994; pp. 199–223. [Google Scholar]
- Smith, T.J., III; Anderson, G.H.; Balentine, K.; Tiling, G.; Ward, G.A.; Whelan, R.T. Cumulative impacts of hurricanes on Florida mangrove ecosystems: Sediment deposition, storm surges and vegetation. Wetlands 2009, 29, 24–34. [Google Scholar] [CrossRef]
- Knutson, T.R.; Tuleya, R.E. Impact of CO2-induced warming on simulated hurricane intensity and precipitation: Sensitivity to the choice of climate model and convective parameterization. J. Clim. 2004, 24, 3477–3495. [Google Scholar] [CrossRef]
- Emanuel, K. Increasing destructiveness of tropical cyclones over the past 30 years. Nature 2005, 436, 686–688. [Google Scholar] [CrossRef] [PubMed]
- Emanuel, K.A. Environmental factors affecting tropical cyclone power dissipation. J. Clim. 2007, 20, 5497–5509. [Google Scholar] [CrossRef]
- Webster, P.J.; Holland, G.J.; Curry, J.A.; Chang, H.-R. Changes in tropical cyclone number, duration, and intensity in a warming environment. Science 2005, 309, 1844–1846. [Google Scholar] [CrossRef] [PubMed]
- Klotzbach, P.J. Trends in global tropical cyclone activity over the past twenty years (1986–2005). Geophys. Res. Lett. 2006, 33, L010805. [Google Scholar] [CrossRef]
- Trenberth, K.E.; Jones, P.D.; Ambenje, P.; Bojariu, R.; Easterling, D.; Klein Tank, A.; Parker, D.; Rahimzadeh, F.; Renwick, J.A.; Rusticucci, M.; et al. Observations: Surface and Atmospheric Climate Change. In Climate Change 2007: The Physical Science Basis; Solomon, S., Qin, D., Manning, M., Chen, Z., Marquis, M., Averyt, K.B., Tignor, M., Miller, H.L., Eds.; Contribution of Working Group I to the Fourth Assessment Report of the Intergovernmental Panel on Climate Change; Cambridge University Press: Cambridge, UK; New York, NY, USA, 2007; pp. 235–336. [Google Scholar]
- Emanuel, K.A.; Sundararajan, R.; Willimas, J. Hurricanes and global warming-Results from downscaling IPCC AR4 simulations. Bull. Am. Meteorol. Soc. 2008, 3, 347–367. [Google Scholar] [CrossRef]
- Knutson, T.R.; McBride, J.L.; Chan, J.; Emanuel, K.; Holland, G.; Landsea, C.; Held, I.; Kossin, J.P.; Srivastava, A.K.; Sugi, M. Tropical cyclones and climate change. Nat. Geosci. 2010, 3, 157–163. [Google Scholar] [CrossRef] [Green Version]
- Christensen, J.H.; Krishna Kumar, K.; Aldrian, E.; An, S.I.; Cavalcanti, I.F.A.; de Castro, M.; Dong, W.; Goswami, P.; Hall, A.; Kanyanga, J.K.C.; et al. Climate Phenomena and their Relevance for Future Regional Climate Change. In Climate Change 2013: The Physical Science Basis; Stocker, T.F.L., Qin, D., Plattner, G.-K., Tignor, M., Allen, S.K., Boschung, J., Nauels, A., Xia, Y., Bex, V., Midgley, P.M., Eds.; Contribution of Working Group I to the Fifth Assessment Report of the Intergovernmental Panel on Climate Change; Cambridge University Press: Cambridge, UK; New York, NY, USA, 2013. [Google Scholar]
- Pasch, R.J.; Avila, L.A.; Guiney, J.L. Atlantic Hurricane Season of 1998. Mon. Weather Rev. 2001, 129, 3085–3123. [Google Scholar] [CrossRef]
- Vanselow, K.A.; Kolb, M.; Fickert, T.H. Destruction and regeneration of terrestrial, littoral and marine ecosystems on the island of Guanaja/Honduras seven years after Hurricane Mitch. Erdkunde 2007, 61, 358–371. [Google Scholar] [CrossRef]
- Lebigre, J.-M.; Portillo, P.; Thompson, W. Quel avenir pour les mangroves de l’archipel de la Bahía (Honduras)? In Proceedings of the Conference de la Commission de Geographie de la Mer et du Littoral, Espace Littoraux en Mutation, Dunkerque, France, 1–3 June 2000. [Google Scholar]
- Bak, H.; Gallner, J.C. Proyecto Manejo Ambiental de las Islas de la Bahia, Informe Tecnico #7; Plan de Manejo del Parque Nacional de Turtle Harbour (Manglar): Islas De La Bahia, Honduras, 2002. [Google Scholar]
- Reconocimiento Tecnico Forestal. Consultores en Recursos: Los Ecosistemas Forestales en las Islas de la Bahía, Honduras; Reconocimiento Tecnico Forestal: Tegucigalpa, Honduras, 1996. [Google Scholar]
- Fickert, T.; Grüninger, F. Floristic Zonation, Vegetation Structure, and Plant Diversity Patterns Within a Caribbean Mangrove and Swamp Forest on the Bay Island of Utila (Honduras). Ecotropica 2010, 16, 73–92. [Google Scholar]
- Richards, J.A.; Jia, X. Remote Sensing Digital Image Analysis; Springer: Berlin/Heidelberg, Germany, 2006; p. 439. [Google Scholar]
- Mueller-Dombois, D.; Ellenberg, H. Aims and Methods of Vegetation Ecology; John Wiley & Sons: New York, NY, USA, 1974; p. 547. [Google Scholar]
- Cintrón, G.; Schaeffer-Novelli, Y. Methods for studying mangrove structure. In The Mangrove Ecosystem: Research Methods; Snedaker, S.C., Snedaker, J.G., Eds.; United Nations Educational, Scientific and Cultural Organization (UNESCO): Paris, France, 1984; pp. 91–113. [Google Scholar]
- Balick, M.J.; Nee, M.H.; Daniel, E.A. Checklist of the Vascular Plants of Belize. In Memoirs of the New York Botanical Garden; New York Botanical Garden Press: New York, NY, USA, 2000; p. 246. [Google Scholar]
- Raunkiaer, C. The Life-Forms of Plants and Statistical Plant Geography; Oxford University Press: Oxford, UK, 1934; p. 632. [Google Scholar]
- Ter Braak, C.J.F.; Šmilaur, P. CANOCO for Windows Version 4.5; Biometris, Plant Research International: Wageningen, The Netherlands, 2002; p. 499. [Google Scholar]
- Lepš, J.; Šmilauer, P. Multivariate Analysis of Ecological Data Using CANOCO; Cambridge University Press: New York, NY, USA, 2003; p. 269. [Google Scholar]
- Cahoon, D.R.; Hensel, P.; Rybczyk, J.; McKee, K.; Proffitt, C.E.; Perez, B. Mass tree mortality leads to mangrove peat collapse at Bay Islands, Honduras after Hurricane Mitch. J. Ecol. 2003, 91, 1093–1105. [Google Scholar] [CrossRef]
- Smith, T.J., III; Robblee, M.B.; Wanless, H.R.; Doyle, T.W. Mangroves, hurricanes, and lightning strikes. BioScience 1994, 44, 256–262. [Google Scholar] [CrossRef]
- Greening, H.; Doering, P.; Corbett, C. Hurricane Impacts on Coastal Ecosystems. Estuar. Coasts 2006, 29, 877–897. [Google Scholar] [CrossRef]


| Species | Family | Life-form | Westend North | Mangrove Bight | Savannah Bight | El Pelican | Airport | West End South | ||||||||||||
|---|---|---|---|---|---|---|---|---|---|---|---|---|---|---|---|---|---|---|---|---|
| 2005 | 2009 | 2016 | 2005 | 2009 | 2016 | 2005 | 2009 | 2016 | 2005 | 2009 | 2016 | 2005 | 2009 | 2016 | 2005 | 2009 | 2016 | |||
| unidentified climber | unknown | climber | 1.3 | 0.95 | ||||||||||||||||
| Acrostichum aureum | Adiantaceae | fern | 22.26 | 22.07 | 19.65 | 0.36 | 0.4 | 9.05 | 37 | 23 | 9.3 | 9.57 | 8.42 | |||||||
| Sesuvium portulacastrum | Aizoaceae | herb | 0.25 | 1.4 | 0.11 | 0.13 | ||||||||||||||
| Blutaparon vermiculare | Amaranthaceae | herb | 2.63 | 16.41 | 0.13 | |||||||||||||||
| Rhabdadenia biflora | Apocynaceae | climber | 7.25 | 5.8 | 9.15 | 1.46 | 1.86 | |||||||||||||
| Acoelorraphe wrightii | Arecaceae | palm | 1.8 | 1.91 | 2.2 | |||||||||||||||
| Cocos nucifera | Arecaceae | palm | 0.77 | 0.87 | 0.87 | |||||||||||||||
| Eclipta prostrata | Asteraceae | herb | 0.04 | |||||||||||||||||
| Pachira aquatica | Bombacaceae | tree | 3.9 | 5.05 | 4.85 | |||||||||||||||
| Cakile lanceolata | Brassicaceae | herb | 0.4 | |||||||||||||||||
| Tillandsia dasyrilifolia | Bromeliaceae | epiphyte | 0.1 | 0.1 | 0.35 | 1.05 | 3.45 | 0.14 | 0.09 | |||||||||||
| Conocarpus erecta | Combretaceae | tree | 1.99 | 2.49 | 2.95 | 0.92 | 0.87 | 1.4 | 22.1 | 18.75 | 11.25 | |||||||||
| Laguncularia racemosa | Combretaceae | tree | 6.2 | 8.2 | 9.29 | 0.68 | 1.62 | 15.47 | 0.67 | 5.15 | 8.33 | 3.82 | 6.9 | 15.85 | 25.55 | 36.45 | 2.64 | 4.02 | 9 | |
| Cyperus esculentus | Cyperaceae | herb | 0.29 | 0.33 | 0.42 | 0.06 | 0.65 | |||||||||||||
| Dalbergia cf. brownei | Fabaceae | climber | 4.55 | 6.65 | 5.65 | |||||||||||||||
| Vigna luteola | Fabaceae | climber | 0.9 | |||||||||||||||||
| Myrmecophila tibicinis | Orchidaceae | epiphyte | 0.02 | 0.05 | ||||||||||||||||
| unidentified orchid | Orchidaceae | epiphyte | 0.05 | 0.2 | ||||||||||||||||
| Distichlis spicata | Poaceae | graminoid | 0.54 | 0.24 | 4.35 | 0.73 | 1 | 0.5 | ||||||||||||
| Spartina spartinae | Poaceae | graminoid | 0.29 | |||||||||||||||||
| Rhizophora mangle | Rhizophoraceae | tree | 70.29 | 77.86 | 75 | 0.26 | 1.74 | 20.18 | 1.78 | 6.38 | 43.13 | 15.2 | 17.36 | 46.1 | 47.65 | 41.1 | 46.25 | 6.43 | 9.76 | 39 |
| Typha domingensis | Typhaceae | herb | 4.76 | 4.76 | ||||||||||||||||
| Avicennia germinans | Verbenaceae | tree | 6.87 | 1.22 | 3.84 | 7.1 | 9.73 | 5.1 | 0.92 | |||||||||||
| woody debris | 5.89 | 4.41 | 16.06 | 2.42 | 1.2 | 8.41 | 1.73 | 1.08 | 7.93 | 0.6 | 0.28 | 22.37 | 2.59 | 0.27 | ||||||
© 2018 by the author. Licensee MDPI, Basel, Switzerland. This article is an open access article distributed under the terms and conditions of the Creative Commons Attribution (CC BY) license (http://creativecommons.org/licenses/by/4.0/).
Share and Cite
Fickert, T. Better Resilient than Resistant—Regeneration Dynamics of Storm-Disturbed Mangrove Forests on the Bay Island of Guanaja (Honduras) during the First Two Decades after Hurricane Mitch (October 1998). Diversity 2018, 10, 8. https://doi.org/10.3390/d10010008
Fickert T. Better Resilient than Resistant—Regeneration Dynamics of Storm-Disturbed Mangrove Forests on the Bay Island of Guanaja (Honduras) during the First Two Decades after Hurricane Mitch (October 1998). Diversity. 2018; 10(1):8. https://doi.org/10.3390/d10010008
Chicago/Turabian StyleFickert, Thomas. 2018. "Better Resilient than Resistant—Regeneration Dynamics of Storm-Disturbed Mangrove Forests on the Bay Island of Guanaja (Honduras) during the First Two Decades after Hurricane Mitch (October 1998)" Diversity 10, no. 1: 8. https://doi.org/10.3390/d10010008