Article

Effect of Climatic Conditions and Land Cover on Genetic Structure and Diversity of Eunica tatila (Lepidoptera) in the Yucatan Peninsula, Mexico

by
Laura Elena Cavanzón-Medrano
1,
Salima Machkour-M’Rabet
1,*,
Landy Rubí Chablé-Iuit
1,
Carmen Pozo
2,*,
Yann Hénaut
3 and
Luc Legal
4
1
Laboratorio de Ecología Molecular y Conservación, El Colegio de la Frontera Sur (ECOSUR). Av. Centenario km 5.5, C.P., Chetumal 77014, Quintana Roo, Mexico
2
Museo de Zoología, El Colegio de la Frontera Sur (ECOSUR). Av. Centenario km 5.5, C.P., Chetumal 77014, Quintana Roo, Mexico
3
Laboratorio de Conducta Animal, ECOSUR. Av. Centenario km. 5.5, C.P., Chetumal 77014, Quintana Roo, Mexico
4
EcoLab, Université de Toulouse, CNRS, INPT, UPS, 31062 Toulouse, France
*
Authors to whom correspondence should be addressed.
Diversity 2018, 10(3), 79; https://doi.org/10.3390/d10030079
Submission received: 18 June 2018 / Revised: 28 July 2018 / Accepted: 29 July 2018 / Published: 2 August 2018
(This article belongs to the Special Issue Butterfly Conservation)

Abstract

:
Fragmentation is the third cause of the biodiversity declination. Population genetic studies using Lepidoptera as the model species in the context of loss of habitat are scarce, particularly for tropical areas. We chose a widespread butterfly from Mexico as the model species to explore how changes of habitat characteristics (undisturbed forest, anthropogenic disturbances, and coastal areas), and climatic conditions affect genetic diversity and population structure. The Nymphalidae Eunica tatila is a common species in the Yucatan Peninsula considered to be a bio-indicator of undisturbed tropical forest, with migratory potential and a possible sex-biased dispersal. We genotyped 323 individuals collected in eight undisturbed areas, using four Inter Simple Sequence Repeats primers. Results show a high genetic diversity and no population structure. Temperature and shrub density present a positive and significant relationship with polymorphism values. Furthermore, our results show the positive effect of surrounding forest habitat on genetic diversity, confirming that E. tatila is a bio-indicator of undisturbed tropical forest. We found evidence of sex-biased dispersal. This paper represents one of the few studies on population genetics of tropical butterfly in a fragmented landscape and is, therefore, an important step in understanding the impact of habitat fragmentation on the risk of a butterflies’ decline.

1. Introduction

The impact of habitat fragmentation on biology and biodiversity is one of the most important issues of this century. Fragmentation results in the reduction of the total habitat by transforming large and continuous areas of habitat into smaller and isolated fragments within a matrix, defined as zones of now-inhospitable terrain between patches [1,2] However, the way that the species perceived the patch and the matrix differed between them, making an important difference in regard to the level of isolation [3]. Fragmentation may be caused by natural processes (e.g., fire and wind, etc.) or human activities (e.g., agriculture and urbanization, etc.) [1], and often results in a reduction in population size, thus, decreasing genetic diversity and connectivity [2]. Connectivity in a fragmented habitat can be considered as structural if only landscape structure is considered, or functional when movements of individuals (or genes) into the landscape are addressed [4].
Short lifecycles and variability for their resilience capacities make insects good bio-indicators [5]. Many studies have demonstrated the advantages of Lepidoptera as bio-indicators in tropical [6,7,8,9] or temperate [10,11] ecosystems. For the Yucatan Peninsula, Pozo (2006) [12] endorsed nine butterfly species as environmental indicators of undisturbed tropical forest and seven for disturbed tropical forest.
Dispersal capacity of species, movement of individuals leading to gene flow among local populations, is a key factor for the permanence of species. Over the last several decades, many studies have shown the complexity of the causes involved in the dispersal process (see reference [13] for a review). Many ecological, phenotypical, environmental, and social conditions [13], were investigated to understand butterfly dispersal, but one important inherent factor is the sex of individuals. Ducatez et al. (2013) [14] demonstrated that habitat connectivity in a fragmented landscape is sex-dependent, with male flight capacities increasing with decreasing habitat connectivity, while females present an inverse pattern. Many butterfly species have high vagility, and their ability to fly may be considered as a contributing factor to genetic homogenization [15]. Consequently, a high level of gene flow between populations of these species was expected. However, recent studies have contradicted this assertion, demonstrating that natural processes of fragmentation can strongly affect population structure. Machkour-M’Rabet et al. (2014) [16] presented evidence that a natural barrier, such as a major river, can result in more differences between nearby populations of Baronia brevicornis Salvin, 1893 (Lepidoptera: Papilionidae) than large geographic distances within a homogeneous landscape. Leidner and Haddad (2010) [17] provided evidence that natural barriers affect the dispersal of the coastal endemic crystal skipper butterfly (Atrytonopsis quinteri Burns, 2015; Lepidoptera: Hesperiidae) to a larger degree than urbanization. Anthropogenic fragmentation, such as agriculture generating a matrix of non-habitat (no native vegetation), produces a loss of genetic diversity as shown for the speckled wood butterfly (Pararge aegeria Linnaeus, 1758; Lepidoptera: Nymphalidae) in Belgium, where genetic diversity was significantly higher in continuous woodlands than in fragmented and isolated woodlands [18]. Williams et al. (2003) [19] working on Speyeria idalia Drury, 1773 (Lepidoptera: Nymphalidae) demonstrated that populations present an increase in genetic differentiation while the connectivity among them decreases. Álvarez et al. (2005) [20] emphasize the importance of butterfly dispersal, showing that species with a lower dispersal capacity present less gene flow; therefore, natural and anthropogenic barriers represent an important barrier for such species. Butterfly abundance and population size are, in part, related to environmental and climatic conditions (humidity, temperature, rainfall, plant density, patch size, and nectar abundance among others) [21,22] and could determine the level of genetic diversity of a population [23].
The Yucatan Peninsula is a biodiversity hotspot and is considered as a priority area for conservation [24]. The Yucatan Peninsula, situated in southeastern Mexico, includes three Mexican states: Quintana Roo, Campeche, and Yucatan. The region presents annual mean temperatures that range from 18 °C to 28 °C and annual rainfall between 500 mm to 1800 mm. Its vegetation is typical of a tropical region, with evergreen, semi-evergreen, deciduous, and semi-deciduous forest, as well as lowland floodplain and wetland [25,26]. The Yucatan Peninsula has a simple topography with lack of evident geographical barriers and low habitat heterogeneity [27]. Due to its position, the Yucatan Peninsula is hit by hurricanes on the east coast with a gradient of humidity that determines extensive areas, from northeast to southwest, with deciduous or semi-deciduous forests [27,28]. The Yucatan Peninsula has several protected areas, some are official and others under private control. The predominant economic activity varies from the north to the south of the Peninsula: In the north, tourism dominates while the south depends more on agriculture and livestock activities. The dry tropical forests of the Yucatan Peninsula have been exploited since the time of the Mayas; one of the main theories of the collapse of the Mayan civilization is the deteriorating environment that was caused by increased population density [29]. A second overexploitation of resources commenced in 1880 with the initiation of timber exploitation [30]. More recently, the transformation of forest to an agricultural landscape is the main cause of deforestation in the Yucatan Peninsula, as well as the high development of human activities and infrastructure, particularly in Quintana Roo state [30]. In this context, the Yucatan Peninsula is a perfect example of how fragmentation, principally because of human activities, may affect species, their genetic diversity, and the connectivity between populations. Then, butterflies from the Yucatan Peninsula may provide an excellent model to understand the effect of the fragmentation on the genetic diversity of tropical butterflies.
According to Pozo et al. (2011) [31], 550 species of butterflies have been recorded and widely studied in the Yucatan Peninsula, attaining a significant amount of knowledge regarding their taxonomy, ecology, and distribution [21,31,32,33,34,35,36]. In the Yucatan Peninsula, one of the most abundant butterfly species in undisturbed areas is Eunica tatila Herrich-Schäffer, 1855 (Lepidoptera: Nymphalidae). Eunica tatila is one of the most common and widespread species in the Eunica genus. It is native to the Neotropics, and presents three subspecies (see reference [37] for details; Figure S1). However, our recent study [37] based on morphological and morphometrical analysis, highlighted the possibility of mixed individuals between two subspecies, E. tatila and E. tatila tatilista, the latter a subspecies from southern Florida and the West Indies. Therefore, we use the name of the specie, E. tatila, until this issue is resolved. As Eunica tatila has been identified as a bio-indicator species of undisturbed areas in the Yucatan Peninsula [34], as well as having a widespread distribution and high population density in the Yucatan Peninsula, this species represents a good candidate to understand the effect of fragmentation.
Our goal is to evaluate the effect of land cover and climatic conditions on the genetic diversity and population structure of E. tatila. This study will attempt to answer the following research questions: (i) Has genetic diversity been affected by climatic conditions and/or land cover? (ii) Has the distance between preserved patches affected the connectivity of E. tatila populations? (iii) Does E. tatila present a metapopulation in the Yucatan Peninsula? and, finally, (iv) Does E. tatila present signs of sex-biased dispersal?

2. Materials and Methods

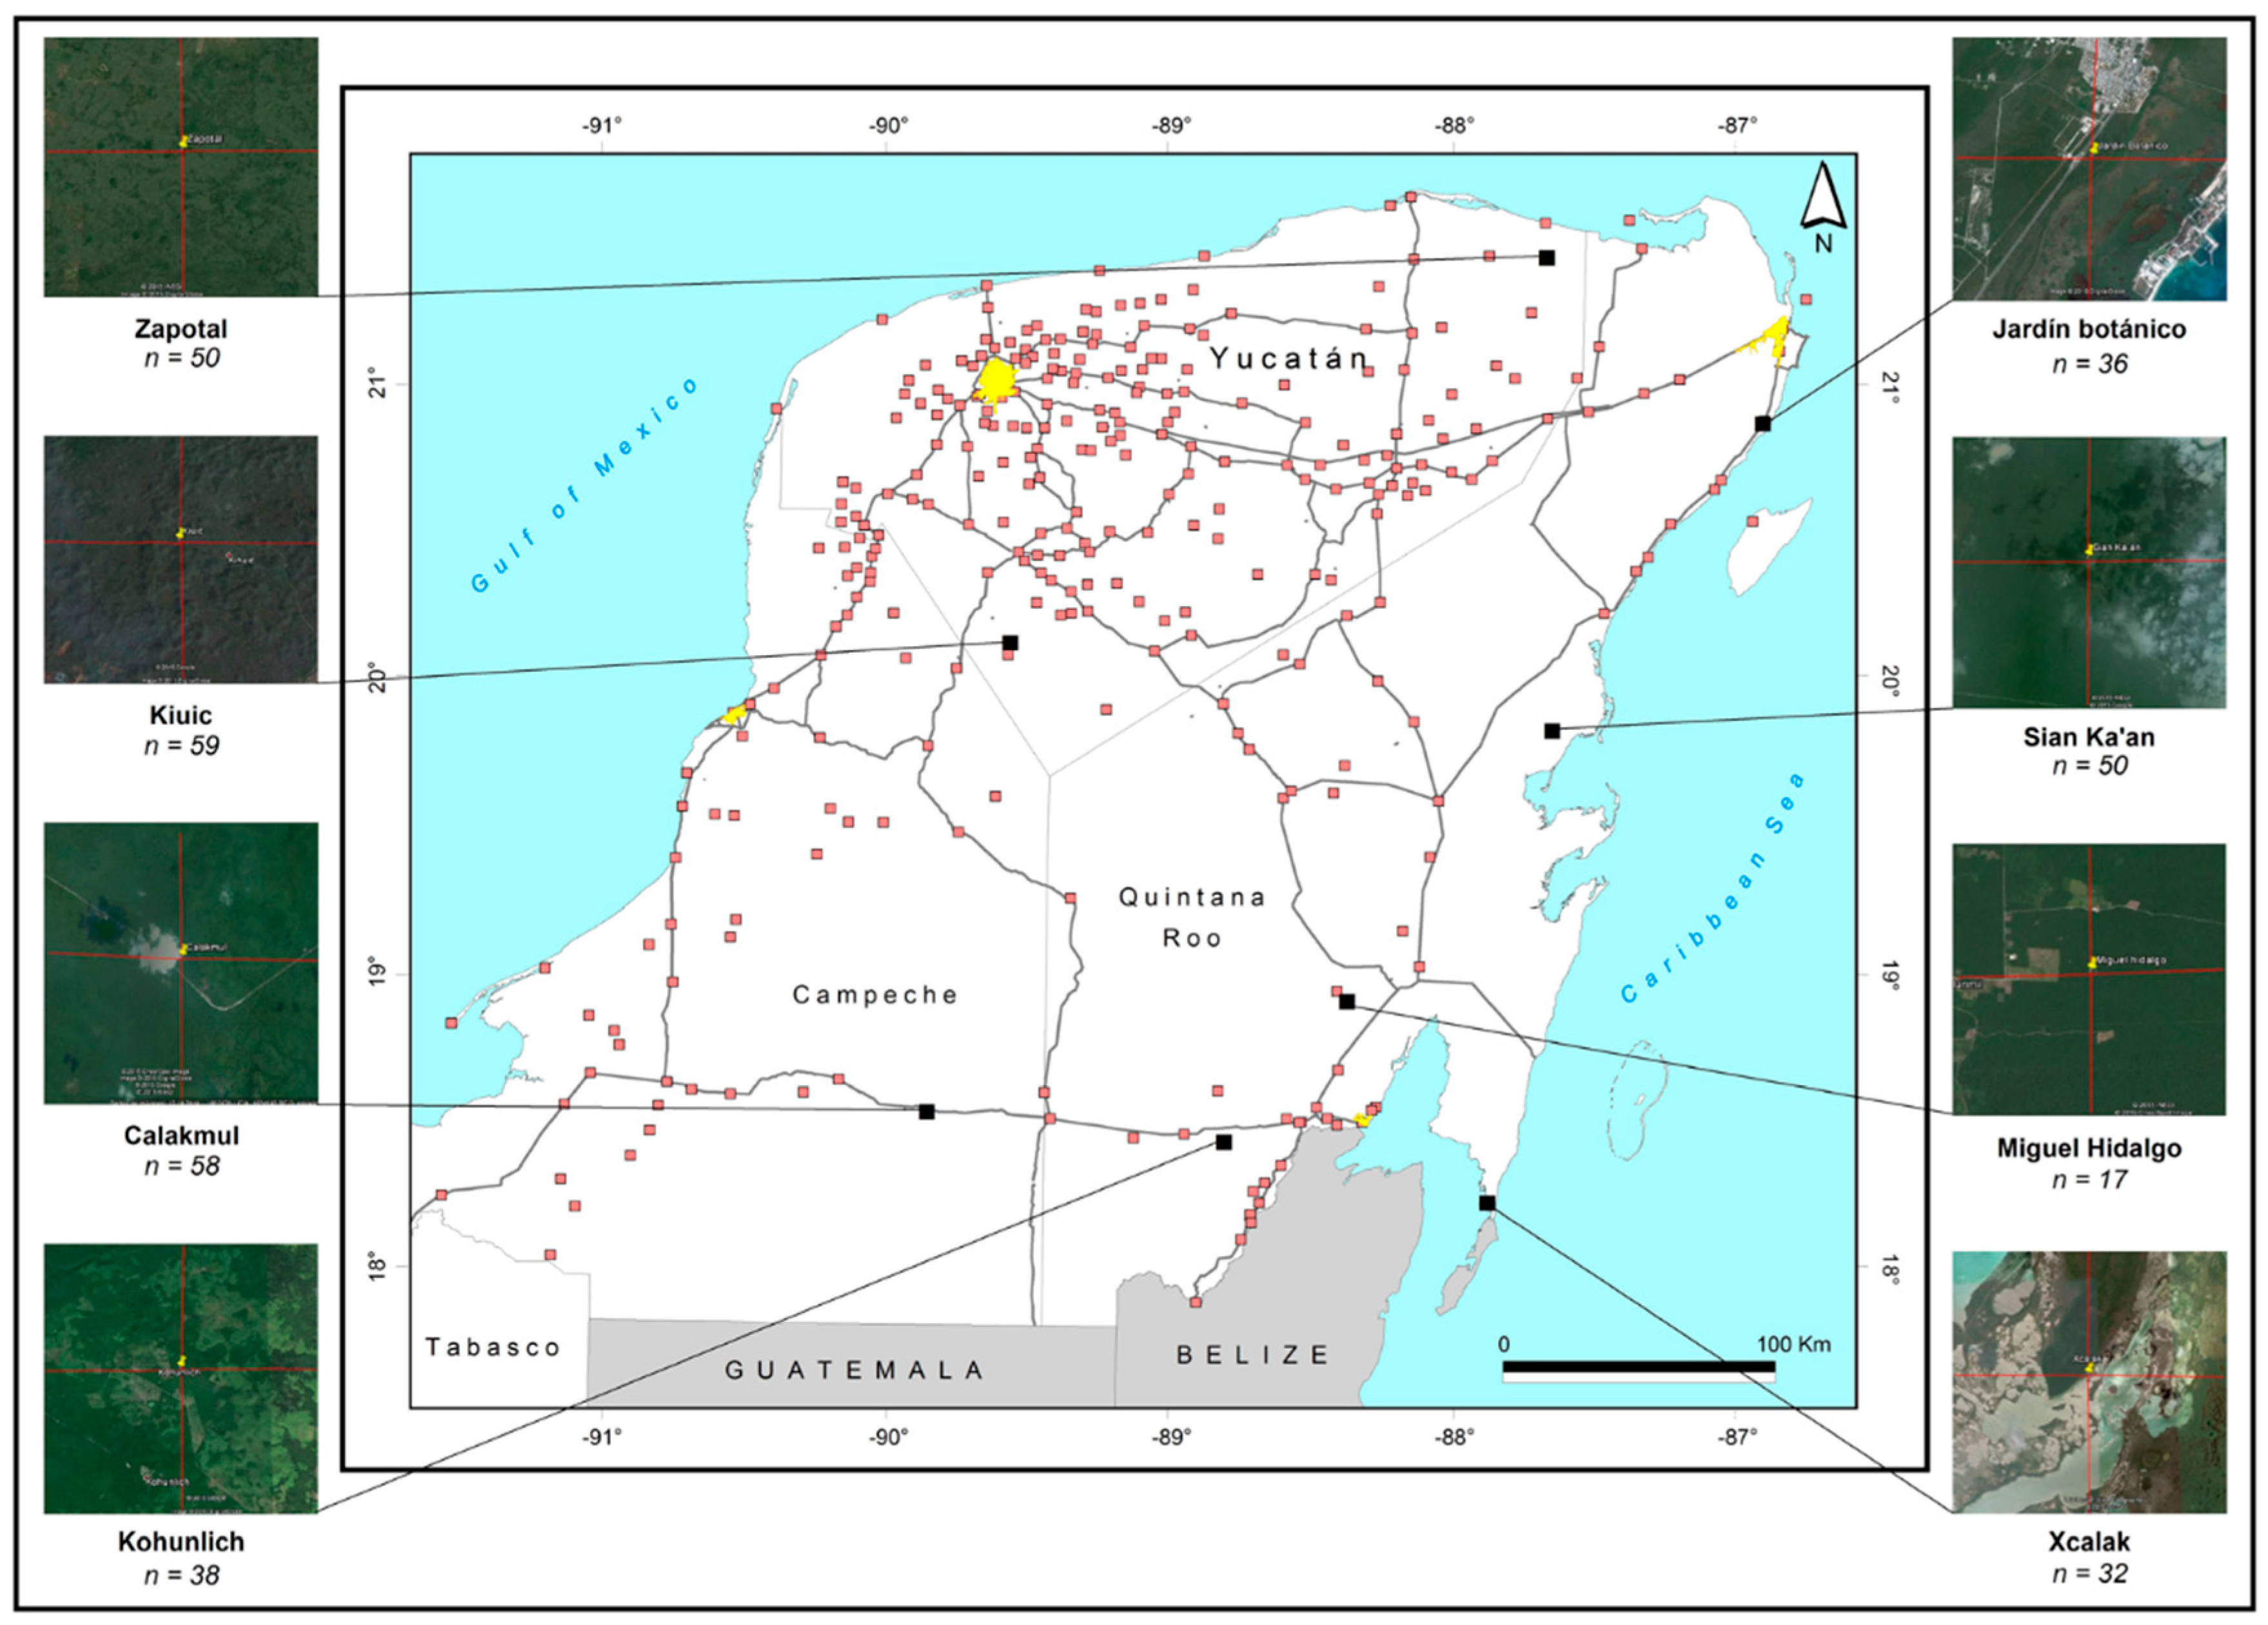
2.1. Study Sites and Butterfly Samples

All individual butterflies were collected from eight undisturbed (>20 years without human perturbations) protected areas in the three states of the Yucatan Peninsula (Figure 1). One site was located in Campeche state: (1) “Reserva de la Biosfera de Calakmul” (CK; 18°31′ N–89°49′ W) which has federal protection and a total area of 723,185 ha. Two sites were located in the Yucatan state: (2) “El Zapotal” (ZP; 21°23′ N–87°40′ W), which is a private reserve and covers a total area of 2358 ha, (3) “Reserva Biocultural Kaxil Kiuic” (KU; 20°05′ N–89°33′ W) which is also privately protected, with a total area of 1650 ha. In the state of Quintana Roo we collected at five different sites: (4) “Kohunlich” (KH; 18°25′ N–88°47′ W), an archeological site under federal protection with an area of 8.5 ha, (5) “Miguel Hidalgo” (MH; 18°54′ N–88°21′ W) a village near the town of Bacalar which receives community protection (an area of 2262 ha), (6) “Parque Nacional Arrecifes de Xcalak” (XC; 18°14′ N–87°52′ W) with federal protection and an extension of 4543 ha of terrestrial protection, (7) “Reserva de la Biosfera Sian Ka’an” (SK; 19°48′ N–87°38′ W), a federal protected area with 375,012 ha of terrestrial protection, and finally, (8) “Jardín Botánico Dr. Alfredo Barrera Marín” (JB; 20°50′ N–86°54′ W) protected by the “Consejo Nacional de Ciencia y Tecnologia (CONACYT)” since 1982, covering an area of 65 ha.
During the sampling (2013), some variables were registered: (1) Climatic conditions (rainfall, humidity, and temperature; annual mean over data from the collection year) were measured using data from the national meteorological stations (http://smn.cna.gob.mx/es/emas) nearest to each site, (2) ecological conditions with tree density (10 quadrants of 400 m2), shrub density (10 quadrants of 25 m2), and herbaceous plant density (10 quadrants of 1 m2) [38], and, finally, (3) patch area (taken from the conservation management plan of each area). Furthermore, landscape constitution was evaluated as follows: A 16 km2 square around each sample point was examined (2 km from a central point to each cardinal side using GOOGLE EARTH; Figure 1). Within these squares, a 100 m × 100 m grid pattern was drawn, and we recorded the proportion of forest area, coastal area (marine and mangrove ecosystems), and anthropogenic perturbations (road, agriculture, urbanization, and livestock). Environmental conditions and landscape constitution in each area are summarized in Table 1.
We sampled a minimum of 30 butterfly individuals per site during the rainy season (from June to August), which corresponds to peak abundance for E. tatila [39]. We used 20 Van Someren-Rydon traps [40] per site, baited with banana, pineapple, beer, and sugar [41]. The traps were placed at a height of approximately 2 m during the adult flight period (from 9:00 a.m. to 5:00 p.m.). Most of the attracted nymphalids flying within a radius of 4–5 m around the bait are trapped [40,42]. All E. tatila individuals were sexed, kept separately in labeled glassine bags, and geo-referenced (Garmin eTrex 20, Kansas City, MO, USA). Other species of butterflies captured in the traps were released. In the laboratory, the abdomen was cut from each individual, placed in 96° ethanol, and conserved at 4 °C until DNA extraction. Voucher specimens were deposited at the Lepidopterology collection of the “Museo de Zoologia” El Colegio de la Frontera Sur-Chetumal, Mexico.

2.2. DNA Extraction

A small part of the anterior region of the abdomen was cut off, and genomic DNA was extracted using the Wizard Genomic DNA Purification Kit (Promega, Madison, WI, USA) following the manufacturer’s instructions and stored at −20 °C until amplification. To determine the concentration and quality of DNA, we used a Qubit®2.0 fluorometer (Invitrogen, Carlsbad, CA, USA), and agarose gel (1% with TAE buffer 1X; Promega, Madison, USA) followed by a post-gel staining method using GelRed™ (Biotum, Fremont, CA, USA).

2.3. ISSR-PCR Amplification

The Inter Simple Sequence Repeats (ISSR)-PCR method is employed on plants and animals. This technique is largely employed for genetic population and phylogenetic studies between closely-related species [16,43,44,45,46]. It provides highly reproducible results and generates abundant polymorphism in many systems. The advantage of ISSR is that primers work universally for most animal and plant species. Thus, there is no need to define PCR primers for individual species as in microsatellite analysis [47]. Furthermore, this method demands fewer experimental steps and is relatively easy to perform. The use of dominant markers can be considered worthwhile in organisms for which no genomic information are available [48] as is the case for many butterfly species [49]. In addition, microsatellites are inherently difficult to use in butterflies, partially due to the high frequency of null alleles [49]. Therefore, ISSR genetic markers have been widely applied in studies on butterfly population genetic [15,16,17,43,48,50,51,52,53,54,55,56,57].
We tested 23 different ISSR primers, and selected a total of four that presented good resolution, high number of bands, and permitted a sufficient total number of bands to carry out an analysis [58,59]: (GAG)5GC, (AG)8YC, (GA)8C, (AC)8C (Table 2). PCR amplifications were optimized as following: 15 µL reaction volume containing ~20 ng of template DNA, 1.5 µL of 5X Green Buffer (Promega), 200 µM of each dNTP (dNTP mix; Promega, Madison, USA), 3 mM MgCl2 (Promega, Madison, USA), 1 µM of primer (Integrated DNA Technologies), 1.25 U of GoTaq Flexi DNA Polymerase (Promega, Madison, USA), and, finally, the volume was adjusted with ultrapure water. All amplifications were conducted in a T100 Thermal Cycler (Bio-Rad™, Hercules, USA) under the following conditions: Initial denaturation step at 94 °C for 4 min, 39 cycles of denaturation at 94 °C for 45 s, annealing temperature (Ta) from 54 °C to 63 °C depending on the ISSR primer (Table 2), extension temperature at 72 °C for 2 min, and a final extension at 72 °C for 10 min. Amplification products were separated by electrophoresis (110 V for 2 h) using 3 µL of amplified product on agarose gels (2% in a 1X TAE Buffer, Promega, Madison, USA), and a 100 bp DNA Ladder (Promega, Madison, USA) was used as reference for fragment length. The bands were detected with a mix of GelRed™ (20 µL) (Biotum, Fremont, USA) and Blue/Orange Loading Dye Promega (500 µL) under UV light and digitized using an Imaging System (PhotoDoc-it UVP®, Upland, CA, USA).

2.4. Molecular Analysis

The ISSR markers are treated as dominant markers, amplified fragments were scored as binary information where the presence of a band represents a dominant allele (1), and absence represents a recessive allele (0). Applying this principle, a binary data matrix was generated for all individuals and the four ISSR markers used. Only bands consistent among all individuals were used for analysis.

2.5. Genetic Diversity

We determined the following informative parameters at each locality: Number of private bands (PB) and number of rare bands (RB). The binary matrix was used to assess the standard genetic diversity parameters at each locality and for the whole dataset (Yucatan Peninsula scale): Percentage of polymorphic loci (PPL) and expected heterozygosity (He) using corrected allele frequencies [60] implemented in GENALEX 6.5 [61,62]. The differences in He among all localities were evaluated by applying a one-way analysis of variance (ANOVA) using STATISTICA 7.0.

2.6. Relation among Genetic Diversity, Environmental Conditions, and Land Cover

To put in evidence, the relationship among genetic diversity parameters (PPL and He) and all environmental (climatic and ecological parameters) and land cover conditions, a multidimensional scaling analysis (MDS) was applied. Furthermore, we quantified the correlations between butterfly genetic diversity (PPL and He) and environmental conditions, land cover, and forest patch size with Spearman statistics (r and p) using STATISTICA 7.0. Finally, to examine the global influence of land cover conditions on genetic diversity (PPL and He), we determined the proportional mean values of both genetic parameters for each kind of land cover. Significance among the three levels of land cover was compared with a Kruskall-Wallis test, and, if required, a post-hoc comparison was implemented using STATISTICA 7.0.

2.7. Population Differentiation and Genetic Structure

To evaluate genetic differentiation in the Yucatan Peninsula, and for all population pairs, we determined coefficients of gene differentiation (Gst) and the PhiPT (ΦPT, 999 permutations) using POPGENE 1.32 [63] and GENALEX 6.5 respectively. The ΦPT parameter (analogous to FST and RST) is a measure of genetic structuring which allows a comparison between codominant and haploid/binary data [61,62]. Genetic structure and variability within and between populations were determined using a non-parametric analysis of molecular variance (AMOVA) [64] (999 permutations). Isolation-by-distance (IBD) was analyzed by plotting geographic distances (km) against PhiPT (ΦPT) parameters determined between population pairs. The significance of such correlation was tested using the Mantel’s test (999 permutations). These analyses were performed using GENALEX 6.5. Finally, to evaluate the genetic structure of E. tatila, we applied the Bayesian genetics model implemented in STRUCTURE 2.3.1 [65,66] to infer the potential number of populations in our study. This method is designed to identify K clusters for butterfly populations and to assign each individual to one cluster or more, if genotypes indicate intermixing [65]. To determine the number of K populations (clusters), the program was run five times for different values of K (from 1 to 8) to allow for deviations among different runs. The admixture and allele correlated frequencies model were used, and we ran the Markov Chain Monte Carlo (MCMC) algorithm with a burn-in period of 10,000 steps followed by another 10,000 steps. To determine the most probable number of K that best fits our data, we used a method that consists in identifying the maximum value of Lnp(D), or more specifically the value where the “more or less plateaus” begin [67].

2.8. Sex-Bias Dispersal Analysis

Analysis of IBD by sex was investigated by plotting the geographic distances (km) against genetic differentiation (ΦPT, 999 permutations), followed by a Mantel test to test the significance level of the relationship between both data matrices (genetic and geographic). Analyses were performed using GENALEX 6.5.

3. Results

Out of 350 individuals collected, 323 individuals (between 17 and 58 individuals for each locality, Table 1), were successfully amplified with ISSR primers. The four selected primers produced clear and reproducible fragments with a total of 119 ISSR fragments (or loci) scored (Table 2).

3.1. Genetic Diversity

Considering the whole dataset, the PPL was 83.7% (SE = 2.2%) and the expected heterozygosity (He) was 0.197 (SE = 0.005). At the locality level (Table 1), the values of PPL range from 76% (Miguel Hidalgo locality) to 92% (Sian Ka’an locality), while those of He from 0.182 (Zapotal locality) to 0.220 (Sian Ka’an locality). The ANOVA analysis did not present significant differences for expected heterozygosity among all localities (F7,944 = 0.59, p = 0.76). The number of private bands is very low (from 0 to 2; Table 1), confirming that all butterfly samples belong to the same species. The number of rare bands ranges from zero for the Miguel Hidalgo locality to 22 for the Zapotal locality (Table 1). A clear correlation between the number of individuals genotyped and the number of rare bands is observed (Pearson statistics: r2 = 0.67 and p = 0.013).

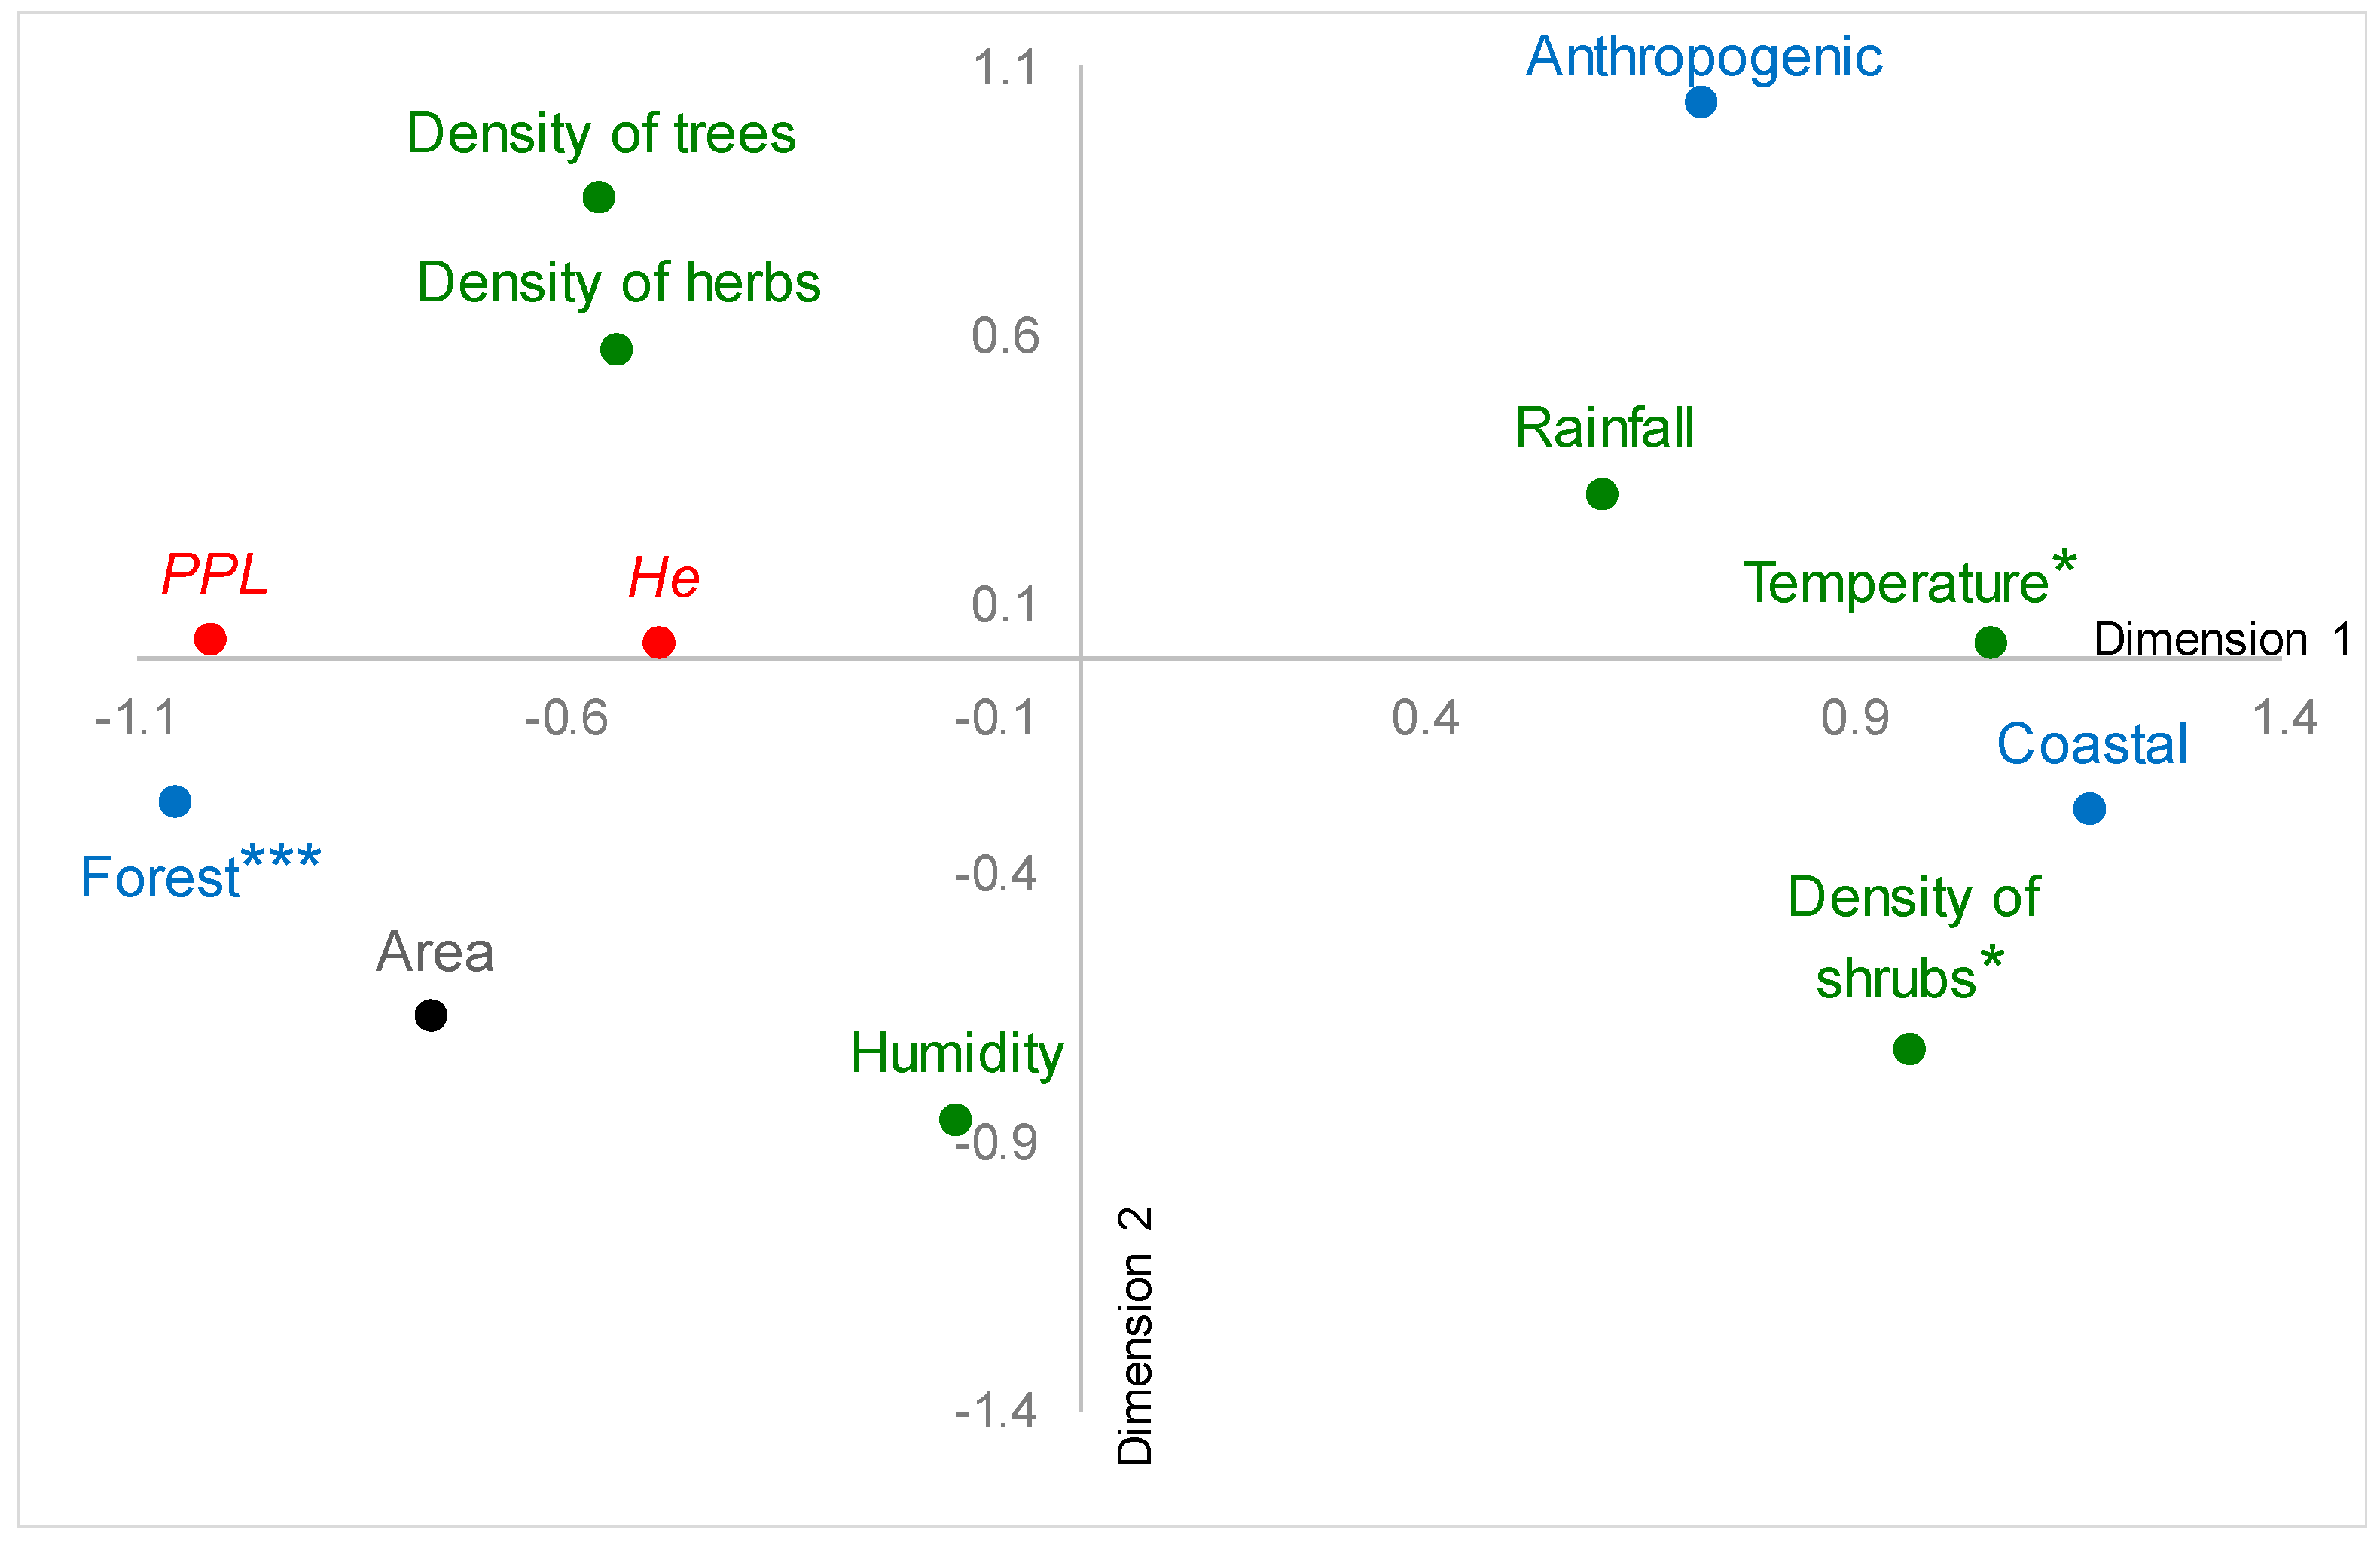
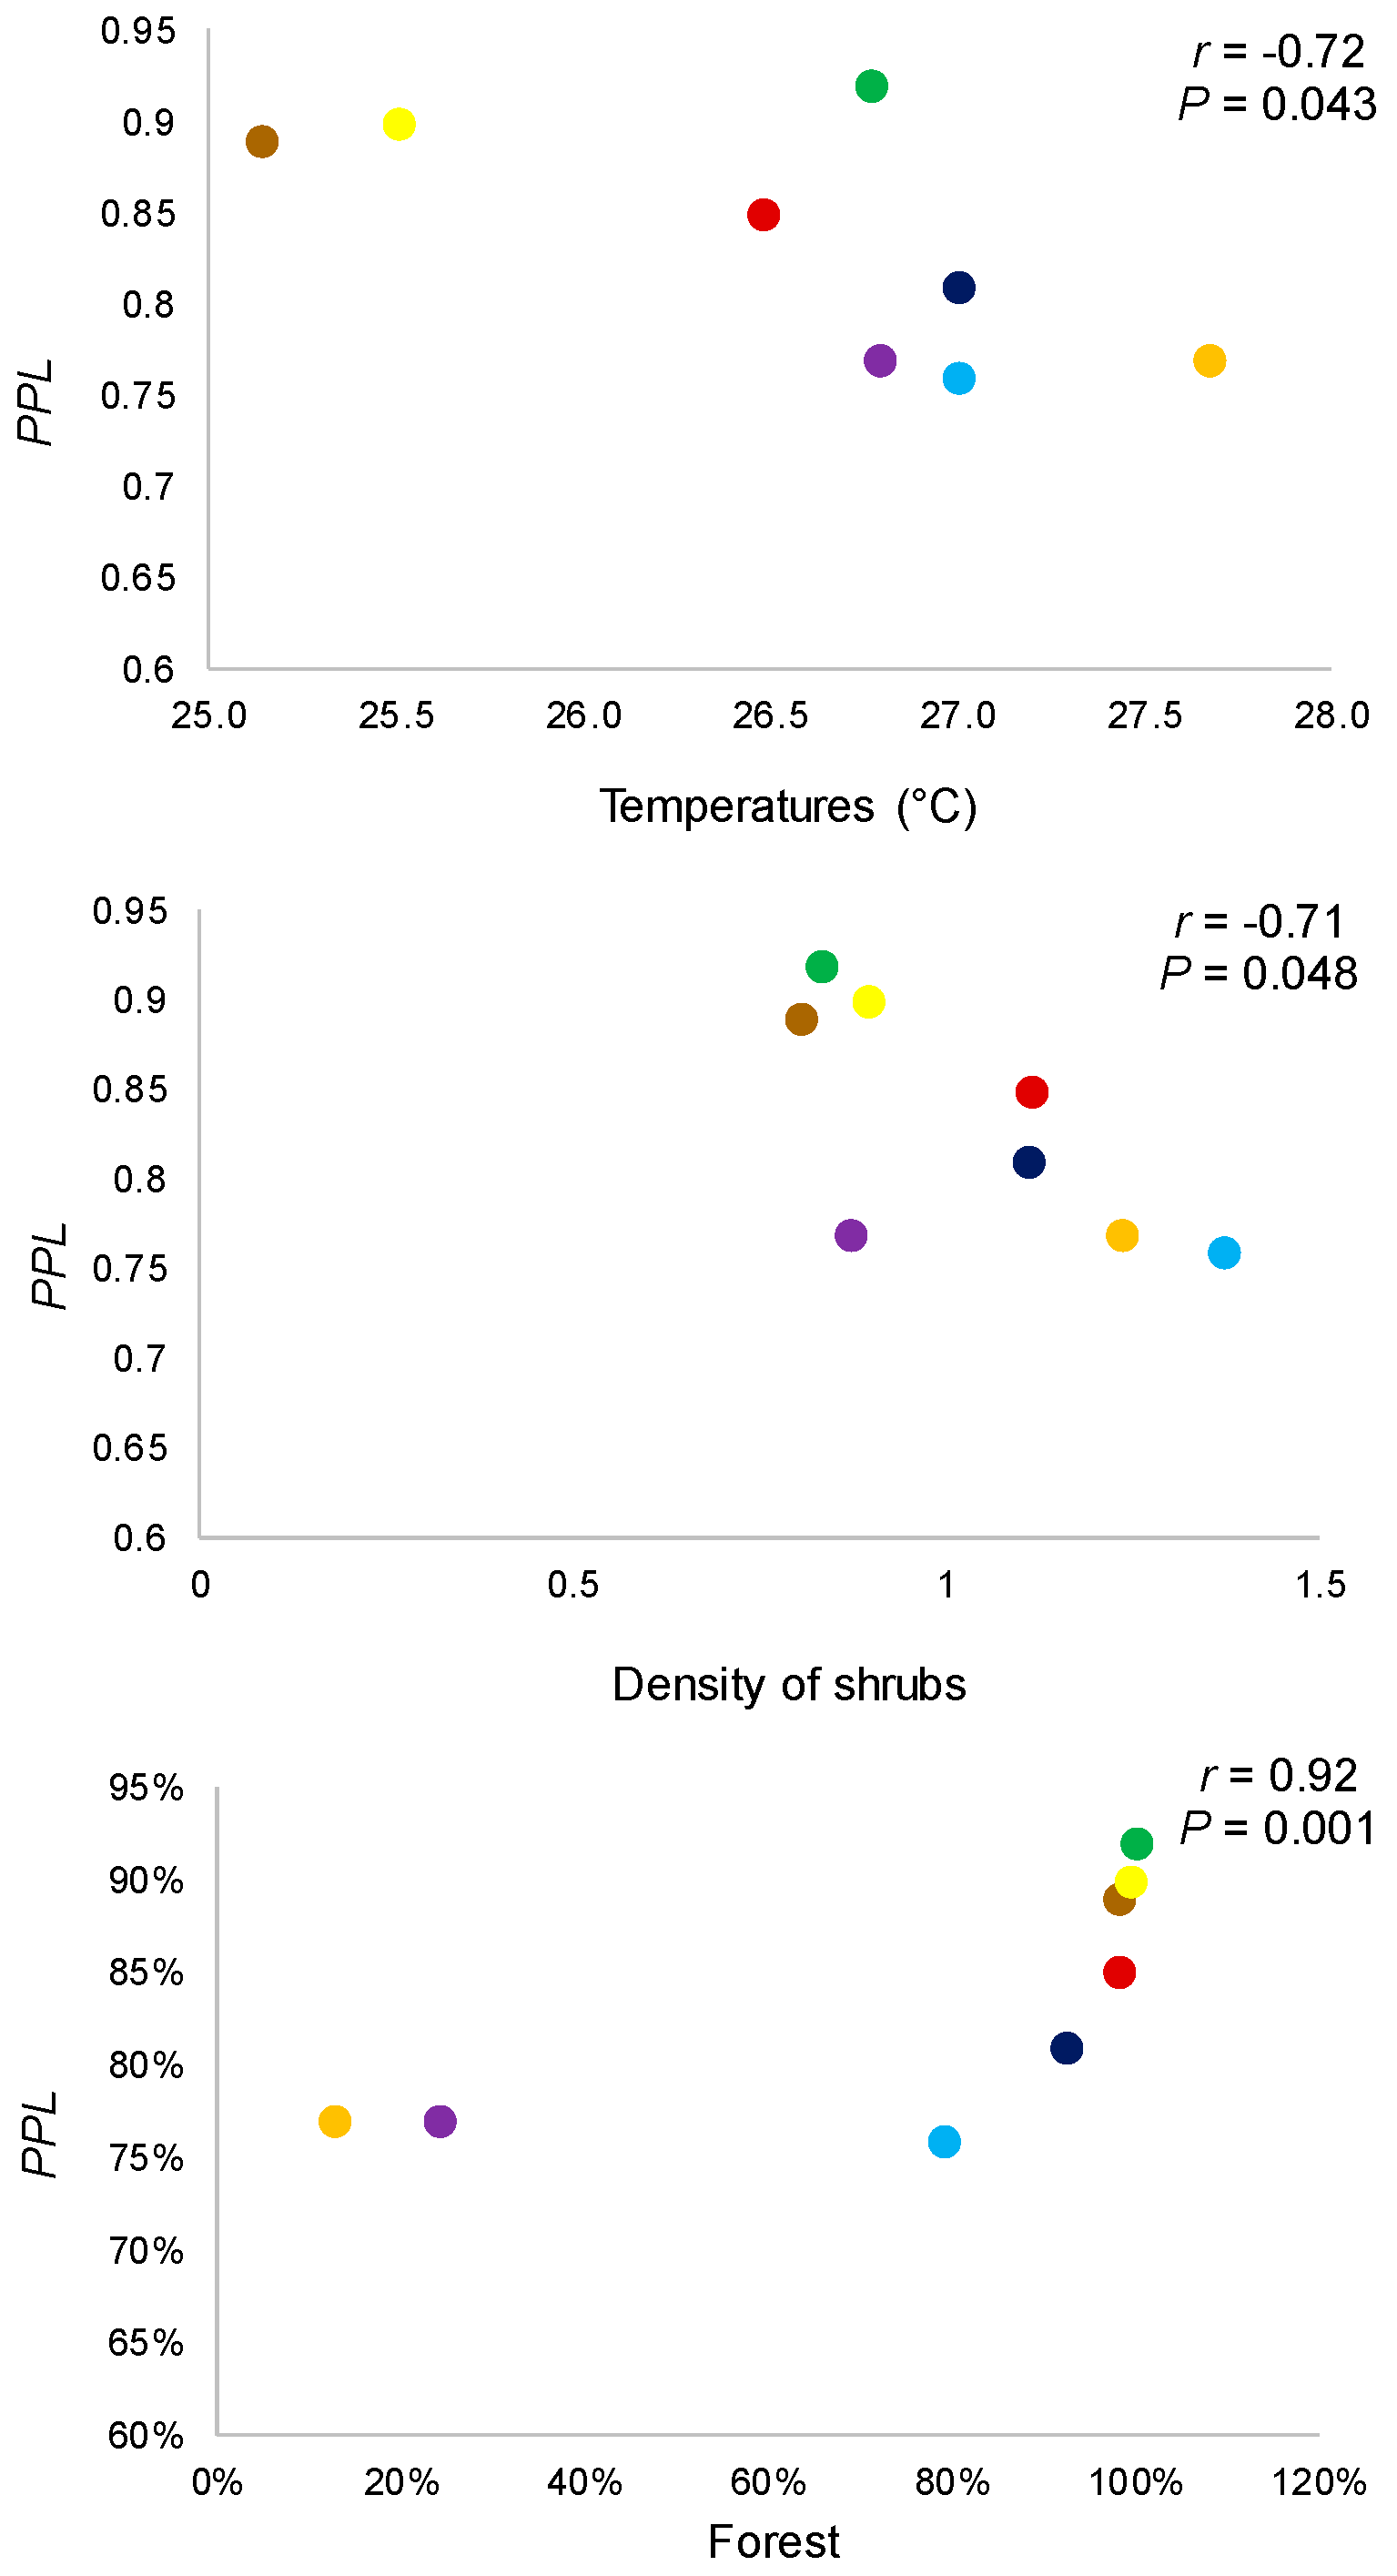
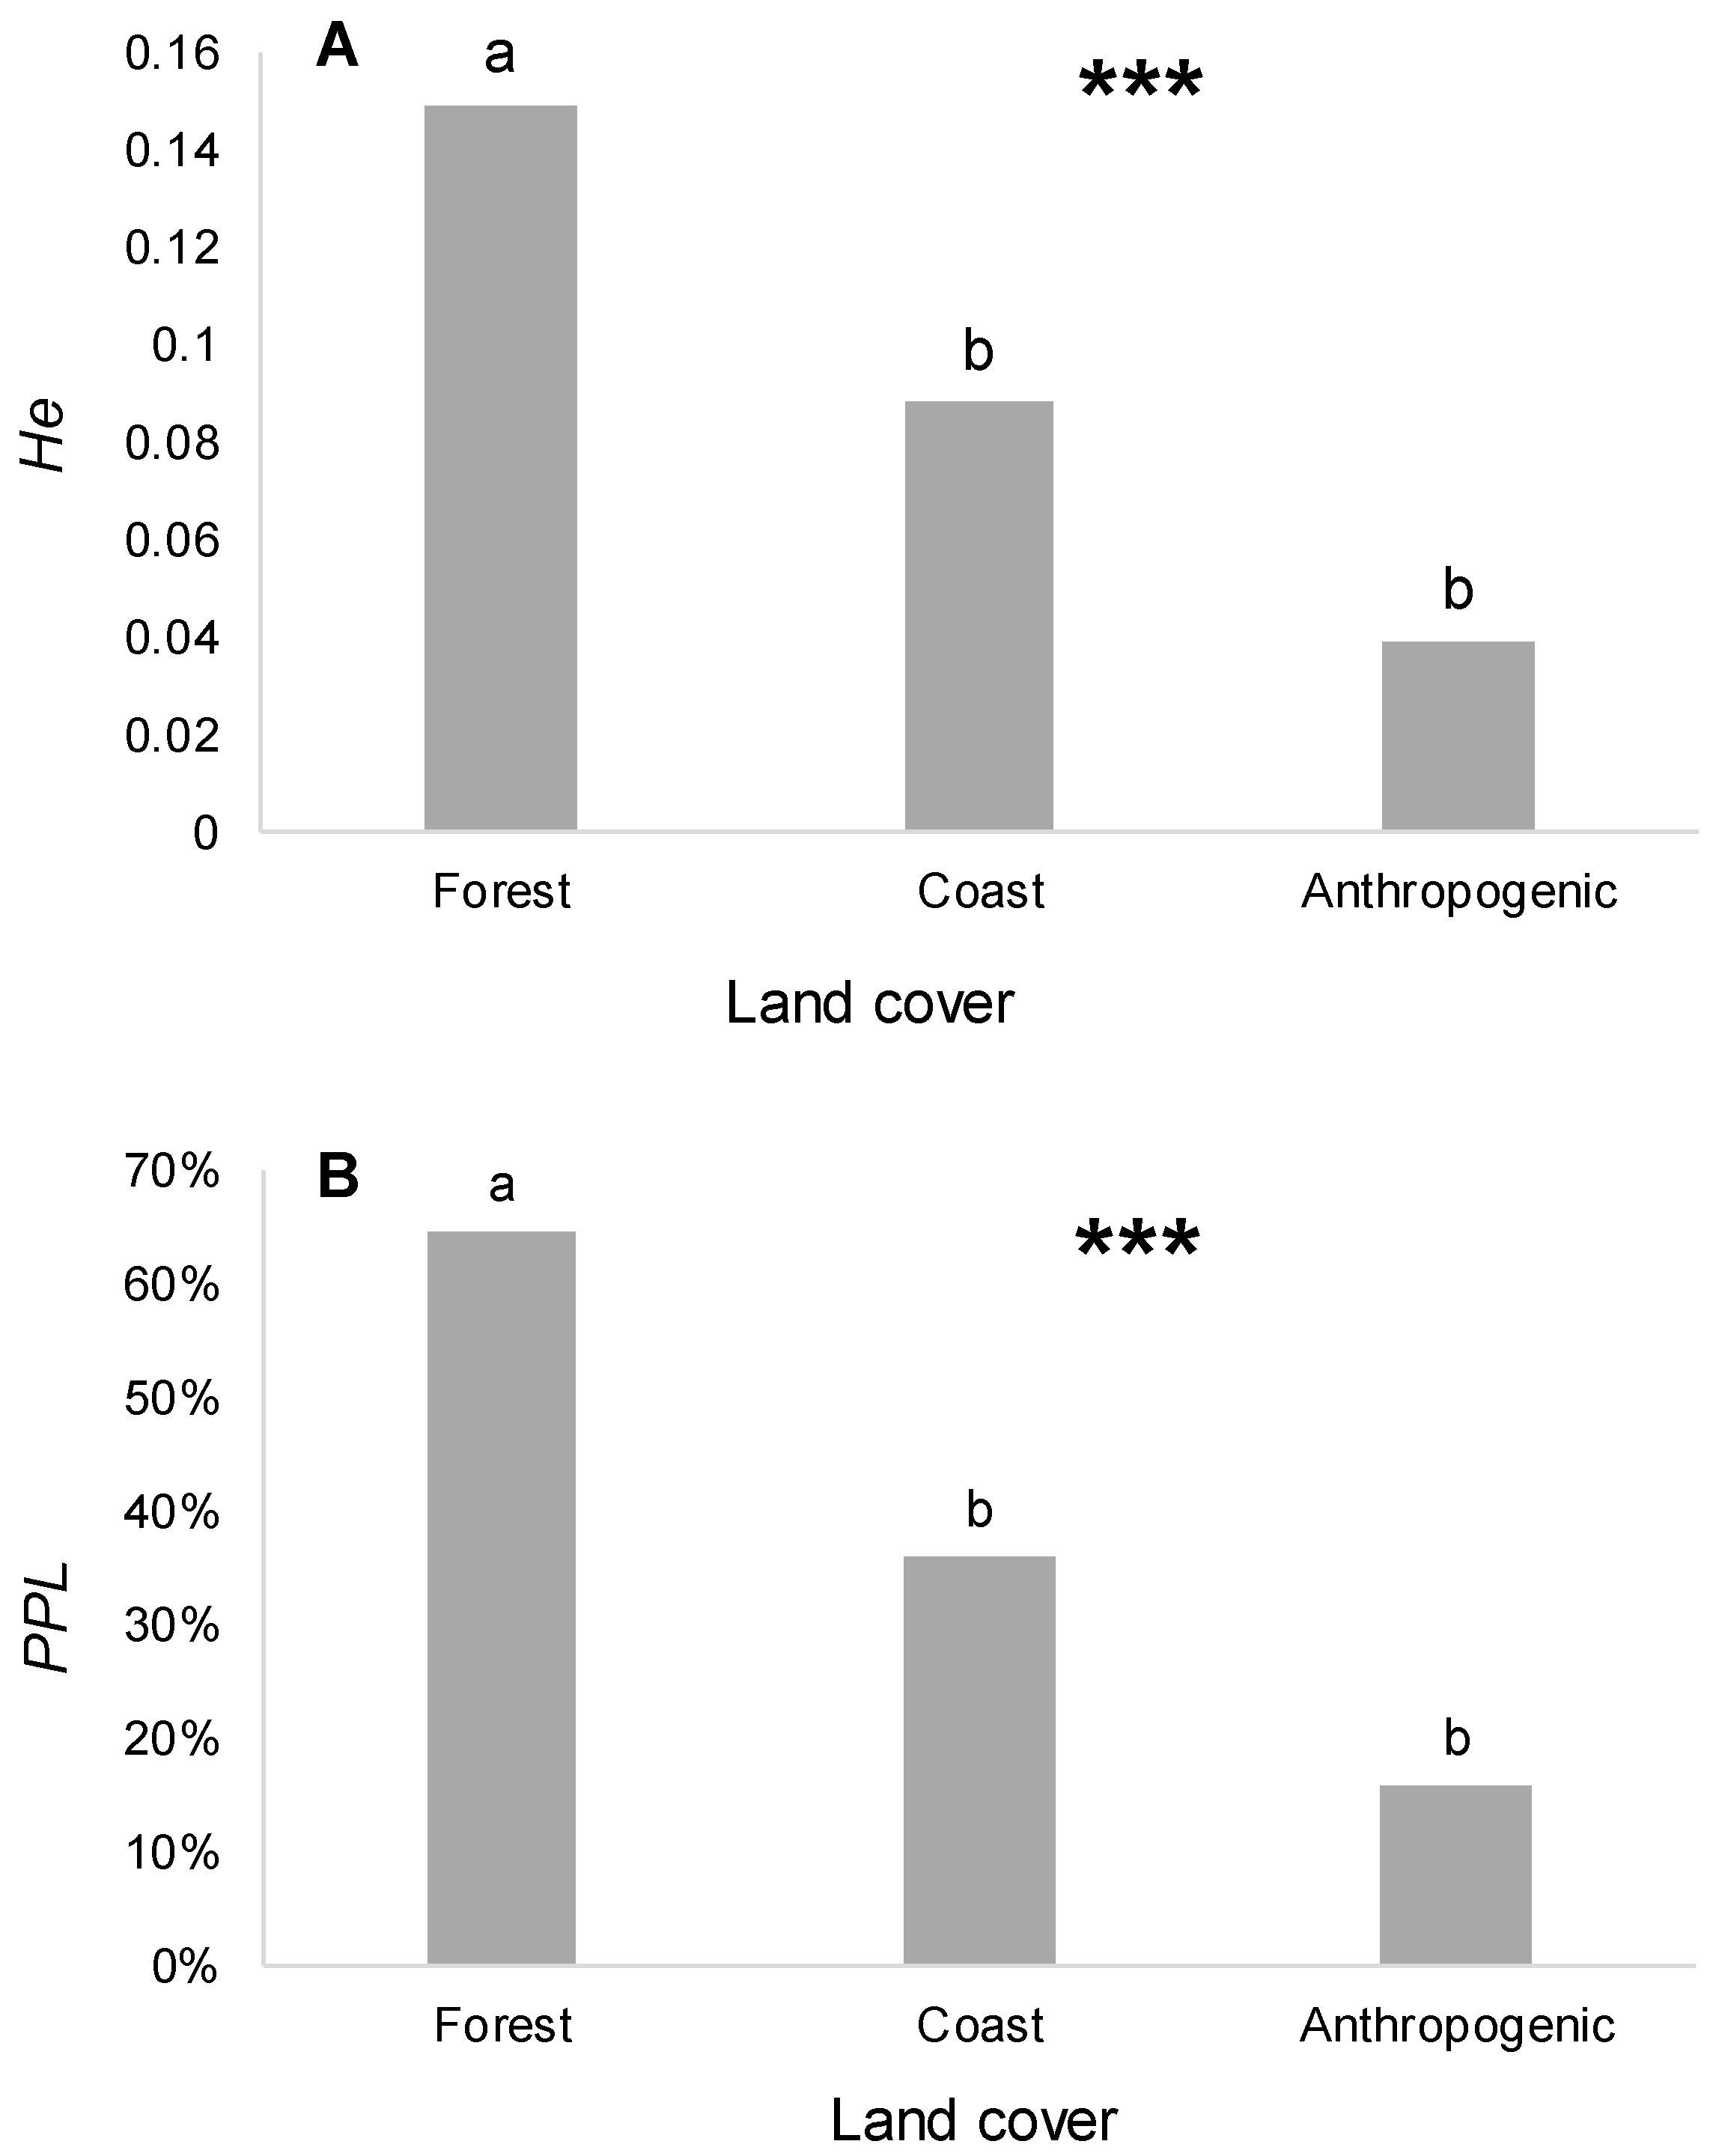
3.2. Relation among Genetic Diversity, Environmental Conditions, and Land Cover

The first dimension of the MDS analysis (Figure 2) shows clearly the positive relation between genetic diversity parameters (PPL and He) and proportion of undistributed forest, and to a lesser extent, the area size and the density of herbs and trees. Other two land cover conditions (anthropogenic and coastal area), as well as the other environmental conditions (temperature, rainfall, and density of shrubs), show a negative impact on genetic parameters. Spearman correlations indicate that PPL has a significant negative correlation only with shrub density (Spearman statistics: r = −0.71; p = 0.048) and temperature (Spearman statistics: r = −0.72; p = 0.043), and a significant positive correlation with proportion of undistributed forest (Spearman statistics: r = 0.92, p = 0.001) (Figure 3). Furthermore, we observed that below 80% of total land cover occupied by forest, values of PPL remain similar (approximately 77%), but when the proportion of forest habitat increased from 80% to 100%, an exponential increase of PPL values was observed. Additionally, the comparison of the mean values of genetic diversity (He and PPL) with the proportion of each type of land cover, for all localities, shows that genetic diversity is significantly higher when local populations are surrounded by undisturbed forest rather than in the presence of anthropogenic disturbances or coastal ecosystems (Kruskall-Wallis test for He: H = 13.84, df = 2, p = 0.001; for PPL: H = 13.84, df = 2, p = 0.001) (Figure 4). Patch size does not show a relationship with genetic diversity parameters (He and PPL; Figure S2).

3.3. Population Differentiation and Genetic Structure

Genetic differentiation among all localities was very low with GST = 0.044. Values of ΦPT among pairwise localities were always very low, ranging from 0.095 between the Miguel Hidalgo and Calakmul localities to 0.018 between the Kiuic and Sian Ka’an localities (Table 3). Generally, the Miguel Hidalgo locality presents the highest values of ΦPT with other populations. An AMOVA analysis showed that the principal source of variability is found between individuals within populations (96%), while only 4% of the genetic variability is attributable to diversity between populations (p = 0.001). When taking all localities into consideration, an analysis of IBD showed a positive and significant correlation (Mantel test: r = 0.039, p = 0.006) between pairwise PhiPT (ΦPT) values and geographical distances.
Population structure analysis, using probability assignments estimated by Structure, did not identify any evidence of structure. Indeed, when we plotted qi (estimated membership probability) for all individuals when K = 2 (Figure S3), all individuals present approximately equal proportions of membership to each cluster.

3.4. Sex-Bias Dispersal Analysis

Only the IBD analysis of females shows a significant correlation (females: Mantel test: r = 0.058, p = 0.008, Figure 5A; males: Mantel test: r = 0.028, p = 0.092, Figure 5B).

4. Discussion

Our results reveal that at a wide geographical scale, the E. tatila butterfly does not present genetic differentiation among localities, suggesting a metapopulation structure in the Yucatan Peninsula, Mexico. Therefore, although E. tatila is a bio-indicator species of undisturbed areas [34], the fragmentation and anthropogenic elements (e.g., cities, roads, crops) do not limit its dispersal among patches of undisturbed forest. Leidner and Haddad (2010) [17] also show that urban zones are not an obstacle to the dispersal of the endemic crystal skipper butterfly (A. quinteri). They argue that urbanization does not present a high degree of inhospitableness for this species of butterfly, as it can provide some food sources for adults, in addition to protection from predators and bad weather. Eunica tatila is a frugivorous species during its adult stage that feeds mainly on Manilkara zapota (L.) P. Royen (Sapotaceae), whereas the host plant reported in Florida for the immature stage is Gymnanthes lucida Swartz (Euphorbiaceae) [39,68]. Both plant species are abundant and widely distributed in the Yucatan Peninsula [69], even in cultivated or urbanized areas and along roads, because they are used in different ways by the locals. Ribeiro et al. (2012) [70] observed that the abundance of fruit-feeding butterflies is affected mainly by the immediate fragment surroundings instead the regional landscape as a whole. Furthermore, they emphasized that for the frugivorous butterflies, the action of the people living around the forest patches occupied by butterflies may contributed to its conservation more than the management strategies for the conservation of the population inside the fragment or in a bigger scale. The high abundance of host plants in the Yucatan Peninsula and the observation of Ribeiro et al. (2012) [70] could explain the facility for E. tatila to move between patches.
ISSR markers are very useful when studying contemporary changes because they can provide information on genetic structure during very recent isolation processes [45,50,71,72,73]. The high mobility of E. tatila, which is assumed to be partially a migratory species [74,75,76], together with the lack of geographical barriers in the Yucatan Peninsula and the distribution of the host plants, have resulted in the homogenization of genetic diversity [77], and consequently limiting the process of genetic erosion. Similar results were also demonstrated for other insect species, including butterflies, which demonstrate a high potential for dispersal [17,78,79]. Considering that E. tatila presents a metapopulation dynamic inside the Yucatan Peninsula region, we suggest the patchy populations model as defined by Harrison (1991) [80] where the high inter-patch dispersal produce an integrated demographic unit so the local patch population may not be shown as an independent population.
It is generally assumed that specialist species suffer more from the effects of fragmentation than generalist species [81]. Furthermore, the connectivity among patches is more important than the patches size [82], and the population reduction resulting from the habitat fragmentation in specialist species is higher for sedentary species [83]. Eunica tatila as a specialized species [84] with a high dispersal capacity, confirms that the degree of specialization is not a key factor in determining the genetic population structure of a species as also shown on bee species in a recently fragmented habitat [79]. Furthermore, Exeler et al. (2008) [85] argue that habitat availability is more important than degree of specialization. The widespread presence of the M. zapota and G. lucida host plant in Yucatan Peninsula could have provided adequate habitats to favor the dispersal of E. tatila in the studied area; therefore, reducing the effects of fragmentation.
The first global IBD analysis (males and females) shows a positive and significant relationship between genetic differentiation and geographical distances. However, the sex analysis shows that males present high dispersal (no IBD) while females show a reduced dispersal capacity (positive and highly significant IBD). Causes of sex-biased dispersal in butterflies have been the subject of previous studies [13]. Trochet et al. (2013) [86] suggested that the principal mechanisms for butterfly dispersal are female harassment by males and male-male competition, rather than the search for a mating partner. Their experimental study also showed that in a male-biased sex ratio population, large-winged individuals present high mortality in the transitional zone (corridor between two potential patches) than short-winged individuals and that females are less successful in reaching a new patch and surviving after settlement. Our data on E. tatila in the Yucatan Peninsula support these hypotheses: All localities sampled present a male-biased sex ratio (Table 1 in reference [37]), and females have wing measurements significantly larger than males (Table 1 in reference [37]). Furthermore, Cavanzón-Medrano et al. (2016) [37] showed that males’ thoracic measurements (length and mass) are significantly higher than females, probably an adaptive phenotype of males in a fragmented landscape as suggested by Ducatez et al. (2013) [14] who demonstrated that male flight endurance increases with decreasing habitat connectivity. Therefore, females of E. tatila probably present a lower dispersal capacity, due to a high mortality rate when moving between patches and during settlement, influenced by a combination of complex causes such as the population sex ratio, phenotype of individuals, and behavior strategy [86].
The relationship between land cover, environmental conditions, and the genetic diversity of butterflies, has been poorly studied. The majority of studies focus on the effect of global fragmentation on population genetic structure [19,87,88]. It is generally assumed that large habitat patches have higher butterfly populations than smaller ones [89]. Therefore, genetic diversity is expected to be lower in small patches than in large ones, considering that small populations are more susceptible to genetic drift, inbreeding, and deleterious alleles effects [2]. Nevertheless, our results show that patch size, from small (~8 ha) to very large (~700,000 ha), has no effect on genetic diversity. This has been demonstrated for other tropical butterflies such as Mycalesis orseis Hewitson, 1864 (Lepidoptera: Nymphalidae) where there was no evidence of a relationship between genetic diversity and forest fragment size or estimated butterfly population size [88]. This was also the conclusion of studies on the Palearctic butterfly, Polyommatus coridon Poda, 1761 (Lepidoptera: Lycaenidae) [23,90].
Environmental conditions present a different relationship with genetic diversity. Shrub density and temperature present a significant negative relationship with genetic diversity, whereas the density of tree and herbaceous species, humidity, and rainfall show no correlation with genetic diversity parameters. It is not surprising that temperature shows a significant effect, considering that it has an important influence on all ecological aspects of butterflies, such as distribution, abundance, habitat use, and oviposition site selection among others ([22] for a review). Maya-Martínez et al. (2009) [21] studied the relationship between Charaxinae butterfly population density and climatic and ecological conditions. These authors showed that the key factors for the presence and abundance of different butterfly genera are high humidity and low temperature, as suggested by our results. Therefore, even if variation among temperature seems low (2.7 °C) inside the studied area, this is sufficient to affect the abundance of individuals and consequently, the genetic diversity. Shrub density could affect populations of E. tatila considering that a high density of shrubs indicates a lower level of forest conservation and E. tatila is a bio-indicator of undisturbed areas. Conversely, high tree density can benefit adults of E. tatila as they provide a valuable food resource and individuals settle on tree trunks [39,91].
Our results clearly show the positive effect of undisturbed areas on the genetic diversity of E. tatila, confirming this species as a bio-indicator of undisturbed tropical forest. Interestingly, the same positive effect of undisturbed areas has been demonstrated on the diversity of Charaxinae butterflies in the Yucatan Peninsula [21]. An interesting framework (Figure 4) of polymorphism in relation to the percentage of forest cover, showed an exponential increase in values when forest cover exceeded 80%. This suggests that to reach high values of polymorphism, a minimum proportion of forest cover is required for a highly mobile butterfly.
Our study could not draw any conclusions on the possible negative effect of anthropogenic disturbances and coastal areas on genetic diversity. This may be due to the low number of sample points representing diverse types of land cover across the large area of our study. If the number of representative sample points close to the coast and areas subject to human perturbation were increased, we could determine the negative effects of this kind of perturbations on genetic diversity, as suggested by the study of Maya-Martínez et al. (2009) [21] that showed the impact of proximity to coastal areas (vulnerability due to the impact of hurricanes) and urban settlements, on the distribution and abundance of Charaxinae butterfly species in the Yucatan Peninsula.
Finally, our study shows that a fine-scale analysis of climatic and ecological conditions is necessary to explain genetic diversity variations among a complex tropical ecosystem. Genetic population structure does not appear to be affected by anthropogenic fragmentation, while the availability of host plants inside the matrix is widely distributed facilitating the connectivity between patches for our model species. Nonetheless, we are convinced that increasing studies about this kind of species could lead to stronger results. An increase in molecular studies on tropical butterfly species in fragmented landscapes would lead to a better understanding of the impact of fragmentation on butterfly genetic diversity, and, thus, conservation management strategies.

Supplementary Materials

The following are available online at https://www.mdpi.com/1424-2818/10/3/79/s1, Figure S1: Distribution map for the three subspecies of Eunica tatila. Blue circle (Eunica tatila tatilista), yellow circle (Eunica tatila tatila), and green circle (Eunica tatila bellaria). According to Reference [37], using ArcView GIS 3.2., Figure S2: Relation between genetic diversity parameters, He (blue) and PPL (red), and forest patch size. A: All patches, B: enlargement of zone between 0–100 km2. Results of Spearman correlation (r and p), Figure S3: Population structure provided by STRUCTURE analysis (K = 2) for Eunica tatila. Each individual is represented by a single vertical line broken into K segments whose length is proportional to the estimate membership probability (qi) in the K clusters.

Author Contributions

Conceptualization, S.M.-M., C.-M.L.E., C.P., Y.H. and L.L.; Formal analysis, S.M.-M. and C.-M.L.E.; Funding acquisition, S.M.-M. and Y.H.; Investigation, C.-M.L.E. and L.R.C.-I.; Resources, S.M.-M., C.P. and Y.H.; Validation, S.M.-M. and C.-M.L.E.; Visualization, S.M.-M., C.-M.L.E., C.P., Y.H. and L.L.; Writing—original draft, S.M.-M. and C.-M.L.E.; Writing—review and editing, S.M.-M., C.-M.L.E., C.P., Y.H. and L.L.

Funding

This research received no external funding.

Acknowledgments

We are grateful to the respective managers of the different protected natural areas: J.A. Zuñiga Morales, director of the “Reserva de la Biosfera de Calakmul,” A.O. Ortíz Moreno of the “Reserva de la Biosfera Sian Ka’an,” and M. de C. Garcia Rivas of the “Parque Nacional Arrecifes de Xcalak” as well as the managers of private protected areas: C. Elizondo from the Jardin Botanico (ECOSUR), E. Acosta from “El Zapotal,” and J. Callaghan from the “Reserva Biocultural Kaxil Kiuic.” We would also like to thank the “Instituto Nacional de Antropologia e Historia” for allowing access to the Kohunlich area and, finally, to the people of the village Miguel Hidalgo for their hospitality during our stay. We are grateful for the valuable help from S.J. Uc Tescum and N. Salas Suarez (ECOSUR—Chetumal) for participating as a guide and providing technical support in the field. We also thank H. Weissenberger (ECOSUR—Chetumal) for providing maps and analysis of geographic images, and E. Labastida for support during the genetic analysis. All individual’s collection were realized under the sampling Permit No. FAUT 0119, and the Registration No. QNR.IN.018.0497. We are grateful to the Consejo Nacional de Ciencia y Tecnología (CONACyT) for the financial support provided through the scholarship No 228369 to Cavanzón-Medrano LE. Finally, we are grateful to the anonymous referees for their time dedicated to the revision of this manuscript. Their valuable comments contributed to the improvement in the quality of the present version of our manuscript.

Conflicts of Interest

The authors declare no conflicts of interest.

References

  1. Franklin, A.B.; Noon, B.R.; George, T.L. What is habitat Fragmentation? Stud. Avian Biol. 2002, 25, 20–29. [Google Scholar]
  2. Frankham, R.; Ballou, J.D.; Briscoe, D. Introduction to Conservation Genetics, 2nd ed.; Cambridge University Press: Cambridge, UK, 2009. [Google Scholar]
  3. Franklin, J.F.; Lindenmayer, D.B. Importance of matrix habitats in maintaining biological diversity. Proc. Natl. Acad. Sci. USA 2009, 106, 349–350. [Google Scholar] [CrossRef] [PubMed] [Green Version]
  4. Tischendorf, L.; Fahrig, L. On the usage and measurement of landscape connectivity. Oikos 2000, 90, 7–19. [Google Scholar] [CrossRef]
  5. McKenzie, D.H.; Hyatt, D.E.; McDonald, V.J. Ecological Indicators; Chapman and Hall: London, UK, 1995. [Google Scholar]
  6. Daily, G.C.; Ehrlich, P.R. Preservation of biodiversity in small rainforest patches: Rapid evaluations using butterfly trapping. Biodivers. Conserv. 1995, 4, 35–55. [Google Scholar] [CrossRef]
  7. Brown, K.S., Jr.; Freitas, A.V.L. Atlantic forest butterflies: Indicators for landscape conservation. Biotropica 2000, 32, 934–956. [Google Scholar] [CrossRef]
  8. Syaripuddin, K.; Sing, K.W.; Wilson, J.J. Comparison of butterflies, bats and beetles as bioindicators based on four key criteria and DNA barcodes. Trop. Conserv. Sci. 2015, 8, 138–149. [Google Scholar] [CrossRef]
  9. Whitworth, A.; Huarcaya, R.P.; Mercado, H.G.; Braunholtz, L.D.; MacLeod, R. Food for thought. Rainforest carrion-feeding butterflies are more sensitive indicators of disturbance history than fruit feeders. Biol. Conserv. 2018, 217, 383–390. [Google Scholar] [CrossRef]
  10. Luque, C.; Legal, L.; Winterton, P.; Mariano, N.A.; Gers, C. Illustration of the Structure of Arthropod Assemblages (Collembola and Lepidoptera) in Different Forest Types: An Example in the French Pyrenees. Diversity 2011, 3, 693–711. [Google Scholar] [CrossRef] [Green Version]
  11. Van Swaay, C.A.M.; Van Strien, A.J.; Aghababyan, K.; Åström, S.; Botham, M. The European Butterfly Indicator for Grassland Species 1990–2013; Report VS2015.009; De Vlinderstichting: Wageningen, The Netherland, 2015. [Google Scholar]
  12. Pozo, C. Los Rhopalocera de la Región de Calakmul, Campeche: Métodos de Estudio, Fenología y su Uso Como Indicadores de Disturbio. Ph.D. Thesis, UNAM, México, Mexico, 2006. [Google Scholar]
  13. Legrand, D.; Trochet, A.; Moulherat, S.; Calvez, O.; Stevens, V.M.; Ducatez, S.; Clobert, J.; Baguette, M. Ranking the ecological causes of dispersal in a butterfly. Ecography 2015, 38, 822–831. [Google Scholar] [CrossRef]
  14. Ducatez, S.; Baguette, M.; Trochet, A.; Chaput-Bardy, A.; Legrand, D. Flight endurance and heating rate vary with both latitude and habitat connectivity in a butterfly species. Oikos 2013, 122, 601–611. [Google Scholar] [CrossRef]
  15. Roux, O.; Gevrey, M.; Arvanitakis, L.; Gers, C.; Bordat, D.; Legal, L. ISSR–PCR: Tool for population identification and genetic structure of Plutella xylostella. Mol. Phylogenet. Evol. 2007, 43, 240–250. [Google Scholar] [CrossRef] [PubMed]
  16. Machkour-M’Rabet, S.; Leberger, R.; León-Cortés, J.L.; Gers, C.; Legal, L. Population structure and genetic diversity of the only extant Baroninae swallowtail butterfly, Baronia brevicornis, revealed by ISSR markers. J. Insect Conserv. 2014, 18, 385–396. [Google Scholar] [CrossRef]
  17. Leidner, A.K.; Haddad, N.M. Natural, not urban, barriers define population structure for a coastal endemic butterfly. Conserv. Genet. 2010, 11, 2311–2320. [Google Scholar] [CrossRef]
  18. Berwaerts, K.; Van Dyck, H.; Van Dongen, S.; Matthysen, E. Morphological and genetic variation in the speckled wood butterfly (Pararge aegeria L.) among differently fragmented landscapes. Neth. J. Zool. 1997, 48, 241–253. [Google Scholar] [CrossRef]
  19. Williams, B.L.; Brawn, J.D.; Paige, K. Landscape scale genetic effects of habitat fragmentation on a high gene flow species: Speyeria idalia (Nymphalidae). Mol. Ecol. 2003, 12, 11–20. [Google Scholar] [CrossRef] [PubMed]
  20. Álvarez, C.F.; Gomez, L.M.; Rubio, A.; Bock, B.; Uribe, S. Estructura genética de mariposas en un paisaje fragmentado: Una aproximación al manejo ambiental (Antioquia, Colombia). Rev. Lasallista Investig. 2005, 2, 27–32. [Google Scholar]
  21. Maya-Martínez, M.; Pozo, C.; Schmitter-Soto, J.J. Distribution patterns of Charaxinae (Lepidoptera: Nymphalidae) in Yucatan Peninsula, Mexico. Acta Zool. Mex. 2009, 25, 283–301. [Google Scholar] [CrossRef]
  22. Gibbs, M.; Wiklund, C.; Van Dyck, H. Temperature, rainfall and butterfly morphology: Does life history theory match the observed pattern? Ecography 2011, 34, 336–344. [Google Scholar] [CrossRef]
  23. Vandewoestijne, S.; Schtickzelle, N.; Baguette, M. Positive correlation between genetic diversity and fitness in a large, well-connected metapopulation. BMC Biol. 2008, 6, 46. [Google Scholar] [CrossRef] [PubMed]
  24. Myers, N.; Mittermeier, R.A.; Mittermeier, C.G.; Da Fonseca, G.A.; Kent, J. Biodiversity hotspots for conservation priorities. Nature 2000, 403, 853–858. [Google Scholar] [CrossRef] [PubMed]
  25. González-Iturbe, A.; Granados Castellanos, J.; Tun Dzul, F.; Olmsted, I. Vegetación Atlas de Procesos Territoriales de Yucatán; Universidad Autónoma de Yucatán: México, México, 1999. [Google Scholar]
  26. Rada, J.M.D.; García, R.D.; García-Contreras, G.; Morín, J.A.; Lugo, E.A. Conservation and Use. In Biodiversity and Conservation of the Yucatán Peninsula; Islebe, G., Calmé, S., León-Cortés, J.L., Schmook, B., Eds.; Springer International Publishing: Basel, Switzerland, 2015; pp. 169–193. [Google Scholar]
  27. Vázquez-Domínguez, E.; Arita, H. The Yucatán Peninsula: Biogeographical history 65 million years in the making. Ecography 2010, 33, 212–219. [Google Scholar] [CrossRef]
  28. Carnevali, G.; Ramírez, I.M.; González-Iturbe, J.A. Flora y vegetación de la península de Yucatán. In Naturaleza y Sociedad en el Área Maya, Pasado, Presente y Futuro; Colunga-García Marín, P., Larqué-Saavedra, A., Eds.; Academia Mexicana de Ciencias, CICY: Mérida, Mexico, 2003; pp. 53–67. [Google Scholar]
  29. Abrams, E.M.; Rue, D.J. The causes and consequences of deforestation among the prehistoric Maya. Hum. Ecol. 1988, 16, 377–395. [Google Scholar] [CrossRef]
  30. Geoghegan, J.; Cortina, S.V.; Klepeis, P.; Macario, P.M.; Ogneva-Himmelberger, Y.; Chowdhury, R.R. Modeling tropical deforestation in the southern Yucatán peninsular region: Comparing survey and satellite data. Agric. Ecosyst. Environ. 2001, 85, 25–46. [Google Scholar] [CrossRef]
  31. Pozo, C.; Salas-Suárez, N.; Maya, A. Mariposas Riqueza Biológica de Quintana Roo Un Análisis Para su Conservación; Tomo 2; El Colegio de la Frontera Sur (ECOSUR), Comisión Nacional para el Conocimiento y Uso de la Biodiversidad (Conabio), Gobierno del Estado de Quintana Roo y Programa de Pequeñas Donaciones (PPD): México, México, 2011.
  32. Pozo, C.; Cabrera, E.; Rangel, J.L.; Viveros, P. Fauna Estudios Ecológicos Preliminares de la Zona sur de Quintana Roo México; Centro de Investigaciones de Quintana Roo: Mexico, Mexico, 1991. [Google Scholar]
  33. Pozo, C.; Luis-Martínez, A.; Uc, S.; Salas, N.; Maya, A. Butterflies (Papilionoidea and Hesperioidea) of Calakmul, Campeche, México. Southwest. Nat. 2003, 48, 505–525. [Google Scholar] [CrossRef]
  34. Pozo, C.; Salas-Suárez, N.; Prado, B.R.; May, E. Riqueza de mariposas diurnas (Lepidoptera: Rhopalocera) en el Santuario del Manatí y una propuesta para su uso en el monitoreo de ambientes terrestres del área. In El Sistema Ecológico de la Bahía de Chetumal/Corozal: Costa Occidental del Mar Caribe; Espinoza-Ávalos, J., Islebe, G.A., Hernández-Arana, H.A., Eds.; El Colegio de la Frontera Sur: Mexico, Mexico, 2009; pp. 139–147. [Google Scholar]
  35. Vargas-Fernández, I.; Llorente-Bousquets, J.; Luis-Martínez, A.; Pozo, C. Nymphalidae de México II (Libytheinae, Ithomiinae, Morphinae y Charaxinae): Distribución Geográfica e Ilustración; UNAM: Mexico, Mexico, 2008. [Google Scholar]
  36. Prado, B.R.; Pozo, C.; Valdez-Moreno, M.; Hebert, P.D.N. Beyond the Colours: Discovering Hidden Diversity in the Nymphalidae of the Yucatan Peninsula in Mexico through DNA Barcoding. PLoS ONE 2011, 6, e27776. [Google Scholar] [CrossRef] [PubMed]
  37. Cavanzón-Medrano, L.; Pozo, C.; Hénaut, Y.; Legal, L.; Salas-Suárez, N.; Machkour-M’Rabet, S. Complex Population Patterns of Eunica tatila Herrich-Schäffer (Lepidoptera: Nymphalidae), with Special Emphasis on Sexual Dimorphism. Neotrop. Entomol. 2016, 45, 148–158. [Google Scholar] [CrossRef] [PubMed]
  38. Rosin, Z.M.; Myczko, L.; Piotr Skorka, P.; Lenda, M.; Moron, D.; Sparks, T.H.; Tryjanowski, P. Butterfly responses to environmental factors in fragmented calcareous grasslands. J. Insect Conserv. 2012, 16, 321–329. [Google Scholar] [CrossRef]
  39. Jenkins, D.W. Neotropical Nymphalidae VIII. Revision of Eunica. Bull. Allyn. Mus. 1990, 131, 1–175. [Google Scholar]
  40. Andrade-C, M.G.; Henao Bañol, E.R.; Triviño, P. Técnicas y procesamiento para la recolección, preservación y montaje de mariposas en estudios de biodiversidad y conservación (Lepidoptera: Hesperoidea–Papilionoidea). Rev. Acad. Colomb. Cienc. Exact 2013, 37, 144. [Google Scholar] [CrossRef]
  41. Molleman, F.; Van Alphen, M.E.; Brakefield, P.M.; Zwann, B.J. Preferences and food quality of fruit-feeding butterflies in Kibale forest, Uganda. Biotropica 2005, 37, 657–663. [Google Scholar] [CrossRef]
  42. Torres, C.; Osorio-Beristain, M.; Mariano, N.; Legal, L. Sex-dependant seasonal activity patterns among two subfamilies of Nymphalidae (Lepidoptera) in the Mexican tropical dry forest. Ann. Soc. Entomol. Fr. 2009, 45, 265–274. [Google Scholar] [CrossRef]
  43. Luque, C.; Legal, L.; Staudter, H.; Gers, C.; Wink, M. ISSR (Inter Simple Sequence Repeats) as genetic markers in Noctuids (Lepidoptera, Heterocera, Noctuidae, Noctuinae). Hereditas 2002, 136, 251–253. [Google Scholar] [CrossRef] [PubMed]
  44. Machkour-M’Rabet, S.; Hénaut, Y.; Charruau, P.; Gevrey, M.; Legal, L. Extinction risk of the American Crocodile in the Mexican Caribbean revealed by ISSR-PCR method: Implication for Conservation. Mar. Biol. 2009, 156, 1321–1333. [Google Scholar] [CrossRef]
  45. Machkour-M’Rabet, S.; Hénaut, Y.; Calmé, S.; Legal, L. When landscape modification is advantageous for protected species. The case of a synanthropic tarantula, Brachypelma vagans. J. Insect Conserv. 2012, 16, 479–488. [Google Scholar] [CrossRef]
  46. Coutinho, J.P.; Carvalho, A.; Lima-Brito, J. Genetic diversity assessment and estimation of phylogenetic relationships among 26 Fagaceae species using ISSRs. Biochem. Syst. Ecol. 2014, 54, 247–256. [Google Scholar] [CrossRef]
  47. Wink, M. Use of ADN markers to study birds migration. J. Ornithol. 2006, 147, 234–244. [Google Scholar] [CrossRef]
  48. Turlure, C.; Vandewoestijne, S.; Baguette, M. Conservation genetics of a threatened butterfly: Comparison of allozymes, RAPDs and microsatellites. BMC Genet. 2014, 15, 114. [Google Scholar] [CrossRef] [PubMed]
  49. Sinama, M.; Dubut, V.; Costedoat, C.; Gilles, A.; Junker, M. Challenges of microsatellite development in Lepidoptera: Euphydryas aurinia (Nymphalidae) as a case study. Eur. J. Entomol. 2011, 108, 261–266. [Google Scholar] [CrossRef]
  50. Luque, C.; Legal, L.; Machkour-M’Rabet, S.; Winterton, P.; Gers, C.; Wink, M. Apparent influences of host-plant distribution on the structure and the genetic variability of local populations of the Purple Clay (Diarsia brunnea). Biochem. Syst. Ecol. 2009, 37, 6–15. [Google Scholar] [CrossRef]
  51. Hundsdoerfer, A.K.; Wink, M. New Source of Genetic Polymorphisms in Lepidoptera? Z. Naturforsch. C 2005, 60, 618–624. [Google Scholar] [CrossRef] [PubMed] [Green Version]
  52. Vijayan, K.; Anuradha, H.J.; Nair, C.V.; Pradeep, A.R.; Awasthi, A.; Saratchandra, B.; Rahman, S.A.; Singh, K.C.; Chakraborti, R.; Urs, S.R. Genetic diversity and differentiation among populations of the Indian eri silkworm, Samia cynthia ricini, revealed by ISSR markers. J. Insect Sci. 2006, 6, 30. [Google Scholar] [CrossRef]
  53. Khurad, A.M.; Kanginakudru, S.; Qureshi, S.O.; Rathod, M.K.; Rai, M.M.; Nagaraju, J. A new Bombyx mori larval ovarian cell line highly susceptible to nucleopolyhedrovirus. J. Invertebr. Pathol. 2006, 92, 59–65. [Google Scholar] [CrossRef] [PubMed]
  54. Legal, L.; Bermudez-Torres, K.; Leyva Sanchez, E.; Machkour-M’Rabet, S. ISSR, una nueva herramienta para el estudio de especies y poblaciones en el marco de la genética de la conservación. Mesoamericana 2008, 12, 74. [Google Scholar]
  55. Srivastava, P.P.; Vijayan, K.; Kar, P.K.; Saratchandra, B. Diversity and marker association in tropical silkworm breeds of Bombyx mori (Lepidoptera: Bombycidae). Int. J. Trop. Insect Sci. 2011, 31, 182–191. [Google Scholar] [CrossRef]
  56. Radjabi, R.; Sarafrazi, A.; Tarang, A.; Kamali, K.; Tirgari, S. Intraspecific Biodiversity of Iranian Local Races of Silkworm Bombyx mori by ISSR (Inter-Simple Sequence Repeat) Molecular Marker. World J. Zool. 2012, 7, 17–22. [Google Scholar]
  57. Gradish, A.E.; Keyghobadi, N.; Otis, G.W. Population genetic structure and genetic diversity of the threatened White Mountain arctic butterfly (Oeneis melissa semidea). Conserv. Genet. 2015, 16, 1253–1264. [Google Scholar] [CrossRef]
  58. Mariette, S.; Le Corre, V.; Austerlitz, F.; Kremer, A. Sampling within the genome for measuring within-population diversity: Trade-offs between markers. Mol. Ecol. 2002, 11, 1145–1156. [Google Scholar] [CrossRef] [PubMed]
  59. Nelson, M.F.; Anderson, N.O. How many marker loci are necessary? Analysis of dominant marker data sets using two popular population genetic algorithms. Ecol. Evol. 2013, 3, 3455–3470. [Google Scholar] [CrossRef] [PubMed]
  60. Lynch, M.; Milligan, B.G. Analysis of population genetic structure with RAPD markers. Mol. Ecol. 1994, 3, 91–99. [Google Scholar] [CrossRef] [PubMed]
  61. Peakall, R.; Smouse, P.E. GENALEX V6: Genetic analysis in Excel. Population genetic software for teaching and research. Mol. Ecol. Notes 2006, 6, 288–295. [Google Scholar] [CrossRef]
  62. Peakall, R.; Smouse, P.E. GENALEX 6.5: Genetic analysis in Excel. Population genetic software for teaching and research-an update. Bioinformatics 2012, 28, 2537–2539. [Google Scholar] [CrossRef] [PubMed]
  63. Yeh, F.C.; Yang, R.; Boyle, T.J.B. Population genetic analysis of co-dominant and dominant markers and quantitative traits. Belg. J. Bot. 1999, 6, 1234–1236. [Google Scholar]
  64. Excoffier, L.; Smouse, P.E.; Quattro, J.M. Analysis of molecular variance inferred from metric distances among DNA haplotypes: Application to human mitochondrial DNA restriction sites. Genetics 1992, 131, 479–491. [Google Scholar] [PubMed]
  65. Pritchard, J.K.; Stephens, M.; Donnelly, P.J. Inference of population structure using multilocus genotype data. Genetics 2000, 155, 945–959. [Google Scholar] [PubMed]
  66. Falush, D.; Stephens, M.; Pritchard, J.K. Inference of population structure using multilocus genotype data: Dominant markers and null alleles. Mol. Ecol. Notes 2007, 7, 574–578. [Google Scholar] [CrossRef] [PubMed]
  67. Pritchard, J.K.; Wen, X.; Falush, D. Documentation for STRUCTURE Software; Version 2.3.; University of Chicago: Chicago, IL, USA, 2010. [Google Scholar]
  68. Minno, M.C.; Emmel, T.C. Butterflies of the Florida Keys; Scientific Publishers: Gainesville, FL, USA, 1993; p. 168. [Google Scholar]
  69. Valdez-Hernández, M.; Sánchez, O.; Islebe, G.A.; Snook, L.K.; Negreros-Castillo, P. Recovery and early succession after experimental disturbance in a seasonally dry tropical forest in Mexico. For. Ecol. Manag. 2014, 334, 331–343. [Google Scholar] [CrossRef]
  70. Ribeiro, D.B.; Batista, R.; Prado, P.I.; Brown, K.S., Jr.; Freitas, A.V.L. The importance of small scales to the fruit-feeding butterfly assemblages in a fragmented landscape. Biodivers. Conserv. 2012, 21, 811–827. [Google Scholar] [CrossRef]
  71. Epps, C.W.; Palsboll, P.J.; Wehausen, J.D.; Roderick, G.K.; Ramey, R.R., II; McCullough, D.R. Highways block gene flow and cause a rapid decline in genetic diversity of desert bighorn sheep. Ecol. Lett. 2005, 8, 1029–1038. [Google Scholar] [CrossRef]
  72. Machkour-M’Rabet, S.; Vilchis-Nestor, C.A.; Barriga-Sosa, I.D.L.A.; Legal, L.; Hénaut, Y. A molecular approach to understand the riddle of the invasive success of the tarantula, Brachypelma vagans, on Cozumel Island, Mexico. Biochem. Syst. Ecol. 2017, 70, 260–267. [Google Scholar] [CrossRef]
  73. Gasmi, S.; Ferval, M.; Pelissier, C.; D’Amico, F.; Maris, T.; Tackx, M.; Legal, L. Genetic diversity among the Eurytemora affinis species complex in the Scheldt estuary and its tributaries using ISSR-PCR marker assay. Estuar. Coast. Shelf Sci. 2014, S145, 22–30. [Google Scholar] [CrossRef]
  74. Welling, E. Notes on butterflies migration in the Peninsula of Yucatan. J. Lepid. Soc. 1959, 13, 62–64. [Google Scholar]
  75. Alayo, P.D.; Hernández, L.R. Atlas de Las Mariposas Diurnas de Cuba (Lepidoptera: Rhopalocera); Editorial Científico Técnica la Habana: Habana, Cuba, 1987. [Google Scholar]
  76. Norris, T. Day 7–22 June–on to Guanahacabibes. Available online: https://www.butterfliesofcuba.com/blog/day-7-22-june-on-to-guanahacabibes (accessed on 1 June 2018).
  77. Smith, B.T.; Escalante, P.; Hernandez-Baños, B.E.; Navarro-Sigüenza, A.G.; Rohwer, S.; Klicka, J. The role of historical and contemporary processes on phylogeographic structure and genetic diversity in the Northern Cardinal, Cardinalis cardinalis. BMC Evol. Biol. 2011, 11, 136. [Google Scholar] [CrossRef] [PubMed]
  78. Schmitt, T.; Seitz, A. Influence of habitat fragmentation on the genetic structure of Polyommatus coridon (Lepidoptera: Lycaenidae): Implications for conservation. Biol. Conserv. 2002, 107, 291–297. [Google Scholar] [CrossRef]
  79. Exeler, N.; Kratochwil, A.; Hochkirch, A. Does recent habitat fragmentation affect the population genetics of a heathland specialist, Andrena fuscipes (Hymenoptera: Andrenidae)? Conserv. Genet. 2010, 11, 1679–1687. [Google Scholar] [CrossRef]
  80. Harrison, S. Local extinction in a metapopulation context: An empirical evaluation. Biol. J. Linn. Soc. 1991, 42, 47–88. [Google Scholar] [CrossRef]
  81. Kitahara, M.; Sei, K.; Fujii, K. Patterns in the structure of grassland butterfly communities along a gradient of human disturbance: Further analysis based on the generalist/specialist concept. Popul. Ecol. 2000, 42, 135–144. [Google Scholar] [CrossRef]
  82. Brückmann, S.V.; Krauss, J.; Steffan-Dewenter, I. Butterfly and plant specialists suffer from reduced connectivity in fragmented landscapes. J. Appl. Ecol. 2010, 47, 799–809. [Google Scholar] [CrossRef]
  83. Warren, M.S.; Hill, J.K.; Thomas, J.A.; Asher, J.; Fox, R. Rapid responses of British butterflies to opposing forces of climate and habitat change. Nature 2001, 414, 65–69. [Google Scholar] [CrossRef] [PubMed] [Green Version]
  84. Beccaloni, G.W.; Viloria, A.L.; Hall, S.K.; Robinson, G.S. Catalogue of Hostplants of the Neotropical Butterflies; Sociedad Entomológica Aragonesa: Zaragosa, Spain, 2008. [Google Scholar]
  85. Exeler, N.; Kratochwil, A.; Hochkirch, A. Strong genetic exchange among populations of a specialist bee, Andrena vaga (Hymenoptera: Andrenidae). Conserv. Genet. 2008, 9, 1233–1241. [Google Scholar] [CrossRef]
  86. Trochet, A.; Legrand, D.; Larranaga, N.; Ducatez, S.; Calvez, O.; Cote, J.; Clobert, J.; Baguette, M. Population sex ratio and dispersal in experimental, two-patch metapopulations of butterflies. J. Anim. Ecol. 2013, 82, 946–955. [Google Scholar] [CrossRef] [PubMed] [Green Version]
  87. Hill, J.K.; Hughes, C.L.; Dytham, C.; Searle, J.B. Genetic diversity in butterflies: Interactive effects of habitat fragmentation and climate-driven range expansion. Biol. Lett. 2006, 2, 152–154. [Google Scholar] [CrossRef] [PubMed]
  88. Benedick, S.; White, T.A.; Searle, J.B.; Hamer, K.C.; Mustaffa, N. Impacts of habitat fragmentation on genetic diversity in a tropical forest butterfly on Borneo. J. Trop. Ecol. 2007, 23, 623–634. [Google Scholar] [CrossRef]
  89. Dover, J.; Settele, J. The influences of landscape structure on butterfly distribution and movement: A review. J. Insect Conserv. 2009, 13, 3–27. [Google Scholar] [CrossRef]
  90. Krauss, J.; Schmitt, T.; Seitz, A.; Steffan-Dewenter, I.; Tscharntke, T. Effects of habitat fragmentation on the genetic structure of the monophagous butterfly Polyommatus coridon along its northern range margin. Mol. Ecol. 2004, 13, 311–320. [Google Scholar] [CrossRef] [PubMed]
  91. Pozo, C.; (El Colegio de la Frontera Sur, Chetumal, Quintana Roo, México). Personal Communication, 2018.
Figure 1. Geographical location of the eight sites in the Yucatan Peninsula (Mexico) where Eunica tatila was collected. For each locality, we present the 16 km2 square used to characterize the land cover of each area (refer to material and methods for more information). Number of collected individuals (n), principal cities (Chetumal, Cancun, Merida, Campeche) (yellow squares), and cities with more than 1000 inhabitants (red squares).
Diversity 10 00079 g001
Figure 2. Multidimensional scaling analysis (MDS) considering the genetic diversity parameters in red color (PPL and He), the land cover conditions in blue (forest, anthropogenic, and coastal areas), patches size in black, and environmental condition in green (humidity, temperature, rainfall, and density of shrubs, herbs, and trees). Significant results of Spearman correlation: *** p < 0.001, * p < 0.05.
Diversity 10 00079 g002
Figure 3. Significative correlation between genetic diversity (PPL) and land cover characteristics (temperature, density of shrubs, and forest). Colors represent localities: brown (Calakmul), dark blue (Kohunlich), light blue (Miguel Hidalgo), purple (Jardín Botanico), orange (Xcalak), yellow (Kiuic), green (Sian Ka’an), burgundy (Zapotal). Results of Spearman correlation: r and p.
Diversity 10 00079 g003
Figure 4. Relationship between the proportional mean value of He (A) and PPL (B) and land cover characteristics (forest, coastal, and anthropogenic). Results of Kruskall-Wallis test: *** p < 0.05, letters represent results of multiple comparisons test.
Diversity 10 00079 g004
Figure 5. Isolation-by-distance analysis (IBD) for females (A) and males (B) of Eunica tatila. Results of Mantel test: ** p < 0.01, ns: not significant.
Diversity 10 00079 g005
Table 1. Ecological, climatic, land use characteristics and genetic information (based on Inter Simple Sequence Repeats (ISSR) markers) obtained at each area for Eunica tatila in the Yucatan Peninsula, Mexico. Tree density (dtrees), shrub density (dshrubs), density of herbaceous plants (dherbs), sample size (N1), number of individuals used for analysis (N2), total number of bands scored over all loci (TB), number of rare bands or bands with frequency ≤5% (RB), number of private bands or bands that exist only in this population (PB), percentage of polymorphism loci (PPL), expected heterozygosity (He), standard error (SE), and land cover data (forest/coast/anthropogenic) represent the percentage of occupancy of each kind of land cover considered in this study within a 16 km2 square surrounding each sampling point as shown in Figure 1.
Calakmul (CK)Kohunlich (KH)Miguel Hidalgo (MH)Jardín Botánico (JB)Xcalak (XC)Kiuic (KU)Sian Ka’an (SK)Zapotal (ZP)
Sampling DataN16838173632595050
N25838173631544049
Genetic DataTB10698949495108112104
RB178091115522
PB01000220
PPL8981767777909285
He (±SE)0.194 (0.015)0.195 (0.016)0.202 (0.016)0.187 (0.016)0.189 (0.016)0.205 (0.016)0.220 (0.014)0.182 (0.016)
Ecological Datadtrees0.050.030.050.070.040.080.070.06
dshrubs0.811.111.370.871.230.890.831.11
dherbs11.3821.2512.7722.3318.8540.6340.1220.17
Patch size (km2)72310.085230.654516.5375024
Climatic DataTemperature (°C)25.1427.0127.0126.7927.6725.5126.7726.48
Humidity (%)81.0481.5381.5373.4278.8279.1478.9475.75
Precipitation (mm)3.665.795.796.776.133.197.041.17
Land cover DataForest98%93%79%24%13%100%100%98%
Coast0%0%0%6%87%0%0%0%
Anthropogenic2%7%21%70%0%0%0%2%
Table 2. ISSR primers screened for ISSR-PCR in Eunica tatila. Percentage of guanine and cytosine content (%GC), melting temperature (Tm), annealing temperature (Ta), total number of bands per primers over all localities (N bands), size of the DNA fragments for each primer (size). The following designation was used for degenerated sites: Y (C or T).
Abbreviation% GCTmTaN BandsSize (pb)
(AG)8YC52.859.55837200–1600
(GAG)5GC70.664.86336400–1400
(GA)8C52.9565420150–1200
(AC)8C52.962.36126300–1500
Table 3. Coefficient of genetic differentiation PhiPT (ΦPT) above diagonal and geographic distances (km) below diagonal for all pairwise comparison. All values of ΦPT are significant at a 0.001 level. Upper and lower values are in bold. For abbreviations of localities see Table 1.
CKKHMHJBXCKUSKZP
CK 0.0570.0950.0420.0380.0400.0420.067
KH115 0.0570.0360.0210.0430.0420.050
MH16269 0.0530.0560.0730.0510.085
JB325332264 0.0260.0440.0530.067
XC21710293306 0.0340.0230.030
KU176200178290271 0.0180.030
SK242196126136176212 0.032
ZP390342285100355244175

