Article

Relationship between Genetic Variability and Land Use and Land Cover in Populations of Campomanesia adamantium (Myrtaceae)

by
Bruno Do Amaral Crispim
1,
Miklos Maximiliano Bajay
2,
Adrielle Ayumi de Vasconcelos
3,
Thamiris Gatti Deo
3,
Ramilla Dos Santos Braga
4,
Mariana Pires de Campos Telles
4,5,
Maria Do Carmo Vieira
6,
Thiago De Oliveira Carnevali
6,
Julio César Jut Solórzano
7 and
Alexeia Barufatti Grisolia
1,*
1
Faculty of Biological and Environmental Sciences, Federal University of Grande Dourados, Dourados, Mato Grosso do Sul 79804-970, Brazil
2
Departamento de Genética, ESALQ/Universidade de São Paulo-USP, Piracicaba, São Paulo 13418-900, Brazil
3
Department of Genetics, Evolution, Microbiology and Immunology, Institute of Biology, University of Campinas (UNICAMP), Campinas, São Paulo 13083-862, Brazil
4
Laboratório de Genética & Biodiversidade, Departamento de Genética, Instituto de Ciências Biológicas, Universidade Federal de Goiás, Goiânia, Goiás 74045-155, Brazil
5
Escola de Ciências Agrárias e Biológicas, Pontifícia Universidade Católica de Goiás, Goiânia, Goiás 74175-120, Brazil
6
Faculty of Agrarian Sciences, Federal University of Grande Dourados, Dourados, Dourados, Mato Grosso do Sul 79804-970, Brazil
7
Postgraduate Program in Natural Resources, State University of Mato Grosso do Sul, Dourados, Mato Grosso do Sul 79804-970, Brazil
*
Author to whom correspondence should be addressed.
Diversity 2018, 10(4), 106; https://doi.org/10.3390/d10040106
Submission received: 30 May 2018 / Revised: 1 July 2018 / Accepted: 15 July 2018 / Published: 27 September 2018

Abstract

:
Campomanesia adamantium is an endemic plant of Cerrado biome that has potential for cultivation because its fruits have culinary and medicinal uses. However, genetic diversity studies using molecular markers with Cerrado species are scarce, and the inadequate extractive exploitation of fruits and the expansion of agricultural frontiers may also affect genetic variability. Therefore, studies in this field are of interest as they can provide sources for conservation and breeding programs. In this context, we investigated the genetic diversity of native populations of C. adamantium from different sites and the relationship between genetic variability and the land use and land cover of each site. A total of 207 plants were sampled in seven sites and characterized with seven polymorphic microsatellite markers. The use and coverage of land were mapped based on aerial images, and the land was classified into different categories. The genetic diversity was high in all populations, with low levels of differentiation due to allele sharing, mainly in Mato Grosso do Sul and Paraguay populations. The geographically closest populations were more genetically similar. The use and coverage of land indicated that intense agriculture promotes a significant decrease in genetic variability.

1. Introduction

Campomanesia adamantium O. Berg (Myrtaceae)—also known as guavira, gabiroba, guabiroba, guabiroba-do-campo, or guariroba—is a native plant that is widely found in the Cerrado biome in Brazil [1]. It grows as shrubs measuring 0.5 to 1.5 m in height, blooms between September and November, and has fruits from November to December. The fruits have a round shape and a color ranging from dark to light green and yellow, with a sweet and pleasant aroma. They can be consumed in their natural form or used in the preparation of sweet foods, such as jams, jellies, sorbets, and juices. The flowers have potential for beekeeping, and the leaves and fruits of these plants are also used in folk medicine due their antirheumatic, antidiarrheal, hypocholesterolemic, and anti-inflammatory properties [2,3]. Several studies are being carried out to characterize the chemical and medicinal properties of C. adamantium with the ultimate objective of domestication, and some studies have indicated great genetic variability, inferred through the evaluation of phenotypic patterns [4,5,6,7,8,9].
Genetic variability is fundamental to genetic improvement programs and conservation strategies [10]. Molecular markers are useful tools for evaluating genetic variation and are also an efficient means of relating phenotypic and genotypic variations [11]. Microsatellite markers, also known as simple sequence repeats (SSRs), have been widely used to study genetics in plants because they are typically codominant, multiallelic, polymorphic, and have high heterozygosity [12,13,14].
Microsatellite markers have not yet been developed for Myrtaceae species of the Atlantic Forest. The development of specific primers for microsatellite locus amplification is an expensive and time-consuming process involving cloning and sequencing of the DNA fragments [15]. However, transferability of microsatellite primers between species in the same genus or between different genera is possible [16].
Research using molecular markers in guavira is still uncommon [17,18]. Therefore, population genetic studies are required to support conservation and breeding programs. Ensuring genetic diversity can strongly influence the long-term viability of plant populations and their ability to adapt to changing climatic and environmental conditions. The degradation of the Cerrado biome, either by inadequate extractive exploitation of fruits or by the expansion of agricultural frontiers, may affect the genetic variability of Campomanesia [18]. Besides, plants that lack genetic diversity may be more susceptible to environmental stresses and less competitive with exotic invasive species.
In recent decades, the conversion of pastures, forest plantations, and forest fragments have had an impact on agriculture. These changes have raised new concerns about contamination, soil fertility, and the loss of genetic diversity. Changes in the use of land may reduce the genetic diversity of plants [19].
There is a great deal of interest in plants in the Cerrado region, but few genetic diversity studies have been carried out on species. Therefore, the use of transferable microsatellite markers to assess variability at the molecular level in populations of C. adamantium would be helpful. In this context, we investigated the genetic diversity of native populations of C. adamantium from different sites and the relationship between genetic variability and the land use and land cover of each site.

2. Materials and Methods
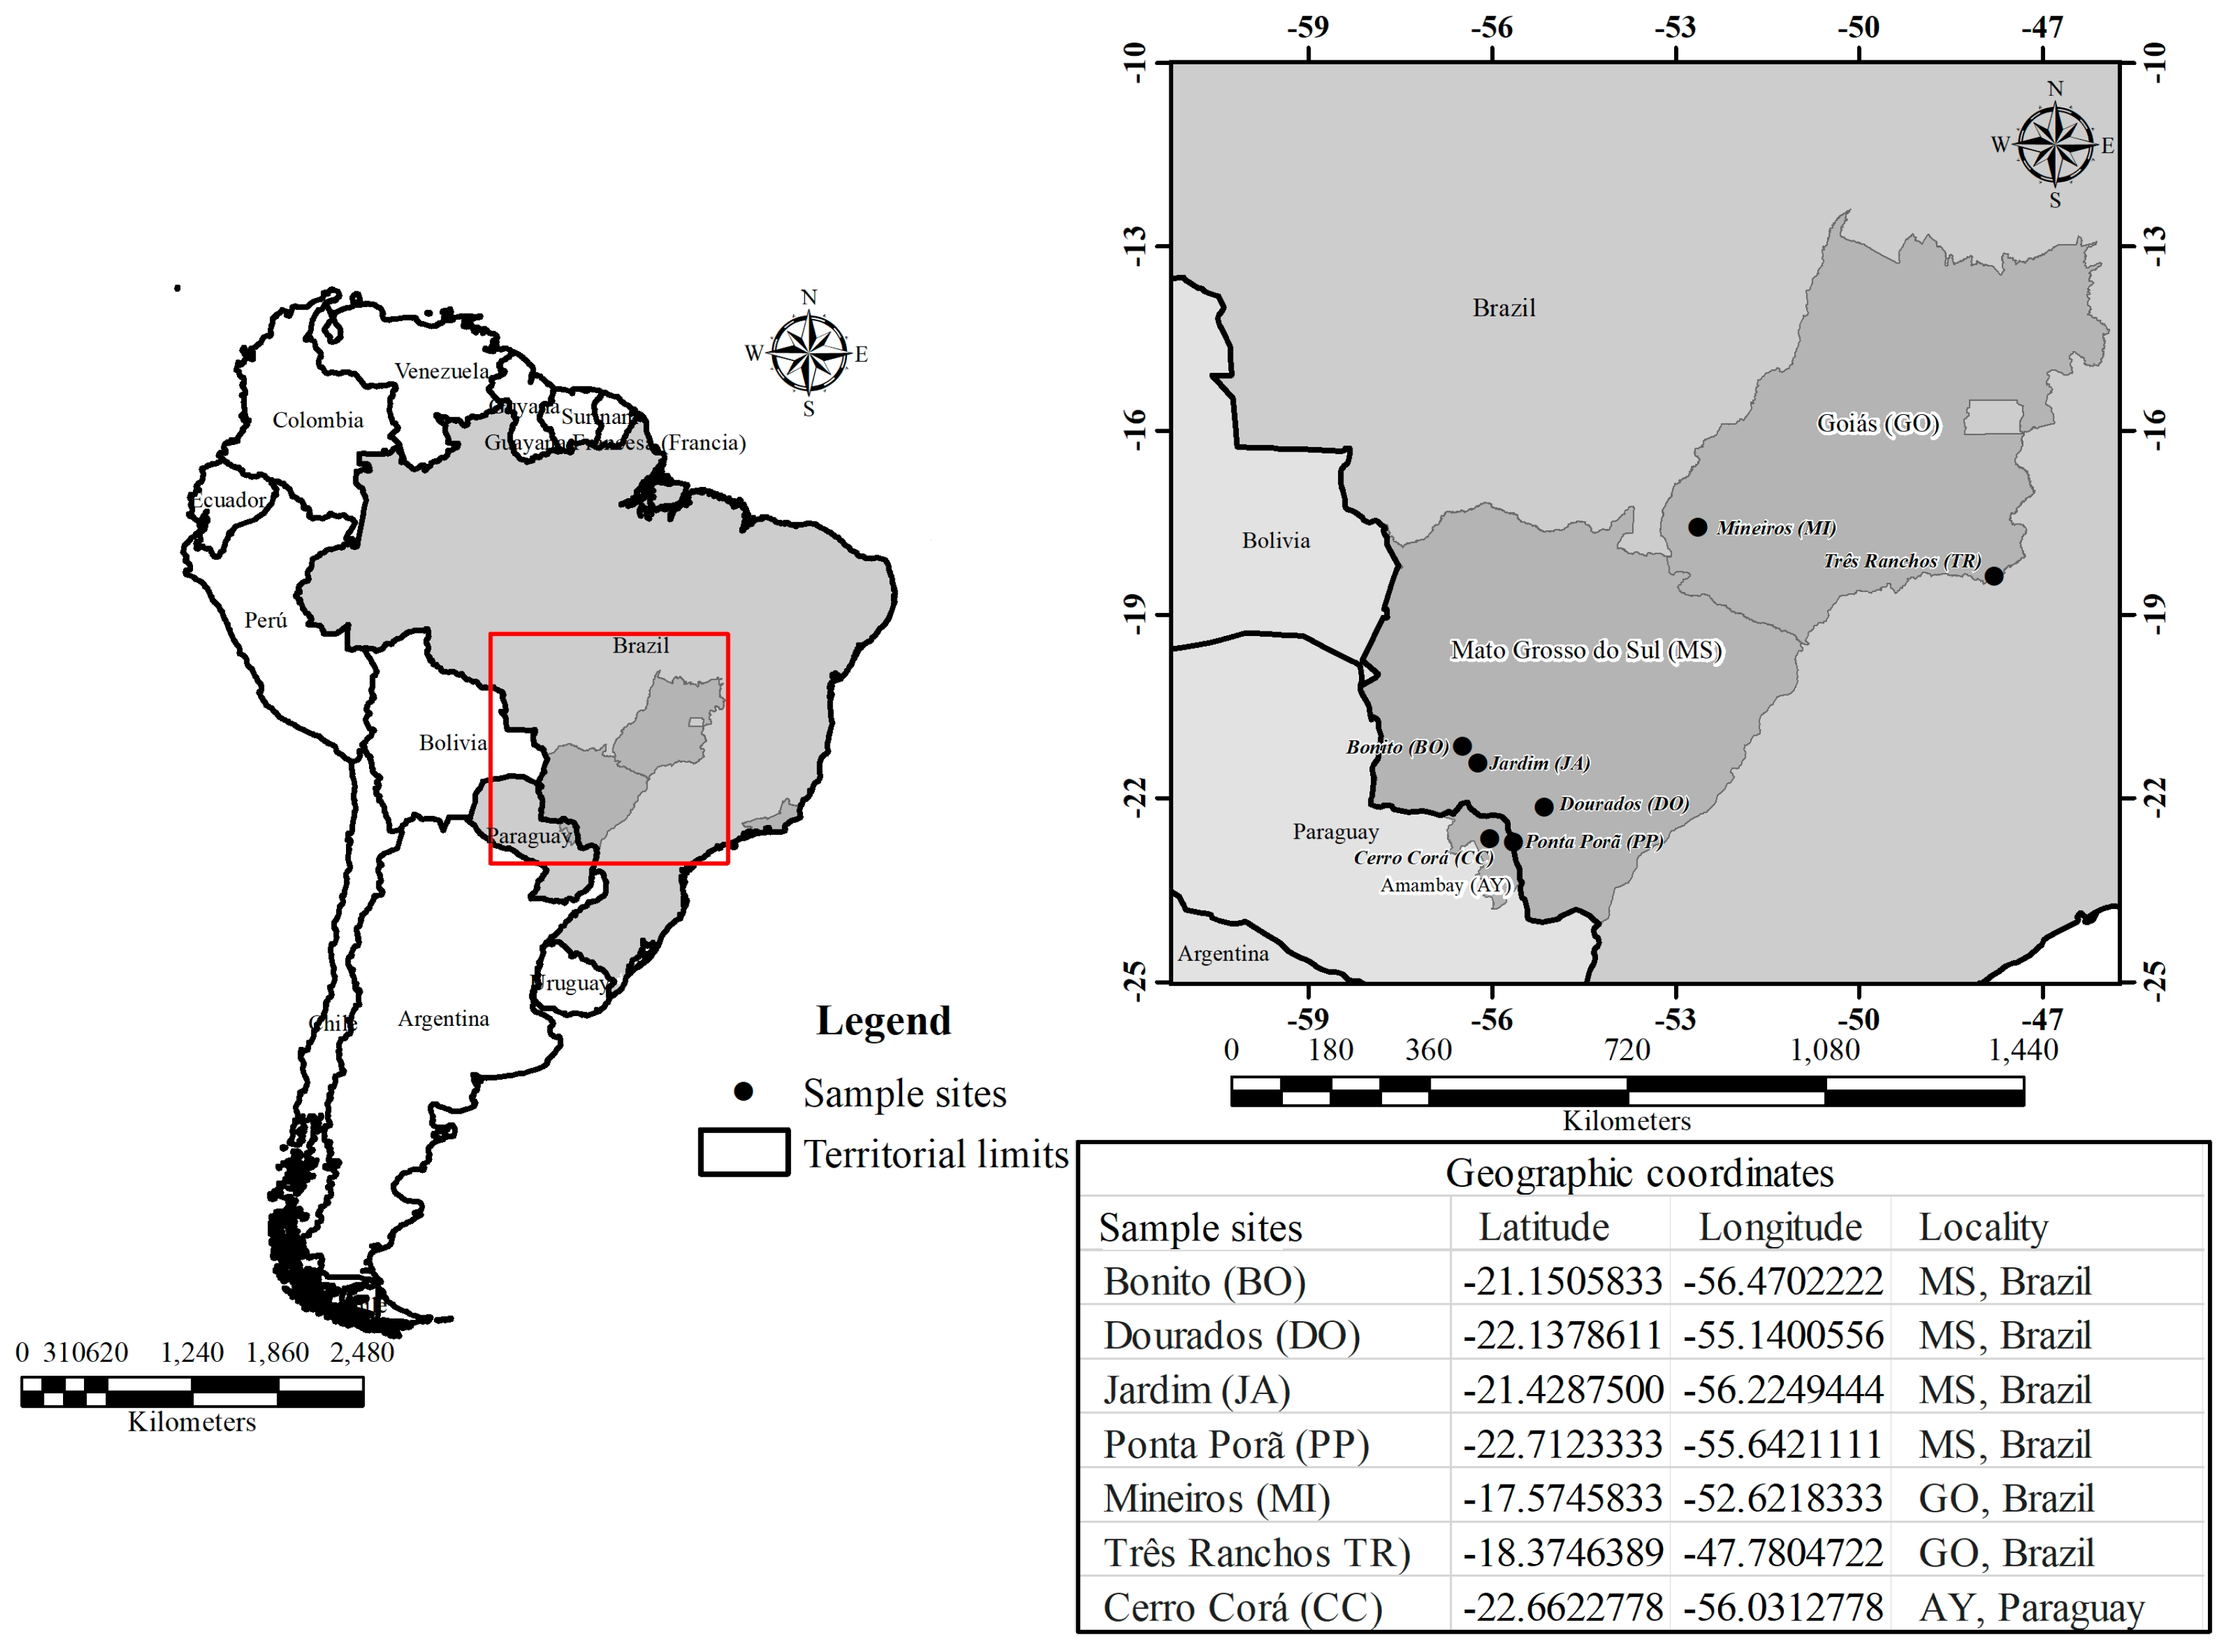
2.1. Plant Material

Young leaf samples were collected from 207 individuals plants distributed in 7 populations of C. adamantium located in the Cerrado biome. Information about each of the sample sites and the geographic coordinates are shown in Figure 1.

2.2. Microsatellite Markers

Genomic DNA was extracted from leaf tissue using the CTAB (Cetyl trimethyl ammonium bromide) method [20], and the DNA was quantified using a DS-11® nanophotometer (DeNovix, Wilmington, DE, USA). Seven transferable EST-derived microsatellite markers developed by Grattapaglia et al. [21] for Eucalyptus ssp. (EMBRA 1076, 1335, 1363, 1364, 1374, 1470, and 1811) were amplified by polymerase chain reaction (PCR) according to the conditions described by Miranda et al. [18]. The length of the amplified fragments was determined using an automated sequencer (ABI3500). The alleles were scored against the internal GeneScan-600 (LIZ) size standard kit, and data collection and analysis were performed using GeneMapper 5.0 software (Applied Biosystems, Foster City, CA, USA).

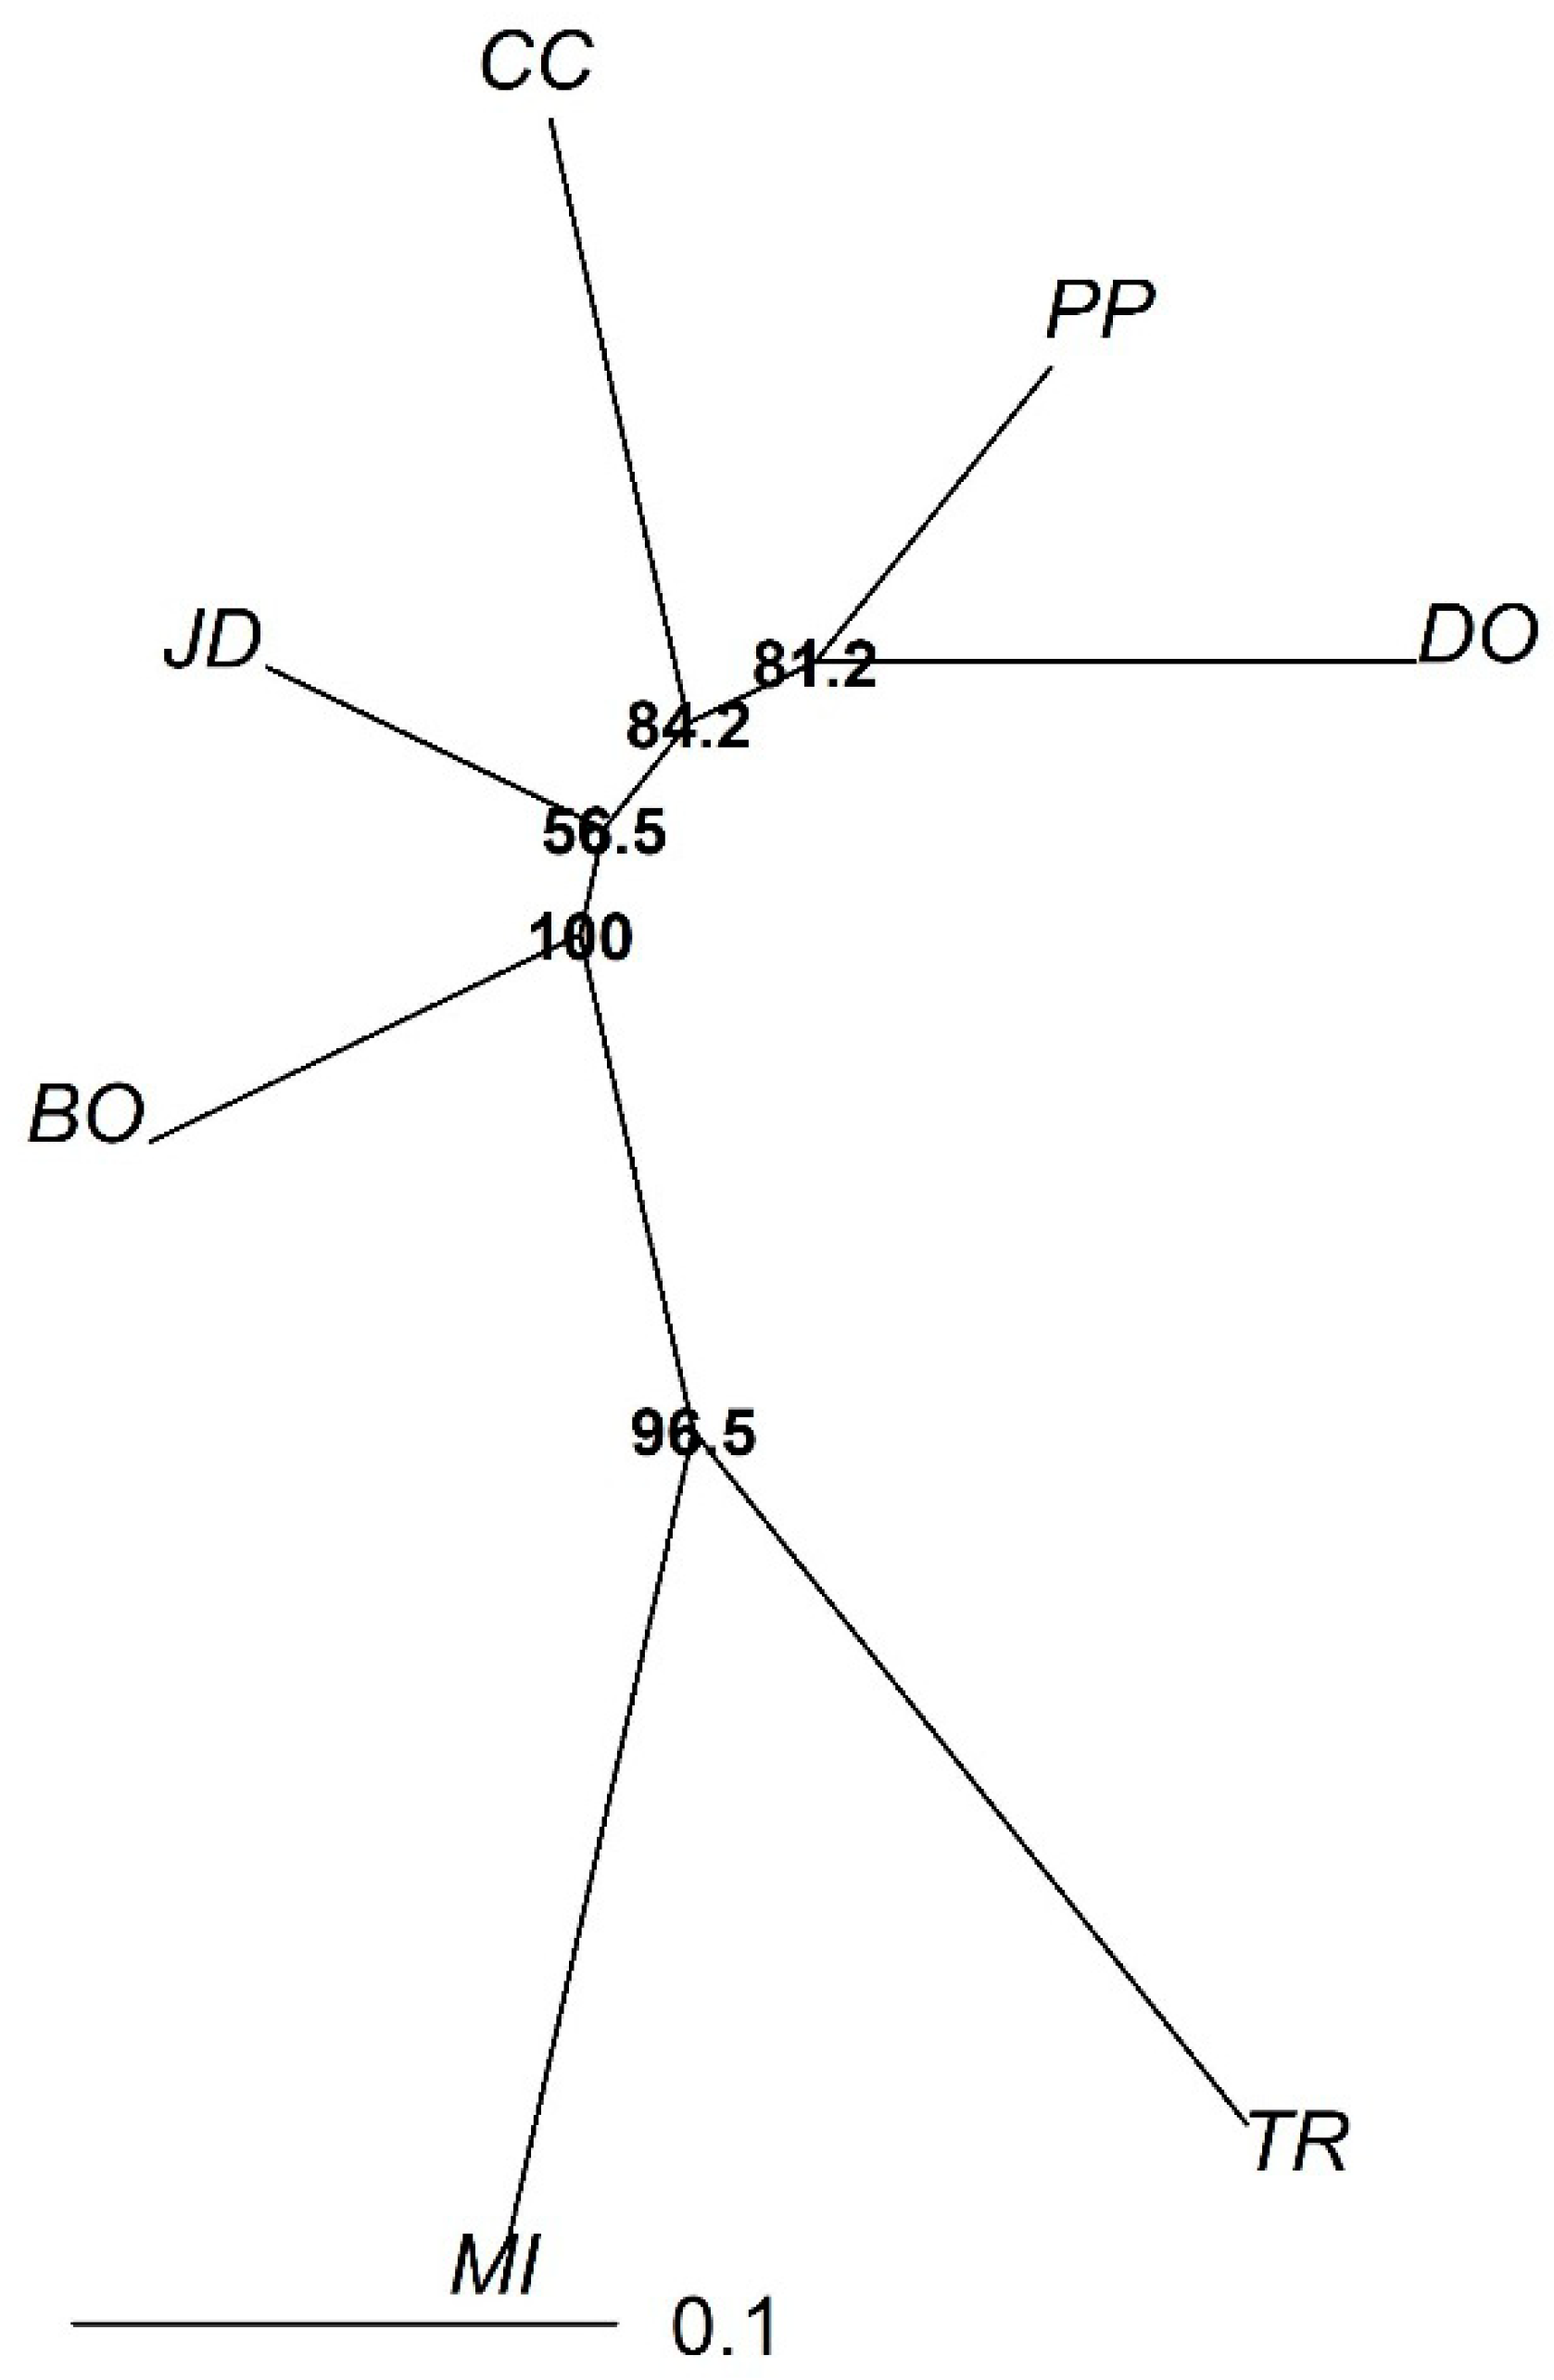
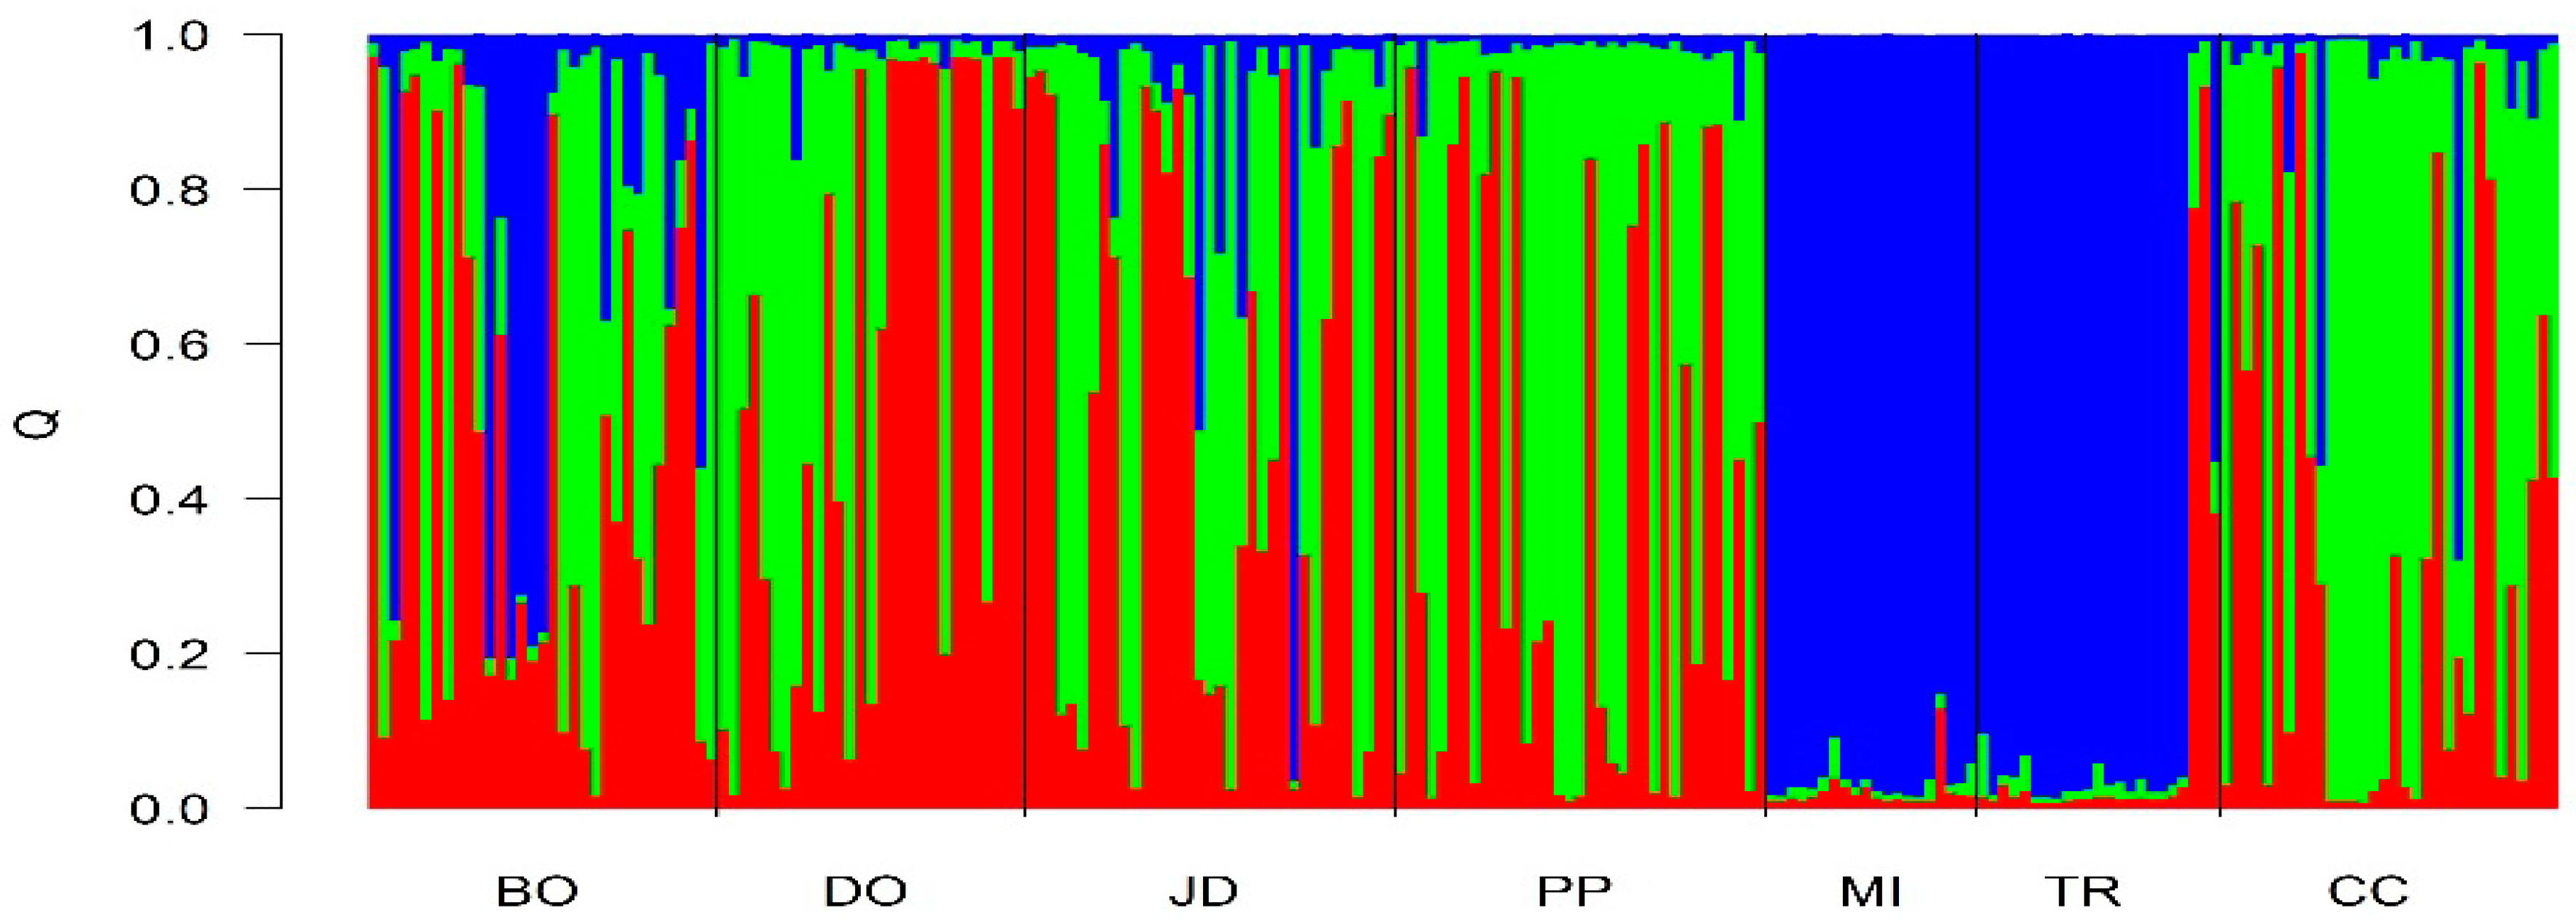
2.3. Population Genetics Analysis

Considering the fact that Myrtaceae populations are diploids, the allele frequency was estimated by direct counting. Genetic diversity parameters, including expected heterozygosity (He) and observed heterozygosity (Ho), polymorphic information content (PIC), and Hardy–Weinberg equilibrium (HWE) were estimated using CERVUS 3.0 software [22]. FSTAT software [23] was used to calculate allelic richness and F statistics; p-values were adjusted using the Bonferroni procedure [24] with the same statistical package. Population structure was evaluated by analysis of molecular variance (AMOVA) using the ARLEQUIN program [25]. The dendrogram was constructed by cluster analysis using the neighbor-joining method based on calculations of Reynold’s genetic distances and 1000 bootstrap resamplings using poppr [26] and ape [27] R packages (R Development Core Team 2018). The Mantel test was used to evaluate whether there was a positive correlation between the matrix of genetic differentiation between the pairs of populations (FST) and the spatial distance matrix between the populations using ade4 [28] R package.
The departures from the linkage disequilibrium between pairs of loci with significance set at p < 0.05 were assessed with GENEPOP v. 4.1 [29] and were later adjusted using a sequential Bonferroni correction [24].
Individuals were grouped into seven populations and assigned using a probabilistic approach into groups inferred by the Bayesian method used in the STRUCTURE software program [30]. The tests were performed using an admixture model in which the allelic frequencies were correlated. To select the appropriate number of inferred populations, several analyses were conducted with K (number of populations inferred) ranging from 2 to 10, with 300,000 interactions (burn-in period of 3000) and three independent replications for each analysis. The real values of K were inferred from the magnitude of ΔK and given as a function of K with the aid of the Structure Harvester program [31] following the model proposed by Evanno et al. [32].
The software BOTTLENECK version 1.2.02 [33] was used to evaluate the hypothesis of historical reduction in effective population size, which would decrease genetic diversity (bottleneck). Gene diversity was estimated under the two-phase model (TPM)—setting 95% of the single-step stepwise mutation model (SMM) and 5% of the infinite allele model (IAM)—with a variance of 12 among multiple steps, as recommended for microsatellite loci [33]. Based on 1000 replications, one-sided Wilcoxon signed rank tests [34] were performed to evaluate whether the allele frequency distribution deviated significantly from the expected distribution under mutation-drift equilibrium.

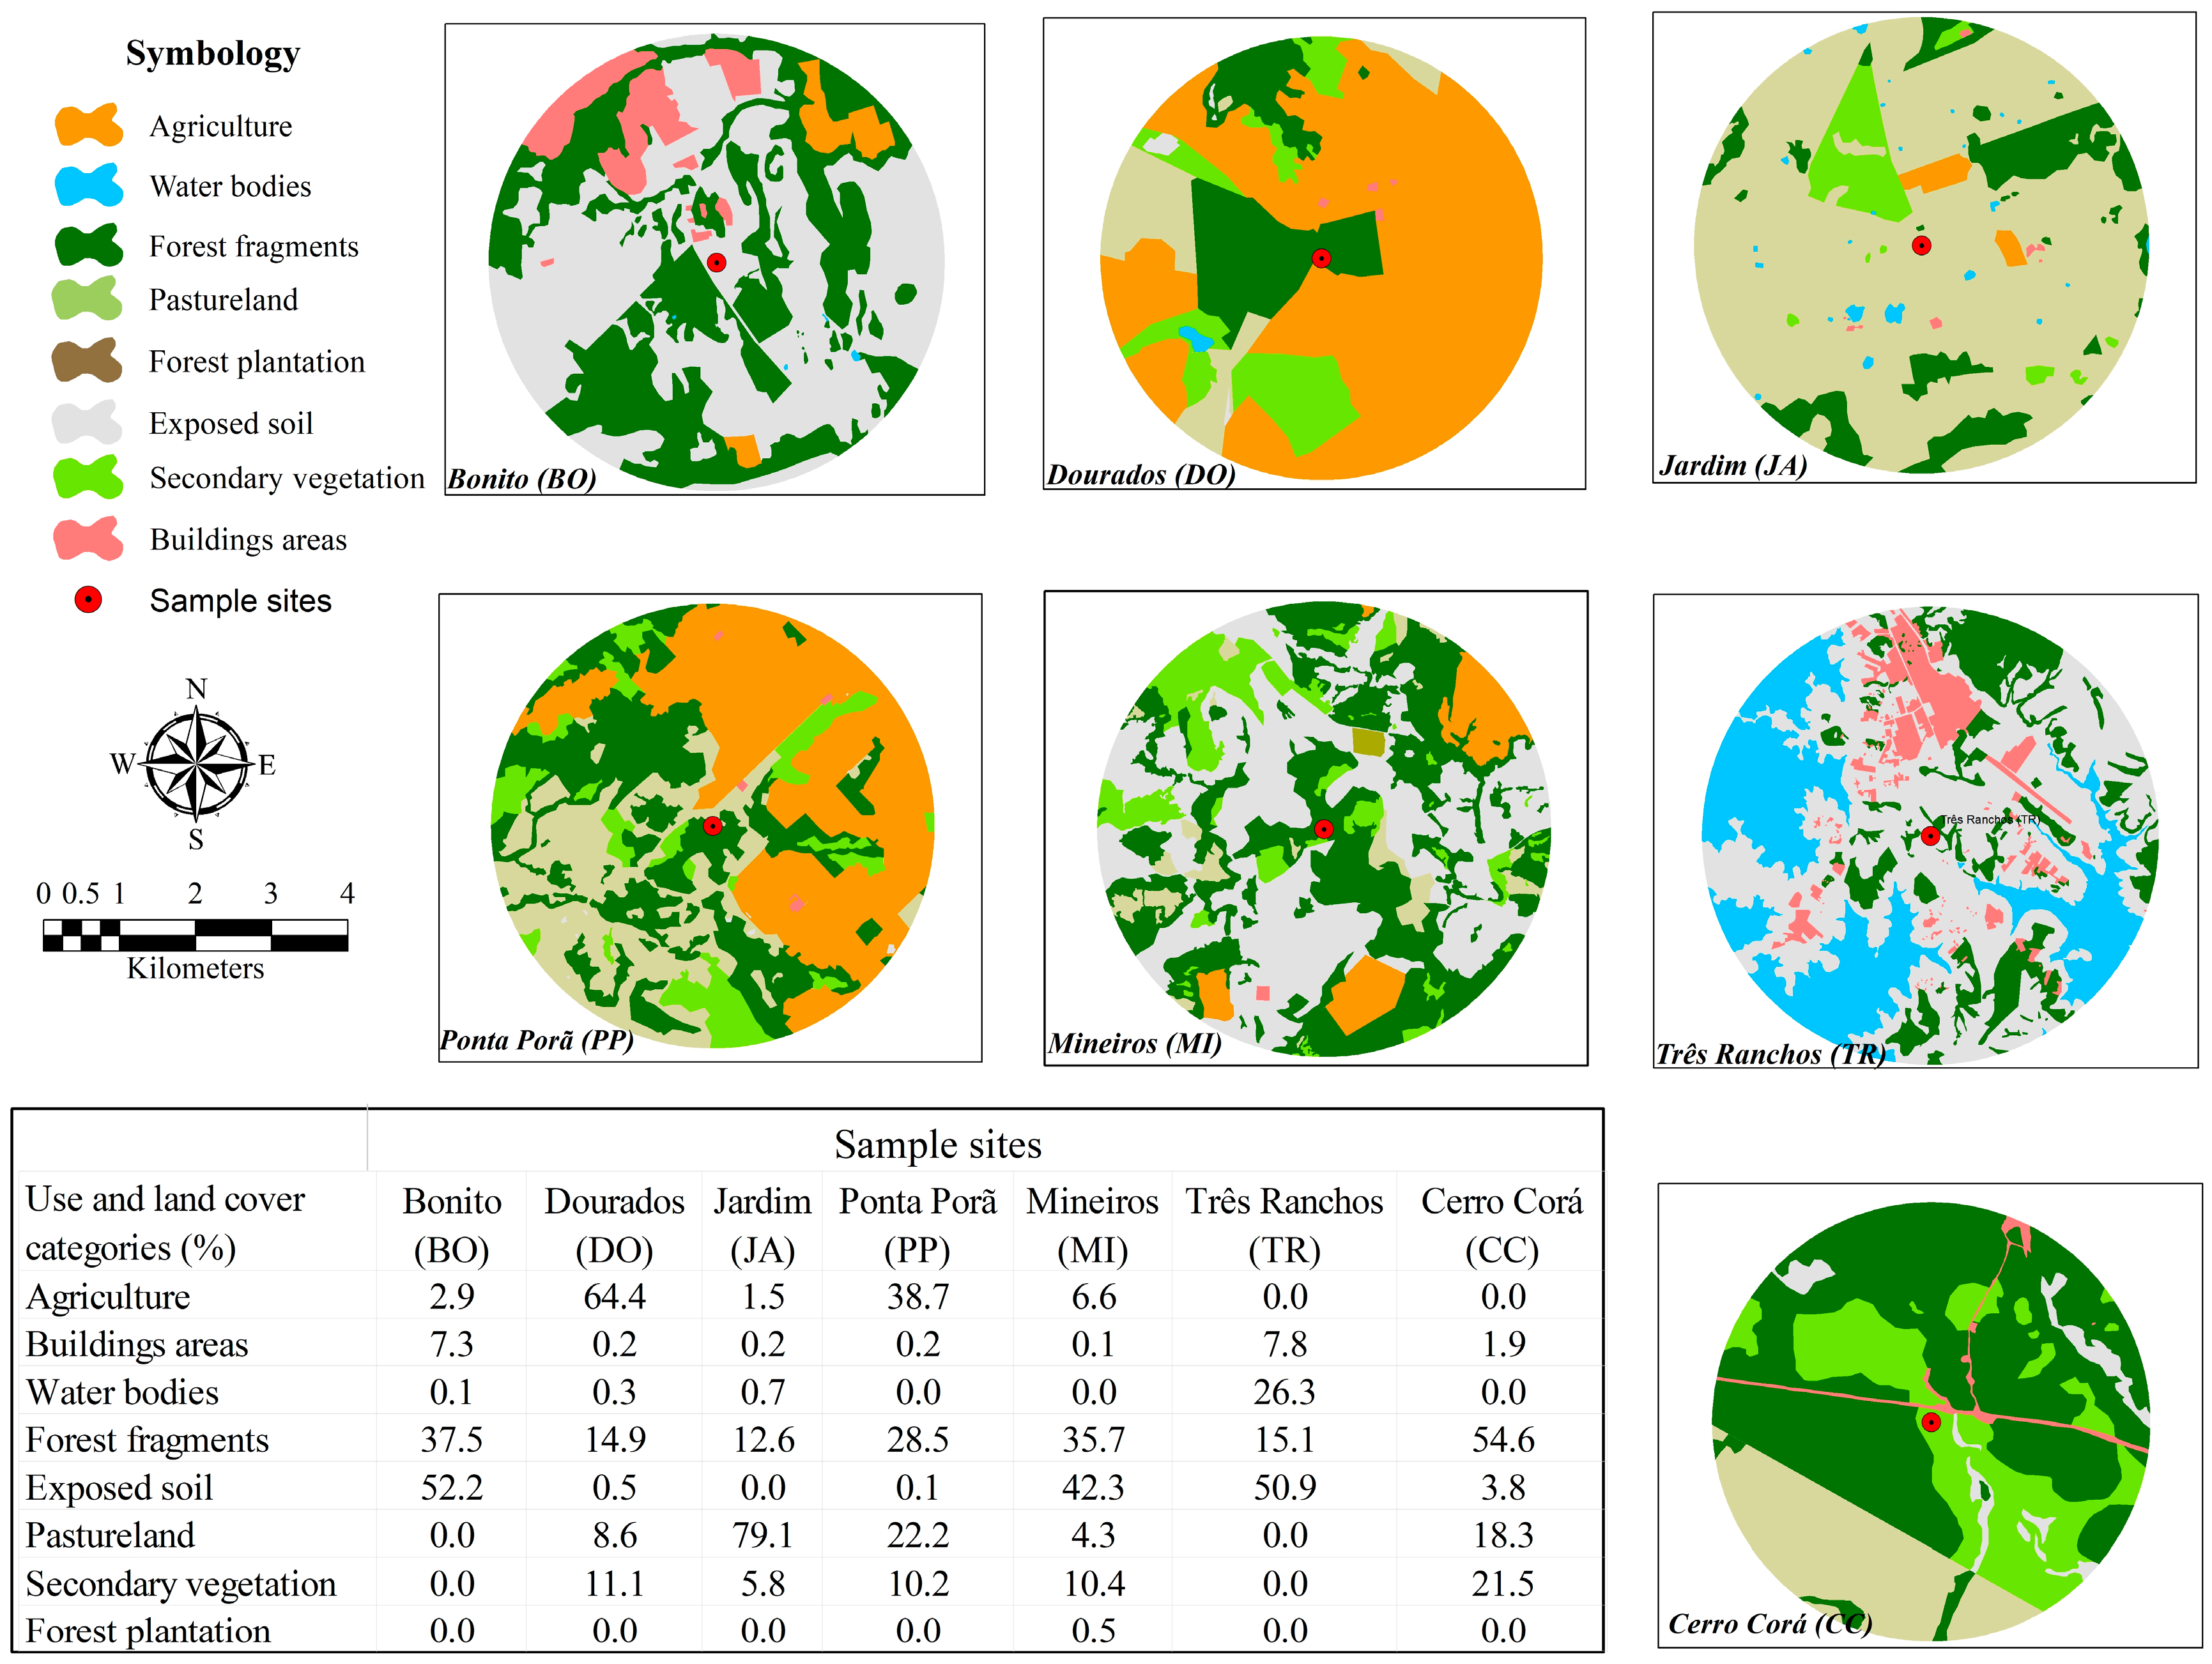
2.4. Use and Land Cover Analysis

The use and coverage of land was mapped based on aerial images (December 2011) obtained from Google Earth Pro® software with a pixel size (cell) of 1 m. For the study limit, buffers of 3 km radius were generated around each sampling site (7 sites) considering the pressure exerted by an area of this magnitude on genetic variability. Land use forms were classified as agriculture, forest fragments, forest plantations, exposed soil, water bodies, building areas, pasture land, and secondary vegetation. For the interpretation of the images, a visual classification was performed using the digitalization tools provided by ArcGIS 10.4® software in the trial version [35], which was used to calculate the areas and percentages of each category of land occupation.

3. Results

The genetic parameters analyzed for the genotyping of seven microsatellite loci of 207 C. adamantium samples belonging to the seven populations are described in Table 1. We detected 71 alleles and the size of the fragments ranged from 197 to 396 base pairs at the seven loci analyzed. All loci were polymorphic, presenting a mean of 10.14 ± 6.12 alleles per locus. The Embra1364 locus had the highest number of polymorphisms (21 alleles) and Embra1076 had the lowest number of polymorphisms (3 alleles) (Table 1).
Tests for genotypic linkage disequilibrium confirmed the null hypothesis of the independence of loci pairs (p < 0.01). Considering the genetic analysis performed in this study, the Bonito population presented the highest average number of alleles per locus (6.14) and the highest allelic richness (5.64) compared with the other populations. The Três Ranchos population had the lowest values (4.57 and 4.50, respectively) (Table 2).
When the populations were analyzed together, all the microsatellite loci were found to be in Hardy-Weinberg equilibrium (HWE) (Table 2). However, when statistical analysis was performed for each population, Jardim had only one marker in equilibrium. The Dourados and Cerro Corá populations had the highest number of markers in equilibrium (4) (Table 2). The inbreeding coefficients (FIS) were low in all populations, and some populations had negative coefficients (Table 2).
The matrix of genetic differentiation among populations based on the FST indices is shown in Table 3. The highest rates of genetic differentiation (0.111) and geographic distance (645,465) were between the Dourados/MS and Três Ranchos/GO populations. By contrast, the lowest values of genetic differentiation (0.009) and geographic distance (39,941) were between the Jardim/MS and Bonito/MS populations. Using population differentiation, we identified the populations from Mato Grosso do Sul and Paraguay as genetically more distant than the Goiás population. The Mantel test revealed that the pairwise measurements estimated among populations revealed a positive relationship between geographic distance (km) and genetic distance (rho = 0.467, p = 0.005).
AMOVA revealed that the genetic structure among populations was low (FST = 0.06) but higher within populations, and estimates of differentiation based on FST were significant (p < 0.001). Neighbor-joining data analysis indicated that the Bonito and Jardim/MS population occupied an intermediate position in relation to other populations. The Três Ranchos and Mineiros populations of Goiás were grouped differently, showing their genetic proximity when compared with other populations. The Goiás population had the greatest distance in relation to other populations (Figure 2).
Table 4 shows the proportions of each population attributed to the three groups inferred from the STRUCTURE program with minimal variance. As shown in Table 4, cluster 2 represents the populations of Goiás state, with 97% for Três Ranchos/GO and 96% for Mineiros/GO the correct allocation of its individuals in their respective populations. Cluster 1 represents the populations of Cerro Corá (Paraguay) and Ponta Porã, with correct allocation ratios of 56% and 57%, respectively. The Dourados population is the only allocation in cluster 3 (57%) with statistical significance (p < 0.05).
The genetic structure of the populations was analyzed using Bayesian statistics with the STRUCTURE program. The grouping of k = 3 (Figure 3) corresponds to the real k according to the methodology proposed by Evanno et al. [32]; in cases where there were complex patterns of admixture for all populations, the Mato Grosso do Sul and Paraguay populations were analyzed. The figure shows the similarity between the populations of Três Ranchos and Mineiros from Goiás. In spite of having a lower proportion than the other groups, the Mato Grosso do Sul and Paraguay populations seem to share the same genetic pool and the occurrence of admixture is visible within these populations.
The analysis of the use and coverage of land was shown in Figure 4. Based on the results, the populations of Dourados and Ponta Porã/MS presented the highest values of areas with agriculture.
The analyses of reductions in population size using SMM did not detect bottlenecks in the all populations analyzed. However, bottleneck effects were observed in Ponta Pora/MS population when TPM was used (p < 0.01, Table 5).

4. Discussion

The number of alleles obtained for the seven loci analyzed was higher than the number obtained by Miranda et al. [18], which used the same markers obtaining an average of seven alleles per locus in two populations of C. adamantium in the state of Goiás. The higher average number of alleles (10.14) (Table 1) found in our study can be explained by several factors, such as differences in the sample number between the two experiments. Miranda et al. [18] tested the markers in only two populations of the same state using 40 individuals; our study was carried out on six populations in Brazil in two different states (Mato Grosso do Sul and Goiás) and a population of Cerro Corá located in a Natural Reserve in Paraguay. The discrepancy in variability among the results may be related to differential selective pressure that can occur in each of the environments (agricultural areas, pasture, or national park).
The high genetic variability in C. adamantium has been revealed in other studies. For example, Miranda et al. [18] observed high genetic diversity in two populations from Goiás (Ho = 0.50). However, in that research, the results were low compared to the present study (Ho = 0.61). The high genetic diversity of guavira was also detected by Assis et al. [17], who verified high rates of polymorphisms in populations from Goiás using random amplified polymorphic DNA (RAPD) markers. In addition, the results of high genetic variability found by applying molecular markers corroborated the high phenotypic variability already found in guavira in studies that used biometrics [5,6,7,8].
The Bonito, Cerro Corá, and Jardim populations displayed great allelic richness when compared with the other populations (Table 2). This is possibly due to the higher number of individuals and the lower levels of agriculture in the surroundings areas (Figure 4). These sites are also centers of ecological tourism in the state of Mato Grosso do Sul. Environmental education has led the residents to conserve this native species in this biome because the fruits are widely consumed by them.
The Dourados, Ponta Porã, Três Ranchos, and Mineiros populations had the lowest values of allelic richness according to the number of alleles per locus. This fact can possibly be explained by the loss of alleles due to genetic drift caused by anthropic action and low numbers of individuals—the population Três Rachos and Mineiros is surrounded by areas of exposed soil, while Dourados and Ponta Porã are located in a region with higher level of agricultural activities (Figure 4). Anthropic action and the increasing expansion of farming have caused a loss of habitat that may have reduced the size of the population [36]. The constant use of pesticides has contributed to a decline in diversity and the number of insect pollinators, such as bees which are the main pollinator of this species [37,38,39,40]. These factors may also have contributed to the decrease in the genetic diversity in populations of C. adamantium with higher levels of human disturbance and agriculture in their surroundings.
The population of Ponta Porã is experiencing recent bottlenecks (Table 5) due to the higher level of agricultural activities in the surrounding areas (Figure 4). The TPM model is more suitable for the analysis of microsatellite loci as it incorporates SMM but takes wide variation in the magnitude of mutations into account by considering the fact that some mutations involve more than one repeat unit [41]. In our recent return to this site, we saw a decrease in the number of individuals, which indicates this population may be at risk of extinction.
The dendrogram (Figure 2) and the matrix (Table 3) reveals that geographically close populations were more closely related genetically, as demonstrated by the populations from Goiás and the other populations from Mato Grosso do Sul and Paraguay. This fact can be explained by the sharing of alleles providing higher genetic similarity (Table 3) and closeness, as indicated in the dendrogram produced using the neighbor-joining method (Figure 3). The Jardim and Bonito were positioned among the other populations (CC/PP/DO and MI/TR) in the dendrogram, which may indicate admixture with all populations analyzed. Geographic distance among the populations directly affected gene flow, demonstrating the so-called “isolation by distance” [42].
The results of AMOVA showed that variation among populations was lower [43] and significant, according to the fixation index (FST = 0.06). Based on this criterion, it is possible to infer that the populations may be considered genetically similar. Therefore, the populations of Goiás differed from the other populations, but the populations of MS and Paraguay displayed admixture (Figure 1 and Table 3).
In general, the genetic distance among the populations was directly proportional to their geographic distance; this may be related to the difficulty of allele sharing [36,44,45]. Thus, both genetic proximity results can be correlated to the geographic proximity of the populations (Table 3) because the populations of Mato Grosso do Sul and Paraguay, owing to their proximity, were genetically close. Bonito and Jardim are closer to each other (39 km), while the populations of Dourados and Bonito are more distant (193 km). The populations of Goiás were also close to each other, representing a clade that was distinct from the other populations.
The number of populations, as well as the population structure generated by the STRUCTURE program (Figure 3), also confirmed a degree of admixture within the populations of Mato Grosso do Sul and Paraguay and that the Goiás populations were genetically distinct. Although a sharing of alleles with other populations is inferred, more studies are necessary to confirm this, including using a greater number of markers because the use of transferable markers may not have provided a true picture of the genetic diversity in the populations analyzed. The present study is the first to characterize populations of C. adamantium from different sites in the Cerrado biome using microsatellites markers.
Considering the fact that genetic variability among populations of C. adamantium demonstrates a pattern of differentiation apparently correlated with geographical distance, this genetic flow might correspond to differences in population structure. The high density, frequency, and distribution of these species in the environment are also characteristics that support these models of gene flow [4]. Thus, the way in which the land is used is an important factor for genetic variability. For instance, intense agriculture causes a significant decrease in genetic variability. In a study carried out with Trillium grandiflorum, Vellend et al. [19] observed that populations collected in secondary forest area derived from abandoned agricultural fields showed a decrease in genetic diversity when compared with primary forests. Other studies have reported that the intensification of agricultural areas leads to the loss of biodiversity [46,47,48] and hence a decrease in genetic variability.
The high genetic diversity found in the C. adamantium populations in this and other studies shows the importance of in situ conservation of this species in the Cerrado biome. It also highlights the need for conservation of populations owing to the possible existence of private or unique alleles. The knowledge of the genetic groups formed based on the genetic variants associated with the influence of geographic distance and the use and coverage of land have implications for evolutionary biology, ecology, and the conservation of the species.
The existence of low interpopulation differentiation, gene flow patterns related to the geographical distance, and the high phenotypic variability reported in other studies [6,8,9] may be correlated with the high genetic variability revealed at the molecular level in this study. Thus, correlation studies between phenotypic characteristics of interest and genetic variations detected by molecular markers can be performed to aid in the selection of superior genotypes. In addition, the populations investigated in this study constitute useful variability reserves for C. adamantium breeding programs.

5. Conclusions

The genetic diversity was high in all populations, with low levels of differentiation due to allele sharing mainly in the populations of Mato Grosso do Sul and Paraguay. The geographically closest populations were more genetically similar. The genetic groups formed based on the genetic variants were related to the geographic distance and the use and coverage of land, indicating that intense agriculture promotes a significant decrease in genetic variability. The in situ and ex situ conservation from guavira populations will help prevent the loss of genetic diversity. This is of extreme importance for the survival of guavira and can improve the selection of superior genotypes for the breeding of this promising species in the Cerrado biome.

Author Contributions

Conceptualization, B.d.A.C. and A.B.G.; Formal analysis, B.d.A.C., A.A.d.V., T.G.D., R.d.S.B., T.d.O.C. and J.C.J.S.; Funding acquisition, M.P.d.C.T., M.d.C.V. and A.B.G.; Investigation, B.d.A.C.; Methodology, B.d.A.C., A.A.d.V, M.M.B., T.G.D., R.d.S.B., M.P.d.C.T., T.d.O.C. and J.C.J.S.; Project administration, M.d.C.V.; Resources, M.d.C.V.; Supervision, M.P.d.C.T. and A.B.G.; Visualization, T.d.O.C.; Writing–original draft, B.d.A.C., M.M.B., A.A.d.V., M.P.d.C.T. and A.B.G.; Writing–review & editing, B.d.A.C., T.G.D., M.M.B., A.A.d.V, M.d.C.V. and A.B.G.

Funding

This research was funded by Foundation for Support to the Development of Education, Science and Technology of the State of Mato Grosso do Sul (FUNDECT), National Institutes for Science and Technology (INCT) in Ecology, Evolution and Biodiversity Conservation supported by MCTIC/CNpq (proc. 465610/2014-5), and FAPEG.

Acknowledgments

We thank the Federal University of Grande Dourados (UFGD), the Coordination for the Improvement of Higher Education Personnel (CAPES), and the National Council for Scientific and Technological Development (CNPq) for promoting this research.

Conflicts of Interest

The authors declare no conflict of interest. The funding sponsors had no role in the design of the study, in the collection, analyses or interpretation of data, in the writing of the manuscript, or in the decision to publish the results.

References

  1. Silva, D.B.; Silva, J.A.; Junqueira, N.T.V.; Andrade, L.R.M. Frutas do Cerrado; Embrapa Informação Tecnológica: Brasília, Brazil, 2001; p. 179. [Google Scholar]
  2. Porto, A.C.; Gulias, A.P.M. Gabiroba. In Frutas Nativas da Região Centro-Oeste do Brasil, 1st ed.; Vieira, R.F., Agostini-Costa, T.S., Silva, D.D., Ferreira, F.R., Sano, S.M., Eds.; Embrapa Recursos Genéticos e Biotecnologia: Brasília, Brazil, 2007; pp. 164–172. [Google Scholar]
  3. Cardoso, C.A.; Salmazzo, G.R.; Honda, N.K.; Prates, C.B.; Vieira, M.C.; Coelho, R.G. Antimicrobial activity of the extracts and fractions of hexanic fruits of Campomanesia species (Myrtaceae). J. Med. Food 2006, 13, 1273–1276. [Google Scholar] [CrossRef] [PubMed]
  4. Agostini-Costa, T.S.; Silva, D.B.; Vieira, R.F.; Sano, S.M.; Ferreira, F.R. Espécies de maior relevância para a região Centro-Oeste. In Frutas Nativas da Região Centro-Oeste do Brasil, 1st ed.; Vieira, R.F., Agostini-Costa, T.S., Silva, D.D., Ferreira, F.R., Sano, S.M., Eds.; Embrapa Recursos Genéticos e Biotecnologia: Brasília, Brazil, 2007; pp. 12–24. [Google Scholar]
  5. Melchior, S.J.; Custódio, C.C.; Marques, T.A.; Machado, N.B. Colheita e armazenamento de sementes de gabiroba (Campomanesia adamantium Camb.-Myrtaceae) e implicações na germinação. Rev. Bras. Sementes 2006, 28, 141–150. [Google Scholar] [CrossRef]
  6. Resende, H.C.; Teixeira, T.A. Diversidade genética em Campomanesia (MYRTACEA) estimada por análise multivariada de características fenotípicas. Ceres 2009, 56, 85–92. [Google Scholar]
  7. Oliveira, M.C.; Santana, D.G.; Santos, C.M. Biometrics of fruits and seeds and seedling emergence of two species fruit of the Campomanesia genus. Rev. Bras. Frutic. 2011, 33, 446–455. [Google Scholar] [CrossRef]
  8. Dresch, D.M.; Scalon, S.P.Q.; Masetto, T.E.; Vieira, M.C. Germination and vigor of Campomanesia adamantium seeds according to fruit and seed size. Pesqui. Agropecu. Trop. 2013, 43, 262–271. [Google Scholar] [CrossRef]
  9. Wesp, C.L.; Santana, M.A.; Gasparetto, B.F.; Barros, I.B.I. Caracterização física de frutos de guabirobeiras (Campomanesia spp.) coletados no estado do Rio Grande do Sul. Cad. Agroecol. 2013, 8, 1–4. [Google Scholar]
  10. Sehgal, D.; Raina, S.N. DNA markers and germplasm resource diagnostics: New perspectives in crop improvement and conservation strategies. In Utilization of Biotechnology in Plant Sciences; Arya, I.D., Arya, S., Eds.; Forest Research Institute: Dehradun, India, 2008; pp. 39–54. [Google Scholar]
  11. Varshney, R.K.; Graner, A.; Sorrells, M.E. Genic microsatellite markers in plants: Features and applications. Trends Biotechnol. 2005, 23, 48–55. [Google Scholar] [CrossRef] [PubMed]
  12. Brondani, R.P.V.; Brondani, C.; Tarchini, R.; Grattapaglia, D. Development, characterization and mapping of microsatellite markers in Eucalyptus grandis and E. urophylla. Theor. Appl. Genet. 1998, 97, 816–827. [Google Scholar] [CrossRef]
  13. Parida, S.K.; Kalia, S.K.; Kaul, S.; Dalal, V.; Hemaprabha, G.; Selvi, A.; Pandit, A.; Singh, A.; Gaikwad, K.; Sharma, T.R.; et al. Informative genomic microsatellite markers for efficient genotyping applications in sugarcane. Theor. Appl. Genet. 2009, 118, 327–338. [Google Scholar] [CrossRef] [PubMed]
  14. Chiang, Y.C.; Shih, H.C.; Chang, L.W.; Li, W.R.; Lin, H.Y.; Ju, L.P. Isolation of 16 polymorphic microsatellite markers from an endangered and endemic species. Podocarpus nakaii (Podocarpaceae). Am. J. Bot. 2011, 98, 306–309. [Google Scholar] [CrossRef] [PubMed]
  15. Oliveira, E.J.; Pádua, J.G.; Zucchi, M.I.; Vencovsky, R.; Vieira, M.L.C. Origin, evolution and genome distribution of microsatellites. Genet. Mol. Biol. 2006, 29, 294–307. [Google Scholar] [CrossRef] [Green Version]
  16. Fagundes, B.S.; Silva, L.F.; Giacomin, R.M.; Secco, D.; Díaz-Cruz, J.A.; Da-Silva, P.R. Transferability of microsatellite markers among Myrtaceae species and their use to obtain population genetics data to help the conservation of the Brazilian Atlantic Forest. Trop. Conserv. Sci. 2016, 9, 408–422. [Google Scholar] [CrossRef]
  17. Assis, E.S.; Reis, E.F.; Pinto, J.F.; Contim, L.A.; Dias, L.A. Genetic diversity of gabiroba based on random amplified polymorphic DNA markers and morphological characteristics. Genet. Mol. Res. 2013, 12, 3500–3509. [Google Scholar] [CrossRef] [PubMed]
  18. Miranda, E.A.; Boaventura-Novaes, C.R.; Braga, R.S.; Reis, E.F.; Pinto, J.F.; Telles, M. P Validation of EST-derived microsatellite markers for two Cerrado-endemic Campomanesia (Myrtaceae) species. Genet. Mol. Res. 2016, 15, 1–6. [Google Scholar] [CrossRef] [PubMed]
  19. Vellend, M. Parallel effects of land-use history on species diversity and genetic diversity of forest herbs. Ecology 2004, 85, 3043–3055. [Google Scholar] [CrossRef]
  20. Doyle, J.J.; Doyle, J.L. A rapid DNA isolation procedure for small quantities of fresh leaf tissue. Phytochem. Bull. 1987, 19, 11–15. [Google Scholar]
  21. Grattapaglia, D.; Mamani, E.M.; Silva-Junior, O.B.; Faria, D.A. A novel genome-wide microsatellite resource for species of Eucalyptus with linkage-to-physical correspondence on the reference genome sequence. Mol. Ecol. Resour. 2015, 15, 437–448. [Google Scholar] [CrossRef] [PubMed]
  22. Kalinowski, S.T.; Taper, M.L.; Marshall, T.C. Revising how the computer program CERVUS accommodates genotyping error increases success in paternity assignment. Mol. Ecol. 2007, 16, 1099–1106. [Google Scholar] [CrossRef] [PubMed]
  23. Goudet, J. FSTAT: A Program to Estimate and Test Gene Diversities and Fixation Indices (Version 2.9.3.2); University of Lausanne, Department of Ecology and Evolution: Lausanne, Switzerland, 2002; Available online: http://www2.unil.ch/popgen/softwares/fstat.htm (accessed on 25 May 2018).
  24. Rice, W.R. Analyzing tables of statistical tests. Evolution 1989, 43, 223–225. [Google Scholar] [CrossRef] [PubMed]
  25. Schneider, S.; Roessli, D.; Excoffier, L. Arlequin: A Software for Population Genetics Data Analysis. User Manual ver 2.000; Genetics and Biometry Laboratory Department of Anthropology, University of Geneva: Geneva, Switzerland, 2000; Available online: http://www.cecalc.ula.ve/BIOINFO/servicios/herr1/ARLEQUIN/Arlequin.pdf (accessed on 15 June 2018).
  26. Kamvar, Z.N.; Tabima, J.F.; Grünwald, N.J. Poppr: An R package for genetic analysis of populations with clonal, partially clonal, and/or sexual reproduction. PeerJ 2014, 2, e281. [Google Scholar] [CrossRef] [PubMed] [Green Version]
  27. Paradis, E.; Claude, J.; Strimmer, K. APE: Analyses of phylogenetics and evolution in R language. Bioinformatics 2004, 20, 289–290. [Google Scholar] [CrossRef] [PubMed]
  28. Chessel, D.; Duffour, A.; Dray, S. Ade4: Analysis of Ecological Data: Exploratory and Euclidean Methods in Environmental Sciences. 2011. Available online: http://cran.r-project.org/web/packages/ade4/ (accessed on 22 January 2018).
  29. Raymond, M.; Rousset, F. GENEPOP (version-1.2)—Population genetics software for exact tests and ecumenicism. J. Hered. 1995, 86, 248–249. [Google Scholar] [CrossRef]
  30. Pritchard, J.K.; Stephens, M.; Donnelly, P. Inference of population structure using multilocus genotype data. Genetics 2000, 155, 945–959. [Google Scholar] [PubMed]
  31. Earl, D.A.; vonHoldt, B.M. STRUCTURE HARVESTER: A website and program for visualizing STRUCTURE output and implementing the Evanno method. Conserv. Genet. Resour. 2012, 4, 59–361. [Google Scholar] [CrossRef]
  32. Evanno, G.; Regnaut, S.; Goudet, J. Detecting the number of clusters of individuals using the software STRUCTURE: A simulation study. Mol. Ecol. 2005, 14, 2611–2620. [Google Scholar] [CrossRef] [PubMed]
  33. Piry, S.; Luikart, G.; Cornuet, J.M. Bottleneck: A computer program for detecting recent reductions in the effective size using allele frequency data. J. Hered. 1999, 4, 502–503. [Google Scholar] [CrossRef]
  34. Luikart, G.; Cornuet, J.M. Empirical evaluation of a test for identifying recently bottlenecked populations from allele frequency data. Conserv. Biol. 1998, 12, 228–237. [Google Scholar] [CrossRef]
  35. Environmental Systems Research Institute (ESRI). ArcGIS Desktop Trial Version®: Release 10.4. Redlands; Environmental Systems Research Institute: Redlands, CA, USA, 2015. [Google Scholar]
  36. Phong, D.T.; Lieu, T.T.; Hien, V.T.T.; Hiep, N.T. Genetic diversity of the endemic flat needle pine Pinus krempfii (Pinaceae) from Vietnam revealed by SSR markers. Genet. Mol. Res. 2015, 14, 7727–7739. [Google Scholar] [CrossRef] [PubMed]
  37. Cresswell, J. A meta-analysis of experiments testing the effects of a neonicotinoid insecticide (Imidacloprid) on honey bees. Ecotoxicology 2011, 20, 149–157. [Google Scholar] [CrossRef] [PubMed]
  38. Kremen, C.; Williams, N.M.; Aizen, M.A.; Gemmill-Herren, B.; LeBuhn, G.; Minckley, R.; Packer, L.; Potts, S.G.; Roulston, T.; Steffan-Dewenter, I.; et al. Pollination and other ecosystem services produced by mobile organisms: A conceptual framework for the effects of land use change. Ecol. Lett. 2007, 10, 299–314. [Google Scholar] [CrossRef] [PubMed]
  39. Henry, M.; Béguin, M.; Requier, F.; Rollin, O.; Odoux, J.F.; Aupinel, P.; Aptel, J.; Tchamitchian, S.; Decourtye, A. A common pesticide decreases foraging success and survival in honey bees. Science 2012, 336, 348–350. [Google Scholar] [CrossRef] [PubMed]
  40. Schneider, C.W.; Tautz, J.; Grünewald, B.; Fuchs, S. RFID tracking of sublethal effects of two neonicotinoid insecticides on the foraging behavior of Apis mellifera. PLoS ONE 2012, 7, e30023. [Google Scholar] [CrossRef] [PubMed]
  41. Di Rienzo, A.; Peterson, A.C.; Garza, J.C.; Valdes, A.M.; Slatkin, M.; Freimer, N. Mutational processes of simple sequence repeat loci in human population. Proc. Natl. Acad. Sci. USA 1994, 91, 3166–3170. [Google Scholar] [CrossRef] [PubMed]
  42. Hedrick, P.W. Genetics of Populations, 4th ed.; Jones and Bartlett: Boston, MA, USA, 2011; p. 675. ISBN 978-0763757373. [Google Scholar]
  43. Yeh, F.C. Population genetics. In Forest Conservation Genetics: Principles and Practice; Young, A., Boshier, D., Boyle, T., Eds.; CSIRO Publishing: Collingwood, Australia, 2000; pp. 21–37. [Google Scholar]
  44. Futuyma, D.J. Biologia Evolutiva, 2nd ed.; Sociedade Brasileira de Genética/CNPq: Riberão Preto, Brazil, 1992; p. 646. [Google Scholar]
  45. Savolainen, O.; Pyhäjärvi, T.; Knürr, T. Gene flow and local adaptation in trees. Annu. Rev. Ecol. Evol. Syst. 2007, 38, 595–619. [Google Scholar] [CrossRef]
  46. Bommarco, R.; Kleijn, D.; Potts, S.G. Ecological intensification: Harnessing ecosystem services for food security. Trends Ecol. Evol. 2013, 28, 230–238. [Google Scholar] [CrossRef] [PubMed]
  47. Charles, H.; Godfray, J.; Garnett, T. Food security and sustainable intensification. Philos. Trans. R. Soc. B 2014, 369, 20120273. [Google Scholar] [CrossRef]
  48. Lanz, B.; Simon, D.; Tim, S. The expansion of modern agriculture and global biodiversity decline: An integrated assessment. Ecol. Econ. 2018, 144, 260–277. [Google Scholar] [CrossRef]
Figure 1. Map showing locations of the populations and the geographic coordinates at various Campomanesia adamantium sample sites.
Diversity 10 00106 g001
Figure 2. Neighbor-joining dendrogram based on Reynold’s genetic distance from seven microsatellite loci. The graph shows the genetic relationship between the seven Campomanesia adamantium populations: Bonito/MS (BO); Dourados/MS (DO); Jardim/MS (JD); Ponta Porã/MS (PP); Mineiros/GO (MI); Três Ranchos/GO (TR); and Cerro Corá/AY (CC). Numbers at nodes are bootstrap values (1000 bootstraps).
Diversity 10 00106 g002
Figure 3. Individual grouping from seven different populations analyzed by the Bayesian statistical method using the STRUCTURE program. Each sample is represented by a vertical line divided into segments classified according to size and color. These results correspond to the relative proportion of the genome of Campomanesia adamantium concerning the population inferred by the program. Different populations are separated by black lines. Bonito/MS (BO); Dourados/MS (DO); Jardim/MS (JD); Ponta Porã/MS (PP); Mineiros/GO (MI); Três Ranchos/GO (TR); and Cerro Corá/AY (CC).
Diversity 10 00106 g003
Figure 4. Spatial distributions showing land and use coverage of each sample sites and the percentages of each category of land occupation from the Campomanesia adamantium sample sites.
Diversity 10 00106 g004
Table 1. Microsatellite genetic variation in Campomanesia adamantium (n = 207).
LocusNHoHePIC
Embra 107630.990.510.39
Embra 133540.420.360.32
Embra 1363160.800.890.88
Embra 1364210.780.930.92
Embra 1374120.580.800.77
Embra 147060.530.520.47
Embra 181190.190.360.34
Mean (SD)10.14 ± 6.120.61 ± 0.240.62 ± 0.220.58 ± 0.24
Number of alleles per locus (N); observed heterozygosity (Ho); expected heterozygosity (He); polymorphic information content (PIC).
Table 2. Genetic diversity of populations of Campomanesia adamantium.
PopulationsNANAHoHePAFISARHWE
Bonito/MS336.14 ± 3.180.73 ± 0.030.63 ± 0.080.04−0.15 5.642
Dourados/MS295.14 ± 2.730.61 ± 0.030.59 ± 0.080.03−0.034.774
Jardim/MS356.00 ± 3.210.73 ± 0.030.64 ± 0.070.01−0.145.481
Ponta Porã/MS355.86 ± 4.060.61 ± 0.030.61 ± 0.080.030.005.212
Mineiros/GO204.86 ± 3.760.42 ± 0.040.46 ± 0.130.040.084.812
Três Ranchos/GO204.57 ± 4.160.44 ± 0.040.44 ± 0.15NF0.004.502
Cerro Corá/AY355.86 ± 4.380.62 ± 0.030.61 ± 0.080.03−0.015.474
Number of individuals (N); average number of alleles (ANA); observed heterozygosity (Ho); expected heterozygosity (He); frequency of private alleles (PA); inbreeding coefficient (FIS); allelic richness (AR); loci number in Hardy-Weinberg equilibrium (HWE); NF: not found.
Table 3. Pairwise estimation of genetic differentiation among Campomanesia adamantium populations in the lower triangle and geographic distance (km) in the upper triangle.
BODOJDPPMITRCC
BO 192.88339.941173.368455.686463.372175.778
DO0.073 81.96140.363648.250645.465154.300
JA0.0090.035 108.585622.807639.049136.921
PP0.0500.0180.021 624.752614.854138.004
MI0.0510.1090.0810.104 151.377495.130
TR0.0740.1110.0840.1030.051 502.809
CC0.0460.0380.0210.0110.0120.010
Bonito/MS (BO); Dourados/MS (DO); Jardim/MS (JD); Ponta Porã/MS (PP); Mineiros/GO (MI); Três Ranchos/GO (TR); and Cerro Corá/AY (CC).
Table 4. Number of individuals (N) per population and proportion of the association of each population in each of three groups inferred by the STRUCTURE program. Associations greater than 0.5 are in bold.
PopulationsInferred Clusters
123N
Bonito/MS0.350.270.3833
Dourados/MS0.400.020.5729
Jardim/MS0.410.100.4835
Ponta Porã/MS0.570.020.4035
Mineiros/GO0.010.960.0220
Três Ranchos/GO0.020.970.0120
Cerro Corá/AY0.560.080.3535
Table 5. Wilcoxon test for bottlenecks in the populations of the Campomanesia adamantium.
Mutation ModelsPopulations
BODOJDPPMITRCC
T.P.M.0.343750.18750.18750.01172 *0.81250.406250.05469
S.M.M.0.289060.81250.531250.851560.960940.890630.53125
Analyses with BOTTLENECK used two microsatellite mutation models: two-phase model (TPM) and stepwise mutation model (SMM). * 95% Probability of bottlenecks (p < 0.05). Bonito/MS (BO); Dourados/MS (DO); Jardim/MS (JD); Ponta Porã/MS (PP); Mineiros/GO (MI); Três Ranchos/GO (TR); and Cerro Corá/AY (CC).

