Article

Limited Cross-Shelf Variation in the Growth of Three Branching Corals on Australia’s Great Barrier Reef

by
Deborah Burn
1,
Morgan S. Pratchett
1,*,
Scott F. Heron
2,3,4,
Cassandra A. Thompson
1,
Deborah J. Pratchett
1 and
Andrew S. Hoey
1
1
ARC Centre of Excellence for Coral Reef Studies, James Cook University, Townsville, QLD 4811, Australia
2
Coral Reef Watch, US National Oceanic and Atmospheric Administration, College Park, MD 20740, USA
3
ReefSense, Townsville, Queensland 4814, Australia
4
Marine Geophysical Laboratory, College of Science and Engineering, James Cook University, Townsville, Queensland 4811, Australia
*
Author to whom correspondence should be addressed.
Diversity 2018, 10(4), 122; https://doi.org/10.3390/d10040122
Submission received: 16 September 2018 / Revised: 31 October 2018 / Accepted: 7 November 2018 / Published: 12 November 2018

Abstract

:
Pronounced differences exist in the biodiversity and structure of coral reef assemblages with increasing distance from shore, which may be expected given marked cross-shelf gradients in environmental conditions. Cross-shelf variation in the abundance of coral reef organisms is likely to be caused, at least in part, by differences in demography (e.g., growth and survival), though this has rarely been tested. This study quantified growth of three distinct branching coral taxa (Acropora nasuta, Pocillopora spp. and Stylophora pistillata) at six locations on Australia’s Great Barrier Reef (GBR), encompassing inshore, mid-shelf and outer-shelf reefs. Replicate colonies (0–15 colonies per species, per reef) were stained using Alizarin Red in December 2015 and retrieved one year later to quantify linear extension on replicate branches for each colony. Annual linear extension varied within and among coral taxa, with pronounced differences among reefs. For A. nasuta. and S. pistillata, growth rates were highest at one of the inshore reefs, Orpheus Island. However, inter-reef differences in linear extension were not explained by shelf position. Based on differences in skeletal density, which did vary according to shelf position, branching corals at the inshore sites may actually have higher rates of calcification compared to conspecifics on mid-and outer-shelf reefs. This study shows that growth of branching corals is not lower at inshore sites (and perhaps even higher) compared to sites at mid-shelf and outer reefs, despite generally higher levels of sedimentation and turbidity.

1. Introduction

Reef building, scleractinian (“hard”) corals have specific environmental tolerances (Kleypas et al. 1999 [1]), such that individual demography, population dynamics and community structure vary markedly along environmental gradients (e.g., Done 1982 [2]; Harriot 1999 [3]; Anderson et al. 2017 [4]). Most notably, there are clear and well-defined latitudinal limits to growth and abundance of scleractinian corals and therefore, reef accretion (Buddemeier and Kinzie 1976 [5]; Kleypas et al. 1999 [1]; Muir et al. 2015 [6]), which are constrained at high latitudes by lower temperature, aragonite saturation and light levels. Even within the latitudinal limits of coral reef accretion, there are declines in diversity of coral assemblages with increasing latitude (Bellwood and Hughes, 2001 [7]). For those coral species that are distributed over a wide latitudinal extent, there are also differences in demography linked to differences in local environmental conditions (e.g., Anderson et al. 2015 [8]). In general, corals grow more slowly at high latitude locations, which is largely attributed to thermal constraints on coral growth (e.g., Harriot, 1999 [3], Anderson et al. 2015 [8], Pratchett et al. 2015 [9]) and this may in turn, lead to lower population turnover and reduced resilience (Hoey et al. 2011 [10]).
Despite considerable research on large-scale (biogeographical) patterns in coral assemblages and the various factors that contribute to these patterns (Bellwood and Hughes, 2001 [7]; Connolly et al. 2003 [11]; Keith et al. 2013 [12]), variation in coral populations and communities is often very pronounced even at relatively small spatial scales (e.g., with depth, aspect and distance from shore), associated with steep gradients in environmental conditions (Done 1982 [2]; Cleary et al. 2005 [13]). Cross-shelf variation in the abundance, biodiversity and composition of benthic reef assemblages is particularly pronounced (e.g., Done 1982 [2]; Wilkinson and Cheshire 1989 [14]; Fabricius and De’Ath 2001 [15], Wismer et al. 2009 [16]). In general, near shore (or inshore) reef habitats have higher abundance of fleshy macroalgae and coral assemblages are dominated by stress-tolerant species, whereas offshore reef habitats have higher cover of crustose coralline algae and higher diversity of corals (but see Lirman and Fong 2007 [17]). There are also marked differences in the abundance and composition of fish assemblages between inshore and offshore reefs (e.g., Williams 1982 [18]; Williams and Hatcher 1983 [19]; Russ 1984 [20]; Hoey and Bellwood 2008 [21]; Emslie et al. 2010 [22]), with possible consequences for the structure and functioning of reef ecosystems.
Cross-shelf variation in the abundance, biodiversity and composition of coral reef organisms may be ascribed to natural and inherent gradients in environmental conditions, such as depth and wave exposure (Bellwood and Wainwright 2001 [23]). However, anthropogenic transformation of coastal environments, involving land clearing, coastal development and dredging, are causing increasing sedimentation, eutrophication and pollution (Hughes et al. 2015 [24]; Kroon et al. 2016 [25]), which have disproportionate impacts on near shore systems. Increasing levels of both suspended sediment and sediment deposition have generally negative consequences for corals (Loya, 1976 [26]; Riegl and Branch 1995 [27]; Fabricius 2005 [28]; Weber et al. 2012 [29]), causing light attenuation and reduced photosynthesis versus tissue abrasion and smothering, respectively. Some coral species are capable of withstanding increased exposure to sedimentation by actively feeding on particulate matter (Anthony & Fabricius, 2000 [30]), though increased levels of sedimentation often have catastrophic impacts on established coral assemblages (Dodge & Vaisnys, 1977 [31]) if not sublethal effects such as suppressed coral growth (Fabricius 2005 [28]).
The purpose of this study was to quantify cross-shelf variation in annual linear extension (ALE) for three different taxa of branching corals; Acropora nasuta, Pocillopora spp. and Stylophora pistillata. The focus on branching corals was intended to complement previous studies (e.g., Lough and Barnes 2000 [32], Carricart-Ganivet & Merino, 2001 [33]) that have explored spatial variation (at a wide range of different scales) in growth of massive corals, for which growth can be retrospectively measured from skeletal features (Pratchett et al. 2015 [9]). Estimating growth of branching corals meanwhile, requires real time measurements of changes in weight or external dimensions. Branching corals also make disproportionate contributions to the structure and topographic complexity of reef habitats, which supports high abundance and diversity of reef organisms (Messmer et al. 2011 [34]). Moreover, branching corals are amongst the fastest growing corals (Pratchett et al. 2014 [9]) but are also very susceptible to environmental change (Hughes et al. 2018 [35]). Given the sustained and ongoing degradation of near shore environments (Kroon et al. 2016 [25]), as well as the sensitivity of branching corals to sedimentation (Fabricius 2005 [28]; Weber et al. 2012 [29]), we expected to find markedly lower growth rates on inshore reefs (located within 20 km of the coastline) compared to corals growing at reefs located up to >35 km offshore.

2. Materials and Methods
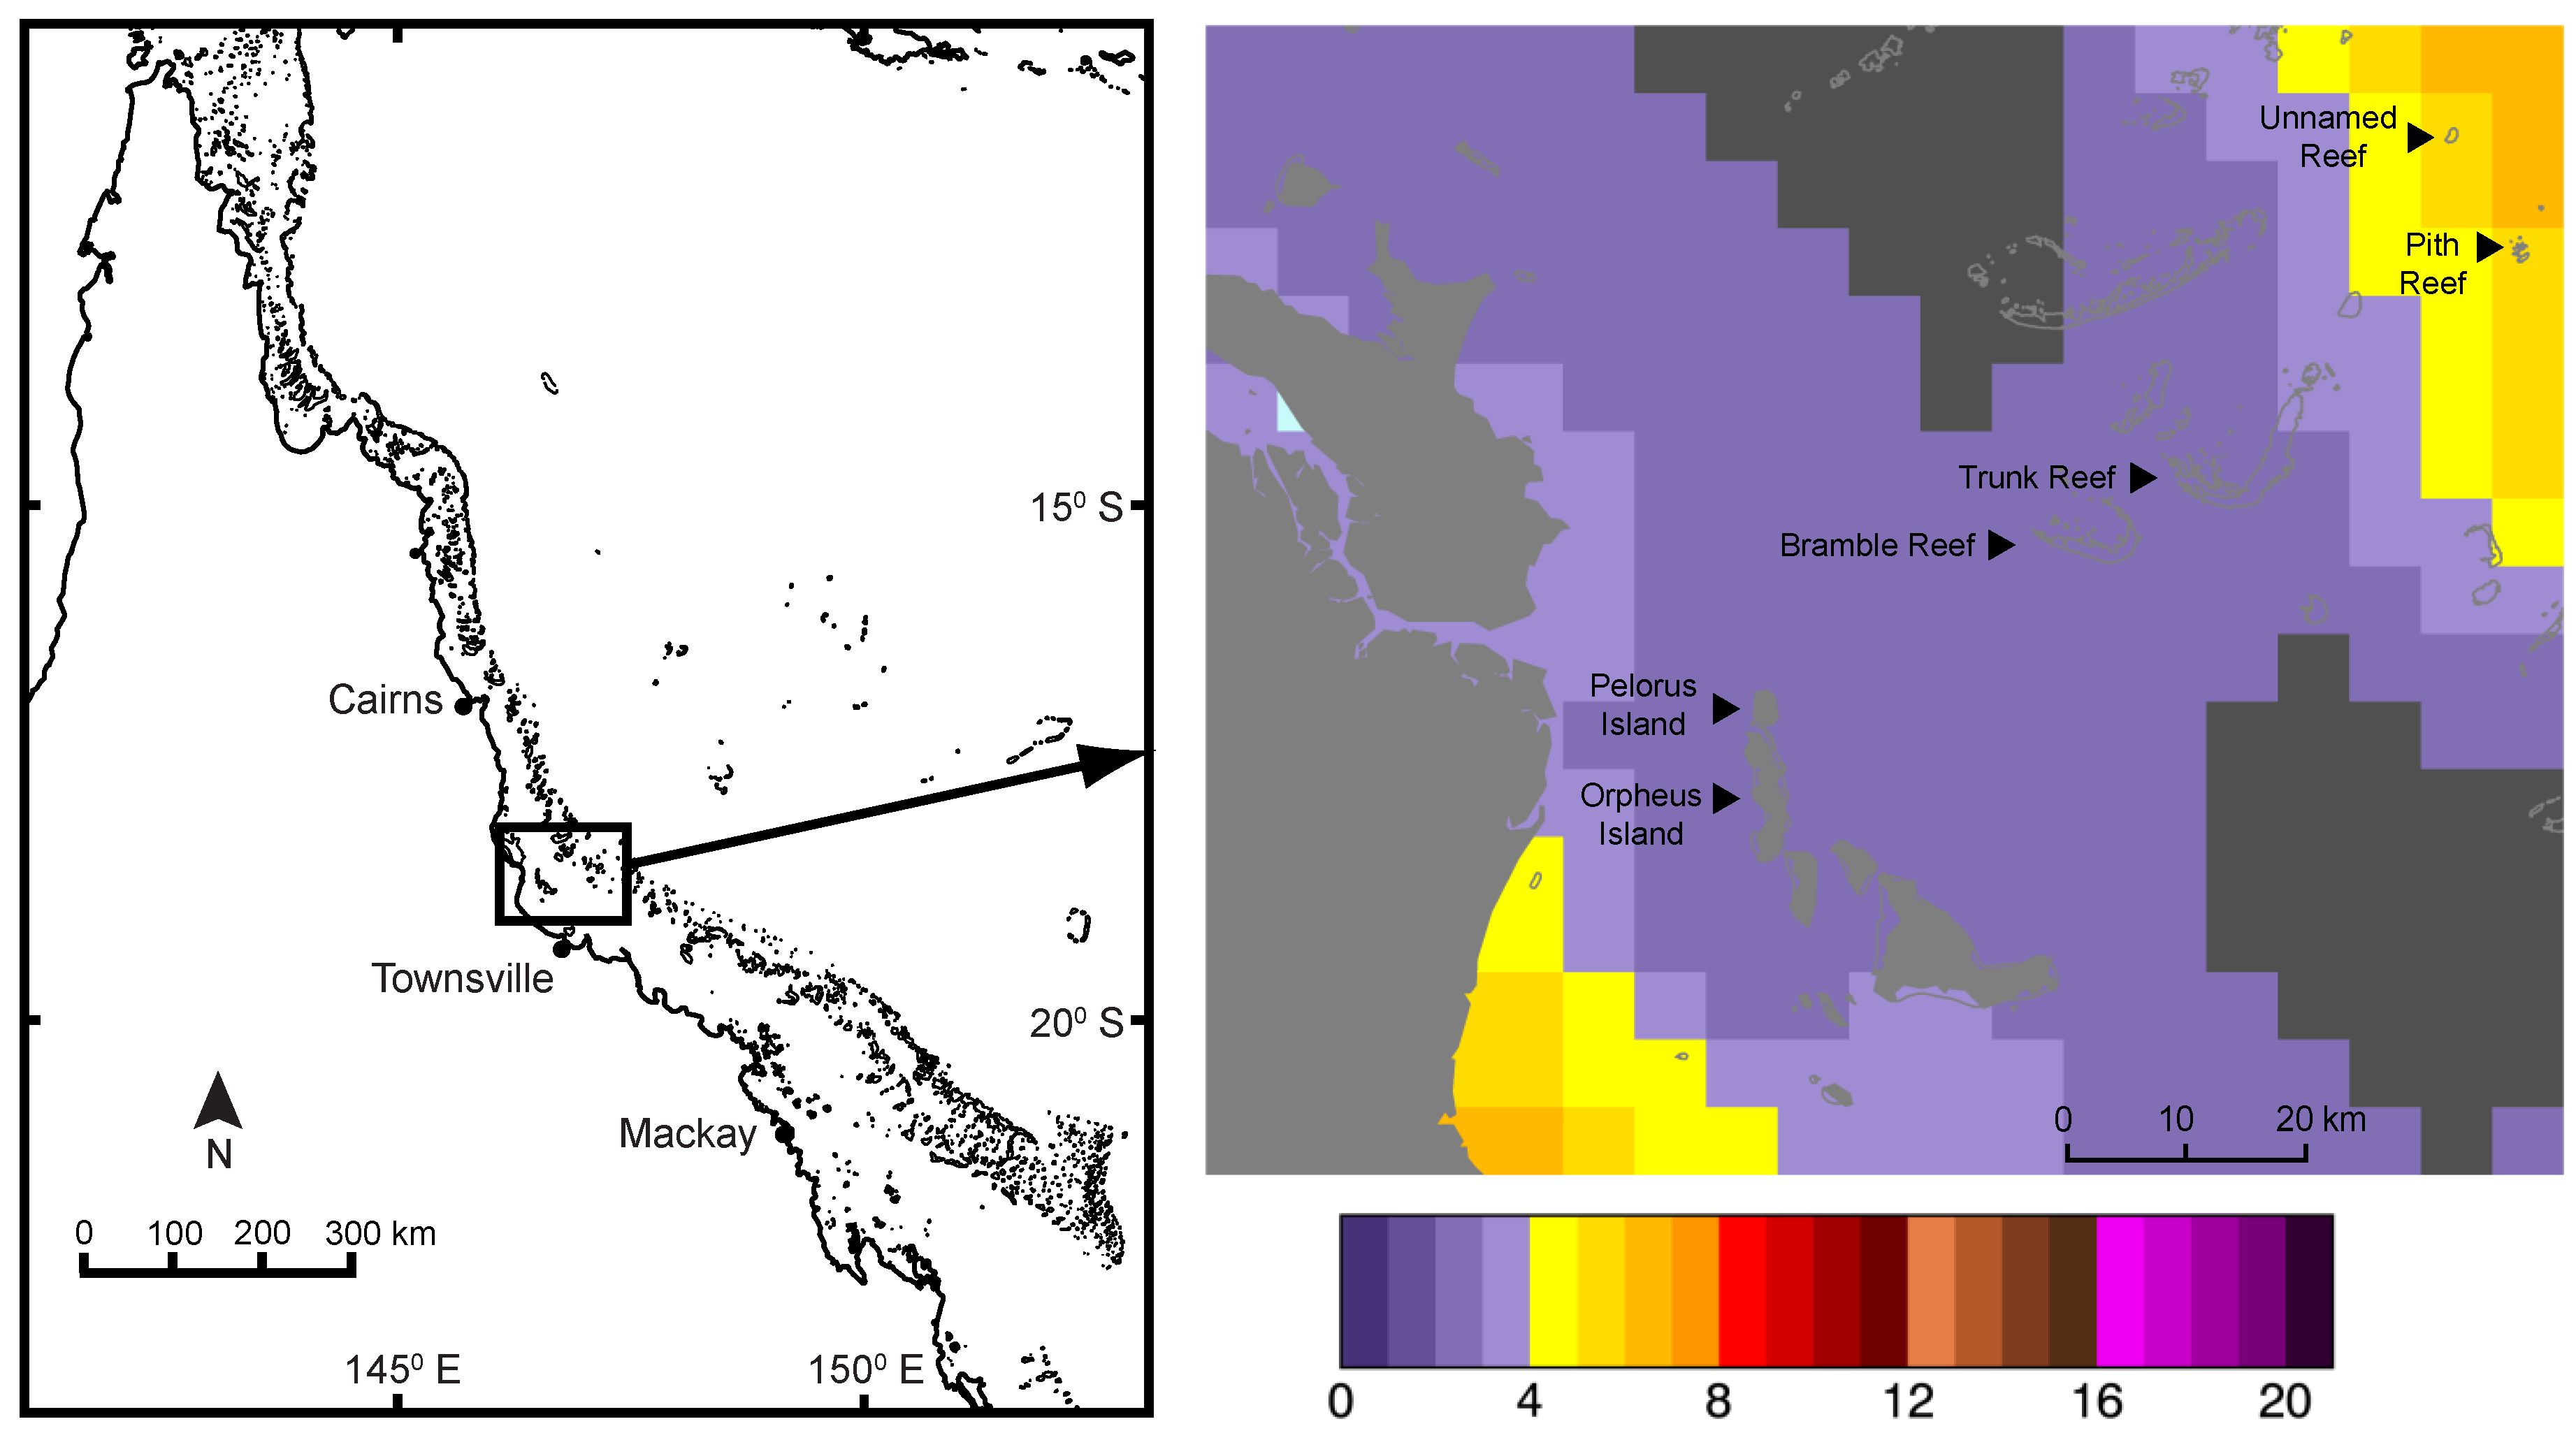
2.1. Field Sampling

Annual linear extension of three coral taxa (Acropora nasuta, Pocillopora spp. and Stylophora pistillata) was quantified at six reefs (Orpheus Island, Pelorus Island, Bramble Reef, Trunk Reef, Pith Reef and Unnamed Reef) in the central Great Barrier Reef (GBR), near Townsville, Australia (Figure 1). Pocillopora colonies were selected based on their fine branching structure and were ostensibly P. damicornis (Schmidt-Roach et al. 2014 [36]), though it is possible that some colonies were actually P. acuta. Reefs were specifically selected to represent inshore (Orpheus and Pelorus Islands), mid-shelf (Bramble and Trunk Reefs) and offshore reefs (Pith and Unnamed Reefs), though cross-shelf differences were confounded by reef type; Nearshore reefs (Orpheus and Pelorus Islands) were fringing reefs associated with continental islands whereas mid-and offshore reefs are submerged platform reefs. Sites were established on the western margin of each reef, to allow for moderate water flow but minimize more devastating effects of south-easterly swells. Sites selected at the near shore reefs (Orpheus and Pelorus Islands) were located 15 km from the coastline, compared to 35–50 km for sites on mid-shelf sites (Bramble and Trunk reefs). The outermost site, at Pith Reef, was located 75 km from the nearest coastline.
Replicate colonies of each species were collected in December 2015 from the reef flat and crest (<4 m depth) at one site per reef and then stained and tagged ex situ. Corals were stained onboard the RV James Kirby, where individual colonies were tagged with numbered cattle tags and then placed in large (200 L) plastic containers containing Alizarin Red mixed in sea water at a concentration of 12 mg·L−1, following Oliver et al. (1983 [37]). Water exchange in these tanks was stopped for four hours (during staining) to prevent dilution of the stain. Temperature of the tanks was carefully monitored during staining and where necessary partial water exchanges (with additional Alizarin Red stain added to maintain concentrations) were used to prevent temperature increasing to more than 2 °C above ambient. After four hours, the tanks were flushed with fresh seawater and the corals were held with constant flow for up to 12 h (overnight). Corals were then returned to collection locations and reattached to the reef using UV stabilized plastic cable ties.
In December 2016 (12 months after staining), stained coral colonies were retrieved to quantify ALE. Only colonies that were firmly attached, upright, clearly tagged and living were considered and retrieved (Table 1). Collected colonies were bleached, by completely submerging them in mild (5%) hypochlorite solution for up to four hours until all tissue was removed, washed with freshwater and dried in the sun. ALE was measured as the minimum distance (mm) from the point of staining to tip of relevant branch. Where possible, 12 measurements were taken for each colony recording the minimum growth on each of 12 distinct branches. For colonies with fewer than 12 distinct branches, or where staining was not clear, the maximum possible number of independent measures was used.
To account for potential cross-shelf differences in skeletal density (more specifically, bulk density; Bucher et al. 1998 [38]), which may confound estimates of linear extension (Pratchett et al. 2015 [9]), skeletal densities of entire, intact coral colonies were also quantified. The bulk density is the ratio of the colony weight to volume, whereby the volume is measured by comparing the weight of entire dry skeletons to the buoyant weight of the same skeleton when fully submerged in fresh water. Based on Archimedes’ principal the skeletal volume is equal to the difference in the dry versus buoyant weight, assuming that the density of the water (freshwater) is equal to 1 g·cm−3 (Hughes 1987 [39]).

2.2. Data Analyses

To test whether shelf position (inner, mid, versus outer reefs) had a significant effect on the growth of each of the three focal coral taxa (Acropora nasuta, Pocillopora spp. and Stylophora pistillata) we compared between General Linear Models (GLMs) that included individual reefs (coded as categorical variable), shelf position (coded as integers) or temperature (maxDHW). These variables are spatially confounded and could not be included simultaneously in the same model. In all cases, we included a random factor to account for intra-colony and/or inter-colony differences. Independent analyses were run for each coral taxon, comparing: (i) annual linear extension (measured for up to 12 branches on each of 3–15 colonies for each species) and (ii) skeletal density (measured for individual colonies). All analyses were conducted in R and model comparisons were conducted using Second-order Akaike Information Criterion (AICc), to account for small sample sizes (Burnham and Anderson 2002 [40]). After selecting the best model, we then used model summaries to explore where significant differences occurred. While depth and wave/currents exposure were controlled within the experimental design and site selection, exposure to heat stress in early 2016 (Hughes et al. 2018 [35]) could not be controlled for. Accumulated heat stress at sites was determined as the maximum Degree Heating Weeks (DHW, °C-weeks) during the staining period (Figure 1), produced by the Coral Reef Watch program of the U.S. National Oceanic and Atmospheric Administration (NOAA; coralreefwatch.noaa.gov).

3. Results

A total of 129 out of 198 (65.1%) stained colonies were successfully retrieved in December 2016, contributing to exploration of cross-shelf differences in ALE (Table 1). We concede from the outset, that sample sizes are very limiting in some instances but this reflects inherent risks associated with staining and re-deploying coral colonies for the necessary period (up to one year) to effectively quantify and resolve colony-level rates and patterns of linear extension. Moreover, the specific study species that were selected for their abundance on mid-shelf reefs, did not occur in sufficient abundance across all study sites. Notably, this is our third attempt to compare demography of branching corals among reefs at increasing distance from shore on the Great Barrier Reef; in previous attempts, corals were stained at 6 reefs in the vicinity of Lizard Island, Australia, but virtually all stained colonies (especially on nearshore reefs) were lost due to successive years of severe cyclones (Cyclone Ita–2014 and Cyclone Nathan–2015).

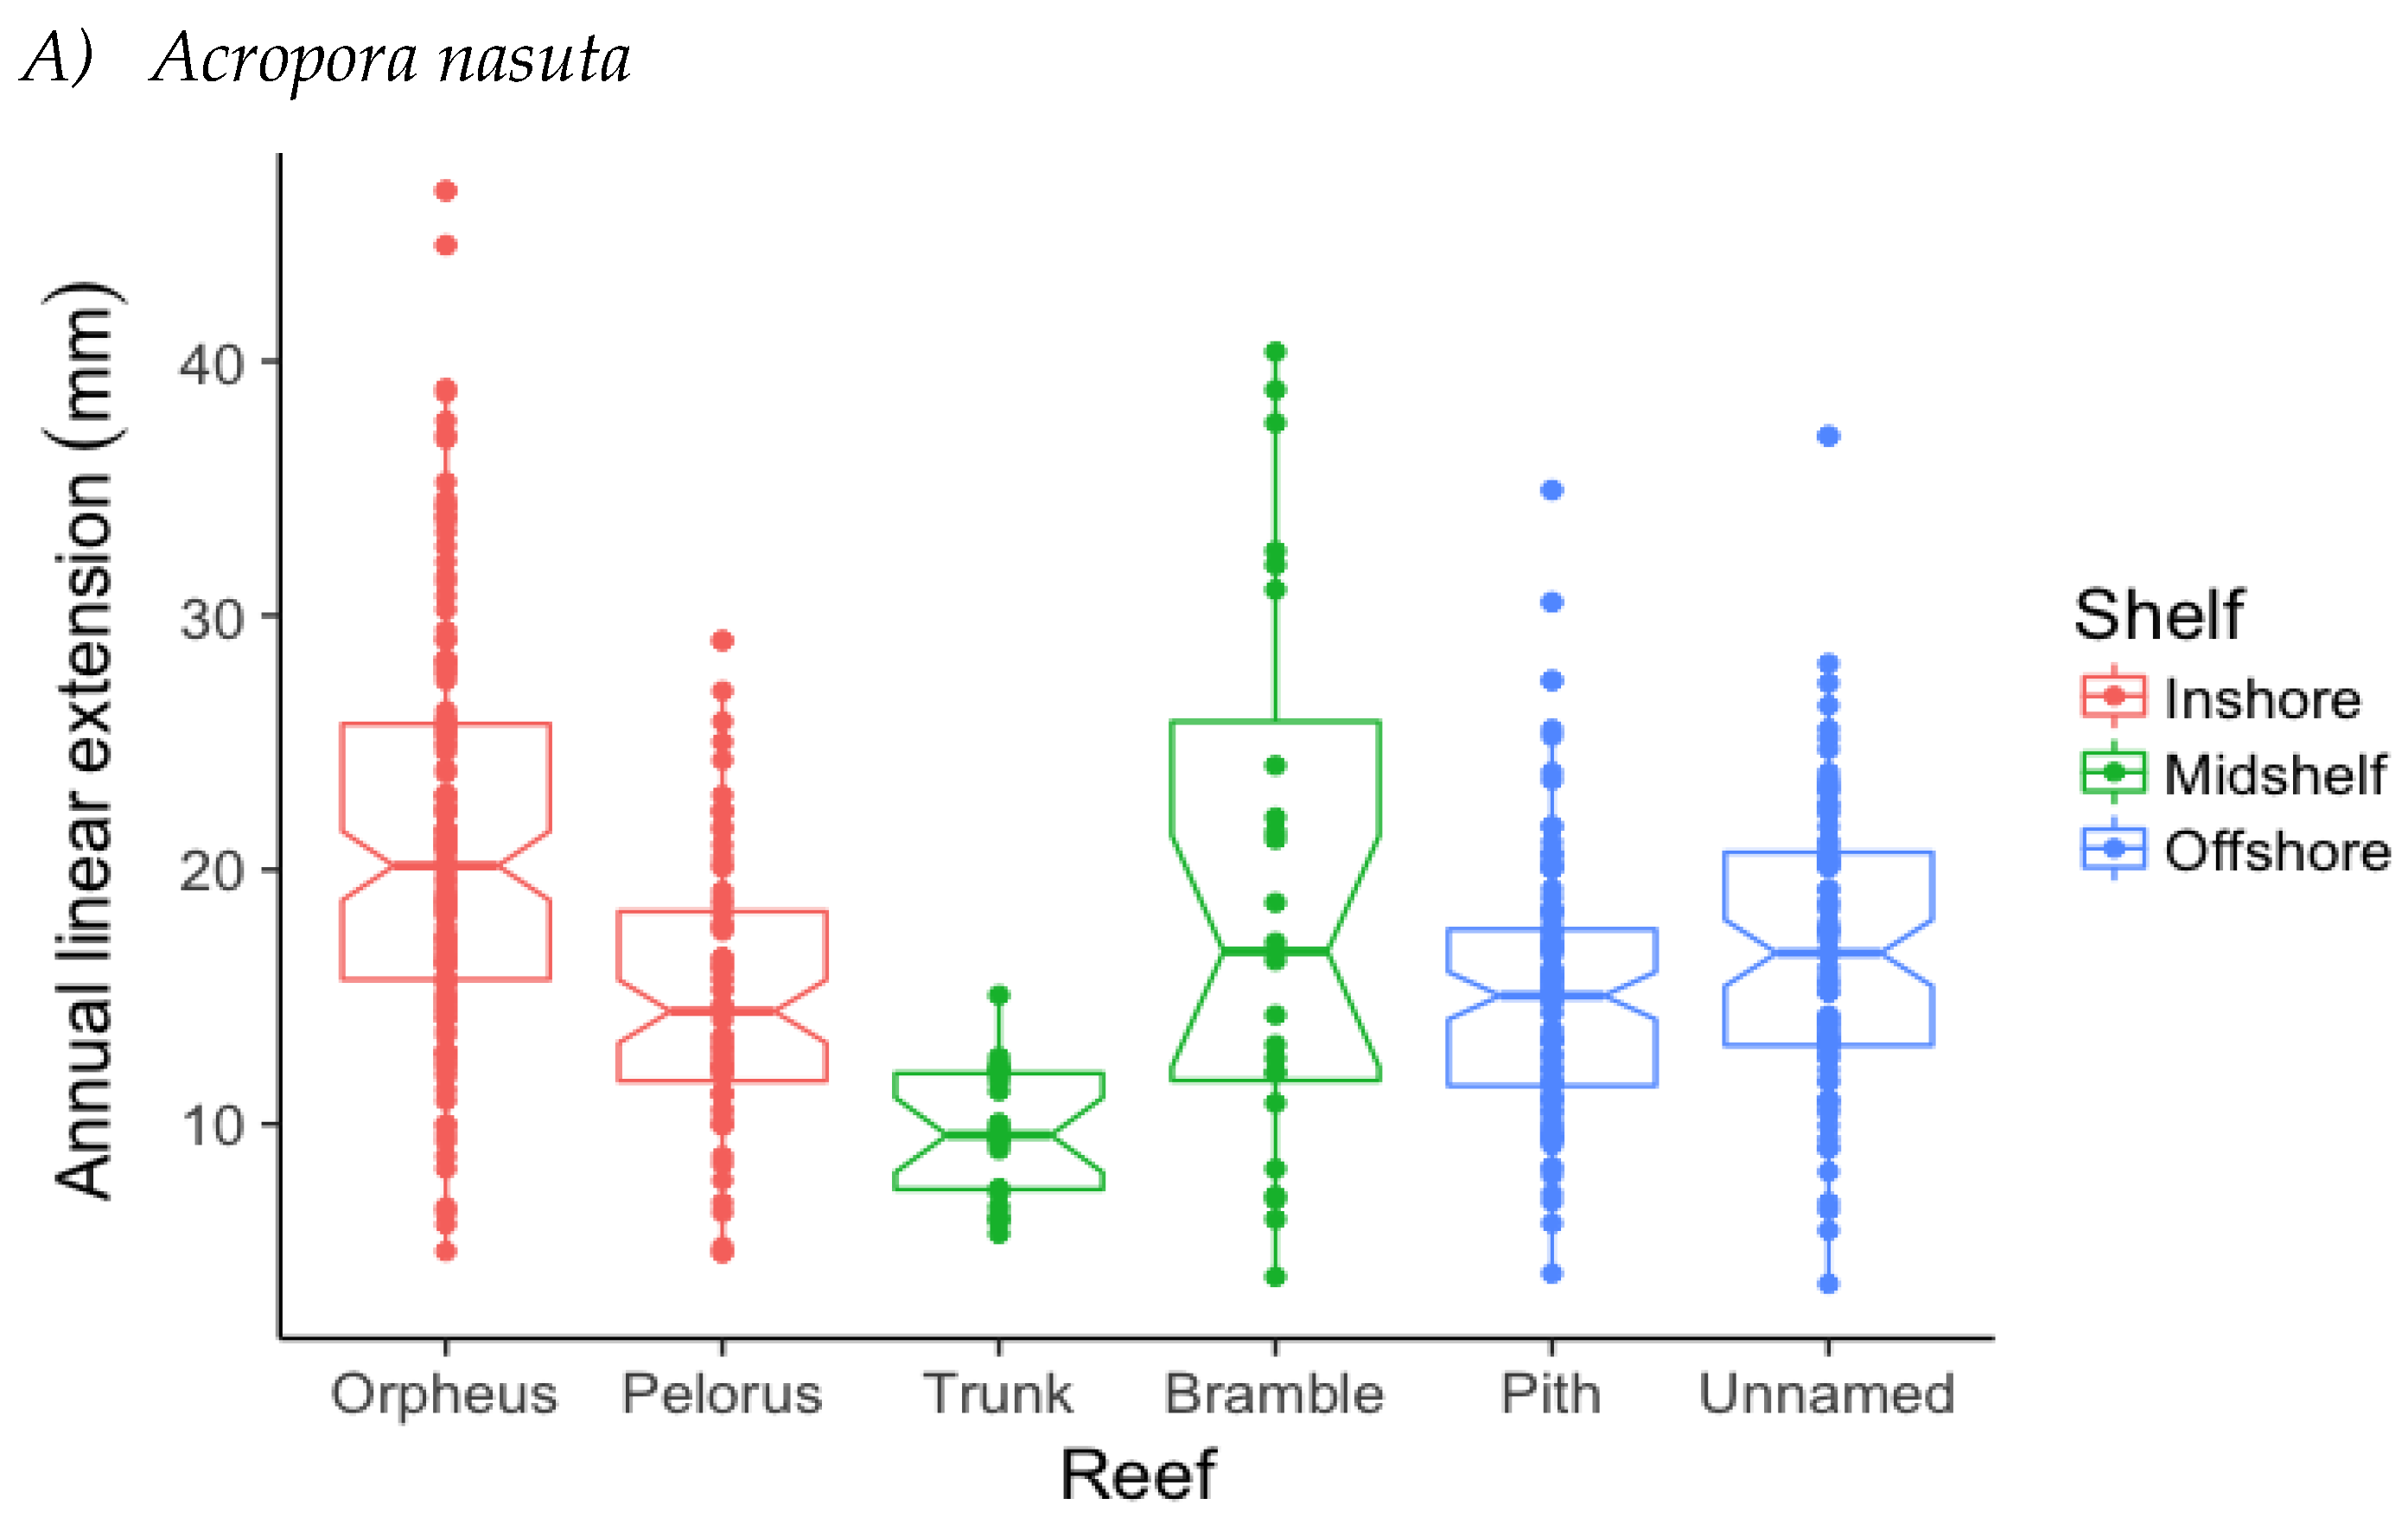
3.1. Annual Linear Extension (ALE)

To quantify cross-shelf variation in ALE, 1479 branches were measured from 129 colonies across the three coral taxa (A. nasuta, Pocillopora spp. and S. pistillata) and six reefs. Pocillopora spp. exhibited the highest rates of average annual linear extension (23.56 mm·y−1 ± 0.86 SE), which were 1.36 times faster than recorded for A. nasuta (17.22 mm·y−1 ± 0.86 SE) and nearly twice that of S. pistillata (11.81 mm·y−1 ± 0.73 SE). For all three of the coral taxa (A. nasuta, Pocillopora spp. and S. pistillata) considered in this study, spatial variation in ALE was most apparent at the level of reefs, rather than shelf position (Figure 2; Table 1). For A. nasuta, variation in ALE was most apparent between Bramble Reef and Trunk Reef (coef. = −12.73, SE = 2.64, p < 0.01). Otherwise, ALE was generally higher at near shore sites (19.03 mm·y−1 ± 1.29 SE), compared to mid-shelf (14.47 mm·y−1 ± 4.54 SE), or offshore sites (15.87 mm·y−1 ± 0.87 SE).
Growth rates (ALE) recorded for Pocillopora spp. varied greatly among colonies, ranging from a mean of just 4.5 mm·y−1 (±0.44 SE) for a colony from Trunk Reef, up to 35.10 mm·y−1 (±2.24 SE) for a colony at the outer reef site at Unnamed Reef. However, the average ALE recorded at each site was remarkably consistent between reefs and shelf positions; the only significant difference in ALE was between Bramble Reef where average ALE was 20.35 mm·y−1 (±1.71 SE) and Pelorus Island (coef. = 5.78, SE = 2.15, p < 0.01) and inter-reef differences were explained by shelf position (Table 2).
For S. pistillata, the limited data (especially at inshore sites) greatly constrains any conclusions regarding spatial patterns in coral growth (Figure 2). Relevant data are included here for completeness and though the GLM detected a significant effect of reef, we are not prepared to read too much into apparent patterns.

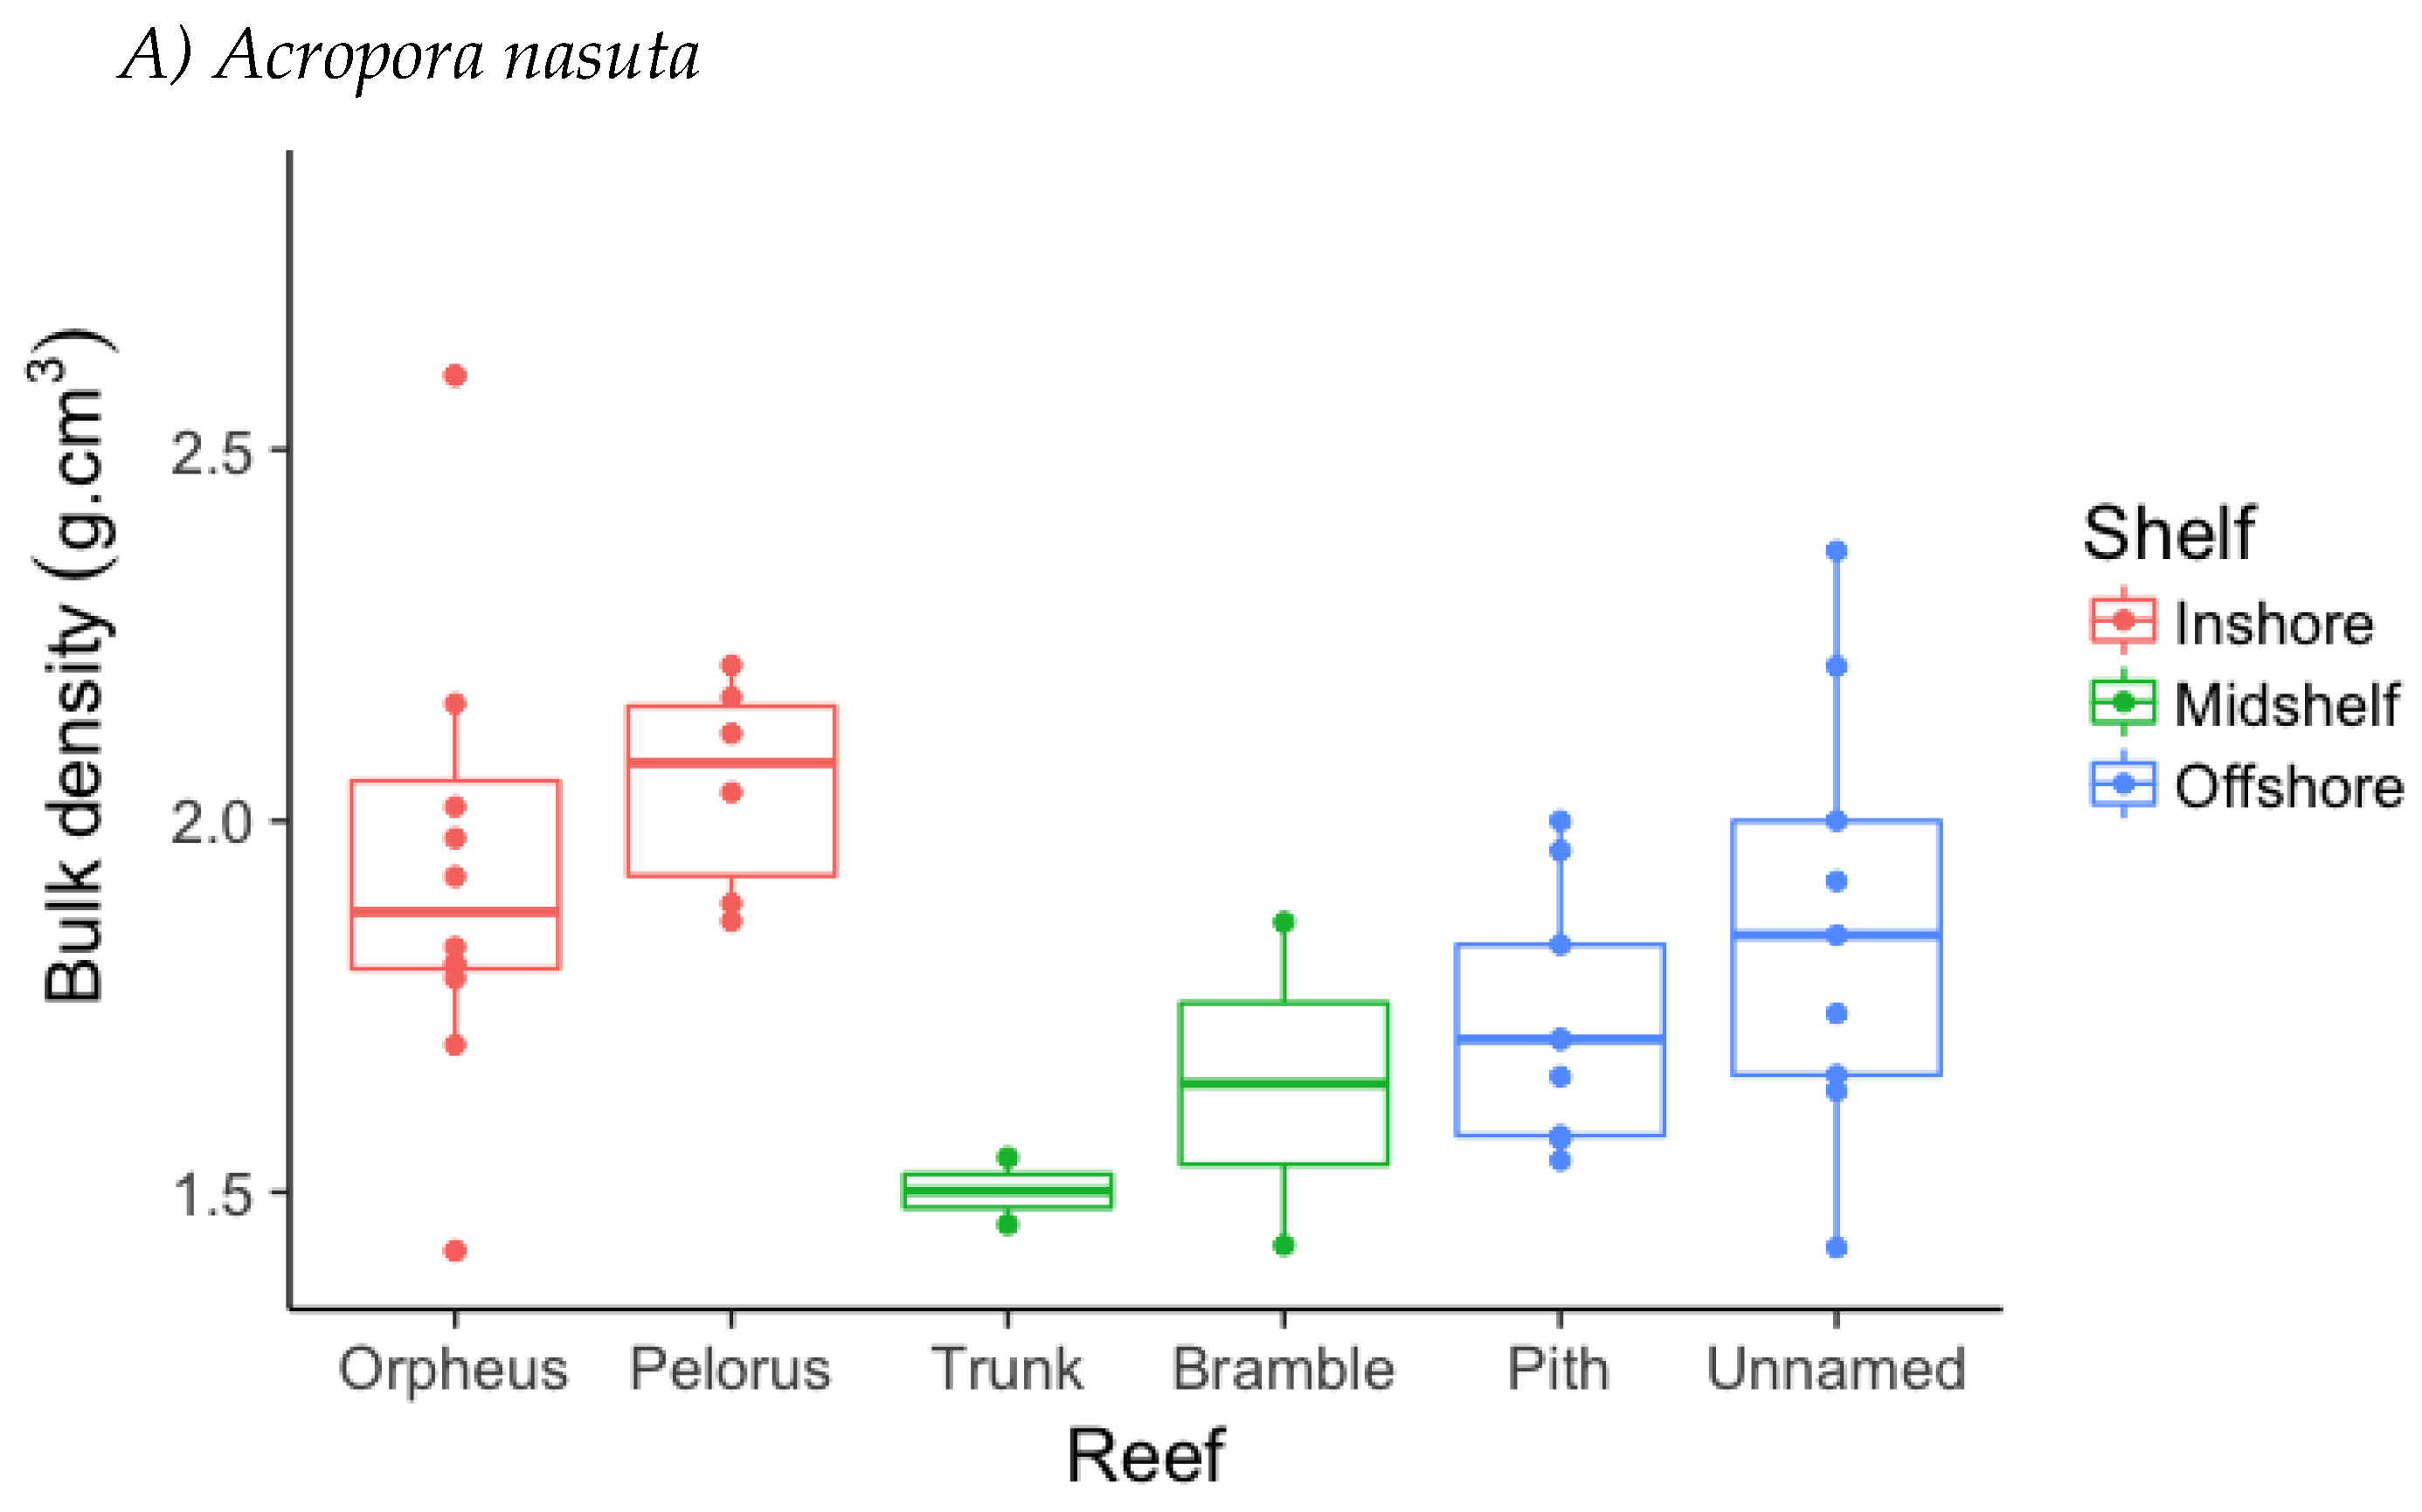
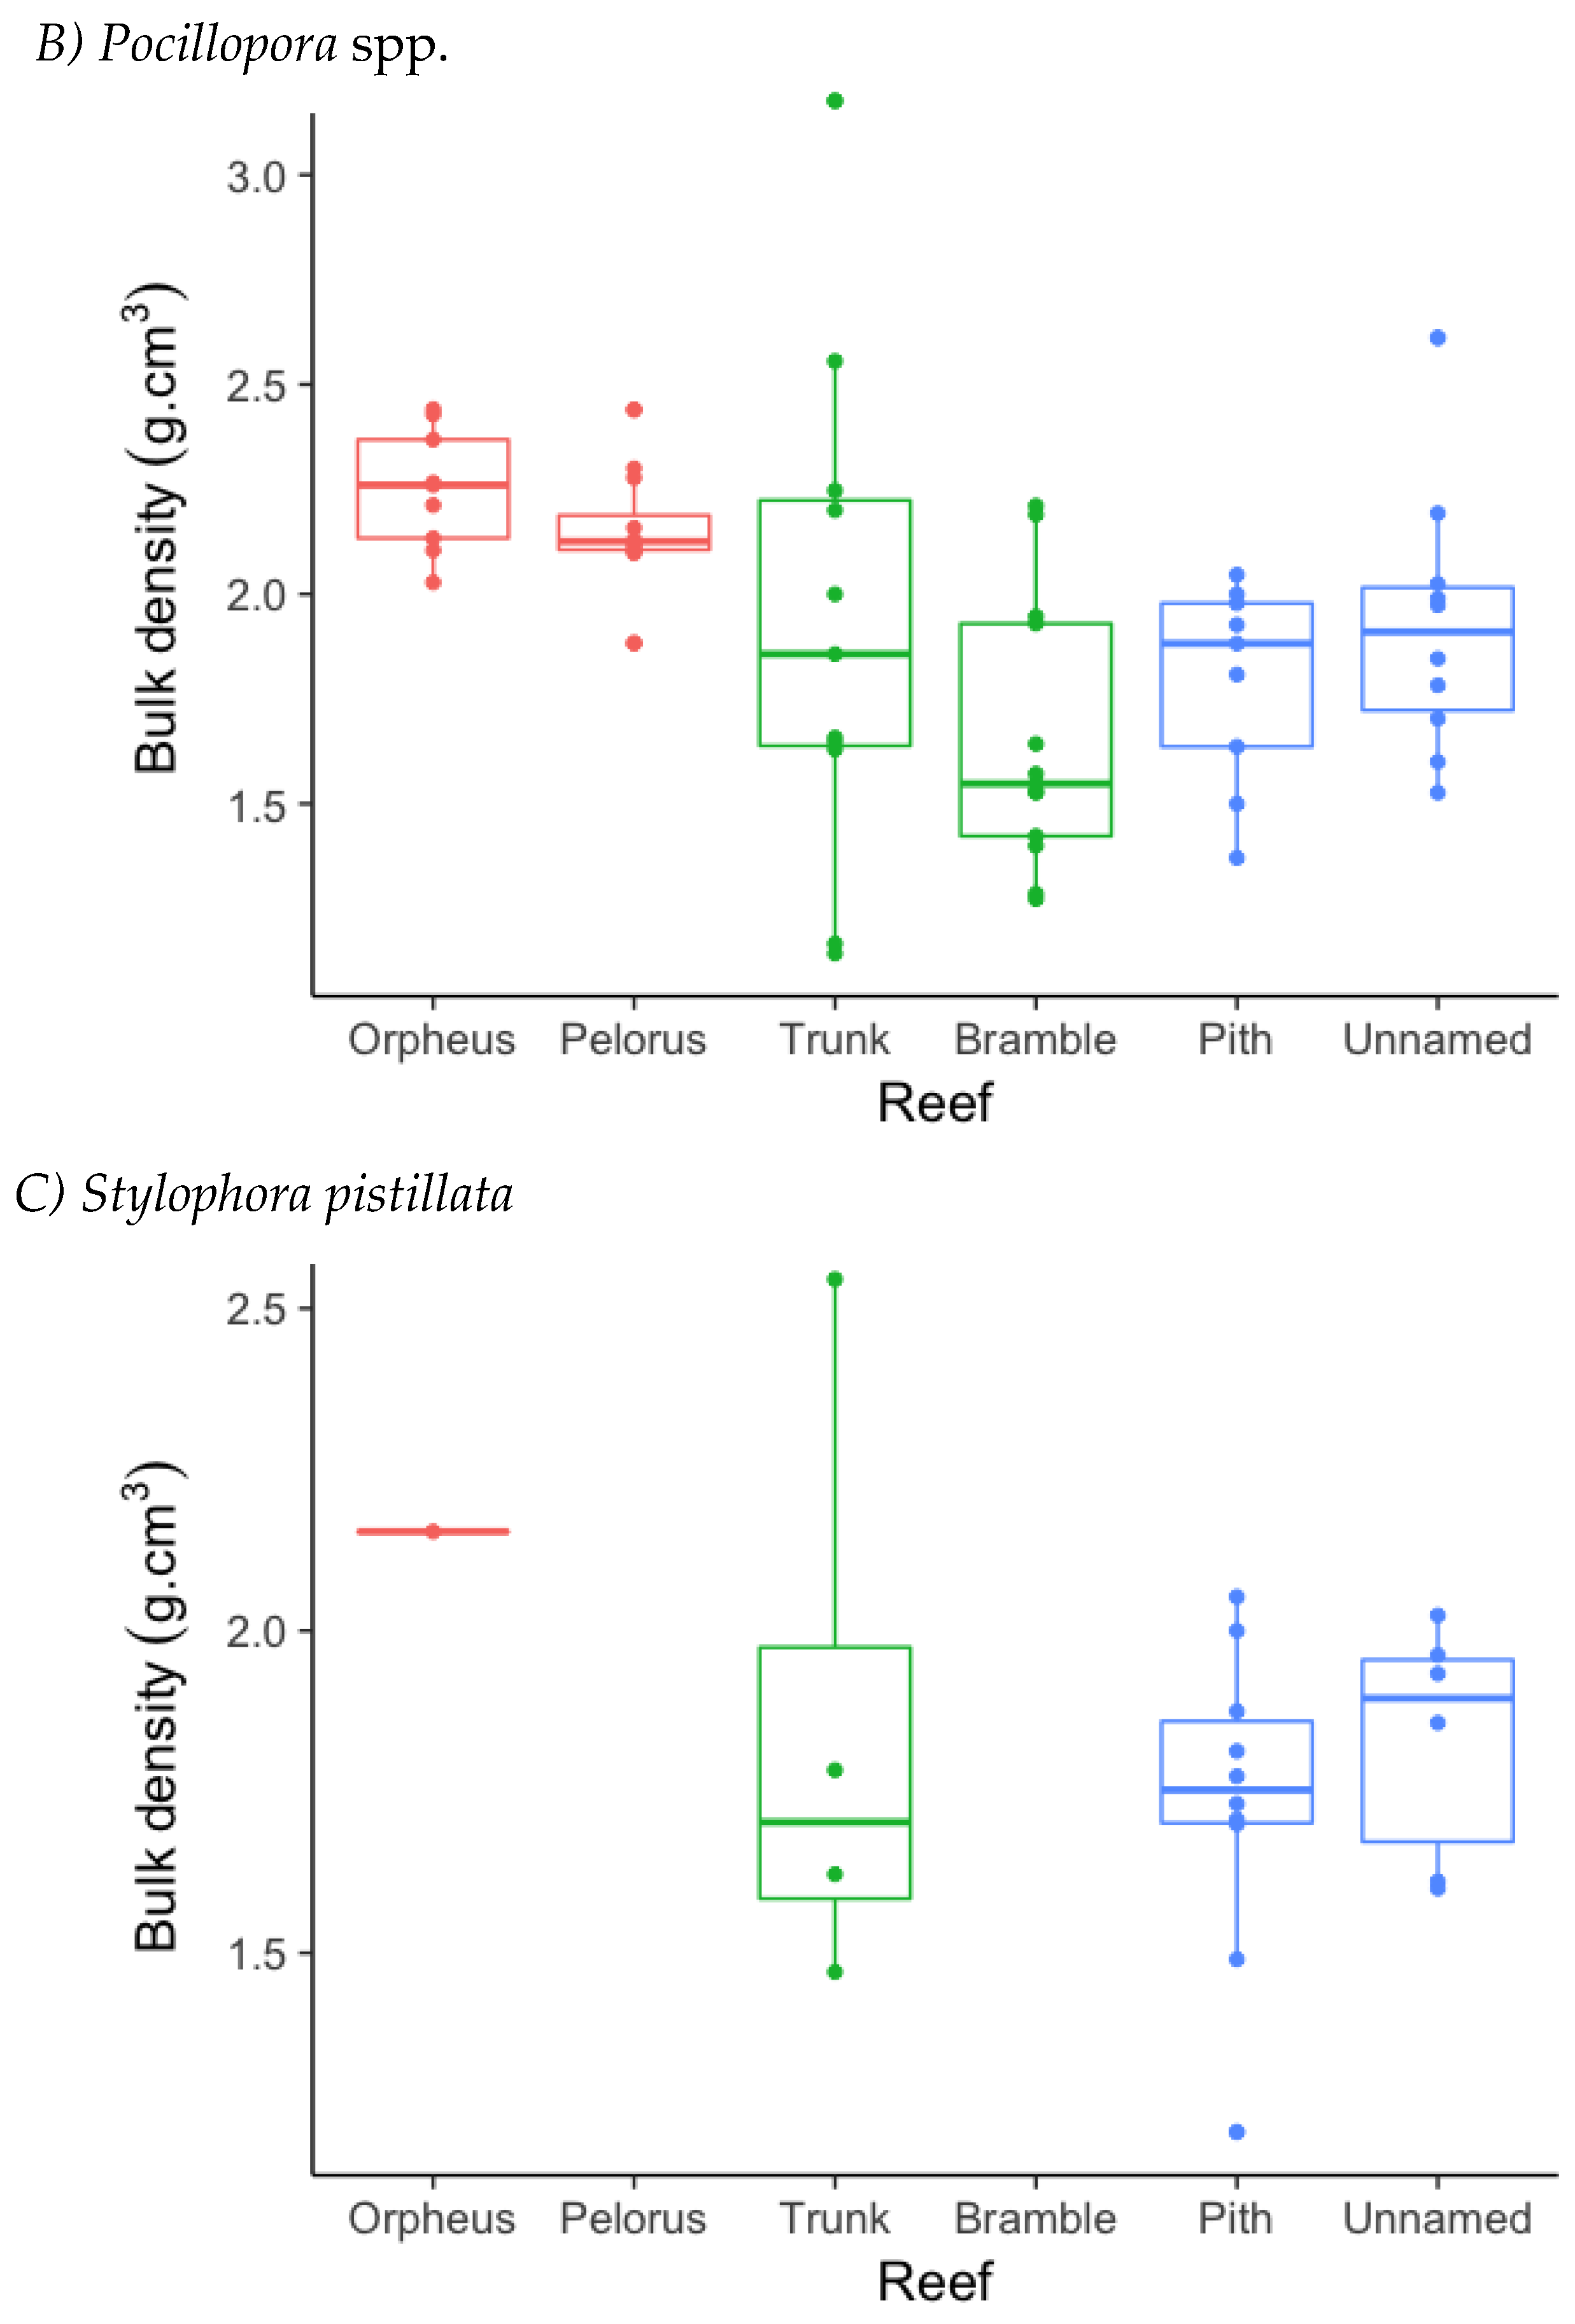
3.2. Skeletal Density

Whole-colony densities (or bulk densities) of the 129 coral colonies used to measure ALE were relatively consistent across the different taxa but were slightly higher for Pocillopora spp. (1.94 g·cm−3 ± 0.05 SE) compared to A. nasuta (1.87 g·cm−3 ± 0.05 SE) and S. pistillata (1.77 g·cm−3 ± 0.06 SE).
Within taxa, there was marked spatial variation in bulk density (Figure 3), which was best explained by shelf position (rather than reef) for both Pocillopora spp. and A. nasuta (Table 2). For Pocillopora spp. bulk density was highest at inner shelf locations (2.17 g·cm−3 ± 0.04 SE) and significantly lower at both mid-shelf (coef. = −0.38, SE = 0.10, p = < 0.01) and outer-shelf locations (coef. = −0.31, SE = 0.11, p = < 0.01). Within site variation in the density of Pocillopora spp. was greatest at mid-shelf and outer-shelf locations (Figure 2), though most colonies for these locations had much lower density compared to colonies from inshore reefs. Similarly, for A. nasuta, bulk density was highest at inner shelf locations (2.02 g·cm−3 ± 0.04 SE) and significantly lower at both mid-shelf (coef. = −0.44, SE = 0.16, p = 0.01) and outer-shelf locations (coef. = −0.22, SE = 0.10, p = 0.03). Within site variation in the density of A. nasuta was greatest at the near shore location at Orpheus Island, though there was only one colony (out of 18 colonies) from inshore reefs, for which bulk density was <1.7 g·cm−3. The lowest average bulk density for A. nasuta (1.57 g·cm−3 ± 0.10 SE) was recorded at mid-shelf reefs (Figure 3) and was even lower at Trunk Reef (1.50 g·cm−3) than Bramble Reef (1.64 g·cm−3), though these estimates are based on very small sample sizes (n = 2).
Apparent inter-reef differences in bulk density for S. pistillata (Figure 2 and Figure 3) were based on the relatively high density (2.15 g·cm−3) recorded for the one colony sampled from inshore sites.

4. Discussion

Growth rates of corals vary taxonomically, spatially and temporally and have an important role in structuring coral assemblages and reef habitats (Pratchett et al. 2015 [9]). Average ALE recorded for scleractinain corals ranges from <2 mm·y−1 for Siderastrea spp. up to 172 mm·y−1 for Acropora pulchra and is generally higher for branching versus massive corals (Pratchett et al. 2015 [9]). In this study, average ALE was highest (23.56 mm·y-1 ± 0.86 SE) for Pocillopora spp. Though we were not certain of the taxonomic identity of these corals, nor whether there were possibly more than one species considered within this complex (Schmidt-Roach et al. 2014 [36]), our growth rates correspond with growth rates recorded previously for colonies nominally considered to be P. damicornis (Anderson et al. 2015 [8]) that used the same techniques. Notably, growth rates recorded for Pocillopora colonies exceeded that of A. nasuta. In general, Acropora corals exhibit the highest growth rates and previous estimates of ALE for A. nasuta (39.2–52.8 mm·y−1) are much higher than were recorded herein (Pratchett et al. 2015 [9]), even within reef habitats (shallow, obliquely exposed, reef crests on mid-shelf and outermost reefs) where these corals predominate. Similarly, published growth rates for S. pistillata are generally much higher (15.05–24.61 mm·y−1; Pratchett et al. 2015 [9]) than were recorded in this study (11.81 mm·y−1 ± 0.73 SE). Intraspecific variation in the growth rates of corals, especially among widely separated geographic locations, is often attributed to differences in environmental conditions and especially temperature (Carricart-Ganivet 2004 [41]; Lough 2008 [42]). In particular, growth rates of corals may be constrained at both low and high temperatures (Pratchett et al. 2015 [9]). Low rates of ALE recorded in this study, relative to growth rates reported for the same species in other locations, may reflect higher than normal temperatures that occurred across much of the GBR in 2016 (Hughes et al. 2017 [43]). During the course of this study, corals were exposed to DHW values of 2–6 °C-weeks (Figure 1) and moderate levels of bleaching were recorded, especially on offshore reefs in this region (Hughes et al. 2017 [43]). However, reef specific DHW did not account for observed differences in growth rates (Table 2). Elevated temperatures may have accounted for the poor survival of A. nasuta and S. pistillata at mid-shelf sites, though heat stress experienced at these locations was lower than for offshore locations. More importantly, differential heat stress throughout the entire study period (though not measured here) may have contributed to observed spatial patterns of coral growth (Anderson et al. 2018 [44]), potentially suppressing coral growth and calcification at offshore locations more so than at other locations.
Although species-specific growth rates recorded in this study are lower than reported previously, there were no apparent differences in ALE between inshore, mid-shelf and outer-shelf sites. Many studies have reported comparatively low rates of coral growth or calcification in near shore environments linked to high or elevated levels of suspended sediments (e.g., Tomascik & Sander 1985 [45]; Guzmán et al. 2008 [46]; Sowa et al. 2014 [47]). We had expected, therefore, that coral growth would be highest at offshore locations, which are furthest removed from land-based sources of sediment, nutrients and other pollutants. However, the few studies that have explicitly studied cross-shelf variation in growth rates of select coral species (massive Porites; Scoffin et al. 1992 [48], Lough and Barnes 2000 [32] and Orbicella (formerly Montastraea) annularis; Carricart-Ganivet & Merino, 2001 [33] Manzello et al. 2015 [49]), show decreasing ALE with distance from shore. All we can really conclude in this study is that growth rates of all three branching coral taxa were not any lower at sites on inshore reefs (Orpheus and Pelorus Islands), compared to sites at mid-shelf (Bramble and Trunk Reefs) and outer-shelf reefs (Pith and Unnamed Reefs). One possible explanation is that elevated temperatures on outer-shelf reefs (where corals were exposed to greater cumulative heat stress than at mid-shelf or inshore locations) suppressed coral growth and calcification, such that overall growth rates were similar to that of corals on the high continental islands that had conspicuously higher levels of sedimentation and turbidity.
Environmental constraints on coral growth and calcification are not always manifest as changes in ALE (Brown et al. 1990 [50]). Scleractinian corals are indeed capable of maintaining or increasing linear extension, despite reductions in calcification, by sacrificing skeletal density (Carricart-Ganivet & Merino 2001 [33]; Hoegh-Guldberg et al. 2007 [51]), which presumably impacts on skeletal integrity and resistance to physical disturbances. When comparing cross-shelf variation in growth process, both Lough and Barnes (2000 [32]) and Carricart-Ganivet & Merino (2001 [33]) found that skeletal density increased with distance from shore. This may be a necessary response to increase skeletal integrity and persistence in the face of increased wave exposure and hydrodynamic forcing. Conversely, lower levels of wave action on inshore reefs may allow corals to persist with comparably lower skeletal densities, allowing for faster rates of linear extension. Risk and Sammarco (1991 [52]) suggested that the low densities of Porites corals at inshore sites on the GBR reflect inhibition of calcification by elevated nutrients, though overall rates of calcification for massive Porites are actually higher on inshore reefs (Lough & Barnes 1992 [53]), which combined with reduced skeletal density, result in higher rates of ALE. As with previous studies, we found differences in the skeletal density of corals growing on different reefs, which were related to shelf position. However, skeletal density was higher on inshore, rather than offshore reefs (Figure 3). As such, differences in skeletal densities do not account for (but compound upon) differences in linear extension. This suggests that overall rates of calcification for the branching corals considered in this study (A. nasuta, Pocillopora spp. and S. pistillata) may actually be higher at sites on the inshore reefs, compared to colonies growing at sites on mid- and outer-shelf reefs.
It is incontrovertible that elevated sedimentation and eutrophication can have adverse effects on the growth, reproduction and demography of scleractinian corals, as shown in experimental studies (Humphrey et al. 2008 [54]) as well as highly perturbed environments (Dodge & Vaisnys, 1977 [31]). However, most experimental studies use extreme levels of sedimentation that poorly reflect predominant conditions that occur even on fringing coastal reefs (Jones et al. 2016 [55]). These extreme treatment levels were justified based on early erroneous estimates of sedimentation in the field (Jones et al. 2016 [55]) that failed to account for sediment resuspension and flux. While sedimentation is a prominent feature of nearshore reefs and one of the major factors that differentiates inshore reefs from offshore systems (Wolanski et al. 2005 [56]), extreme levels of sediment resuspension and turbidity are often short-lived (Browne et al. 2013 [57]). Moreover, high levels of sedimentation are restricted to specific habitats, where coral assemblages are dominated by species (e.g., Goniopora and Turbinara) that are predominantly heterotrophic and can withstand prolonged turbidity and sediment deposition (Browne et al. 2012 [57]). Ultimately, fine-scale heterogeneity in environmental conditions enables branching corals (e.g., Acropora) to grow at some sites (Browne et al. 2013 [56]), even if this is more restrictive than occurs on reefs further offshore. In this study, for example, we compared growth rates of corals in very shallow environments (1–3 m), where we found highest abundance of the specific study species. It is likely however, that these corals might be much more restricted in their depth distribution on near shore reefs due to higher levels of turbidity and light attenuation.
The results and conclusions of this study are limited by inherent constraints in the method used to measure coral growth. Although ALE is among the most commonly used metric to measure coral growth and is broadly comparable across different types of corals (Pratchett et al. 2015 [9]), it does not fully account for complexities in the way that corals (especially, branching corals species) actually deposit calcium carbonate, which is the main rate limiting process for coral growth. This study also used the vital stain (Alizarin Red), requiring corals to be sacrificed to record change in physical dimensions, which provides only a single time-averaged estimate of coral growth across the period between staining and subsequent collection (Morgan & Kench 2012 [58]). Recent advances in underwater photogrammetry enable 3D reconstructions from images of individual coral colonies which, when compared over time, can provide much more holistic, precise and higher resolution measures of growth (Ferrari et al. 2017 [58]). Moreover, 3D photogrammetry does not require that corals be manipulated or ultimately collected (Ferrari et al. 2017 [59]), which otherwise imposes considerable risks and inherent constraints on the sample size and design. This study provides the first test of cross-shelf variation in growth rates of branching corals, though much more expansive sampling (making use of new methods to better represent the size and shape of individual coral colonies) is still warranted.

5. Conclusions

This study shows that growth rates of branching corals (specifically, A. nasuta, Pocillopora spp. and S. pistillata) are broadly comparable between sites at inshore, mid-shelf and offshore reefs, questioning whether increased inputs of sediments, nutrients and pollutants, which disproportionately affect near shore environments, are necessarily contributing to constrained growth and resilience of these corals (Browne et al. 2013 [60]; Anthony 2006 [61]). (Browne et al. 2013 [60]) explored the contemporary condition of inshore reefs along the length of the GBR and while recognizing that many of these reef systems are subject to continual or episodic sedimentation, they showed that many turbid inshore reefs have high cover of scleractinian corals and that the corals were re-growing and calcifying at sufficient rate to sustain positive reef accretion. Importantly, environmental constraints on corals by coastal degradation and elevated inputs of sediments, nutrients and pollutants may now be surpassed by the overarching effects of ocean warming, which not only causes widespread coral bleaching (Hughes et al. 2018 [62]) but also supresses coral growth (Cantin et al. 2010 [63]).

Author Contributions

Conceptualization and implementation, M.S.P. and A.S.H.; Data collection, C.A.T., D.J.P. and S.F.H.; Formal Analysis, D.B. and M.S.P.; Resources, M.S.P. and A.S.H.; Writing-Original Draft Preparation, D.B. and M.S.P.; Writing-Review & Editing, A.S.H., C.A.T., S.F.H. and D.J.P.

Funding

This research was funded through the Australian Research Council award to the ARC Centre of Excellence for Coral Reef Studies [CE14010002] and an Australian Research Council Discovery Early Career Researcher Award to A.S.H. [DE130100688]. S.F.H. was fully supported and this study was partially supported, by NOAA grant NA14NES4320003 (Cooperative Institute for Climate and Satellites—CICS) at the University of Maryland/ESSIC.

Acknowledgments

The authors acknowledge the staff and crew responsible for the effective operation of the M.V. James Kirby, which was fundamental in conducting this research. The scientific results and conclusions, as well as any views or opinions expressed herein, are those of the author(s) and do not necessarily reflect the views of NOAA or the Department of Commerce.

Conflicts of Interest

The authors declare no conflict of interest.

References

  1. Kleypas, J.A.; McManus, J.W.; Menez, L.A.B. Environmental limits to coral reef development: Where do we draw the line? Am. Zool. 1999, 39, 146–159. [Google Scholar] [CrossRef]
  2. Done, T.J. Patterns in the distribution of coral communities across the central Great Barrier Reef. Coral Reefs 1982, 1, 95–107. [Google Scholar] [CrossRef]
  3. Harriott, V.J. Coral growth in subtropical eastern Australia. Coral Reefs 1999, 18, 281–291. [Google Scholar] [CrossRef]
  4. Anderson, K.D.; Cantin, N.E.; Heron, S.F.; Pisapia, C.; Pratchett, M.S. Variation in growth rates of branching corals along Australia’s Great Barrier Reef. Sci. Rep. 2017, 7, 2920. [Google Scholar] [CrossRef] [PubMed]
  5. Buddemeier, R.W.; Kinzie, R.A., III. Coral growth. Oceanogr. Mar. Biol. Ann. Rev. 1976, 14, 183–225. [Google Scholar]
  6. Muir, P.R.; Wallace, C.C.; Done, T.; Aguirre, J.D. Limited scope for latitudinal extension of reef corals. Science 2015, 348, 1135–1138. [Google Scholar] [CrossRef] [PubMed]
  7. Bellwood, D.R.; Hughes, T.P. Regional-scale assembly rules and biodiversity of coral reefs. Science 2001, 292, 1532–1535. [Google Scholar] [CrossRef] [PubMed]
  8. Anderson, K.; Heron, S.F.; Pratchett, M.S. Species-specific declines in the linear extension of branching corals at a sub-tropical reef, Lord Howe Island. Coral Reefs 2015, 34, 479–490. [Google Scholar] [CrossRef]
  9. Pratchett, M.S.; Anderson, K.D.; Hoogenboom, M.O.; Widman, E.; Baird, A.H.; Pandolfi, J.M.; Edmunds, P.J.; Lough, J.M. Spatial, temporal and taxonomic variation in coral growth—Implications for the structure and function of coral reef ecosystems. Oceanogr. Mar. Biol. Ann. Rev. 2015, 53, 215–295. [Google Scholar]
  10. Hoey, A.S.; Pratchett, M.S.; Cvitanovic, C. High macroalgal cover and low coral recruitment undermines the potential resilience of the world’s southernmost coral reef assemblages. PLoS ONE 2011, 6. [Google Scholar] [CrossRef] [PubMed]
  11. Connolly, S.R.; Bellwood, D.R.; Hughes, T.P. Indo–Pacific biodiversity of coral reefs: Deviations from a mid-domain model. Ecology 2003, 84, 2178–2190. [Google Scholar] [CrossRef]
  12. Keith, S.A.; Baird, A.H.; Hughes, T.P.; Madin, J.S.; Connolly, S.R. Faunal breaks and species composition of Indo–Pacific corals: The role of plate tectonics, environment and habitat distribution. Proc. R. Soc. B 2013, 280. [Google Scholar] [CrossRef] [PubMed]
  13. Cleary, D.F.; Becking, L.E.; de Voogd, N.J.; Renema, W.; de Beer, M.; van Soest, R.W.; Hoeksema, B.W. Variation in the diversity and composition of benthic taxa as a function of distance offshore, depth and exposure in the Spermonde Archipelago, Indonesia. Est. Coast. Shelf Sci. 2005, 65, 557–570. [Google Scholar] [CrossRef]
  14. Wilkinson, C.R.; Cheshire, A.C. Patterns in the distribution of sponge populations across the central Great Barrier Reef. Coral Reefs 1989, 8, 127–134. [Google Scholar] [CrossRef]
  15. Fabricius, K.; De’Ath, G. Environmental factors associated with the spatial distribution of crustose coralline algae on the Great Barrier Reef. Coral Reefs 2001, 19, 303–309. [Google Scholar] [CrossRef]
  16. Wismer, S.; Hoey, A.S.; Bellwood, D.R. Cross-shelf benthic community structure on the Great Barrier Reef: Relationships between macroalgal cover and herbivore biomass. Mar. Ecol. Prog. Ser. 2009, 376, 45–54. [Google Scholar] [CrossRef]
  17. Lirman, D.; Fong, P. Is proximity to land-based sources of coral stressors an appropriate measure of risk to coral reefs? An example from the Florida Reef Tract. Mar. Pollut. Bull. 2007, 54, 779–791. [Google Scholar] [CrossRef] [PubMed]
  18. Williams, D.M. Patterns in the distribution of fish communities across the central Great Barrier Reef. Coral Reefs 1982, 1, 35–43. [Google Scholar] [CrossRef]
  19. Williams, D.M.; Hatcher, A.I. Structure of fish communities on outer slopes of inshore, mid-shelf and outer shelf reefs of the Great Barrier Reef. Mar. Ecol. Prog. Ser. 1983, 10, 239–250. [Google Scholar] [CrossRef]
  20. Russ, G. Distribution and abundance of herbivorous grazing fishes in the central Great Barrier Reef. I. Levels of variability across the entire continental shelf. Mar. Ecol. Prog. Ser. 1984, 20, 23–34. [Google Scholar] [CrossRef]
  21. Hoey, A.S.; Bellwood, D.R. Cross-shelf variation in the role of parrotfishes on the Great Barrier Reef. Coral Reefs 2008, 27, 37–47. [Google Scholar] [CrossRef]
  22. Emslie, M.J.; Pratchett, M.S.; Cheal, A.J.; Osborne, K. Great Barrier Reef butterflyfish community structure: The role of shelf position and benthic community type. Coral Reefs 2010, 29, 705–715. [Google Scholar] [CrossRef]
  23. Bellwood, D.; Wainwright, P. Locomotion in labrid fishes: Implications for habitat use and cross-shelf biogeography on the Great Barrier Reef. Coral Reefs 2001, 20, 139–150. [Google Scholar] [CrossRef]
  24. Hughes, T.P.; Day, J.C.; Brodie, J. Securing the future of the Great Barrier Reef. Nat. Clim. Chang. 2015, 5, 508–511. [Google Scholar] [CrossRef]
  25. Kroon, F.J.; Thorburn, P.; Schaffelke, B.; Whitten, S. Towards protecting the Great Barrier Reef from land-based pollution. Glob. Chang. Biol. 2016, 22, 1985–2002. [Google Scholar] [CrossRef] [PubMed] [Green Version]
  26. Loya, Y. Effects of water turbidity and sedimentation on the community structure of Puerto Rican corals. Bull. Mar. Sci. 1976, 26, 450–466. [Google Scholar]
  27. Reigl, B.; Branch, G.M. Effects of sediment on the energy budgets of four Scleractinian (Bourne 19000) and five Alcyonacean (Lamouroux 1816) corals. J. Exp. Mar. Biol. Ecol. 1995, 186, 259–275. [Google Scholar] [CrossRef]
  28. Fabricius, K.E. Effects of terrestrial runoff on the ecology of corals and coral reefs: Review and synthesis. Mar. Pollut. Bull. 2005, 50, 125–146. [Google Scholar] [CrossRef] [PubMed]
  29. Weber, M.; De Beer, D.; Lott, C.; Polerecky, L.; Kohls, K.; Abed, R.M.; Ferdelman, T.G.; Fabricius, K.E. Mechanisms of damage to corals exposed to sedimentation. Proc. Natl. Acad. Sci. USA 2012, 109, E1558–E1567. [Google Scholar] [CrossRef] [PubMed]
  30. Anthony, K.R.; Fabricius, K.E. Shifting roles of heterotrophy and autotrophy in coral energetics under varying turbidity. J. Exp. Mar. Biol. Ecol. 2000, 252, 221–253. [Google Scholar] [CrossRef]
  31. Dodge, R.E.; Vaisnys, J.R. Coral populations and growth patterns: Responses to sedimentation and turbidity associated with dredging. J. Mar. Sci. 1977, 35, 715–730. [Google Scholar]
  32. Lough, J.M.; Barnes, D.J. Environmental controls on growth of the massive coral Porites. J. Exp. Mar. Biol. Ecol. 2000, 245, 225–243. [Google Scholar] [CrossRef]
  33. Carricart-Ganivet, J.P.; Merino, M. Growth responses of the reef-building coral Montastraea annularis along a gradient of continental influence in the southern Gulf of Mexico. Bull. Mar. Sci. 2001, 68, 133–146. [Google Scholar]
  34. Messmer, V.; Jones, G.P.; Munday, P.L.; Holbrook, S.J.; Schmitt, R.J.; Brooks, A.J. Habitat biodiversity as a determinant of fish community structure on coral reefs. Ecology 2011, 92, 2285–2298. [Google Scholar] [CrossRef] [PubMed]
  35. Hughes, T.P.; Kerry, J.T.; Baird, A.H.; Connolly, S.R.; Dietzel, A.; Eakin, C.M.; Heron, S.F.; Hoey, A.S.; Hoogenboom, M.O.; Liu, G.; et al. Global warming transforms coral reef assemblages. Nature 2018, 556, 492–496. [Google Scholar] [CrossRef] [PubMed]
  36. Schmidt-Roach, S.; Miller, K.J.; Lundgren, P.; Andreakis, N. With eyes wide open: A revision of species within and closely related to the Pocillopora damicornis species complex (Scleractinia; Pocilloporidae) using morphology and genetics. Zool. J. Linn. Soc. 2014, 170, 1–33. [Google Scholar] [CrossRef]
  37. Oliver, J.K.; Chalker, B.E.; Dunlap, W.C. Bathymetric adaptations of reef-building corals at Davies Reef, Great Barrier Reef, Australia. I. Long-term growth responses of Acropora formosa (Dana 1846). J. Exp. Mar. Biol. Ecol. 1995, 73, 11–35. [Google Scholar] [CrossRef]
  38. Bucher, D.J.; Harriott, V.J.; Roberts, L.G. Skeletal micro-density, porosity and bulk density of acroporid corals. J. Exp. Mar. Biol. Ecol. 1998, 228, 117–136. [Google Scholar] [CrossRef]
  39. Hughes, T.P. Skeletal density and growth form of corals. Mar. Ecol. Prog. Ser. 1987, 35, 259–266. [Google Scholar] [CrossRef]
  40. Burnham, K.P.; Anderson, D.R. Model Selection and Multimodel Inference: A Practical Information–Theoretic Approach, 2nd ed.; Springer: New York, NY, USA, 2002. [Google Scholar]
  41. Carricart-Ganivet, J.P. Sea surface temperature and the growth of the West Atlantic reef-building coral Montastraea annularis. J. Exp. Mar. Biol. Ecol. 2004, 302, 249–260. [Google Scholar] [CrossRef]
  42. Lough, J.M. Coral calcification from skeletal records revisited. Mar. Ecol. Prog. Ser. 2008, 373, 257–264. [Google Scholar] [CrossRef] [Green Version]
  43. Hughes, T.P.; Kerry, J.T.; Álvarez-Noriega, M.; Álvarez-Romero, J.G.; Anderson, K.D.; Baird, A.H.; Babcock, R.C.; Beger, M.; Bellwood, D.R.; Berkelmans, R.; et al. Global warming and recurrent mass bleaching of corals. Nature 2017, 543, 373–377. [Google Scholar] [CrossRef] [PubMed] [Green Version]
  44. Anderson, K.D.; Cantin, N.E.; Heron, S.F.; Lough, J.M.; Pratchett, M.S. Temporal and taxonomic contrasts in coral growth at Davies Reef, central Great Barrier Reef, Australia. Coral Reefs 2018, 37, 409–421. [Google Scholar] [CrossRef]
  45. Tomascik, T.; Sander, F. Effects of eutrophication on reef-building corals. Mar. Biol. 1985, 87, 143–155. [Google Scholar] [CrossRef]
  46. Guzman, H.M.; Cipriani, R.; Jackson, J.B. Historical decline in coral reef growth after the Panama Canal. Ambio 2008, 37, 342–346. [Google Scholar] [CrossRef] [PubMed]
  47. Sowa, K.; Watanabe, T.; Kan, H.; Yamano, H. Influence of land development on Holocene Porites coral calcification at Nagura bay, Ishigaki island, Japan. PLoS ONE 2014, 9. [Google Scholar] [CrossRef] [PubMed]
  48. Scoffin, T.P.; Tudhope, A.W.; Brown, B.E.; Chansang, H.; Cheeney, R.F. Patterns and possible environmental controls of skeletogenesis of Porites lutea, South Thailand. Coral Reefs 1992, 11, 1–11. [Google Scholar] [CrossRef]
  49. Brown, B.E.; Le Tissier, M.D.A.; Scoffin, T.P.; Tudhope, A.W. Evaluation of the environmental impact of dredging on intertidal coral reefs at Ko Phuket, Thailand, using ecological and physiological parameters. Mar. Ecol. Prog. Ser. 1990, 65, 273–281. [Google Scholar] [CrossRef]
  50. Manzello, D.P.; Enochs, I.C.; Kolodziej, G.; Carlton, R. Recent decade of growth and calcification of Orbicella faveolata in the Florida Keys: An inshore-offshore comparison. Mar. Ecol. Prog. Ser. 2015, 521, 81–89. [Google Scholar] [CrossRef]
  51. Hoegh-Guldberg, O.; Mumby, P.J.; Hooten, A.J.; Steneck, R.S.; Greenfield, P.; Gomez, E.; Harvell, C.D.; Sale, P.F.; Edwards, A.J.; Caldeira, K.; et al. Coral reefs under rapid climate change and ocean acidification. Science 2007, 318, 1737–1742. [Google Scholar] [CrossRef] [PubMed]
  52. Risk, M.J.; Sammarco, P.W. Cross-shelf trends in skeletal density of the massive coral Porites lobata from the Great Barrier Reef. Mar. Ecol. Prog. Ser. 1991, 69, 195–200. [Google Scholar] [CrossRef]
  53. Lough, J.M.; Barnes, D.J. Comparisons of skeletal density variations in Porites from the central Great Barrier Reef. J. Exp. Mar. Biol. Ecol. 1992, 155, 1–25. [Google Scholar] [CrossRef]
  54. Humphrey, C.; Weber, M.; Lott, C.; Cooper, T.; Fabricius, K. Effects of suspended sediments, dissolved inorganic nutrients and salinity on fertilisation and embryo development in the coral Acropora millepora (Ehrenberg, 1834). Coral Reefs 2008, 27, 837–850. [Google Scholar] [CrossRef]
  55. Jones, R.; Bessell-Browne, P.; Fisher, R.; Klonowski, W.; Slivkoff, M. Assessing the impacts of sediments from dredging on corals. Mar. Pollut. Bull. 2016, 102, 9–29. [Google Scholar] [CrossRef] [PubMed]
  56. Wolanski, E.; Fabricius, K.; Spagnol, S.; Brinkman, R. Fine sediment budget on an inner-shelf coral-fringed island, Great Barrier Reef of Australia. Est. Coast. Shelf Sci. 2005, 65, 153–158. [Google Scholar] [CrossRef]
  57. Browne, N.K.; Smithers, S.G.; Perry, C.T. Spatial and temporal variations in turbidity on two inshore turbid reefs on the Great Barrier Reef, Australia. Coral Reefs 2013, 32, 195–210. [Google Scholar] [CrossRef]
  58. Morgan, K.M.; Kench, P.S. Skeletal extension and calcification of reef-building corals in the central Indian Ocean. Mar. Environ. Res. 2012, 81, 78–82. [Google Scholar] [CrossRef] [PubMed]
  59. Ferrari, R.; Figueira, W.F.; Pratchett, M.S.; Boube, T.; Adam, A.; Kobelkowsky-Vidrio, T.; Doo, S.S.; Atwood, T.B.; Byrne, M. 3D photogrammetry quantifies growth and external erosion of individual coral colonies and skeletons. Sci. Rep. 2017, 7, 16737. [Google Scholar] [CrossRef] [PubMed] [Green Version]
  60. Browne, N.K.; Smithers, S.G.; Perry, C.T. Coral reefs of the turbid inner-shelf of the Great Barrier Reef, Australia: An environmental and geomorphic perspective on their occurrence, composition and growth. Earth Sci. Rev. 2012, 115, 1–20. [Google Scholar] [CrossRef]
  61. Anthony, K.R. Enhanced energy status of corals on coastal, high-turbidity reefs. Mar. Ecol. Prog. Ser. 2006, 319, 111–116. [Google Scholar] [CrossRef] [Green Version]
  62. Hughes, T.P.; Anderson, K.D.; Connolly, S.R.; Heron, S.F.; Kerry, J.T.; Lough, J.M.; Baird, A.H.; Baum, J.K.; Berumen, M.L.; Bridge, T.C.; et al. Spatial and temporal patterns of mass bleaching of corals in the Anthropocene. Science 2018, 359, 80–83. [Google Scholar] [CrossRef] [PubMed]
  63. Cantin, N.E.; Cohen, A.L.; Karnauskas, K.B.; Tarrant, A.M.; McCorkle, D.C. Ocean warming slows coral growth in the central Red Sea. Science 2010, 329, 322–325. [Google Scholar] [CrossRef] [PubMed]
Figure 1. Reefs in the central section of Australia’s Great Barrier Reef used to explore cross-shelf variation in the growth of three species of branching corals. Underlay shows cumulative heat stress, as the maximum Degree Heating Weeks (DHW: °C-weeks) during the period of the study (December 2015 to December 2016).
Diversity 10 00122 g001
Figure 2. Inter-reef differences in annual linear extension for (A) Acropora nasuta, (B) Pocillopora spp. and (C) Stylophora pistillata. Notched boxplots (where possible) show the 95% confidence interval, the first and third quartiles and range. Limited and missing data for S. pistillata (see Table 1) prevent the meaningful estimates of confidence limits.
Diversity 10 00122 g002aDiversity 10 00122 g002b
Figure 3. Cross-shelf variation in bulk density for (A) Acropora nasuta, (B) Pocillopora spp. and (C) Stylophora pistillata. Data are presented for each reef separately (to allow for comparisons with Figure 2), though spatial variations in bulk density were best explained by shelf position (rather than reef) for both A. nasuta and Pocillopora spp. Box plots show first and third quartiles.
Diversity 10 00122 g003aDiversity 10 00122 g003b
Table 1. Sample sizes for both the number of colonies actually stained and re-deployed at each location and the number and percentage recovered (in parentheses) that were used to quantify ALE for each of the three taxa.
Shelf Position-ReefAcropora nasutaPocillopora spp.Stylophora pistillataTotal
Inshore–Orpheus Island15/15 (100%)10/12 (83%)1/3 * (33%)26/30 (87%)
Inshore–Pelorus Island6/13 (46%)12/12(100%)0/0 *18/25 (72%)
Mid-shelf–Bramble Reef2/12 (17%)13/13 (100%)0/11 (0%)15/36 (42%)
Mid-shel –Trunk Reef2/12 (17%)11/12 (92%)4/11 (36%)17/35 (49%)
Offshore–Pith Reef9/12 (75%)9/12 (75%)10/13 (77%)28/37 (76%)
Offshore–Unnamed Reef9/11 (82%)10/12 (83%)6/12 (50%)25/35 (71%)
TOTAL43/75 (57%)65/73 (89%)21/50 (42%)129/198 (65%)
* Could not find sufficient colonies within the specific study location.
Table 2. Model comparisons for GLMs used to test whether shelf position (inshore, mid-shelf of offshore) or cumulative temperature stress (DHW) effectively accounted for inter-reef differences in growth and density of three distinct branching corals. Models selected (based on Akaike Information Criterion (AICc) and degrees of freedom (df)) are shown in bold.
Coral TaxaParameterModelAICcdf
Acropora nasutaGrowth~Shelf + Colony3029.635
~Reef + Colony2875.408
~DHW + Colony3033.574
Density~Shelf21.664
~Reef28.567
Pocilloporaspp.Growth~Shelf + Colony5597.425
~Reef + Colony5424.058
~DHW + Colony5438.644
Density~Shelf51.194
~Reef51.347
Stylophora pistillataGrowth~Shelf + Colony1568.085
~Reef + Colony1427.736
~DHW + Colony1429.354
Density~Shelf15.754
~Reef16.335

