Article

Exploring Plant Functional Diversity and Redundancy of Mediterranean High-Mountain Habitats in the Apennines

by
Alessandro Bricca
1,*,†,
Maria Laura Carranza
2,*,†,
Marco Varricchione
2,
Maurizio Cutini
3 and
Angela Stanisci
2
1
School of Biosciences and Veterinary Medicine, University of Camerino, Via Pontoni 5, 62032 Camerino, Italy
2
Envix-Lab, Dipartimento di Bioscienze e Territorio, Università degli Studi del Molise, Contrada Fonte Lappone, 86090 Pesche, Italy
3
Department of Sciences, University of RomaTre Roma, Viale Guglielmo Marconi, 446, 00146 Rome, Italy
*
Authors to whom correspondence should be addressed.
Joint first author.
Diversity 2021, 13(10), 466; https://doi.org/10.3390/d13100466
Submission received: 6 September 2021 / Revised: 22 September 2021 / Accepted: 24 September 2021 / Published: 26 September 2021
(This article belongs to the Special Issue Diversity, Ecology and Conservation of Alpine Plants)

Abstract

:
We analyzed plant functional diversity (FD) and redundancy (FR) in Mediterranean high-mountain communities to explore plant functional patterns and assembly rules. We focused on three above-ground plant traits: plant height (H), a good surrogate of competition for light strategies, and specific leaf area (SLA) and leaf dry matter content (LDMC), useful indicators of resource exploitation functional schemes. We used the georeferenced vegetation plots and field-measured plant functional traits of four widely spread vegetation types growing on screes, steep slopes, snowbeds and ridges, respectively. We calculated Rao’s FD and FR followed by analysis of standardized effect size, and compared FD and FR community values using ANOVA and the Tukey post hoc test. Assemblage rules varied across plant communities and traits. The High FRH registered on snowbeds and ridges is probably linked to climatic filtering processes, while the high FDH and low FDSLA and FDLDMC on steep slopes could be related with underlying competition mechanisms. The absence of FD patterns in scree vegetation pinpoint random assembly processes which are typical of highly unstable or disturbed ecosystems. Improved knowledge about the deterministic/stochastic processes shaping species coexistence on high mountain ecosystems should help researchers to understand and predict vegetation vulnerability to environmental changes.

1. Introduction

During the last few decades, there has been considerable interest in ecological research to analyze the distribution and fitness of natural communities across environmental gradients [1] to understand community assembly rules, a key factor in assessing the effects of global change on biodiversity [2,3,4]. Previous studies explored the processes behind species assemblages by analyzing taxonomic diversity [5,6,7,8], with the assumption that all species are equally dissimilar and contribute in a comparable way to ecosystem functioning [9,10]. However, there is great functional variability among plant species and different taxa likely play different roles in ecosystem functioning [11,12].
Functional traits are morpho-physio-phenological characteristics that affect the fitness of species, i.e., their growth, reproduction, competition and survival, in a specific environmental context [13]. Given their importance in providing early signals of environmental change and depicting the relationships between species and ecosystem functioning, there has been an increasing number of plant community studies based on the analysis of functional traits [10,14,15,16,17].
The coexistence of species in a community is determined by the interplay of deterministic processes (abiotic and biotic drivers) and stochastic processes (random drivers) [1]. Thus, functional diversity values (e.g., the variability of functional traits) of plant communities assembled by deterministic processes tend to depart from the diversity values that would be expected by chance [1,18]. In plant communities with high functional diversity values, species coexistence is ruled by biotic interactions such as competition. These interactions promote niche partitioning mechanisms (“limiting similarities”) [19] and prevent the occurrence of species with similar traits, or, in other words, a species assemblage with low functional redundancy. In the short term, such plant communities marked by specialized and low-redundance taxa could be particularly vulnerable to environmental alterations, as the extinction of a single species and the attendant loss of its ecological role could alter the ecosystem’s functioning [3,20]. Moreover, in the long term, high functional diversity values could support the ability of the altered plant community to adapt to environmental changes [11,21,22]. On the other hand, in a community with lower functional diversity than expected by chance, species coexistence may be ruled by harsh environmental factors that promote species convergence towards a few well-adapted and redundant functional traits in a process called “habitat filtering” [23]. Plant communities marked by species that share similar traits are quite resistant, because the loss of one species can be buffered by the presence of other functionally similar species, and thus the functioning of the ecosystem would not undergo alterations. However, in the long term, this low range of functional strategies would limit the altered plant community’s ability to adapt to and survive further changes [9].
While species assemblage patterns such as niche overlap or partition and their relation to ecosystem functioning have been analyzed in grassland and forest ecosystems [15,24,25], there is a need for the analysis of ecosystems particularly affected by and sensitive to global change, such as the arctic tundra and high mountains [17,26]. There has been some research dealing with single aspects of plant diversity in high-mountain communities, such as taxonomic diversity [27,28] and functional diversity [29,30,31], but functional redundancy issues have yet to be explored sufficiently [32].
High-mountain ecosystems are hotspots of plant diversity [33,34,35] expressing a unique interplay of biogeographic, biotic and abiotic factors. Unfortunately, high mountains are threatened by direct and indirect human pressures that alter biodiversity and ecosystem functioning. In particular, Mediterranean summits can be considered prominent “hotspots” of climate change [35,36], where biodiversity erosion is highly concerning [37]. There is evidence that, on these summits, the rapid increase in temperatures and drought stress is altering the composition and function of plant communities [32,38,39]. As on other summits around the world, mountain ecosystems in the central Apennines are being altered by global climate change [35,38], and there is an urgent need for more in-depth research on functional strategies that cope with the ongoing changes. Understanding functional assemblage mechanisms as well as functional redundancy issues at the species and community level is crucial for modelling and forecasting how biodiversity will change and how the functioning of ecosystems will alter in response to these global changes [40].
Given these considerations, the present work sought to analyze species assembly and functional redundancy across high-mountain Mediterranean plant communities. To explore the underlying mechanisms of plant species’ local coexistence, we analyzed functional diversity and redundancy based on a set of traits commonly used for depicting processes of competition (plant height: H) and resource exploitation (specific leaf area: SLA, leaf dry matter content: LDMC) that are involved in specific ecosystem services such as soil fertility and climate mitigation [41]. We specifically analyzed the ecosystem mosaic in the calcareous central Apennines, formed by four main vegetation types: the Leucopoa dimorpha community growing on screes, the Sesleria juncifolia community on steep slopes, the Plantago atrata community on snowbeds and the Silene acaulis community on ridges. In particular, we focused on the following questions: (1) How do functional diversity and redundancy vary among plant traits? (2) Do functional diversity and redundancy vary across the different plant communities?

2. Materials and Methods
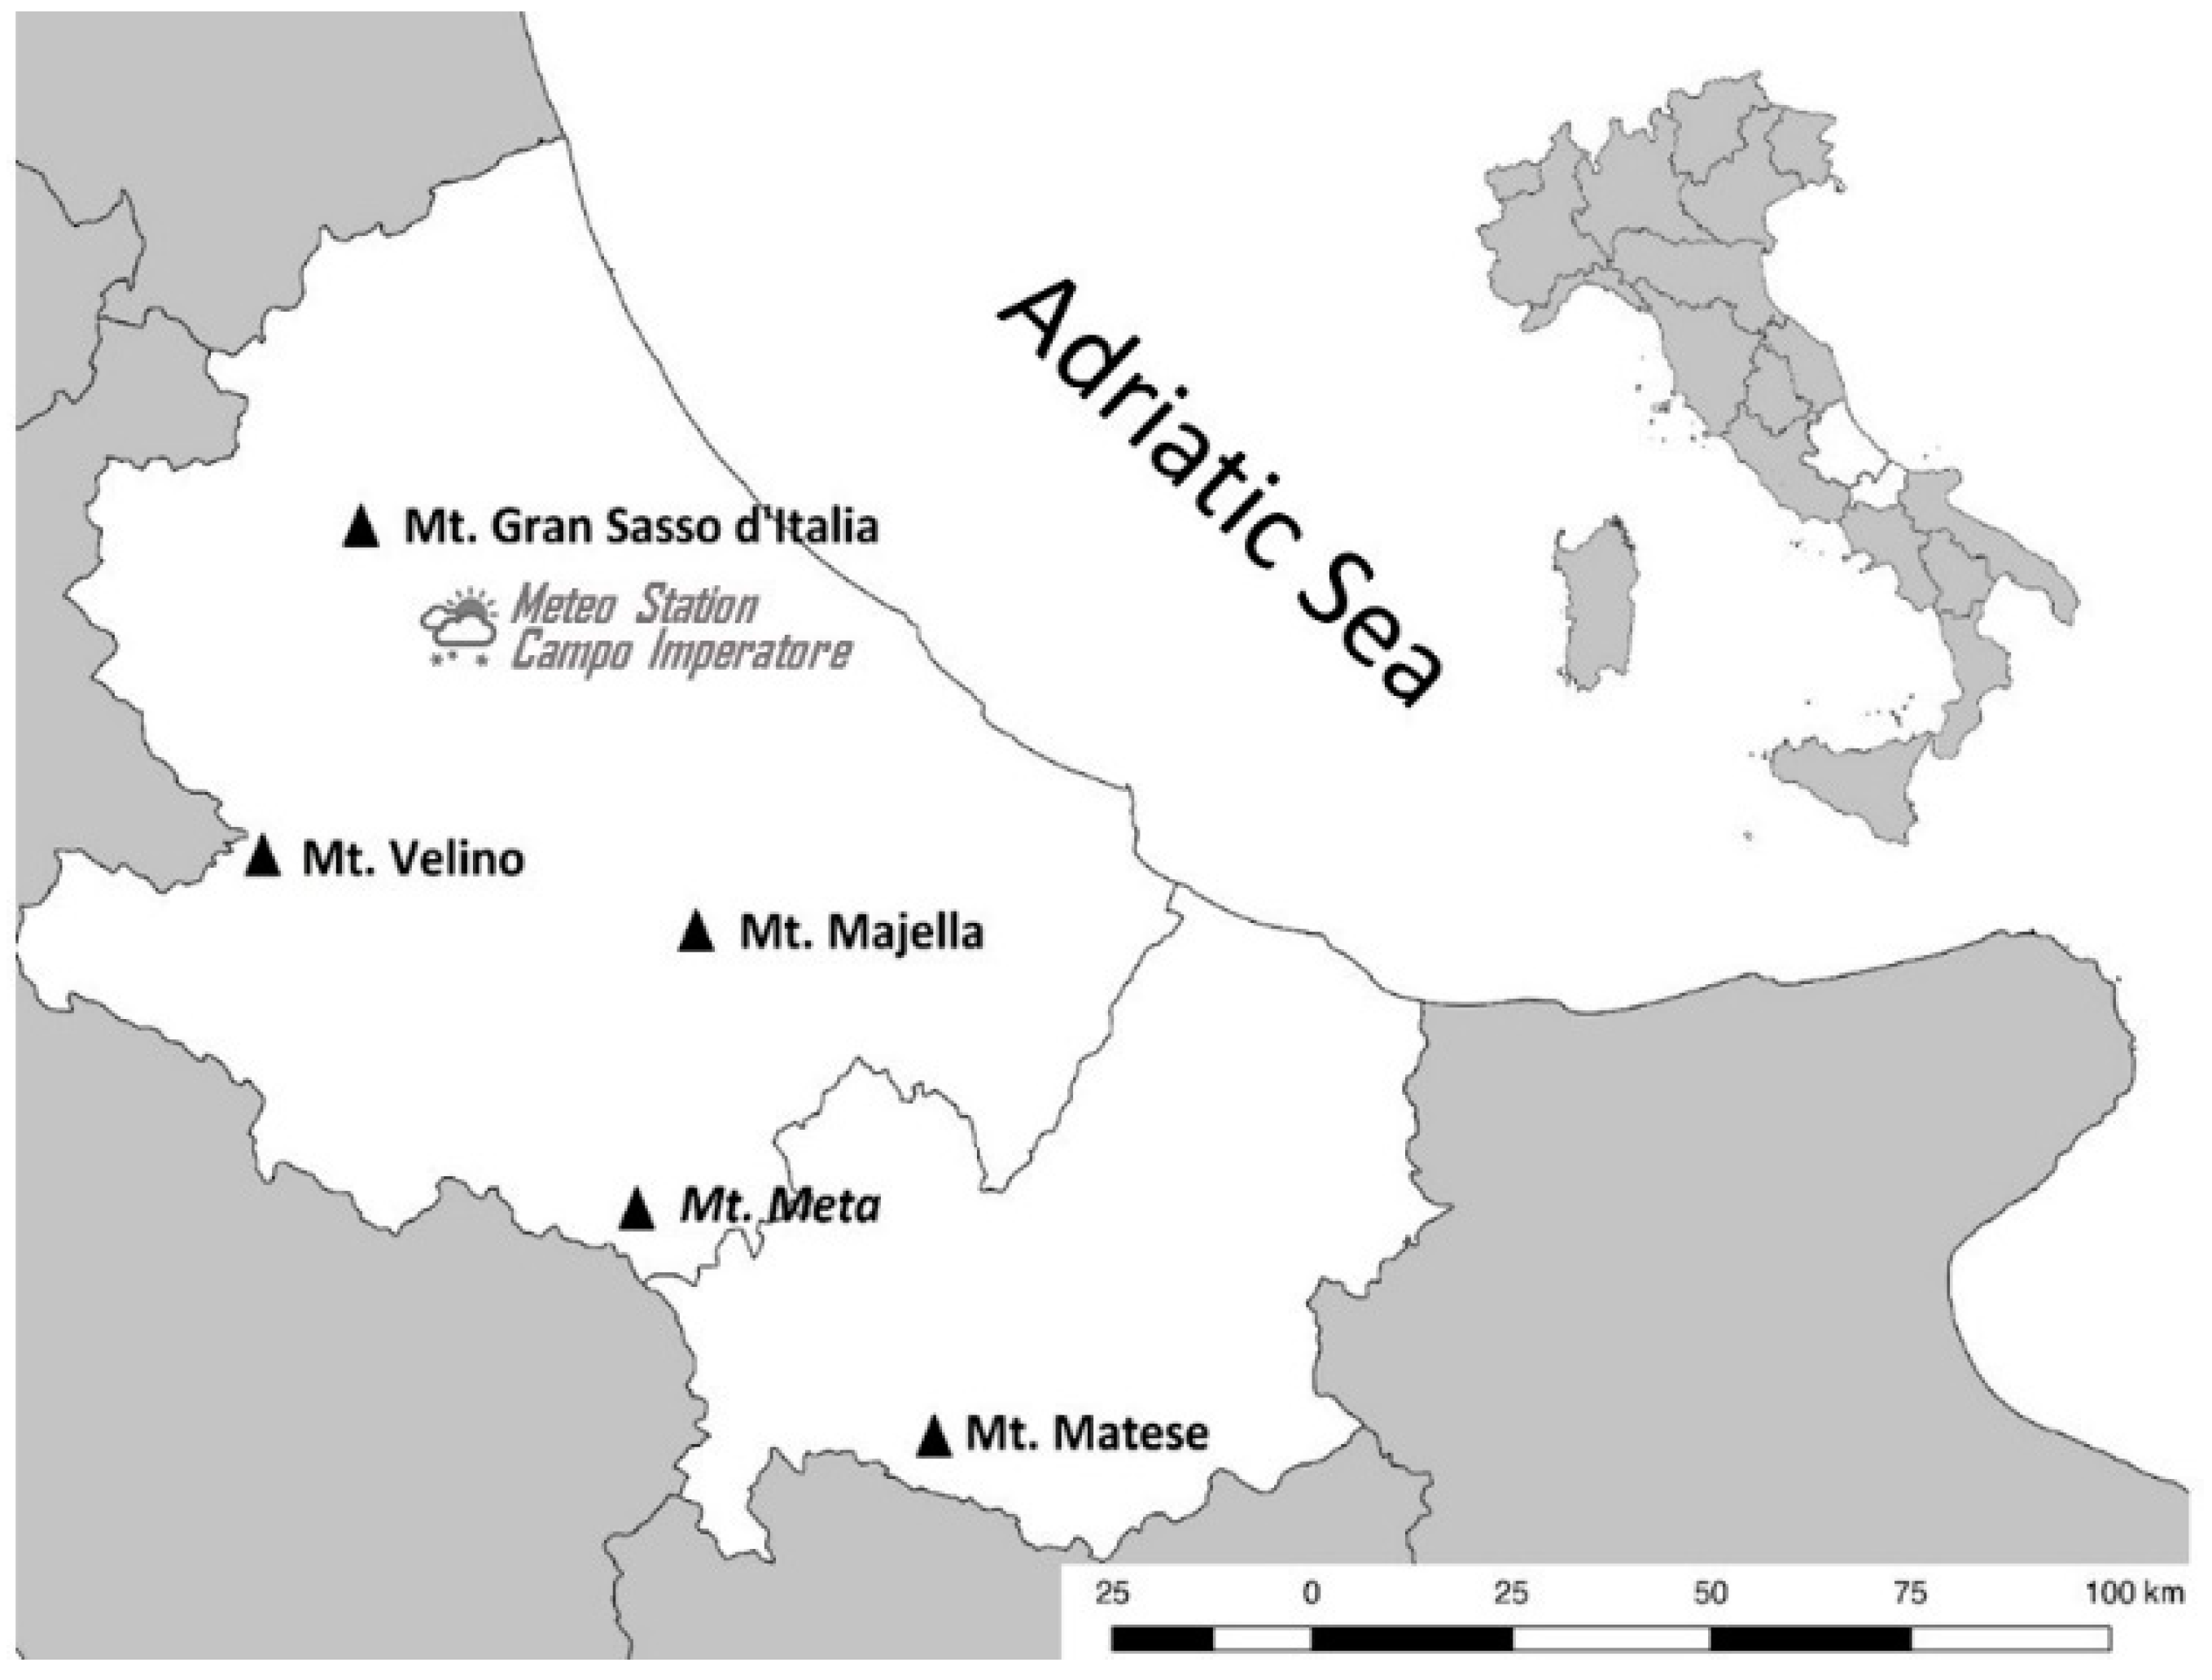
2.1. Study Area

We analyzed four plant community types representative of the high elevation zone of the Apennines limestone chain (Appendix A) and referable to the specific land units of screes, steep slopes, snowbeds and ridges [42]. Specifically, we considered: (a) the Sesleria juncifolia community, which consists of calciphilous stepped and garland grasslands, common on rendzina soils, sampled on steep slopes; (b) the Leucopoa dimorpha community that grows on limestone screes characterized by discontinuous vegetation growing on steep slopes with dry and debris-rich soils; (c) the Silene acaulis community represented by discontinuous vegetation in wind-scoured ridges growing on shallow soils, rich in debris; and (d) the Plantago atrata community, which consists of Oro–Apennine continuous grasslands growing on small snowbeds where there is a long period with long snow cover, a short vegetative period and humid soils [31,42,43,44,45,46]. Table 1 reports information on taxonomy (species richness and number of species), environmental conditions (elevation and slope) and ecological conditions, quantified with Ellenberg indicator values (ordinal classification of plants according to the position of their realized ecological niche along an environmental gradient) [47].
All the selected plant communities are habitats of conservation concern in Europe (EUcode 6170: Alpine and subalpine calcareous grasslands, EUcode 8120: Calcareous and calcshist screes of the montane to alpine levels) [48]) and are particularly rich in endemics, Southern European orophytes and Mediterranean montane species [42,49,50].
The climate in the central Apennines shows a typical Mediterranean pattern with low summer precipitation, negligible summer aridity and a wetter period in autumn. Summer precipitation increases towards higher elevations, which have a humid/hyperhumid water regime [51,52,53]. According to the Köppen–Geiger classification, the climate ranges from temperate–oceanic (Cfb) in the lower sector to subarctic (Dfc) at the summits [54].

2.2. Data Collection

We extracted vegetation data from the VIOLA database (high mountain VegetatIOn of centraL Apennines [45,56]; European Vegetation Archive code—EU-IT-019 [57]). Plots carried out during the last few decades describing the four target plant communities were extracted and selected according to: (a) the presence of the pool of the diagnostic species, as reported in the Italian vegetation prodrome and EUcode manual for habitat identification [58,59], (b) maximized inter-plot spatial distance (plots separated by at least 200 m) and (c) comparable vegetation cover among plots. In total, 164 plots were selected, with an average size of 45 m2, distributed as follows: 23 of the Leucopoa dimorpha community, growing on calcareous screes; 55 of the Sesleria juncifolia community, occurring on steep slopes; 49 of the Plantago atrata community, growing in snowbeds, and 37 of the Silene acaulis community, growing on mountain ridges. Taxa nomenclature follows that of Pignatti [60].
For functional analyses, given that it was not feasible to measure the trait values for all species in each plot [61], we selected the most abundant species limited to those taxa whose relative cumulative cover was 70% of vegetation cover on at least one of the considered plots [61]. Thus, for each plot, we ordered the species by decreasing relative cover values and, beginning from the most abundant one, we summed them up to 70% of the total plot vegetation cover. Following this procedure, we identified a set of 62 species for which we measured vegetative plant height (H, cm), specific leaf area (SLA, mm2/mg) and leaf dry matter content (LDMC, mg/g), which are good surrogates of the ecological functions of competitive ability and resource exploitation [62]. Species trait values were partially retrieved from recent measurements performed in the analyzed area (2016–2017) [31] and by dedicated field measurements carried out following the standardized protocol (2019) [62], in line with Zanzottera et al. [63]. Trait research based on data specifically measured in the analyzed area ensures more accurate information about plant strategies than that obtained from databases [64].

2.3. Indicator Species Analysis and Species-Level Redundancy

First, we explored the distribution pattern of the 62 most abundant species and their measured traits (H, SLA and LDMC) across the four analyzed plant communities by implementing indicator species analysis (ISA) [65] followed by species redundancy analysis [66]. The “species x plot” matrix was analyzed using plant community types as a grouping factor, with 999 permutations [65]. We identified the species discriminating each plant community (hereafter “community indicator species”), as those with ISA relative abundance over 0.6 and relative frequency higher than 0.25 [67].
Next, for each of the community indicator species identified, we measured their individual trait redundancy value (rH, rSLA, rLDMC) with respect to the other species of the plant community as follows [66]:
r i = 1 j   i p j 1 p i δ i j
where ri is the redundancy value of species i with respect to the other species in the community, and δ is the functional dissimilarity for a given trait between species i and j. Functional dissimilarity ( δ ij), calculated with Gower distance [68], is = 0 when two species assume exactly the same trait values and 1 when two species have exactly the opposite trait values. Species redundancy values are expressed in a range from 0 to 1. The ISA was performed in the R environment (R Foundation for Statistical Computing, Vienna, Austria, http://www.R-project.org, accessed on 1 April 2021) using the mutipatt function in the indicspecies package, while the species functional redundancy was calculated with R function uniqueness, provided by Ricotta et al. [66].

2.4. Community-Level Functional Diversity and Redundancy

The next step was to calculate the community-level functional diversity (FD) and redundancy (FR) using Rao’s Quadratic Entropy (Q) [69]. We selected Rao’s Q because it is able to summarize the abundance of the species and the functional distance of their traits and offers a sound framework for the simultaneous analysis of a variety of facets, such as taxonomic and functional parameters [70]. Rao’s Quadratic Entropy expresses the expected dissimilarity between two individuals of a given assemblage selected at random with replacement:
Q = i , j S   δ i j p i p j
where S is the number of species, δij is the dissimilarity between the i-th and j-th species, and pi and pj are the proportion of abundance of the i-th and j-th species in the vegetation plot.
When Q is implemented for measuring FD, the dissimilarity (δij) between the i-th and j-th species may vary from 0 (two species have the same trait values) to 1 (two species have completely different trait values).
Rao’s Q was also used for calculating the functional redundancy (FR), as follows [66]:
FR = 1 FD TD
where FD is functional diversity and TD is the Simpson index of dominance (1-Simpson) calculated with Rao’s Q. TD represents the maximum value that FD may achieve, since the distance between each pair of species is fixed as δij = 1 for all ij. Thus, FD may vary from 0 (all species present the same trait values) to TD (all species are completely functionally different) [63]. FR can assume values ranging from 1 (a highly redundant community in which all species are functionally identical) to 0 (no redundant communities with all the species functionally dissimilar). It should be noted that since FR is a fraction of FD and TD, it is independent of species richness [66].
For each community (the Leucopoa dimorpha, Sesleria juncifolia, Plantago atrata and Silene acaulis communities), we calculated FR and FD for each trait (FRH, FRSLA, FRLDMC, FDH, FDSLA, FDLDMC), using the Gower measure ( δ ij) because it standardizes the distance values (from 0 to 1) [68], allowing a comparison between TD and FD [70], which is necessary to calculate FR. Continuous trait values were log-transformed before calculation of the indices [61]. We calculated functional redundancy (FR) and functional diversity (FD) using the R function uniqueness [66].
To detect community assembly processes, we generated the distribution of expected random values of FD by shuffling the trait values across species 999 times and by calculating the standardized effect size [18] of FD for each trait (SES: observed FD values—mean 999 expected FD values/standard deviation of 999 expected FD values). Then, we assessed whether the distribution of SES values for each FD trait per plant community was significantly different from zero using a two-tailed t-test. Distribution of SES values significantly lower than 0 denotes “functional convergence”, while that of values significantly higher than 0 indicates “functional divergence”.
Variations in the standardized effect size of functional diversity (SES-FD) and in functional redundancy (FR) for each trait (i.e., H, SLA, LDMC) across the considered plant communities were quantified with distinct one-way analysis of variance (ANOVA) type I models, followed by Tukey post hoc tests [71]. For each significant model, the normality, homogeneity and independence of residuals were checked by the visual inspection of the residuals [72].
The aov, TukeyHSD and t.test functions in the stats package served to perform the ANOVAs, the Tukey post hoc test and the t-test, respectively.

3. Results

3.1. Indicator Species Analysis and Species-Level Redundancy

The results of ISA on the 62 most abundant taxa highlighted an elevated number of indicator species for each plant community, with 10 species for the Silene acaulis community (indicator values min = 0.49—max = 0.79); 9 for the Plantago atrata community (indicator values min = 0.65—max = 0.98); and 6 for both the Leucopoa dimorpha community (indicator values min = 0.42—max = 0.69) and the Sesleria juncifolia community (indicator values min = 0.44—max = 0.94).
The mean values of species-level functional redundancy for plant height (rH) were lower for the Sesleria juncifolia community (mean = 0.74) and the Leucopoa dimorpha community (mean = 0.75), due to the co-occurrence of different strategies, namely those of tall graminoids (Leucopoa dimorpha) and short forbs (Doronicum columnae). On the other hand, the mean value of species-level height redundancy (rH) was higher in the Silene acaulis community (mean = 0.81; Pedicularis elegans and Galium magellense) and the Plantago atrata community (mean = 0.84, Poa alpina subsp. alpina, Ranunculus pollinensis and Trifolium thalii) (Table 2).
The mean value of species-level leaf area redundancy (rSLA) was low in the Plantago atrata community (mean = 0.73, Crepis aurea subsp. glabrescens and Taraxacum glaciale) and high in the Sesleria juncifolia community (mean = 0.90; Sesleria juncifolia and Carex humilis). Intermediate values of rSLA were observed in the Leucopoa dimorpha community (mean = 0.82; with Achillea barrelieri subsp. barrelieri and Isatis apennina) and in the Silene acaulis community (mean = 0.86; Anthyllis vulneraria subsp. pulchella and Arenaria grandiflora subsp. grandiflora) (Table 2).
The mean value of species-level redundancy for LDMC (rLDMC) assumed lower values in the Leucopoa dimorpha community (mean = 0.65 with Leucopoa dimorpha and Isatis apennina) and higher values in the Sesleria juncifolia community (mean = 0.84; Carex humilis and Globularia meridionalis). Intermediate rLDMC values were observed in the species of the Plantago atrata community (mean = 0.73; Ranunculus pollinensis and Trifolium thalii) and of the Silene acaulis community (mean = 0.80; Androsace villosa subsp. villosa and Arenaria grandiflora subsp. grandiflora) (Table 2).

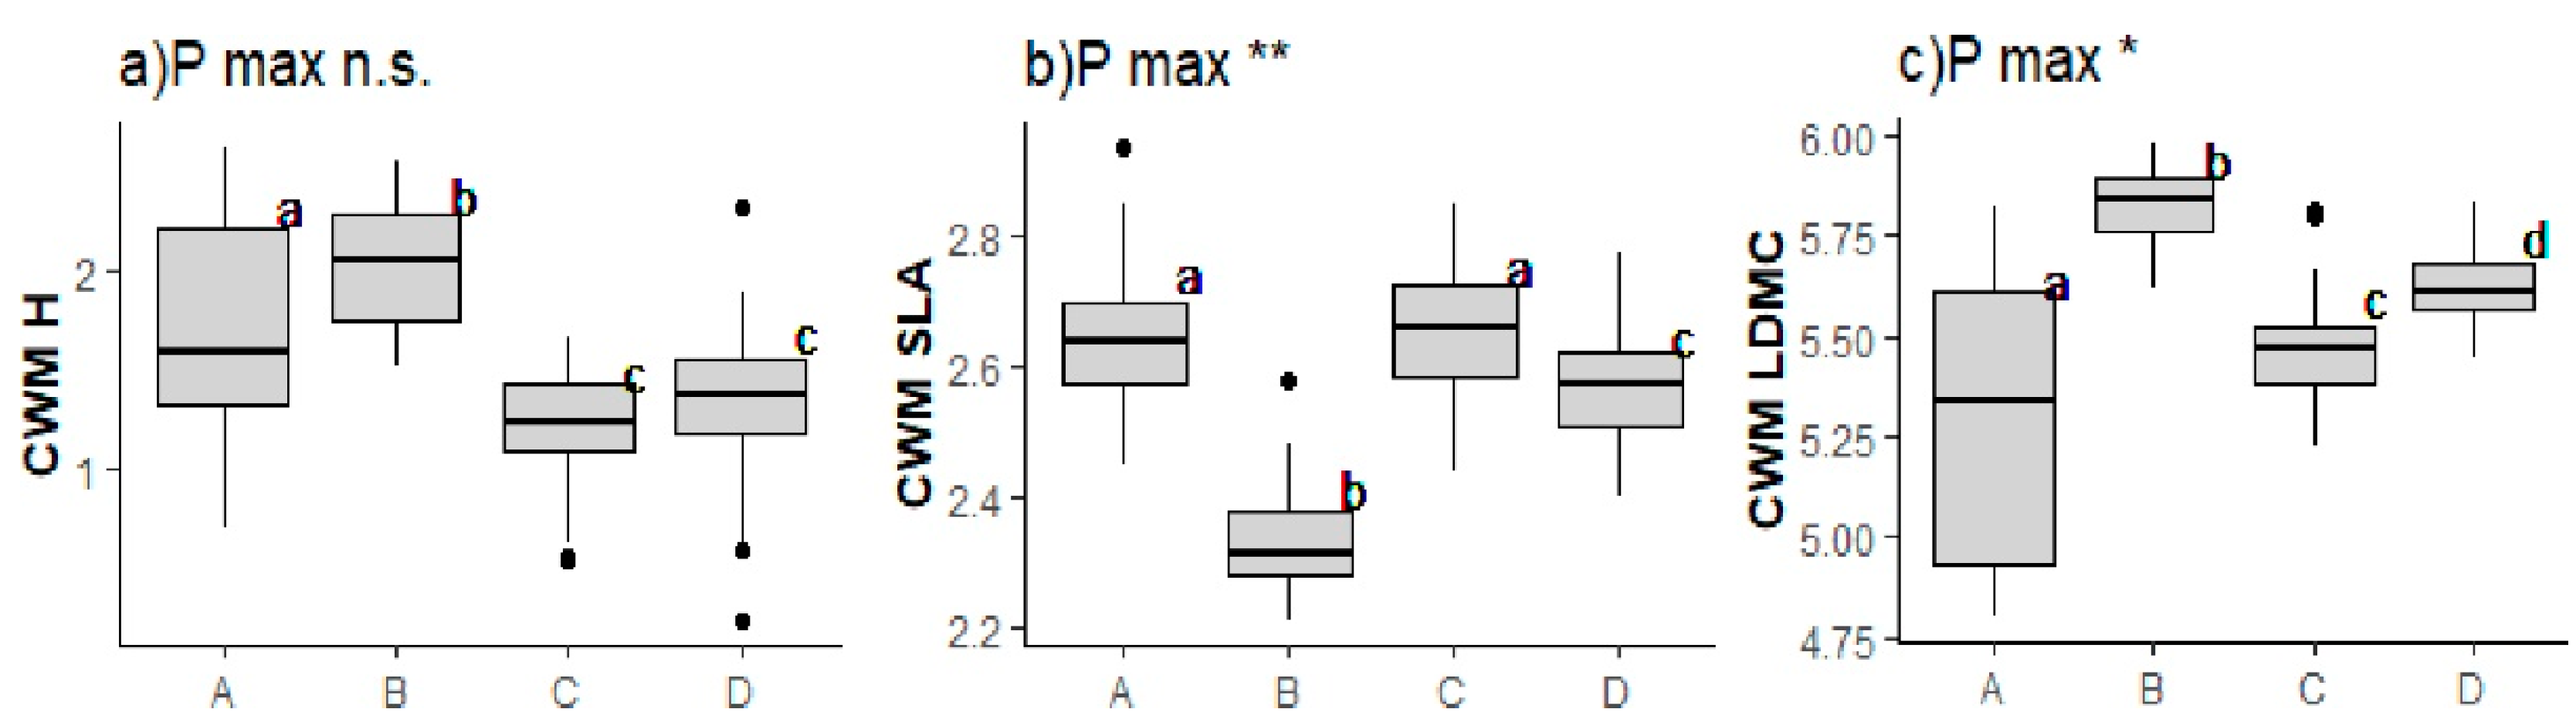
3.2. Community-Level Functional Diversity

The standardized effect size of functional diversity (SES-FD) for all the considered traits (H, SLA and LDMC) significantly varied among plant communities (Figure 1; Appendix B). Regarding plant height strategies, the Sesleria juncifolia and Leucopoa dimorpha communities showed significantly higher SES-FDH values than the Plantago atrata and Silene acaulis communities (Figure 1a). The analysis of community leaf trait strategies (SES-FDSLA and SES-FDLDMC) evidenced higher SES-FDSLA and SES-FDLDMC values for the Leucopoa dimorpha and Plantago atrata communities (Figure 1b,c) than for the Sesleria juncifolia and Silene acaulis ones (Figure 1b,c).
Significant departures of SES-FDH from random expectation were observed for the Sesleria juncifolia community (functional divergence; Table 3) as well as for the Plantago atrata and Silene acaulis communities (functional convergence; Table 3). Conversely, the Leucopoa dimorpha community plant height assemblage did not differ from a random pattern (Table 3). Concerning leaf traits, the Sesleria juncifolia and Silene acaulis communities showed a convergent pattern (negative departure from random expectation) for both SLA and LDMC (Table 3). Conversely, the Plantago atrata community presented a divergent pattern for SLA and a convergent one for LDMC (Table 3), while the Leucopoa dimorpha community distribution pattern of SLA and LDMC did not differ from a random expectation (Table 3).

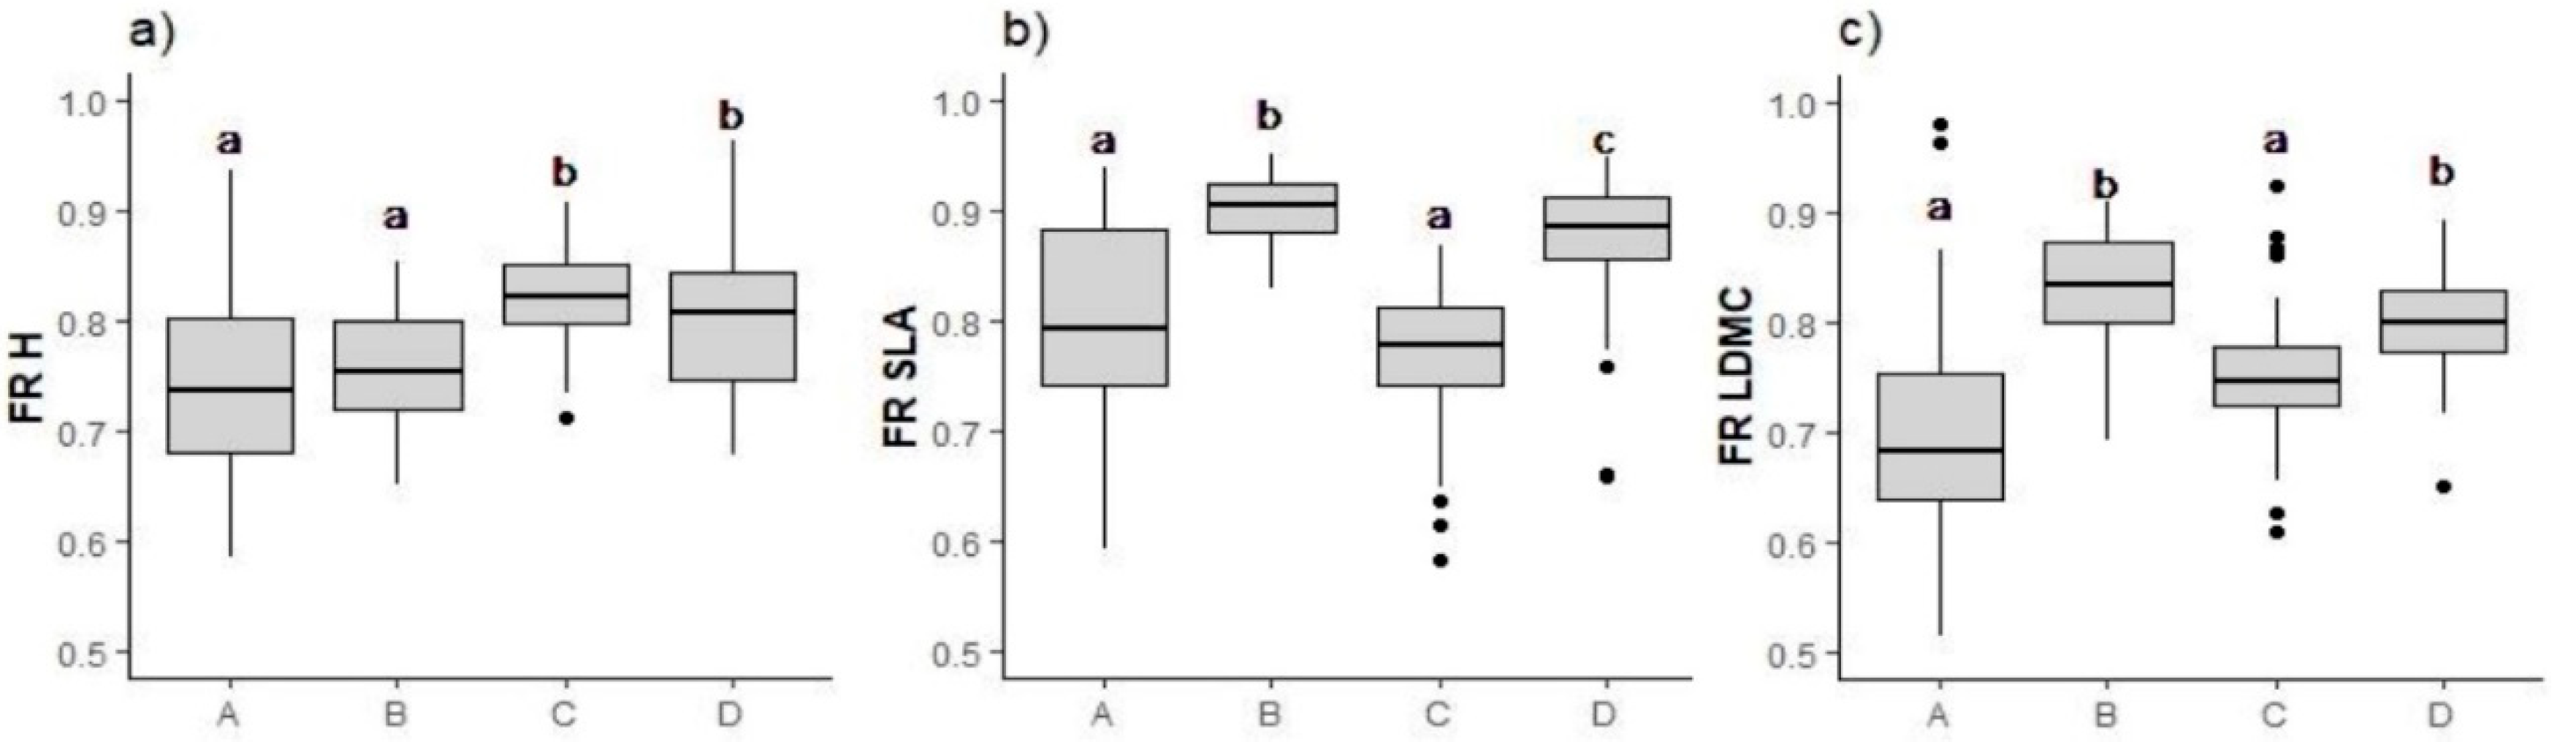
3.3. Community-Level Functional Redundancy

Functional redundancy (FR) significantly varied across the analyzed plant communities and presented complementary behavior with respect to FD (Figure 2; Appendix B).
We observed higher redundancy values for vegetative plant height (FRH) in the Plantago atrata and Silene acaulis communities (Figure 2a). Concerning leaf traits, the Sesleria juncifolia community showed a higher redundancy value for both SLA (FRSLA; Figure 2b) and LDMC (FRLDMC; Figure 2c). On the other hand, we registered lower redundancy values for SLA in the Plantago atrata community (FRSLA; Figure 2b) and for LDMC in the Leucopoa dimorpha community (FRSLA; Figure 2b).

4. Discussion

The distribution pattern of the 62 most abundant species varied across the different vegetation types. The relatively high number of indicator species for all the plant communities (higher number of species in the Silene acaulis community and lower number in Sesleria juncifolia communities) is most likely related to the high abiotic differences among the local environmental conditions of the plant communities forming the Apennine high-elevation vegetation mosaic [43]. Such high floristic variability between plant communities on high-mountain landscapes depicts the biodiversity response to topography, which plays a consistent role in modulating local climatic and soil conditions [73]. In the central Apennines, the interplay of climatic and edaphic factors across the altitudinal gradient has given rise to a complex mosaic of different vegetation types with distinct physiognomies and species composition [42] (see also Table 2). Accordingly, species coexistence patterns depicted by functional diversity (SES-FDH, SES-FDSLA and SES-FDLDMC) and functional redundancy (FRH, FRSLA and FRLDMC) varied across the analyzed vegetation mosaic. Functional redundancy varied but with a mirrored behavior with respect to functional diversity, confirming the “complementarity” of the information supplied by the two indices [74].

4.1. Vegetative Plant Height

The plant communities growing in particularly cold environments, such as the Plantago atrata vegetation of snowbeds and the Silene acaulis vegetation of ridges, presented significantly low functional diversity and high redundancy for plant height (low SES-FDH and high FRH). We observed a convergence in plant height, which could be related to the stringent climatic filtering mechanisms of upper elevations [23,30,75,76,77], which positively select short species able to benefit from a soil temperature that is higher than the air temperature [73,78]. Indeed, the climate of the Apennine summits and ridges is cold, with marked winter frosts [52] and long snow cover periods on snowbeds, all conditions that select functional strategies adapted to cold stress [29,31,76,77,79]—for example, those of specialist cryophilous species [42,78]. Here, the vegetation on snowbeds and ridges is dominated by short forbs (Trifolium semipurpureum: 3.1 cm; Ranunculus pollinensis: 2.7 cm; Anthyllis pulchella: 3.5 cm; Galium magellense: 2.46 cm; Pedicularis elegans: 4 cm) and short graminoids (Kobresia myosuroides: 8.5 cm; Festuca italica: 6.89 cm) The observed high redundancy for plant height (high FRH) may enable plant communities to deal with environmental changes successfully in the short term, as the loss of one species could be buffered by the presence of other, functionally similar ones [9]. However, low plant height variability and high trait redundancy denote a reduced set of plant strategies, which indicates weak potential for reacting successfully to changing environmental conditions in the long term [11].
Conversely, mountain slopes with the Sesleria juncifolia community disclosed high values of plant height functional diversity (SES-FDH) and low values of functional redundancy (FRH). Given that vegetative plant height captures the functional dimension of competition for light [62], the high SES-FDH is probably related to niche partitioning processes (limiting similarities) [19] that regulate species coexistence in the high mountain stands, where the growing season is longer. Indicator species in the Sesleria juncifolia community showed great variability in plant sizes, ranging from tall graminoids (Sesleria juncifolia: 16.8 cm; Bromopsis erecta: 32.7 cm) to short forbs (Globularia meridionalis: 2 cm; Anthyllys montana: 5.46 cm). Here, the higher diversity may suggest that the vegetation has a good ability to adapt to climate change in the long term, since the presence of functionally dissimilar species should indicate the potential of the vegetation to adapt to new environmental conditions [9,11]. In addition, the good cover of tall species should contribute to climate regulation processes and local soil fertility services (Appendix C).
The random behavior of SES-FD in the Leucopoa dimorpha community growing in screes suggests an underlying stochastic assemblage mechanism. Indeed, screes are characterized by sparse vegetation, with a small number of glareicole species coexisting with species coming from the neighboring communities, which randomly migrate and temporally survive on such extremely unstable substrates [80]. As such, this may preclude the establishment of a predictable plant community functionally modelled by such non-random assembly rules as habitat filtering and biotic interaction [1].

4.2. Leaf Traits

For the Plantago atrata snowbed community, we recorded high SES-FDSLA values and low FRSLA, which, as observed in other mountain ecosystems [81], could be interpreted as a community response to locally milder soil conditions [64]. Indeed, snowbeds are morphological units distributed at different altitudes and characterized by relatively rich and humid soils (CMEIV for N; Table 1) [42], which may enhance local resource competition mechanisms and character shift strategies (Appendix C). Specifically, the high leaf diversity in snowbed vegetation is attributable to the co-occurrence of species having a broad spectrum of leaf functional performance ranging from fast-growing species (Taraxacum glaciale, SLA mean: 29.6 mm2mg−1) to slow-growing species (Plantago atrata, SLA mean: 10 mm2mg−1). Higher specific redundancy (functional similarity with coexistent species) was found for species having intermediate SLA values, such as Gnaphalium diminutum (SLA mean: 16.2 mm2mg−1) and Poa alpina (SLA mean: 18.4 mm2mg−1). Global warming and the consequent reduction in snow cover are expected to negatively affect snowbed ecosystems, with results such as alterations in biogeochemical cycles, reduced forage for chamois kids and the filtering of water that feeds springs of potable water [82,83]. Snowbed ecosystem changes may also cause short-term alterations in leaf functions, but the presence of functionally dissimilar plants might support good mid/long-term potential to cope with climatic and land use alterations.
In the Silene acaulis community growing on ridges, we noted the functional convergence of leaf strategies (low SES-FDSLA; LDMC and high FRSLA; LDMC), which, like observations for plant height, could be related to a cold filtering effect. The higher redundancy of slow-growing species suggests the ability to hold the position in an extreme environment and to keep ecosystem functions after species loss (high resistance) [82]. However, the SLA values on criophilous indicator species are very variable and range from relatively high values for Galium magellense (SLA mean: 23.2 mm2mg−1) and Armeria majellensis (SLA mean: 19.42 mm2mg−1) to relatively low values for Anthyllis pulchella (SLA mean: 13.44 mm2mg−1), Silene acaulis (SLA mean: 12.68 mm2mg−1) and Festuca italica (SLA mean: 11.4 mm2mg−1). This high variability in species leaf performance is attributable to the co-occurrence of different growth rate strategies that range from acquisitive resource use (high SLA values), which optimizes rapid carbon gain during the short growing season [31,77], to conservative resource use (low SLA values), in which the adoption of a slow-growth strategy assures the ability to survive environmental hazards [73,79].
The convergent pattern registered for leaf traits (low SES-FDSLA; LDMC and high FRSLA; LDMC) in the Sesleria juncifolia community growing on calcareous slopes could be related to the interplay of two filtering environmental factors, winter frost stress and soil drought [31], which are particularly severe in Mediterranean limestone massifs [30,52,84]. In particular, the slow growth of perennial species (grasses and sedges) represents a good adaptation for both freezing and aridity [29,85] (see also CMEIV for N in Table 1). This convergence towards similar leaf functional strategies well-adapted to climatic stress is seen in very similar indicator species (Aster alpinus mean SLA: 12.12 mm2mg−1, and Sesleria juncifolia mean SLA: 9.50 mm2mg−1). The high functional redundancy of the Sesleria juncifolia community should support good immediate ecosystem resistance to environmental alterations [86] but, at the same time, the limited range of leaf strategies makes these grasslands poorly adapted to further long-term environmental alterations.
The leaf trait diversity of the Leucopoa dimorpha community of screes (SES-FDSLA; SES-FDLDMC) did not differ from values generated by chance (Table 3), indicating the occurrence of casual processes of local colonization and extinction, and the absence of a mature, well-structured plant community. It should be noted that on high-mountain screes in the Central Apennines, soils are highly erodible due to the steepness of slopes, the incoherent substrate and the trampling pressure exerted by the endemic chamois [83]. The interplay of such dynamic abiotic and abiotic factors may enhance the stochastic colonization of plant species coming from neighboring habitats, as well as their local extinction.
In short, as observed in the temperate region [64], plant trait diversity in the central Apennine limestones seems to be related to local environmental variability.

5. Conclusions

The present research on high-mountain vegetation communities explored vegetation assembly rules from a functional perspective, as well as the degree of functional redundancy, and contributes to knowledge about the relations between plant species distribution patterns and the physical environment (snowbeds, ridges, steep slopes and screes) of Mediterranean landscapes. The interpretation of our results in light of previous research suggests the primary role of environmental features such as climate and soil moisture in community assembly, as we observed distinct selective effects (abiotic filters and biotic interaction) on all the measured above-ground plant traits and each considered plant community. Our findings gave further evidence of the essential contribution of trait-based analysis for understanding how ecosystems respond to environmental change. The variation in functional diversity was coupled with a converse variation in functional redundancy, revealing that both indices capture complementary information—namely, the degree of species unicity vs. similarity.
In addition, the analysis of species co-occurrence and the assessment of species-level redundancy sheds light on the functional role of indicator species, which should be of particular concern for endemic taxa. The species-level analysis made it possible to identify those functionally similar taxa that better express the species coexistence at community level. Even so, further studies are needed to explore the effects of climate variation on these functional strategies both at species and community level.
The measured above-ground plant traits captured different aspects of the ecological niches of species [16], but further investigation using other sets of traits, such as belowground and reproductive traits, and incorporating intraspecific trait variability is needed to achieve a deeper understanding of the underlying mechanisms of species coexistence [77].

Author Contributions

Conceptualization, A.B. and M.L.C.; methodology, A.B. and M.L.C.; formal analysis, A.B.; data curation, A.S., M.V. and M.C.; writing—original draft preparation, A.B.; writing—review and editing, M.L.C. and A.S.; supervision, M.L.C. and A.S. All authors have read and agreed to the published version of the manuscript.

Funding

This research received no external funding.

Institutional Review Board Statement

Not applicable.

Data Availability Statement

Not applicable.

Acknowledgments

This research was supported by the project MEDIALPS, EU project no. EVK2-CT-2000-00056, Earth System Sciences Program of the Austrian Academy of Sciences. We thank Sheila Beatty for her support in language and style editing.

Conflicts of Interest

The authors declare no conflict of interest.

Appendix A. Location of the Study Area

Figure A1. Location of the study area and the mountain massifs of the Central Apennines (Abruzzo and Molise Regions in white).
Diversity 13 00466 g0a1

Appendix B. Detailed Results of ANOVA Models for Standardized Effect Size of Plant Height (H), Specific Leaf Area (SLA) and Leaf Dry Matter Content (LDMC)

Table A1. Results of the ANOVA tests for standardized effect size of functional diversity (SES-FD) and functional redundancy (FR) considering the traits of (H) plant height, (SLA) specific leaf area and (LDMC) leaf dry matter content. Plant community type was the grouping factor (df = 3).
IndexFpR2
SES-FDH16<0.0010.23
FRH16<0.0010.23
SES-FDSLA56.48<0.0010.52
FRSLA48.4<0.0010.48
SES-FDLDMC32.57<0.0010.38
FRLDMC21<0.0010.28

Appendix C. Functional Composition (Community Weighted Mean: CWMs) of the Analyzed Plant Communities for Plant Height (H), Specific Leaf Area (SLA) and Leaf Dry Matter Content (LDMC)

To better describe the functional characteristics of the compared communities, we used the community-weighted mean values for each single trait (CWMH; CWMSLA; CWMLDMC), which summarize the mean values of traits at plot level [87]. This was computed by multiplying the “species x plot” matrix with the “species x traits” matrix as follows:
C W M = i = 1 s p i x i
where CWM is the community-weighted mean, xi is the trait value of a given species and pi is the relative frequency of the i-th species, based on cover data. We compared plant community CWM values using ANOVA followed by Tukey’s post hoc test. In order to reduce inflated type I error rates [88], we integrated ANOVA analysis with the “Max Test” procedure [84]. We ran the ANOVAs integrated with the Max Test with the test.cwm function (method “aov”, test “max”) in the weimea package [89].
As reported in Figure A2, Plantago atrata is characterized by higher CWMSLA values (Figure A2b) and lower CWMLDMC, which reflects its fast-growing strategies (higher cover of perennial forbs with competitive strategies), supported here by the fertile and humid soils of the snowbeds. The Sesleria juncifolia community presented lower values of SLA and higher values of LDMC, indicating the dominance of slow-growing strategies (higher presence of tall perennial grass species with competitive stress-tolerant strategies) able to grow and keep its position on high-mountain steep slopes. As previously reported [31], the Silene acaulis ridge community is characterized by low plants and high leaf dry matter content, denoting stress-tolerant mechanisms that increase their acquisitive strategies during the short growing season of the summer to maximize resource exploitation. Finally, the traits of the Leucopoa dimorpha community, growing on calcareous calcshit screes, depict random processes due to the dynamic substrate (see also the Discussion).
Figure A2. Boxplots comparing the functional characteristics of the analyzed plant communities (A: Leucopoa dimorpha scree community, B: Sesleria juncifolia steep slope community, C: Plantago atrata snowbed community, D: Silene acaulis ridge community) in terms of community-weighted mean (CWM) for the functional strategies related to plant height (a), SLA (b) and LDMC (c). Boxplots with different letters indicate statistically significant differences among them after Tukey’s post hoc test (p < 0.05). Statistical significance of ANOVA analysis is also reported (n.s. p > 0.05; * p < 0.05; ** p < 0.01).
Diversity 13 00466 g0a2

References

  1. Götzenberger, L.; de Bello, F.; Bråthen, K.A.; Davison, J.; Dubuis, A.; Guisan, A.; Leps, J.; Lindborg, R.; Moora, M.; Pärtel, M.; et al. Ecological assembly rules in plant communities—Approaches, patterns and prospects. Biol. Rev. 2012, 87, 111–127. [Google Scholar] [CrossRef]
  2. Cadotte, M.W.; Carscadden, K.; Mirotchnick, N. Beyond species: Functional diversity and the maintenance of ecological processes and services. J. Appl. Ecol. 2011, 48, 1079–1087. [Google Scholar] [CrossRef]
  3. Mouillot, D.; Villéger, S.; Parravicini, V.; Kulbicki, M.; Arias-González, J.E.; Bender, M.; Chabanet, P.; Floeter, S.; Friedlander, A.; Vigliola, L.; et al. Functional over-redundancy and high functional vulnerability in global fish faunas on tropical reefs. Proc. Natl. Acad. Sci. USA 2014, 111, 13757–13762. [Google Scholar] [CrossRef] [Green Version]
  4. Funk, J.L.; Larson, J.E.; Ames, G.M.; Butterfield, B.J.; Cavender-Bares, J.; Firn, J.; Laughlin, D.C.; Sutton-Grier, A.; Williams, L.; Wright, J. Revisiting the Holy G rail: Using plant functional traits to understand ecological processes. Biol. Rev. 2017, 92, 1156–1173. [Google Scholar] [CrossRef] [PubMed]
  5. Rosenzweig, M.L. Species Diversity in Space and Time, 1st ed.; Cambridge University Press: Cambridge, UK, 1995. [Google Scholar]
  6. Willig, M.R.; Kaufman, D.M.; Stevens, R.D. Latitudinal gradients of biodiversity: Pattern, process, scale, and synthesis. Annu. Rev. Ecol. Evol. Syst. 2003, 34, 273–309. [Google Scholar] [CrossRef]
  7. Malavasi, M.; Conti, L.; Carboni, M.; Cutini, M.; Acosta, A.T. Multifaceted analysis of patch-level plant diversity in response to landscape spatial pattern and history on Mediterranean dunes. Ecosystems 2016, 19, 850–864. [Google Scholar] [CrossRef]
  8. Bricca, A.; Chelli, S.; Canullo, R.; Cutini, M. The Legacy of the Past Logging: How Forest Structure Affects Different Facets of Understory Plant Diversity in Abandoned Coppice Forests. Diversity 2020, 12, 109. [Google Scholar] [CrossRef] [Green Version]
  9. Díaz, S.; Cabido, M. Vive la différence: Plant functional diversity matters to ecosystem processes. Trends Ecol. Evol. 2001, 16, 646–655.ED. [Google Scholar] [CrossRef]
  10. Mouchet, M.A.; Villéger, S.; Mason, N.W.; Mouillot, D. Functional diversity measures: An overview of their redundancy and their ability to discriminate community assembly rules. Funct. Ecol. 2010, 24, 867–876. [Google Scholar] [CrossRef]
  11. Elmqvist, T.; Folke, C.; Nyström, M.; Peterson, G.; Bengtsson, J.; Walker, B.; Norberg, J. Response diversity, ecosystem change, and resilience. Front. Ecol. Environ. 2003, 9, 488–494. [Google Scholar] [CrossRef]
  12. Mason, N.W.; De Bello, F. Functional diversity: A tool for answering challenging ecological questions. J. Veg. Sci. 2013, 24, 777–780. [Google Scholar] [CrossRef]
  13. Violle, C.; Navas, M.L.; Vile, D.; Kazakou, E.; Fortunel, C.; Hummel, I.; Garnier, E. Let the concept of trait be functional! Oikos 2007, 116, 882–892. [Google Scholar] [CrossRef]
  14. Díaz, S.; Kattge, J.; Cornelissen, J.H.; Wright, I.J.; Lavorel, S.; Dray, S.; Reu, B.; Kleyer, M.; Wirth, C.; Prentice, I.C.; et al. The global spectrum of plant form and function. Nature 2016, 529, 167–171. [Google Scholar] [CrossRef]
  15. Chelli, S.; Marignani, M.; Barni, E.; Petraglia, A.; Puglielli, G.; Wellstein, C.; Acosta, A.T.R.; Bolpagni, R.; Bragazza, L.; Campetella, G.; et al. Plant-environment interactions through a functional traits perspective: A review of Italian studies. Plant Biosyst. 2019, 153, 853–869. [Google Scholar] [CrossRef]
  16. Bricca, A.; Tardella, F.M.; Tolu, F.; Goia, I.; Ferrara, A.; Catorci, A. Disentangling the effects of disturbance from those of dominant tall grass features in driving the functional variation of restored grassland in a Sub-Mediterranean context. Diversity 2020, 12, 11. [Google Scholar] [CrossRef] [Green Version]
  17. Boonman, C.C.F.; Santini, L.; Robroek, B.J.M.; Hoeks, S.; Kelderman, S.; Dengler, J.; Bergamini, A.; Biurrun, I.; Carranza, M.L.; Cerabolini, B.E.L.; et al. Plant functional and taxonomic diversity in European grasslands along climatic gradients. J. Veg. Sci. 2021, 32, e13027. [Google Scholar] [CrossRef]
  18. Botta-Dukát, Z.; Czúcz, B. Testing the ability of functional diversity indices to detect trait convergence and divergence using individual-based simulation. Methods Ecol. Evol. 2016, 7, 114–126. [Google Scholar] [CrossRef]
  19. MacArthur, R.; Levins, R. The limiting similarity, convergence, and divergence of coexisting species. Am. Nat. 1967, 101, 377–385. [Google Scholar] [CrossRef]
  20. Petchey, O.L.; Evans, K.L.; Fishburn, I.S.; Gaston, K.J. Low functional diversity and no redundancy in British avian assemblages. J. Anim. Ecol. 2007, 76, 977–985. [Google Scholar] [CrossRef]
  21. Cowling, R.M.; Esler, K.J.; Midgley, G.F.; Honig, M.A. Plant functional diversity, species diversity and climate in arid and semi-arid southern Africa. J. Arid. Environ. 1994, 27, 141–158. [Google Scholar] [CrossRef]
  22. Way, D.A.; Oren, R. Differential responses to changes in growth temperature between trees from different functional groups and biomes: A review and synthesis of data. Tree Physiol. 2010, 30, 669–688. [Google Scholar] [CrossRef] [Green Version]
  23. Keddy, P.A. Assembly and response rules: Two goals for predictive community ecology. J. Veg. Sci. 1992, 3, 157–164. [Google Scholar] [CrossRef] [Green Version]
  24. Pontes, L.P.; Maire, V.; Schellberg, J.; Louault, F. Grass strategies and grassland community responses to environmental drivers: A review. Agron. Sustain. Dev. 2015, 35, 1297–1318. [Google Scholar] [CrossRef]
  25. Bruelheide, H.; Dengler, J.; Purschke, O.; Lenoir, J.; Jiménez-Alfaro, B.; Hennekens, S.M.; Botta-Dukát, Z.; Chytrý, M.; Field, R.; Jansen, F.; et al. Global trait–environment relationships of plant communities. Nat. Ecol. Evol. 2018, 2, 1906–1917. [Google Scholar] [CrossRef] [PubMed]
  26. Lamprecht, A.; Pauli, H.; Calzado, M.R.F.; Lorite, J.; Mesa, J.M.; Steinbauer, K.; Winkler, M. Changes in plant diversity in a water-limited and isolated high-mountain range (Sierra Nevada, Spain). Alp. Bot. 2021, 131, 27–39. [Google Scholar] [CrossRef]
  27. Rahbek, C. The role of spatial scale and the perception of large-scale species-richness patterns. Ecol. Lett. 2005, 8, 224–239. [Google Scholar] [CrossRef]
  28. Sanders, N.J.; Rahbek, C. The patterns and causes of elevational diversity gradients. Ecography 2012, 35, 1–3. [Google Scholar] [CrossRef]
  29. Pescador, D.S.; de Bello, F.; Valladares, F.; Escudero, A. Plant trait variation along an altitudinal gradient in mediterranean high mountain grasslands: Controlling the species turnover effect. PLoS ONE 2015, 10, e0118876. [Google Scholar] [CrossRef] [PubMed] [Green Version]
  30. Bricca, A.; Conti, L.; Tardella, M.F.; Catorci, A.; Iocchi, M.; Theurillat, J.P.; Cutini, M. Community assembly processes along a sub-Mediterranean elevation gradient: Analyzing the interdependence of trait community weighted mean and functional diversity. Plant Ecol. 2019, 220, 1139–1151. [Google Scholar] [CrossRef]
  31. Stanisci, A.; Bricca, A.; Calabrese, V.; Cutini, M.; Pauli, H.; Steinbauer, K.; Carranza, M.L. Functional composition and diversity of leaf traits in subalpine versus alpine vegetation in the Apennines. AoB Plants. 2020, 12, plaa004. [Google Scholar] [CrossRef] [Green Version]
  32. Debouk, H.; de Bello, F.; Sebastià, M.T. Functional trait changes, productivity shifts and vegetation stability in mountain grasslands during a short-term warming. PLoS ONE 2015, 10, e0141899. [Google Scholar] [CrossRef] [Green Version]
  33. Myers, N.; Mittermeier, R.A.; Mittermeier, C.G.; da Fonseca, G.A.B.; Ken, J. Biodiversity hotspots for conservation priorities. Nature 2000, 403, 853–858. [Google Scholar] [CrossRef]
  34. Winkler, M.; Lamprecht, A.; Steinbauer, K.; Hulber, K.; Theurillat, J.P.; Breiner, F.; Choler, P.; Ertl, S.; Girón, A.G.; Rossi, G.; et al. The rich sides of mountain summits—A pan-European view on aspect preferences of alpine plants. J. Biogeogr. 2016, 43, 2261–2273. [Google Scholar] [CrossRef]
  35. Rogora, M.; Frate, L.; Carranza, M.L.; Freppaz, M.; Stanisci, A.; Bertani, I.; Bottarin, R.; Brambilla, A.; Canullo, R.; Carbognani, M.; et al. Assessment of climate change effects on mountain ecosystems through a cross-site analysis in the Alps and Apennines. Sci. Total Environ. 2018, 624, 1429–1442. [Google Scholar] [CrossRef] [Green Version]
  36. Bravo, D.N.; Araújo, M.B.; Lasanta, T.; Moreno, J.I.L. Climate change in Mediterranean mountains during the 21st century. Ambio 2008, 37, 280–285. [Google Scholar] [CrossRef]
  37. Pauli, H.; Gottfried, M.; Dullinger, S.; Abdaladze, O.; Akhalkatsi, M.; Alonso, J.L.B.; Coldea, G.; Dick, J.; Erschbamer, B.; Calzado, R.F.; et al. Recent plant diversity changes on Europe’s mountain summits. Science 2012, 336, 353–355. [Google Scholar] [CrossRef] [PubMed] [Green Version]
  38. Frate, L.; Carranza, M.L.; Evangelista, A.; Stinca, A.; Schaminée, J.H.J.; Stanisci, A. Climate and land use change impacts on Mediterranean high-mountain vegetation in the Apennines since the 1950s. Plant Ecol. Divers. 2018, 11, 85–96. [Google Scholar] [CrossRef]
  39. Calabrese, V.; Carranza, M.L.; Evangelista, A.; Marchetti, M.; Stinca, A.; Stanisci, A. Long-Term Changes in the Composition, Ecology, and Structure of Pinus mugo Scrubs in the Apennines (Italy). Diversity 2018, 10, 70. [Google Scholar] [CrossRef] [Green Version]
  40. Naeem, S.; Duffy, J.E.; Zavaleta, E. The functions of biological diversity in an age of extinction. Science 2012, 336, 1401–1406. [Google Scholar] [CrossRef] [Green Version]
  41. Hanisch, M.; Schweiger, O.; Cord, A.F.; Volk, M.; Knapp, S. Plant functional traits shape multiple ecosystem services, their trade-offs and synergies in grasslands. J. Appl. Ecol. 2020, 57, 1535–1550. [Google Scholar] [CrossRef]
  42. Stanisci, A.; Carranza, M.L.; Pelino, G.; Chiarucci, A. Assessing the diversity pattern of cryophilous plant species in high elevation habitats. Plant Ecol. 2011, 212, 595–600. [Google Scholar] [CrossRef]
  43. Blasi, C.; Di Pietro, R.; Fortini, P.; Catonica, C. The main plant community types of the alpine belt of the Apennine chain. Plant Biosyst. 2003, 137, 83–110. [Google Scholar] [CrossRef]
  44. Blasi, C.; Di Pietro, R.; Pelino, G. The vegetation of alpine belt karst-tectonic basins in the central Apennines (Italy). Plant Biosyst. 2005, 139, 357–385. [Google Scholar] [CrossRef]
  45. Evangelista, A.; Frate, L.; Carranza, M.L.; Pelino, G.; Attore, F.; Stanisci, A. Long-term changes in ecology and structure of high-mountain vegetation: An insight into LTER Apennines research site (Majella-Italy). AoB Plants 2016, 8, plw004. [Google Scholar] [CrossRef] [PubMed] [Green Version]
  46. Di Musciano, M.; Carranza, M.L.; Frate, L.; Di Cecco, V.; Di Martino, L.; Frattaroli, A.R.; Stanisci, A. Distribution of plant species and dispersal traits along environmental gradients in central Mediterranean summits. Diversity 2018, 10, 58. [Google Scholar] [CrossRef] [Green Version]
  47. Ellenberg, H. Zeigerwerte von pflanzen in Mitteleuropa. Scr. Geobot. 1991, 18, 1–248. [Google Scholar]
  48. European Commission DG Environment. Interpretation Manual of European Union Habitats. [Eur 28. Nature ENV B.3]. 2013. Available online: http://ec.europa.eu/environment/nature/legislation/habitatsdirective/docs/Int_Manual_EU28.pdf (accessed on 26 June 2019).
  49. Stanisci, A.; Pelino, G.; Blasi, C. Vascular plant diversity and climate change in the alpine belt of the central Apennines (Italy). Biodivers. Conserv. 2005, 14, 1301–1318. [Google Scholar] [CrossRef]
  50. Peruzzi, L.; Conti, F.; Bartolucci, F. An inventory of vascular plants endemic to Italy. Phytotaxa 2014, 168, 1–75. [Google Scholar] [CrossRef]
  51. Theurillat, J.P.; Iocchi, M.; Cutini, M.; De Marco, G. Vascular plant richness along an elevation gradient at Monte Velino (Central Apennines, Italy). Biogeographia 2011, 28, 149–166. [Google Scholar] [CrossRef] [Green Version]
  52. Petriccione, B.; Bricca, A. Thirty years of ecological research at the Gran Sasso d’Italia LTER site: Climate change in action. Nat. Conserv. 2019, 34, 9–39. [Google Scholar] [CrossRef]
  53. Cutini, M.; Flavio, M.; Giuliana, B.; Guido, R.; Jean-Paul, T. Bioclimatic pattern in a Mediterranean mountain area: Assessment from a classification approach on a regional scale. Int. J. Biometeorol. 2021, 65, 1085–1097. [Google Scholar] [CrossRef]
  54. Curci, G.; Guijarro, J.A.; Di Antonio, L.; Di Bacco, M.; Di Lena, B.; Scorzini, A.R. Building a local climate reference dataset: Application to the Abruzzo region (Central Italy), 1930–2019. Int. J. Climatol. 2021, 41, 4414–4436. [Google Scholar] [CrossRef]
  55. Pignatti, S.; Menegoni, P.; Pietrosanti, S. Bioindicazione attraverso le piante vascolari. Valori Di Indicazione Secondo Ellenberg (Zeigerwerte) per Le Specie Della Flora d’Italia. Braun-Blanquetia 2005, 39, 1–97. [Google Scholar]
  56. Stanisci, A.; Evangelista, A.; Frate, L.; Stinca, A.; Carranza, M.L. VIOLA—Database of High Mountain Vegetation of Central Apennines. Phytocoenologia 2016, 46, 231–232. [Google Scholar] [CrossRef]
  57. Chytrý, M.; Hennekens, S.M.; Jiménez-Alfaro, B.; Knollová, I.; Dengler, J.; Jansen, F.; Landucci, F.; Schaminée, J.H.; Aćić, S.; Agrillo, E.; et al. European Vegetation Archive (EVA): An integrated database of European vegetation plots. Appl. Veg. Sci. 2016, 19, 173–180. [Google Scholar] [CrossRef] [Green Version]
  58. Biondi, E.; Blasi, C.; Burrascano, S.; Casavecchia, S.; Copiz, R.; Del Vico, E.; Galdenzi, D.; Gigante, D.; Lasen, C.; Spampinato, G.; et al. Italian Interpretation Manual of the 92/43/EEC Directive Habitats. 2009. Available online: http://vnr.unipg.it/habitat/index.jsp (accessed on 6 September 2021).
  59. Biondi, E.; Blasi, C.; Allegrezza, M.; Anzellotti, I.; Azzella, M.; Carli, E.; Casavecchia, S.; Copiz, R.; Del Vico, E.; Facioni, L.; et al. Plant communities of Italy: The Vegetation Prodrome. Plant Biosyst. 2014, 148, 728–814. [Google Scholar] [CrossRef] [Green Version]
  60. Pignatti, S. Flora D’Italia; Edagricole New Business Multimedia: Milano, Italy, 2019. [Google Scholar]
  61. Májeková, M.; Paal, T.; Plowman, N.S.; Bryndová, M.; Kasari, L.; Norberg, A.; Weiss, M.; Bishop, T.R.; Luke, S.H.; Sam, K.; et al. Evaluating functional diversity: Missing trait data and the importance of species abundance structure and data transformation. PLoS ONE 2016, 11, e0149270. [Google Scholar] [CrossRef] [PubMed]
  62. Pérez-Harguindeguy, N.; Díaz, S.; Garnier, E.; Lavorel, S.; Poorter, H.; Jaureguiberry, P.; Bret-Harte, M.S.; Cornwell, W.K.; Craine, J.M.; Gurvich, D.E.; et al. Corrigendum to: New handbook for standardised measurement of plant functional traits worldwide. Aust. J. Bot. 2016, 64, 715–716. [Google Scholar] [CrossRef] [Green Version]
  63. Zanzottera, M.; Fratte, M.D.; Caccianiga, M.; Pierce, S.; Cerabolini, B.E. Community-level variation in plant functional traits and ecological strategies shapes habitat structure along succession gradients in alpine environment. Community Ecol. 2020, 21, 55–65. [Google Scholar] [CrossRef]
  64. Rosbakh, S.; Römermann, C.; Poschlod, P. Specific leaf area correlates with temperature: New evidence of trait variation at the population, species and community levels. Alp. Bot. 2015, 125, 79–86. [Google Scholar] [CrossRef]
  65. Dufrêne, M.; Legendre, P. Species assemblages and indicator species: The need for a flexible asymmetrical approach. Ecol. Monogr. 1997, 67, 345–366. [Google Scholar] [CrossRef]
  66. Ricotta, C.; de Bello, F.; Moretti, M.; Caccianiga, M.; Cerabolini, B.E.; Pavoine, S. Measuring the functional redundancy of biological communities: A quantitative guide. Methods Ecol. Evol. 2016, 7, 1386–1395. [Google Scholar] [CrossRef] [Green Version]
  67. de Cáceres, M.; Legendre, P.; Wiser, S.K.; Brotons, L. Using species combinations in indicator value analyses. Methods Ecol. Evol. 2012, 3, 973–982. [Google Scholar] [CrossRef]
  68. Pavoine, S.; Vallet, J.; Dufour, A.B.; Gachet, S.; Daniel, H. On the challenge of treating various types of variables: Application for improving the measurement of functional diversity. Oikos 2009, 118, 391–402. [Google Scholar] [CrossRef]
  69. Rao, C.R. Diversity and dissimilarity coefficients: A unified approach. Theor. Popul. Biol. 1982, 21, 24–43. [Google Scholar] [CrossRef]
  70. de Bello, F.; Lavergne, S.; Meynard, C.N.; Lepš, J.; Thuiller, W. The partitioning of diversity: Showing Theseus a way out of the labyrinth. J. Veg. Sci. 2010, 21, 992–1000. [Google Scholar] [CrossRef]
  71. Yandell, B.S. Practical Data Analysis for Designed Experiments; Chapman and Hall Press: London, UK, 1997. [Google Scholar]
  72. Zuur, A.F.; Ieno, E.N.; Elphick, C.S. A protocol for data exploration to avoid common statistical problems. Methods Ecol. Evol. 2010, 1, 3–14. [Google Scholar] [CrossRef]
  73. Körner, C. Alpine Plant Life, 2nd ed.; Springer: Berlin, Germany, 2003. [Google Scholar]
  74. Galland, T.; Carmona, C.P.; Götzenberger, L.; Valencia, E.; de Bello, F. Are redundancy indices redundant? An evaluation based on parameterized simulations. Ecol. Indic. 2020, 116, 106488. [Google Scholar] [CrossRef]
  75. Weiher, E.; Keddy, P.A. Assembly rules, null models, and trait dispersion: New questions from old patterns. Oikos 1995, 74, 159–164. [Google Scholar] [CrossRef] [Green Version]
  76. de Bello, F.D.; Lavorel, S.; Lavergne, S.; Albert, C.H.; Boulangeat, I.; Mazel, F.; Thuiller, W. Hierarchical effects of environmental filters on the functional structure of plant communities: A case study in the French Alps. Ecography 2013, 36, 393–402. [Google Scholar] [CrossRef]
  77. Di Biase, L.; Fattorini, S.; Cutini, M.; Bricca, A. The Role of Inter-and Intraspecific Variations in Grassland Plant Functional Traits along an Elevational Gradient in a Mediterranean Mountain Area. Plants 2021, 10, 359. [Google Scholar] [CrossRef] [PubMed]
  78. Körner, C. Plant adaptation to cold climates. F1000Research 2016, 5, 2769. [Google Scholar] [CrossRef] [PubMed]
  79. Dainese, M.; Scotton, M.; Clementel, F.; Pecile, A.; Lepš, J. Do climate, resource availability, and grazing pressure filter floristic composition and functioning in Alpine pastures? Community Ecol. 2012, 13, 45–54. [Google Scholar] [CrossRef]
  80. Di Pietro, R.; Proietti, S.; Fortini, P.; Blasi, C. La vegetazione dei ghiaioni nel settore sud-orientale del Parco Nazionale d’Abruzzo, Lazio e Molise. Fitosociologia 2004, 41, 3–20. [Google Scholar]
  81. Choler, P. Consistent shifts in alpine plant traits along a mesotopographical gradient. Arct. Antarct. Alp. Res. 2005, 37, 444–453. [Google Scholar] [CrossRef] [Green Version]
  82. Winkler, D.E.; Lubetkin, K.C.; Carrell, A.A.; Jabis, M.D.; Yang, Y.; Kueppers, L.M. Responses of alpine plant communities to climate warming. In Ecosystem Consequences of Soil Warming; Mohan, J.E., Ed.; Academic Press: Athens, GA, USA, 2019; pp. 297–346. [Google Scholar]
  83. Lovari, S.; Franceschi, S.; Chiatante, G.; Fattorini, L.; Fattorini, N.; Ferretti, F. Climatic changes and the fate of mountain herbivores. Clim. Chang. 2020, 162, 2319–2337. [Google Scholar] [CrossRef]
  84. Olano, J.M.; Almería, I.; Eugenio, M.; von Arx, G. Under pressure: How a M editerranean high-mountain forb coordinates growth and hydraulic xylem anatomy in response to temperature and water constraints. Funct. Ecol. 2013, 27, 1295–1303. [Google Scholar] [CrossRef]
  85. Garnier, E.; Vile, D.; Roumet, C.; Lavorel, S.; Grigulis, K.; Navas, M.L.; Lloret, F. Inter-and intra-specific trait shifts among sites differing in drought conditions at the north western edge of the Mediterranean Region. Flora 2019, 254, 147–160. [Google Scholar] [CrossRef]
  86. Angeler, D.G.; Allen, C.R. Quantifying resilience. J. Appl. Ecol. 2016, 53, 617–624. [Google Scholar] [CrossRef]
  87. Ricotta, C.; Moretti, M. CWM and Rao’s quadratic diversity: A unified framework for functional ecology. Oecologia 2011, 167, 181–188. [Google Scholar] [CrossRef]
  88. Zelený, D. Which results of the standard test for community-weighted mean approach are too optimistic? J. Veg. Sci. 2018, 29, 953–966. [Google Scholar] [CrossRef]
  89. Zelený, D. R Package; Version 0.1.18; Weighted Mean Analysis: Weimea, HI, USA, 2020. [Google Scholar]
Figure 1. Boxplots comparing the analyzed plant communities in terms of standardized effect size functional diversity (SES-FD) for: (a) plant height (SES-FDH), (b) specific leaf area (SES-FDSLA) and (c) leaf dry matter content (SES-FDLDMC) (A: Leucopoa dimorpha community, B: Sesleria juncifolia community, C: Plantago atrata community, D: Silene acaulis community). Boxplot letters indicate statistically significant differences among communities after Tukey’s post hoc test (p < 0.05).
Diversity 13 00466 g001
Figure 2. Boxplots comparing functional redundancy values (FR) of the analyzed plant communities (A: Leucopoa dimorpha community, B: Sesleria juncifolia community, C: Plantago atrata community, D: Silene acaulis community) for: (a) plant height (FRH), (b) specific leaf area (FRSLA) and (c) leaf dry matter content (FRLDMC). Boxplots with different letters indicate statistically significant differences (Tukey’s post hoc test; p < 0.05).
Diversity 13 00466 g002
Table 1. Brief description of the analyzed plant communities (A: Leucopoa dimorpha community, B: Sesleria juncifolia community, C: Plantago atrata community, D: Silene acaulis community) occurring in the different land units (according to Stanisci et al. [42]) in terms of taxonomic diversity (species diversity reported as 1-Simpson), community mean for Ellenberg indicator values (CMEIVs) for Italian flora [55] calculated with presence/absence species data (L, light; T, temperature; U, soil moisture; R, soil reaction; N, soil nutrients) and local environmental features registered at plot level. Mean plot values along with standard deviation (in brackets) are reported.
A—Leucopoa dimorpha CommunityB—Sesleria juncifolia CommunityC—Plantago atrata CommunityD—Silene acaulis Community
Land unit ScreesSteep slopesSnowbedsRidges
Taxonomic diversitySpecies richness11 (6)20 (5)18 (6)17 (7)
Species diversity0.61 (0.25)0.8 (0.07)0.77 (0.09)0.77 (0.17)
Community Mean Ellenberg indicator values (CMEIVS)CML8.7 (0.9)9.0 (0.3)8.4 (0.3)9.1 (0.3)
CMT4.0 (0.9)4.2 (0.8)3.2 (0.3)3.2 (0.3)
CMU3.5 (0.5)3.2 (0.2)3.9 (0.3)3.5 (0.3)
CMR6.9 (0.5)6.8 (0.4)6.5 (0.4)6.9 (0.4)
CMN2.3 (0.6)2.3 (0.2)2.5 (0.4)2.1 (0.3)
Environmental variablesElevation (m a.s.l)2266 (307)2085 (264)2392 (158)2547 (165)
Slope (°)32.5 (10)20.4 (10)9.9 (12)17.9 (16)
Table 2. List of community indicator species for each plant community derived from ISA analysis. For each taxon, we report the indicator value (IndVal) and the species-level redundancy value for each trait (rH: plant height; rSLA: specific leaf area; rLDMC: leaf dry matter content). Statistical significance of indicator values is also reported (n.s. p > 0.05; * p < 0.05; ** p < 0.01; *** p < 0.001).
Plant CommunityIndValrHrSLArLDMC
A. Leucopoa dimorpha community
Achillea barrelieri subsp. barrelieri0.43 ***0.86 0.790.64
Arabis caucasica0.51 ***0.860.900.76
+ Cymbalaria pallida0.63 ***0.630.810.67
Doronicum columnae0.58 ***0.740.790.66
+ Isatis apennina0.69 ***0.740.870.64
+ Leucopoa dimorpha0.69 ***0.680.730.52
B. Sesleria juncifolia community
Anthyllis montana0.80 ***0.800.920.86
Aster alpinus subsp. alpinus0.44 *0.830.870.84
Bromopsis erecta0.54 ***0.650.910.79
Carex humilis0.76 ***0.820.920.88
Globularia meridionalis0.79 ***0.650.880.86
Sesleria juncifolia subsp. juncifolia0.95 ***0.730.920.83
C. Plantago atrata community
Crepis aurea subsp. glabrescens0.71 ***0.870.650.65
Gnaphalium diminutum0.94 ***0.810.820.79
Plantago atrata subsp. atrata0.96 ***0.850.750.78
Poa alpina subsp. alpine0.96 ***0.880.800.67
+ Ranunculus pollinensis0.92 ***0.870.790.79
+ Taraxacum apenninum0.70 ***0.810.720.70
+ Taraxacum glaciale0.66 ***0.870.580.64
+ Trifolium pratense subsp. semipurpureum0.76 ***0.880.720.82
Trifolium thalii0.98 ***0.760.820.75
D. Silene acaulis community
+ Androsace villosa subsp. villosa0.55 **0.800.870.85
Anthyllis vulneraria subsp. pulchella0.68 ***0.840.920.68
Arenaria grandiflora subsp. grandiflora0.57 ***0.830.900.84
+ Armeria gracilis subsp. majellensis0.67 ***0.760.760.76
+ Festuca violacea subsp. italica0.50 *0.820.920.83
+ Galium magellense0.57 **0.870.690.78
Kobresia myosuroides0.52 ***0.780.910.75
+ Pedicularis elegans0.54 **0.860.840.84
Salix retusa0.80 ***0.830.880.82
Silene acaulis subsp. bryoides0.76 ***0.690.920.84
+ Endemic taxon.
Table 3. Results of the two-tailed t-test assessing the standardized effect size of functional diversity per trait (SES-FDH: plant height; SES-FDSLA: specific leaf area; SES-FDLDMC: leaf dry matter content) and plant community (A: Leucopoa dimorpha community, B: Sesleria juncifolia community, C: Plantago atrata community, D: Silene acaulis community). Statistical significance of t-test is also reported (n.s. p > 0.05; * p < 0.05; ** p < 0.01; *** p < 0.001).
TraitsABCD
SES-FDH0.35 n.s.0.25 **−0.49 ***−0.3 *
SES-FDSLA−0.08 n.s.−1.35 ***0.29 *−1.1 ***
SES-FDLDMC0.17 n.s.−1.2 ***−0.41 ***−1 ***
Publisher’s Note: MDPI stays neutral with regard to jurisdictional claims in published maps and institutional affiliations.

