
Spatial Genetic Structure of Prunus mongolica in Arid Northwestern China Based on RAD Sequencing Data


1
State Key Laboratory of Desert and Oasis Ecology, Xinjiang Institute of Ecology and Geography, Chinese Academy of Sciences, Urumqi 830011, China
2
The Specimen Museum of Xinjiang Institute of Ecology and Geography, Chinese Academy of Sciences, Urumqi 830011, China
3
University of Chinese Academy of Sciences, Beijing 100049, China
*
Author to whom correspondence should be addressed.
Diversity 2021, 13(8), 397; https://doi.org/10.3390/d13080397
Submission received: 9 July 2021
/
Revised: 20 August 2021
/
Accepted: 22 August 2021
/
Published: 23 August 2021
(This article belongs to the Special Issue Conservation Genetics and Biogeography of Seed Plant Species)
Abstract
:The extensive range of sand deserts, gravel deserts, and recent human activities have shaped habitat fragmentation of relict and endangered plants in arid northwestern China. Prunus mongolica is a relict and endangered shrub that is mainly distributed in the study area. In the present study, population genomics was integrated with a species distribution model (SDM) to investigate the spatial genetic diversity and structure of P. mongolica populations in response to habitat fragmentation and create a proposal for the conservation of this endangered species. The results showed that the northern marginal populations were the first isolated from other populations. The SDM suggested that these marginal populations had low levels of habitat suitability during the glacial period. They could not obtain migration corridors, and thus possessed low levels of gene flow connection with other populations. Additionally, several populations underwent secondarily geographical isolation from other central populations, which preserved particular genetic lineages. Genetic diversity was higher in southern populations than in northern ones. It was concluded that long-term geographical isolation after historical habitat fragmentation promoted the divergence of marginal populations and refugial populations along mountains from other populations. The southern populations could have persisted in their distribution ranges and harbored higher levels of genetic diversity than the northern populations, whose distribution ranges fluctuated in response to paleoclimatic changes. We propose that the marginal populations of P. mongolica should be well considered in conservation management.
1. Introduction
Plant species are especially crucial to the maintenance and stability of arid land ecosystems. In arid northwestern China, shrubs are edifiers that adapt to the habitats of sand and gravel deserts. The effect of long-term aridification processes has accommodated a few relict shrubs, such as Prunus mongolica, Tetraena mongolica, Ammopiptanthus mongolicus, Gymnocarpos przewalskii, and Helianthemum songaricum. At present, most of them are also categorized as endangered plants. The genetic structures of these relict plants were investigated to improve conservation management [1,2,3]. Habitat fragmentation is considered to be the main driving force in shaping the spatial genetic structure of these relict and endangered shrubs in arid northwestern China [2,3,4,5].
Two types of habitat fragmentation affected the relict and endangered plants in arid northwestern China. The first was promoted by the ancient development of extensive ranges of sand and gravel deserts following the enhancing aridification of the Asian interior. In response to the retreat of Tethys and the uplift of the Qinghai–Tibet Plateau and its surrounding high mountains, the initiation of aridity began in the study area [6]. This region underwent increasing aridity and experienced the onset of desert conditions during the late Miocene, but extensive deserts in the study area also occurred during the Pleistocene [6,7]. The second fragmentation type was caused by recent human activities such as urban sprawl, industrial development, coal mining, and livestock grazing [8], which may have resulted in habitat loss and the fragmentation of these endangered plants. These relict and endangered plants usually survive and are distributed in narrow ranges. Thus far, the effect of fragmented habitats on the genetic structures of relict and endangered plants in arid northwestern China remains unclear. This basic information is significant if we are to understand the evolutionary history of—and make effective conservation managements for—these endangered shrubs.
Endangered P. mongolica is a shrub of 1–2 meters in height and is mainly distributed in arid northwestern China (Figure 1). The habitats of this plant are sand deserts, gravel deserts, desert grasslands, and dry river beds. At present, it has fragmented distributions surrounding several deserts in the study area, such as the Tengger Desert, Maowusu Desert, Ulan Buh Desert, and Kubuqi Desert (Figure 1). This arid region is characterized by annual rainfalls of 150–180 mm and the mean annual temperature is 8–9 °C [9]. It is also one of the most important livestock production areas in China. The breeding system of P. mongolica was determined to be entomophily and outcrossing [10]. Previous study indicated P. mongolica shared a close phylogenetic relationship with P. tangutica and P. davidiana based on complete chloroplast genome sequences [11]. However, these species are significantly different at distribution range and habitat characteristics. P. mongolica distributes in arid desert or desert grasslands, while these two closely related species grow in humid forests and shrub slopes. Due to its narrow distribution and recent habitat loss, P. mongolica is recorded as the second conservation level in the China Plant Red Data Book [12]. The spatial genetic pattern of P. mongolica was also previously investigated using cpDNA sequences. The cpDNA markers revealed the genetic character from the maternal inheritance of seed-mediated gene flows. It suggested an east–west split of haplotypes for this species [13,14]. However, the effects of habitat fragmentation on population genetic structure remain mostly unclear.
In this study, we employed RAD sequencing technology [15] and generated genome-wide SNP data for P. mongolica populations across nearly its full range. The genome-wide SNPs were proven to have a strong ability to distinguish between population structures and interpret evolutionary history for organisms [16,17]. This method has been frequently used in molecular phylogeography and conservation genetics [18]. Based on the sampling strategy and molecular approaches, the aims of our study were to: (1) clarify the spatial genetic diversity and structure of P. mongolica populations in response to habitat fragmentation, (2) make a proposal to maintain the genetic integrity of this endangered species for conservation. The present study provides important guidelines for the conservation management of P. mongolica germplasm and conservation implications for endangered plants in arid northwestern China.
2. Materials and Methods
2.1. Plant Collection and DNA Extraction
A total of 97 individuals from 10 populations across the full distribution range of P. mongolica were sampled and sequenced to generate genome-wide SNPs (Figure 1, Table S1). This species does not reproduce vegetatively by root suckers. We sampled neighboring individuals at least 5 m apart within each population. Sampling was carried out according to the size of the populations, with 10 to 15 individuals sampled for large populations. For several small populations, we tried to collect as many individuals as possible. We collected leaf materials for each of the 97 sampled individuals from the field. Then, they were dried and stored with silica gel in the laboratory. Total genomic DNA was extracted using the DNeasy Plant Mini Kit (Qiagen, Hilden, Germany) following the manufacturer’s instructions.
2.2. RAD Sequencing and SNP Calling
Libraries from genomic DNA of each of the 97 individuals were constructed through RAD-seq methodology [19] at Novogene Co. Ltd. in Beijing, China. First, the genomic DNA was digested with high-fidelity restriction enzymes. Then, libraries were created by uniquely barcoding each of the individuals from each respective site and pooling barcoded individuals. The libraries were then pooled for polymerase chain reactions (PCRs) and the PCR products were purified. Finally, the sequencing was performed with an Illumina Hiseq PE150 platform.
Raw reads were filtered for quality control under the following criteria: adapter reads were initially filtered out, paired reads were discarded if the number of Ns in either read exceeded 10%, and the number of low quality (Q ≤ 5) bases in a single read was restricted to less than 50%. Clean reads from the sequenced samples were mapped to the reference genome of Prunus dulcis (https://www.rosaceae.org/organism/Prunus/dulcis accessed on 22 March 2021) using BWA software with the parameters “mem -t 4 -k 32 –M” [20]. After alignment, SNPs were called using SAMtools [21]. The output of SNPs was further filtered under the parameters “dp7-miss0.1-maf0.05”. These thresholds were used to clean the low-quality SNPs with complete degree < 0.1, coverage depth < 7, and rare SNPs filter of MAF < 0.05. To reduce the bias of linkage disequilibrium (LD), SNPs in strong LD (pairwise genotype correlation r2 > 0.2) were excluded using PLINK [22] in a window of 50 SNPs (sliding window overlap: 10 SNPs at a time). The final dataset contained 8328 SNPs. Next, the dataset of high-quality unlinked SNPs was used for the following analysis.
2.3. Genetic Structure Analyses
First, the population structure of sampled individuals was clustered using the program ADMIXTURE ver. 1.3.0 [23]. This program infers the ancestry of the sampled individuals based on large SNP genotype datasets using a block relaxation algorithm. While using ADMIXTURE, a defined K value was needed that indicated the number of ancestral populations. For each K value, a cross-validation (CV) error was exhibited during the calculation. The K value was set ranging from 1 to 8 when running the program. Here, we employed two iterations of ADMIXTURE. The first was conducted for all individuals from ten populations. Three populations (P1, P4, and P5) were independent from other populations (see results). The second was conducted for the remaining seven populations to investigate the deep-level population structure.
Next, the PCA was calculated for the 97 individuals using the GCTA ver. 1.93.2 program [24]. Finally, a neighbor-joining (NJ) phylogenetic tree of 97 individuals from 10 populations was constructed using the program MEGA-X ver. 10.1.8 [25] based on the genetic distance matrix. The node supports were assessed through bootstrap resampling (BP) with 1000 repetitions. Meanwhile, nucleotide diversity (π) was computed using the software ARLEQUIN ver. 3.5.2.2 [26] for the ten populations. Two other indexes of genetic diversity, including observed heterozygosity (Ho) and expected heterozygosity (He), were estimated using the software PLINK [22]. To describe the spatial pattern of genetic diversity across the distribution range, a landscape map of genetic variation was generated based on the values of nucleotide diversity (π) for each population using the Genetic Landscapes GIS Toolbox [27] in ArcGIS 10.2 (ESRI, Redlands, CA, USA).
2.4. Species Distribution Model and Potential Migration Corridors
Present-day occurrence locations of P. mongolica were acquired from our field surveys and previous publications [13,14]. A total of 19 P. mongolica occurrence points were used in the species distribution modeling (SDM) analyses. To establish the SDMs, we initially downloaded 19 bioclimatic variables at a resolution of 2.5 arcmin from the PaleoClim Database (http://www.paleoclim.org/, accessed on 22 March 2021; [28]). To avoid model overfitting, we calculated the correlation coefficients of these 19 bioclimatic variables and retained the least correlated variables (Spearman’s < 0.8). At last, seven remaining bioclimatic variables were used in the SDMs to model the potential distributions of this species. The last glacial maximum (LGM) distribution of this species was also modeled with the seven corresponding LGM bioclimatic variables under the Community Climate System Model version 4 (CCSM4 model), at a resolution of 2.5 arcmin, which were downloaded from the PaleoClim Database (http://www.paleoclim.org/ accessed on 22 March 2021; [28]). We generated present-day and LGM potential distributions of P. mongolica using the maximum entropy approach as implemented in MAXENT, version 3.3.3k [29]. The location data were randomly set to 75% for training and 25% for model testing, respectively. Model performance was evaluated by the area under the receiver operating characteristic curve (AUC) of a receiver operating characteristic plot.
Based on the generated layers of potential distributions, we inferred the potential migration corridors of P. mongolica in the present and LGM periods by the least-cost path (LCP) analysis using SDMtoolbox 2.0 (reference). First, the resistance layers of P. mongolica were created through inverting the generated layers of potential distributions (1-SDM habitat suitability value) during the present and LGM periods. Second, a cost distance raster for each sample locality was generated according to dispersal cost layer (resistance layer). Then, the corridor layers were established between every pair of localities based on the cost distance raster. Finally, all of the pairwise corridor layers were summed as the eventual dispersal corridor for P. mongolica [30]. To assess the effect of habitat suitability on P. mongolica genetic diversity at the population level, we computed correlation coefficients between indexes of population genetic diversity (π, Ho and He) and current/LGM suitability values using SPSS 17.0 (IBM, Almond, NY, USA).
3. Results
According to the generated sequences of 97 P. mongolica individuals, the GC content of these individuals was about 37%. The numbers of mapped reads for each individual ranged from 5,895,000 to 18,359,186. The mapping rate ranged from 36.17% to 93.47%. The average depth of sequencing was from 13.36× to 31.06×. At last, 8328 high-integrity unlinked SNPs were used in the following analyses.
When employing ADMIXTURE for the dataset of all 10 populations, decreasing trends of the CV error values were shown when the K values changed from 1 to 8. According to genetic clustering of these 97 individuals, the P1, P4 and P5 populations were independent and isolated from other populations when the K value was 4 (Figure 1b). Clear population structure was not obtained when the K value was set larger than 4. When investigating the population structure for the remaining seven populations, the lowest CV error values were shown when the K value was 5. According to the obtained clustering, four independent clusters were shown in five individuals of the P7 population, four individuals of the P10 population, five individuals of the P8 population, and four individuals of the P8 population, respectively (Figure 1c). The remaining individuals were grouped in the fourth cluster.
Similar to the ADMIXTURE clustering, the PCA analysis also showed that the populations of P1, P4, and P5 were independent and isolated from other populations in the three-dimensional coordinate axis (Figure 2a). For the remaining seven populations, the PCA analysis showed that several individuals from the populations of P7, P8, and P10 were isolated from other individuals (Figure 2b). Based on the pairwise genetic distances among these 97 individuals using the high-quality unlinked genomic SNPs dataset, an NJ phylogenetic tree was constructed (Figure 3). It showed that each of the ten populations was well-grouped and clustered in an independent clade. These ten clades were supported by high bootstrap values (Figure 3).
The values of nucleotide diversity (π), the average observed heterozygosity (Ho) and expected heterozygosity (He) for this species were 0.339 (±0.160), 0.378 (±0.187) and 0.350 (±0.128) (Table 1). Within each population, the values of nucleotide diversity (π) ranged from 0.216 (±0.105) to 0.336 (±0.167). The values of observed heterozygosity (Ho) ranged from 0.363 (±0.415) to 0.397 (±0.252), while expected heterozygosity (He) values ranged from 0.213 (±0.221) to 0.323 (±0.162). Based on the landscape maps of genetic variation (Figure 4), changes in genetic diversity decreased from southwest to northeast populations.
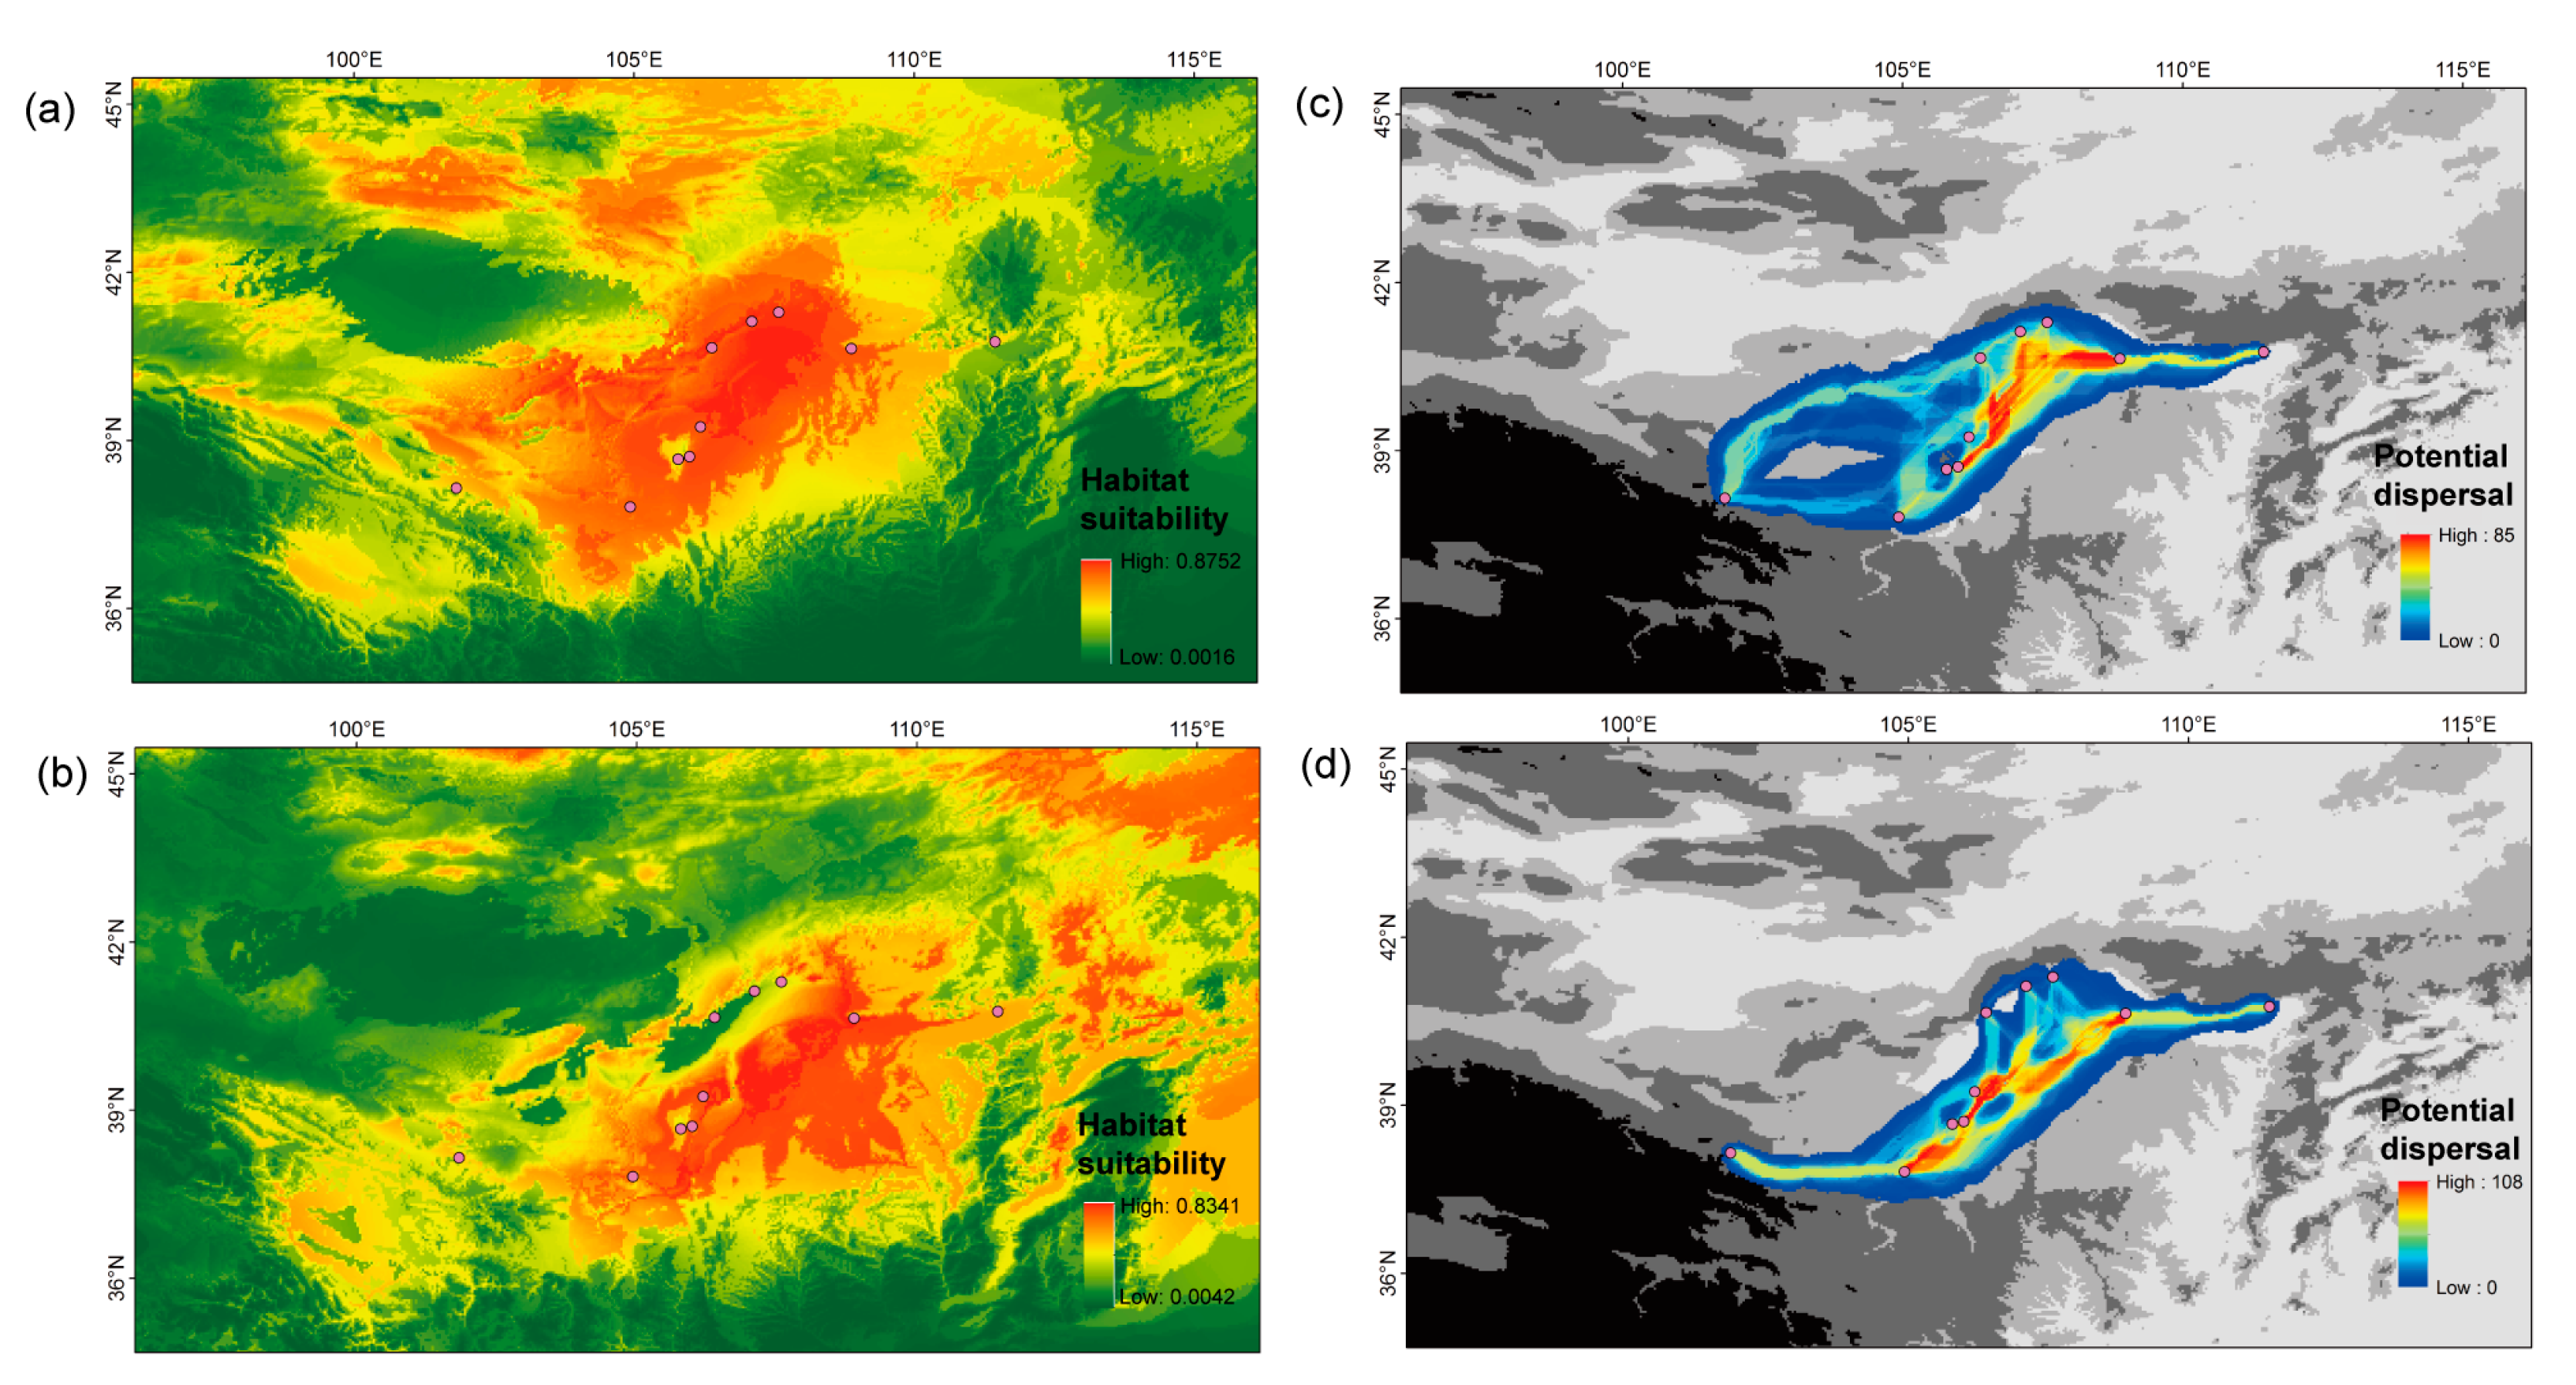
Present and LGM SDMs of P. mongolica were well performed, which was supported by the high AUC values of 0.998/0.997 for the training and test data. In comparison with the present distribution (Figure 5a,b), the LGM distribution shrunk significantly in marginal populations such as P4, P5, and P10. Based on the present and LGM modeling distributions, the potential migration corridors of P. mongolica existed among the central populations (Figure 5c,d). Especially during the LGM period, the northern marginal populations displayed a weak connection with the southern central populations. The nucleotide diversity (π) and expected heterozygosity (He) were not significant correlated with both current and LGM habitat suitability values for P. mongolica (p-value > 0.1). The observed heterozygosity (Ho) was significant correlated with current habitat suitability value (p-value = 0.043), but it was not significant correlated with LGM habitat suitability values (p-value > 0.1).
4. Discussion
4.1. Effect of Habitat Fragmentation on Population Structure of P. mongolica
With respect to population genetic diversity, we found that it was higher in southern populations than northern populations, based on genome-wide SNPs (Figure 4). Our results were consistent with the report on P. mongolica population genetic diversity based on cpDNA sequences [13]. SDM showed that these southern populations exhibited extensive suitable habitats for this species in both the present and glacial periods (Figure 5a,b). In contrast, the northern populations experienced fluctuations in distribution ranges. Thus, the southern populations could have persisted in their distribution ranges and harbored high levels of genetic diversity during the process of paleoclimatic change. This hypothesis was also supported by a few of species [31,32] that habitat stability was positively associated with population genetic diversity. However, the low levels of genetic diversity for northern populations were not the result of founder effects following interglacial recolonizations [33]. Our population genetic structure showed that the northern populations of P1, P4, and P5 had distinctly different genotypes from the southern populations. The low levels of genetic diversity for northern populations could have been caused by small effective population sizes in response to fluctuations in distribution ranges following paleoclimatic change.
In the present study, we found that the northern marginal populations of P1, P4, and P5 were the first isolated from other populations (Figure 1b and Figure 2a). Historically, northwestern China experienced long-term aridification in response to Cenozoic global cooling and the uplift of the Qinghai–Tibetan Plateau [34]. During the process of stepwise climatic drying, extensive ranges of sand and gravel deserts developed in the study area (Figure 1a) [6]. Due to the effects of geographical barriers, gene flow was blocked for these northern populations along the desert margins and due to long geographical distance from other populations. The SDM suggested that these three populations had low levels of habitat suitability during the glacial period (Figure 5b). They could easily have been isolated from other populations following the process of paleoclimatic change. From the modeling of migration corridors, P. mongolica was well-connected among the central populations along the southern margin (Figure 5). These northern marginal populations had low levels of opportunity for migration and gene flow connection with other populations. After long-term geographical isolation, they harbored particular genetic clades and persisted in independent locations. This is a different pattern of population structure for P. mongolica generated based on genome-wide SNPs. This pattern is consistent with the spatial genetic structure of Panzerina lanata in the same study area [35].
When the deep-level genetic structure of remaining P. mongolica populations was investigated, we found that several individuals within the populations of P7, P8, and P10 preserved particular genetic clades (Figure 1c and Figure 2b). The data suggested these three populations underwent secondarily geographical isolation from other central populations. Here, the populations of P7 and P8 were located at the foot of the Helan Mountains, which had served as refugia for a number of species in the study area [35,36,37]. The population of P10 was distributed in the west marginal area of these deserts, a long distance from other populations (Figure 1a). Additionally, this population was not supported by clear migration corridors connecting with central populations (Figure 5). The population of P10 could have been limited with respect to gene flow by geographical isolation. From the phylogenetic tree of all sampled individuals (Figure 3), each of ten populations formed a solid clade under high support values. In general, this genetic structure indicated a fragmented pattern among these P. mongolica populations.
4.2. Conservation Implications
P. mongolica is listed as a relict and endangered arid plant species in China [9]. This species is used as forage, in traditional medicine, and for sand fixation. P. mongolica struggles with natural regeneration due to the harsh habitat. In addition, this species experienced extensive habitat loss and decrease in population size in recent years [38,39]. Artificial reproduction was undertaken for afforestation and it was protected in several natural reserves. However, these natural reserves were established to protect special ecosystems in arid lands, such as mountainous forests or desert ecosystems. To maintain the evolutionary potential to overcome future environmental changes, it is crucial to preserve the integrity of the genetic structure of this species. Based on our obtained results, we propose several strategies for future protective actions.
On the one hand, the marginal populations of P. mongolica should be well-considered. The marginal populations of P1, P4, P5, and P10 harbor particular genetic lineages. These marginal populations preserve low levels of genetic diversity. SDM also suggested that the habitat suitability of these marginal populations could be sensitive to climatic changes. Thus, these marginal populations should be given conservation priority as they face the challenges of environmental changes. Additionally, ex situ conservation measures will be needed to preserve the gene pools of these marginal populations. On the other hand, genomic data and cpDNA data should be combined to fully understand the population genetic structure of P. mongolica. Here, we found different patterns of genetic structure among two sets of genetic data. However, the populations near the mountains (such as P4, P5, P7, and P8) preserve unique genetic resources for this species, based on both genomic data and cpDNA data [13].
5. Conclusions
The present study investigated population genetic structures and conservation strategies for a relict and endangered plant, P. mongolica, in arid northwestern China. Based on the obtained genome-wide SNPs, we found that long-term geographical isolation after historical habitat fragmentation had promoted the divergence of marginal populations and refugial populations along mountains from other populations. They harbored particular genetic lineages. We also found that the northern populations had experienced fluctuations in distribution ranges in response to paleoclimatic changes. The southern populations could have persisted in their distribution ranges and harbored higher levels of genetic diversity than the northern populations. Based on these results, we propose that the marginal populations of P. mongolica should be well considered in conservation management. Future studies should highlight the possible genetic mechanism of endangerment and the genetic basis of adaptability to environmental changes.
Supplementary Materials
The following are available online at https://www.mdpi.com/article/10.3390/d13080397/s1, Table S1: Summary statistics of RAD-seq data processed for each of 97 Prunus mongolica individuals.
Author Contributions
Conceptualization, H.-X.Z. and Z.-B.W.; methodology, H.-X.Z. and Q.W.; software, H.-X.Z.; validation, H.-X.Z. and Z.-B.W.; formal analysis, H.-X.Z.; investigation, H.-X.Z.; resources, H.-X.Z. and Z.-B.W.; data curation, H.-X.Z. and Q.W.; writing—original draft preparation, H.-X.Z. and Z.-B.W.; writing—review and editing, H.-X.Z., Q.W. and Z.-B.W.; visualization, H.-X.Z.; supervision, H.-X.Z. and Z.-B.W.; project administration, H.-X.Z.; funding acquisition, H.-X.Z. All authors have read and agreed to the published version of the manuscript.
Funding
This research was funded by the National Natural Science Foundation of China, grant numbers 31870323 and 32170391; and Youth Innovation Promotion Association of Chinese Academy of Sciences, grant number 2019428.
Institutional Review Board Statement
Not applicable.
Data Availability Statement
All RAD-seq data of P. mongolica were deposited in the NCBI database (SRA accession: PRJNA744318).
Conflicts of Interest
The authors declare no conflict of interest.
References
- Zhang, H.-X.; Li, X.-S.; Wang, J.-C.; Zhang, D.-Y. Insights into the aridification history of Central Asian Mountains and international conservation strategy from the endangered wild apple tree. J. Biogeogr. 2021, 48, 332–344. [Google Scholar] [CrossRef]
- Su, Z.; Pan, B.; Zhang, M.; Shi, W. Conservation genetics and geographic patterns of genetic variation of endangered shrub Ammopiptanthus (Fabaceae) in northwestern China. Conserv. Genet. 2016, 17, 485–496. [Google Scholar] [CrossRef]
- Cheng, J.; Kao, H.; Dong, S. Population genetic structure and gene flow of rare and endangered Tetraena mongolica Maxim. revealed by reduced representation sequencing. BMC Plant Biol. 2020, 20, 391. [Google Scholar] [CrossRef]
- Su, Z.; Richardson, B.A.; Zhuo, L.; Jiang, X. Divergent population genetic structure of the endangered Helianthemum (Cistaceae) and its implication to conservation in Northwestern China. Front. Plant Sci. 2017, 7, 2010. [Google Scholar] [CrossRef] [Green Version]
- Zhang, H.-X.; Wang, Q.; Jia, S.-W. Genomic phylogeography of Gymnocarpos przewalskii (Caryophyllaceae): Insights into habitat fragmentation in arid Northwestern China. Diversity 2020, 12, 335. [Google Scholar] [CrossRef]
- Yang, X.; Scuderi, L.; Paillou, P.; Liu, Z.; Li, H.; Ren, X. Quaternary environmental changes in the drylands of China—A critical review. Quat. Sci. Rev. 2011, 30, 3219–3233. [Google Scholar] [CrossRef]
- Guan, Q.; Pan, B.; Li, N.; Zhang, J.; Xue, L. Timing and significance of the initiation of present day deserts in the northeastern Hexi Corridor, China. Palaeogeogr. Palaeocl. 2011, 306, 70–74. [Google Scholar]
- Ma, S.M.; Nie, Y.B.; Duan, X.; Yu, C.S.; Wang, R.X. The potential distribution and population protection priority of Amygdalus mongolica. Acta Ecol. Sinica 2015, 35, 2960–2966. [Google Scholar]
- Zheng, Y. The Analysis about the Meteorological Elements in the Surrounding Area of Tengger Desert during the Recent 49a; Lanzhou University: Lanzhou, China, 2014. [Google Scholar]
- Ma, J. Reproductive Biology of Amygalus monogolica; Northwest University: Xi’an, China, 2010. [Google Scholar]
- Wang, W.; Yang, T.; Wang, H.-L.; Li, Z.-J.; Ni, J.-W.; Su, S.; Xu, X.-Q. Comparative and phylogenetic analyses of the complete chloroplast genomes of six Almond species (Prunus spp. L.). Sci. Rep. 2020, 10, 1–10. [Google Scholar] [CrossRef]
- Fu, L.G. China Plant. Red Data Book; Science Press: Beijing, China, 1992. [Google Scholar]
- Ma, S.M.; Nie, Y.B.; Jiang, X.L.; Xu, Z.; Ji, W.Q. Genetic structure of the endangered, relict shrub Amygdalus mongolica (Rosaceae) in arid northwest China. Aust. J. Bot. 2019, 67, 128–139. [Google Scholar] [CrossRef]
- Duan, Y.; Bai, C.; Duan, C.; Shen, Y. Molecular phylogeography of Amygdalus mongolica (Rosaceae) based on chloroplast DNA non-coding sequences. Acta Bot. Boreali-Occident. Sin. 2018, 38, 1625–1633. [Google Scholar]
- Davey, J.W.; Blaxter, M.L. RADSeq: Next-generation population genetics. Brief. Funct. Genom. 2010, 9, 416–423. [Google Scholar] [CrossRef]
- Emerson, K.J.; Merz, C.R.; Catchen, J.M.; Hohenlohe, P.A.; Cresko, W.A.; Bradshaw, W.E.; Holzapfel, C.M. Resolving postglacial phylogeography using high-throughput sequencing. Proc. Natl. Acad. Sci. USA 2010, 107, 16196–16200. [Google Scholar] [CrossRef] [Green Version]
- Uckele, K.A.; Adams, R.P.; Schwarzbach, A.E.; Parchman, T.L. Genome-wide RAD sequencing resolves the evolutionary history of serrate leaf Juniperus and reveals discordance with chloroplast phylogeny. Mol. Phylogenet. Evol. 2021, 156, 107022. [Google Scholar] [CrossRef]
- Cutter, A.D. Integrating phylogenetics, phylogeography and population genetics through genomes and evolutionary theory. Mol. Phylogenet. Evol. 2013, 69, 1172–1185. [Google Scholar] [CrossRef]
- Elshire, R.J.; Glaubitz, J.C.; Sun, Q.; Poland, J.A.; Kawamoto, K.; Buckler, E.S.; Mitchell, S.E. A robust, simple Genotyping-by-Sequencing (GBS) approach for high diversity species. PLoS ONE 2011, 6, e19379. [Google Scholar] [CrossRef] [PubMed] [Green Version]
- Li, H.; Durbin, R. Fast and accurate short read alignment with Burrows-Wheeler transform. Bioinformatics 2009, 25, 1754–1760. [Google Scholar] [CrossRef] [Green Version]
- Li, H.; Handsaker, B.; Wysoker, A.; Fennell, T.; Ruan, J.; Homer, N.; Marth, G.; Abecasis, G.; Durbin, R. 1000 Genome Project Data Processing Subgroup. The Sequence Alignment/Map format and SAMtools. Bioinformatics 2009, 25, 2078–2079. [Google Scholar] [CrossRef] [PubMed] [Green Version]
- Purcell, S.; Neale, B.; Todd-Brown, K.; Thomas, L.; Ferreira, M.A.R.; Bender, D.; Maller, J.; Sklar, P.; de Bakker, P.I.W.; Daly, M.J.; et al. PLINK: A tool set for whole-genome association and population-based linkage analyses. Am. J. Hum. Genet. 2007, 81, 559–575. [Google Scholar] [CrossRef] [Green Version]
- Alexander, D.H.; Novembre, J.; Lange, K. Fast model-based estimation of ancestry in unrelated individuals. Genome Res. 2009, 19, 1655–1664. [Google Scholar] [CrossRef] [Green Version]
- Yang, J.; Lee, S.H.; Goddard, M.E.; Visscher, P.M. GCTA: A tool for genome-wide complex trait analysis. Am. J. Hum. Genet. 2011, 88, 76–82. [Google Scholar] [CrossRef] [PubMed] [Green Version]
- Kumar, S.; Stecher, G.; Li, M.; Knyaz, C.; Tamura, K. MEGA X: Molecular evolutionary genetics analysis across computing platforms. Mol. Biol. Evol. 2018, 35, 1547–1549. [Google Scholar] [CrossRef]
- Excoffier, L.; Lischer, H.E.L. Arlequin suite ver 3.5: A new series of programs to perform population genetics analyses under Linux and Windows. Mol. Ecol. Resour. 2010, 10, 564–567. [Google Scholar] [CrossRef] [PubMed]
- Vandergast, A.G.; Perry, W.M.; Lugo, R.V.; Hathaway, S.A. Genetic landscapes GIS Toolbox: Tools to map patterns of genetic divergence and diversity. Mol. Ecol. Resour. 2011, 11, 158–161. [Google Scholar] [CrossRef]
- Brown, J.L.; Hill, D.J.; Dolan, A.M.; Carnaval, A.C.; Haywood, A.M. PaleoClim, high spatial resolution paleoclimate surfaces for global land areas. Sci. Data 2018, 5, 1–9. [Google Scholar] [CrossRef] [Green Version]
- Phillips, S.J.; Anderson, R.P.; Schapire, R.E. Maximum entropy modeling of species geographic distributions. Ecol. Model. 2006, 190, 231–259. [Google Scholar] [CrossRef] [Green Version]
- Jiang, X.-L.; Xu, G.; Deng, M. Spatial genetic patterns and distribution dynamics of the rare oak Quercus chungii: Implications for biodiversity conservation in Southeast China. Forests 2019, 10, 821. [Google Scholar] [CrossRef] [Green Version]
- Loera, I.; Ickert-Bond, S.M.; Sosa, V. Pleistocene refugia in the Chihuahuan Desert: The phylogeographic and demographic history of the gymnosperm Ephedra compacta. J. Biogeogr. 2017, 44, 2706–2716. [Google Scholar] [CrossRef]
- Salinas-Ivanenko, S.; Múrria, C. Macroecological trend of increasing values of intraspecific genetic diversity and population structure from temperate to tropical streams. Global Ecol. Biogeogr. 2021, 30, 1685–1697. [Google Scholar] [CrossRef]
- Peter, B.M.; Slatkin, M. The effective founder effect in a spatially expanding population. Evolution 2015, 69, 721–734. [Google Scholar] [CrossRef] [Green Version]
- Jia, Y.; Wu, H.; Zhu, S.; Li, Q.; Zhang, C.; Yu, Y.; Sun, A. Cenozoic aridification in Northwest China evidenced by paleovegetation evolution. Palaeogeogr. Palaeocl. 2020, 557, 109907. [Google Scholar] [CrossRef]
- Zhao, Y.; Zhang, H.; Pan, B.; Zhang, M. Intraspecific divergences and phylogeography of Panzerina lanata (Lamiaceae) in northwest China. PeerJ 2019, 7, e6264. [Google Scholar] [CrossRef] [PubMed] [Green Version]
- Gu, L.; Liu, Y.; Que, P.; Zhang, Z. Quaternary climate and environmental changes have shaped genetic differentiation in a Chinese pheasant endemic to the eastern margin of the Qinghai-Tibetan Plateau. Mol. Phylogenet. Evol. 2013, 67, 129–139. [Google Scholar] [CrossRef]
- Liu, Y.; Dietrich, C.H.; Wei, C. Genetic divergence, population differentiation and phylogeography of the cicada Subpsaltria yangi based on molecular and acoustic data: An example of the early stage of speciation? BMC Evol. Biol. 2019, 19, 5. [Google Scholar] [CrossRef] [PubMed] [Green Version]
- Chu, J.; Yang, H.; Lu, Q.; Zhang, X. Endemic shrubs in temperate arid and semiarid regions of northern China and their potentials for rangeland restoration. AOB Plants 2015, 7, plv063. [Google Scholar] [CrossRef] [PubMed] [Green Version]
- Wang, G.H. The western Ordos plateau as a biodiversity center of relic shrubs in arid areas of China. Biodivers. Conserv. 2005, 14, 3187–3200. [Google Scholar] [CrossRef]
Figure 1.
The geographical distribution and genetic clustering of 10 sampled Prunus mongolica populations. (a) Pie charts show mean proportions of cluster memberships for individuals from ten populations under the first run of the ADMIXTURE program at K = 4, the colors represent different clusters which are consist with those in (b); rectangle charts show the results for seven populations under the second run of the ADMIXTURE program at K = 5, the colors represent different clusters which are consist with those in (c). (b) Genetic clustering of ten populations based on genome-wide SNPs under the first run of the ADMIXTURE program at K = 4. (c) Genetic clustering of the remaining seven populations under the second run of the ADMIXTURE program at K = 5.
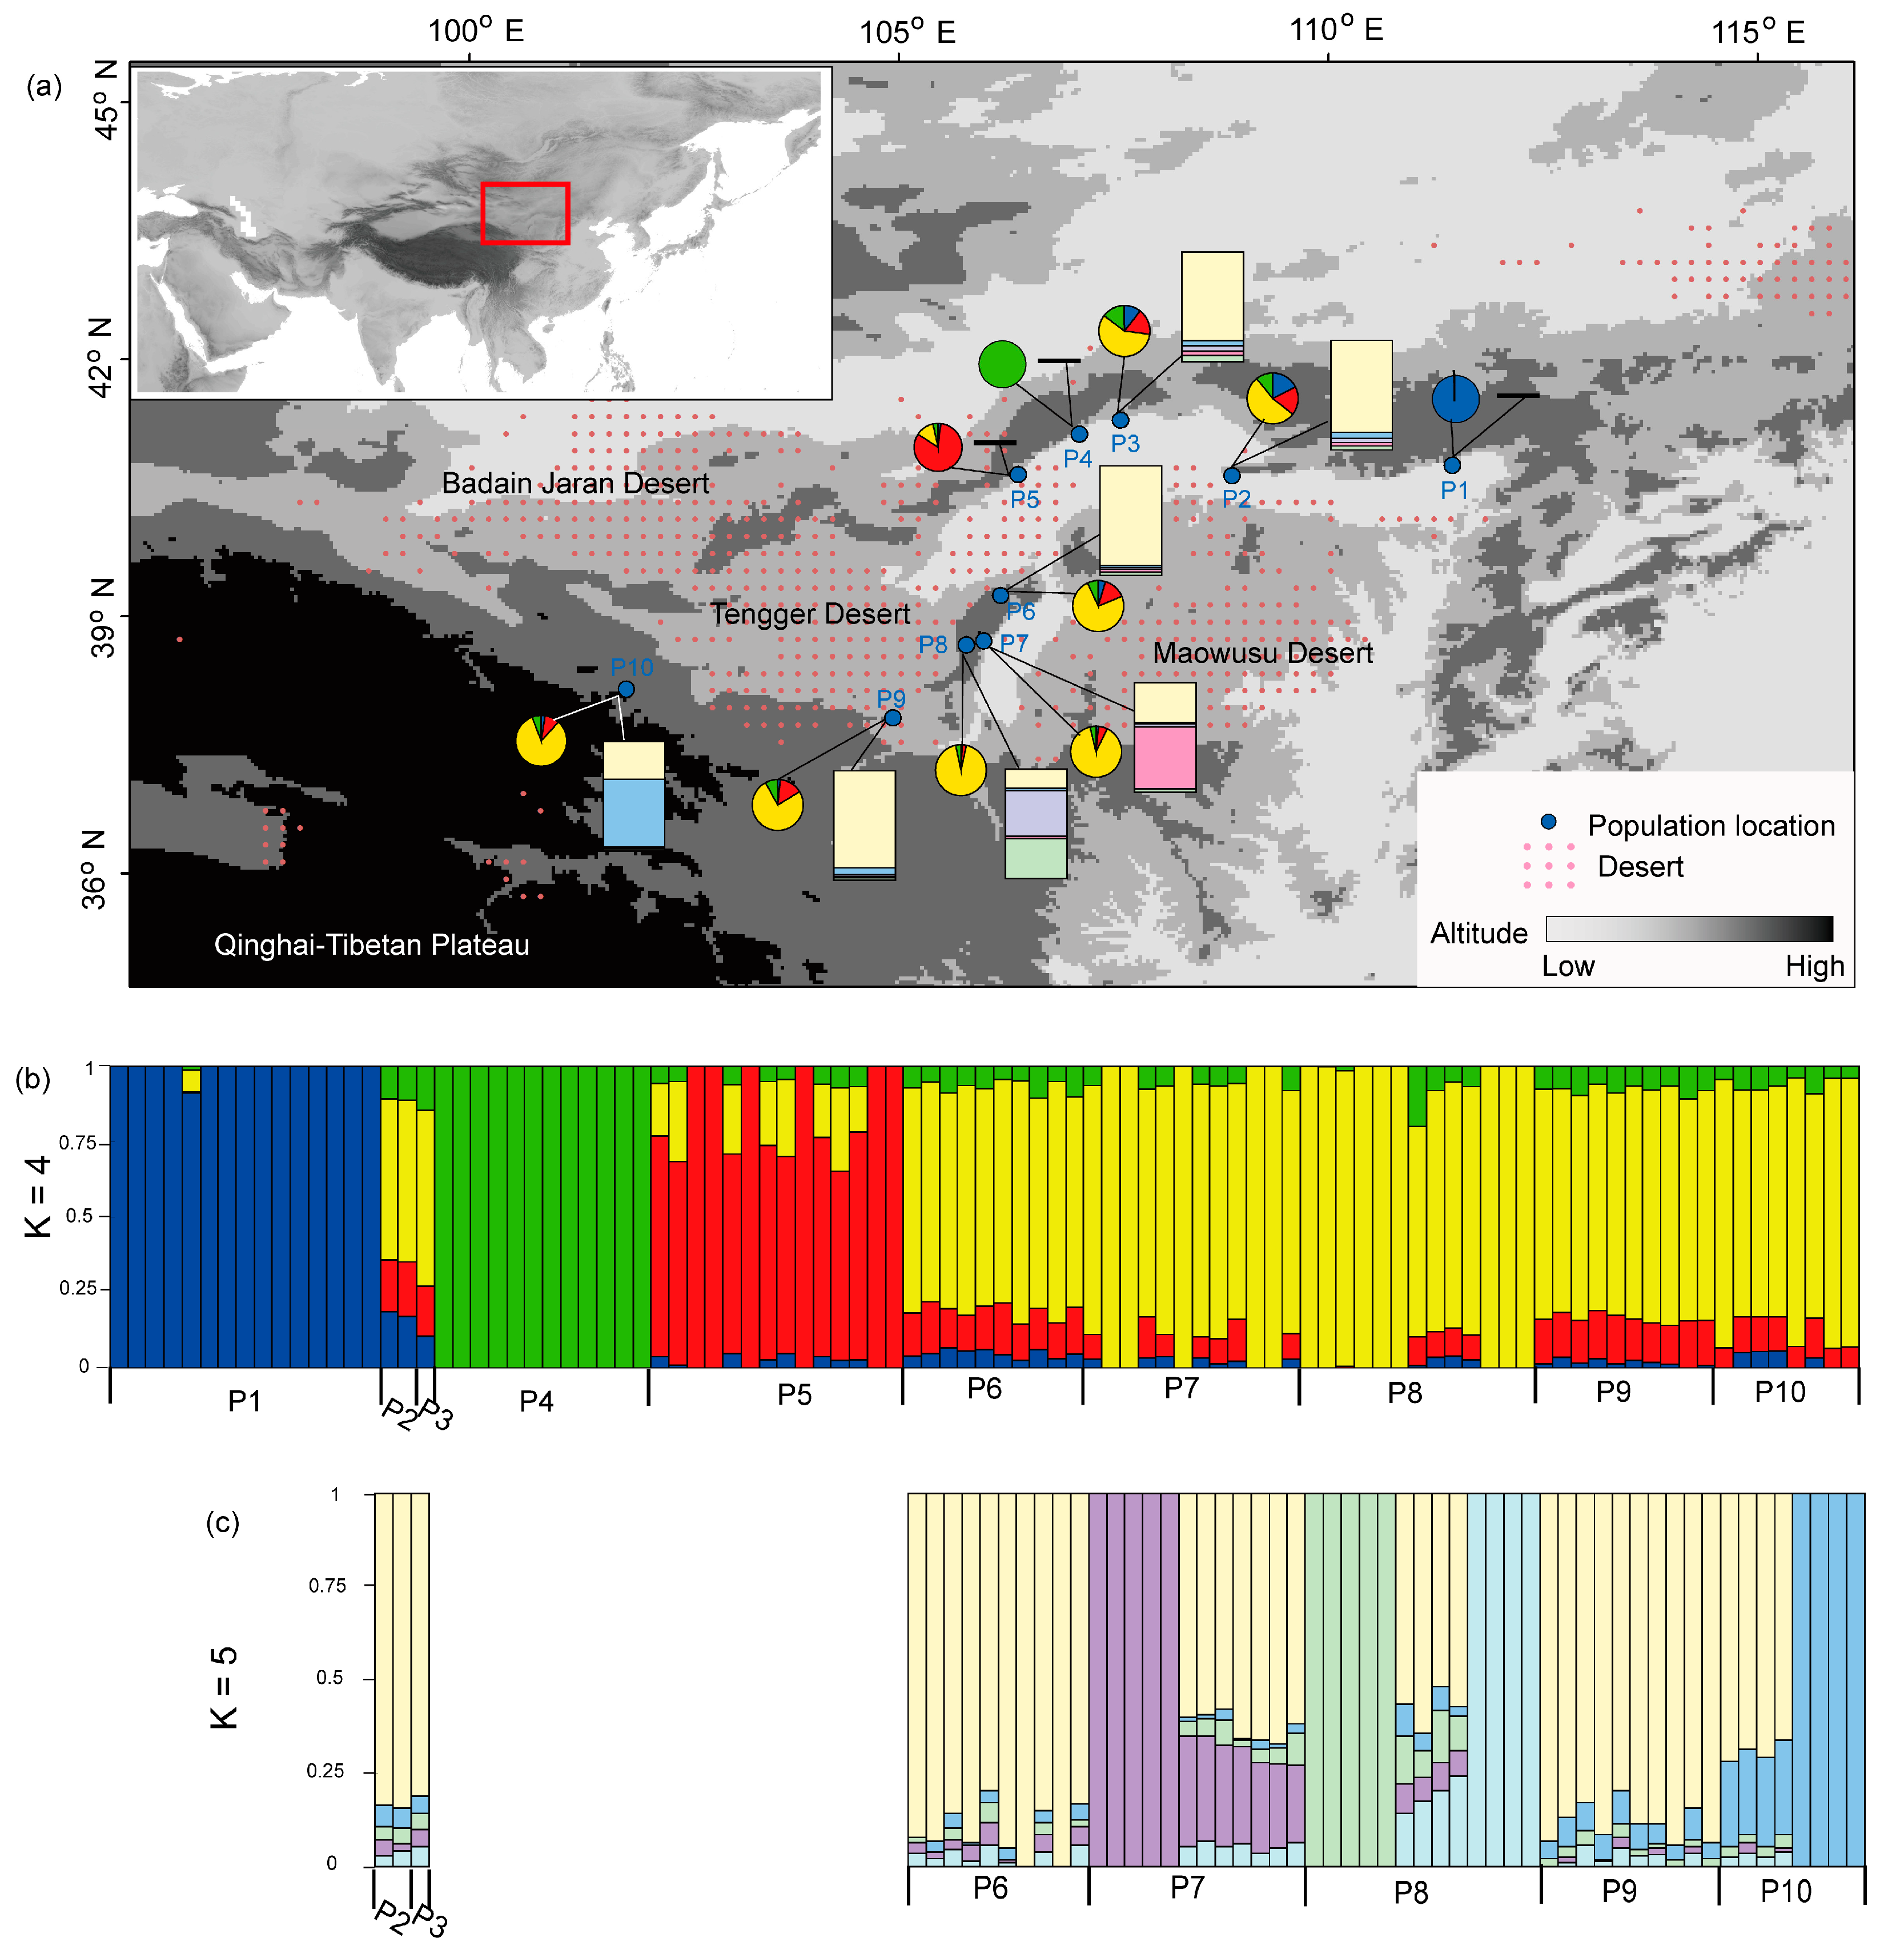
Figure 2.
Principal components analysis (PCA) plots of sampled Prunus mongolica individuals based on the first three principal components. (a) PCA plots for 97 individuals from 10 sampled Prunus mongolica populations. (b) PCA plots for seven remaining populations.
Figure 2.
Principal components analysis (PCA) plots of sampled Prunus mongolica individuals based on the first three principal components. (a) PCA plots for 97 individuals from 10 sampled Prunus mongolica populations. (b) PCA plots for seven remaining populations.

Figure 3.
Neighbor-joining (NJ) phylogenetic tree of 97 individuals from 10 sampled Prunus mongolica populations constructed with the genome-wide single nucleotide polymorphisms (SNPs) dataset. The numbers under the branches show the bootstrap values of the nodes (%).
Figure 3.
Neighbor-joining (NJ) phylogenetic tree of 97 individuals from 10 sampled Prunus mongolica populations constructed with the genome-wide single nucleotide polymorphisms (SNPs) dataset. The numbers under the branches show the bootstrap values of the nodes (%).

Figure 4.
Spatial pattern of genetic diversity across the distribution range of Prunus mongolica based on the values of nucleotide diversity (π). The base map shows the elevational changes of the study area. The points show the eight populations used to calculate the values of genetic diversity (see Table 1). The parallelogram was generated based on the convex hull of eight geographical points.

Figure 5.
Potential distribution (a,b) and migration corridors (c,d) of Prunus mongolica in the present and LGM periods, respectively. Purple dots show the ten sampled populations.
Figure 5.
Potential distribution (a,b) and migration corridors (c,d) of Prunus mongolica in the present and LGM periods, respectively. Purple dots show the ten sampled populations.

Table 1.
Population information and genetic diversity of Prunus mongolica.
| Population Code | Longitude/Latitude | Nind | Voucher Specimen | π (SD) | Ho (SD) | He (SD) |
|---|---|---|---|---|---|---|
| Overall | — | 97 | 0.339 (0.160) | 0.378 (0.187) | 0.350 (0.128) | |
| P1 | 111.44/40.76 | 15 | — | 0.216 (0.105) | 0.363 (0.415) | 0.213 (0.221) |
| P2 | 108.87/40.64 | 2 | — | — | — | |
| P3 | 107.58/41.29 | 1 | AM-WZQ-001 | — | — | |
| P4 | 107.09/41.12 | 12 | AM-WHQ-001 | 0.249 (0.122) | 0.388 (0.382) | 0.241 (0.211) |
| P5 | 106.38/40.65 | 14 | AM-DK-001 | 0.299 (0.146) | 0.398 (0.295) | 0.287 (0.177) |
| P6 | 106.18/39.24 | 10 | AM-ZQZ-001 | 0.335 (0.166) | 0.385 (0.254) | 0.321 (0.164) |
| P7 | 105.98/38.71 | 12 | AM-YC-001 | 0.321 (0.158) | 0.394 (0.293) | 0.305 (0.176) |
| P8 | 105.78/38.66 | 13 | AM-ZQG-001 | 0.322 (0.158) | 0.393 (0.288) | 0.313 (0.172) |
| P9 | 104.93/37.81 | 10 | — | 0.336 (0.167) | 0.397 (0.252) | 0.323 (0.162) |
| P10 | 101.83/38.15 | 8 | AM-YCX-001 | 0.301 (0.151) | 0.370 (0.324) | 0.281 (0.192) |
Notes: Nind, the number of individuals analyzed; π, the average nucleotide diversity; SD, standard deviation; Ho, the average observed heterozygosity; He, the average expected heterozygosity.
Publisher’s Note: MDPI stays neutral with regard to jurisdictional claims in published maps and institutional affiliations. |
© 2021 by the authors. Licensee MDPI, Basel, Switzerland. This article is an open access article distributed under the terms and conditions of the Creative Commons Attribution (CC BY) license (https://creativecommons.org/licenses/by/4.0/).
Share and Cite
MDPI and ACS Style
Zhang, H.-X.; Wang, Q.; Wen, Z.-B. Spatial Genetic Structure of Prunus mongolica in Arid Northwestern China Based on RAD Sequencing Data. Diversity 2021, 13, 397. https://doi.org/10.3390/d13080397
AMA Style
Zhang H-X, Wang Q, Wen Z-B. Spatial Genetic Structure of Prunus mongolica in Arid Northwestern China Based on RAD Sequencing Data. Diversity. 2021; 13(8):397. https://doi.org/10.3390/d13080397
Chicago/Turabian StyleZhang, Hong-Xiang, Qian Wang, and Zhi-Bin Wen. 2021. "Spatial Genetic Structure of Prunus mongolica in Arid Northwestern China Based on RAD Sequencing Data" Diversity 13, no. 8: 397. https://doi.org/10.3390/d13080397
Note that from the first issue of 2016, this journal uses article numbers instead of page numbers. See further details here.