Article

Floristic Groups, and Changes in Diversity and Structure of Trees, in Tropical Montane Forests in the Southern Andes of Ecuador

1
Facultad de Ciencias Agropecuarias, Universidad de Cuenca, 12 de Octubre y Diego de Tapia, Cuenca 010114, Ecuador
2
Departamento de Biología, Geología, Física y Química Inorgánica, Universidad Rey Juan Carlos, Calle Tulipán s/n, Móstoles, ES-28933 Madrid, Spain
3
Departamento de Biología, Escuela Politécnica Nacional, Ladrón de Guevara, Quito E11 253, Ecuador
4
Centro de Investigación de la Biodiversidad y Cambio Climático, Universidad Tecnológica Indoamérica, Quito EC170103, Ecuador
5
Departamento de Ciencias Biológicas, Universidad Técnica Particular de Loja, San Cayetano Alto s/n, Loja 1101608, Ecuador
*
Author to whom correspondence should be addressed.
Diversity 2021, 13(9), 400; https://doi.org/10.3390/d13090400
Submission received: 10 June 2021 / Revised: 11 August 2021 / Accepted: 12 August 2021 / Published: 24 August 2021

Abstract

:
Composition, diversity, and structure of trees in tropical montane forests are responsive to ecological gradients and local succession. Those parameters are a result of ecological interactions between vegetation, environment, and location. This study identified floristic groups on mainly secondary forests and evaluated how the composition, diversity, and structure of trees correlate with climate, soil, and age since abandonment. We included in our models a measurement of spatial correlation, to explore the role of dispersion. For this purpose, we measured diameter and height of all trees with DBH ≥ 10 cm, in twenty-eight 500 m2 plots, in an elevation range between 2900 and 3500 m. We found 14 indicator species in three floristic groups. Group composition was explained by age since abandonment, which showed strong succession effects. Mean monthly precipitation and Manganese, but not spatial correlation, explained plant composition in these montane forests, suggesting a minor role of dispersion. Species richness and structure of the arboreal vegetation were influenced by interactions between age, precipitation, and soil nutrients concentration. We concluded that in fragmented landscapes, within the rugged region of southern Ecuador, it is possible to find different floristic groups that encompass high variation in their composition.

1. Introduction

High Andean forests (>2500 m), also known locally as tropical montane forests (TMF), are ecosystems with high species diversity [1]. They are part of the Tropical Andes hotspot, known for its high endemism [2]. The floristic composition and forest structure of plant communities in these montane ecosystems are heterogeneous [3,4]. TMF are important for the long-term provision of ecosystem goods and services [5]; however, a persistent question for ecologists and forest managers has been how their floristic composition and community structure change through environmental gradients and ecological succession [6,7].
At a local scale, richness, basal area, and tree height of mature TMF decrease with altitude [7,8]. This is not the case for tree density which increases in TMF at higher altitudes [9]. The same pattern arises at a regional scale, with the exception of the basal area which, at least in certain regions, does not correlate with altitude [10]. Similarly, floristic composition varies along TMF environmental gradients. For example, different dominant and indicator species are characteristic of different altitudes in neotropical forests [11,12]. This variation in species composition is usually justified by assembly rules of forest communities, which make use of niche theory. For example, niche assembly has been useful to explain the role of different environmental variables such as edaphic (mainly calcium and magnesium) [13], topographic [14], and climatic (precipitation and temperature) [15] factors in plant community composition [12]. On the contrary, other studies have found that location, through spatial correlation, also influences the plant composition across forests [16,17], which is usually linked to the dispersal theory. Under this theory, floristic composition depends on the regional species pool and the dispersion potential of species [18,19].
Despite their ecological importance, TMFs are exposed to high anthropogenic pressures [20,21]. For example, in southern Ecuador, annual deforestation rates of 3% due to agricultural, forestry, and mining practices [22,23] are recorded, with the loss of natural, woody, and herbaceous vegetation [24]. Age since abandonment is a major factor influencing plant dynamics. For example, there are large areas of TMF on the Andean slopes, that were once primary forests and were later used extensively for timber extraction [25]. Later, these areas were converted to pastures and agricultural land. After the productivity of the soil was decreased, most of the lands were abandoned for which they have been subjected to natural successional processes that give rise to secondary montane forest (SMF) [26,27,28]. The structure and composition of these plant communities depend on the age since abandonment and past land use [28] and are influenced by environmental and habitat variables that can facilitate the development of natural regeneration [29].
In this study, we fill some knowledge gaps by answering the following questions: (1) Are there floristic groups of trees? Are indicator species unique to these floristic groups? (2) Which environmental variables explain the variation in floristic group composition, diversity, and structure of trees? We expect floristic group composition to respond to environmental variables more than to spatial variables. We expect environmental variables and age to significantly explain richness and structure. We perform this study in TMF of southern Ecuador, one of the most threatened habitats of the country.

2. Materials and Methods
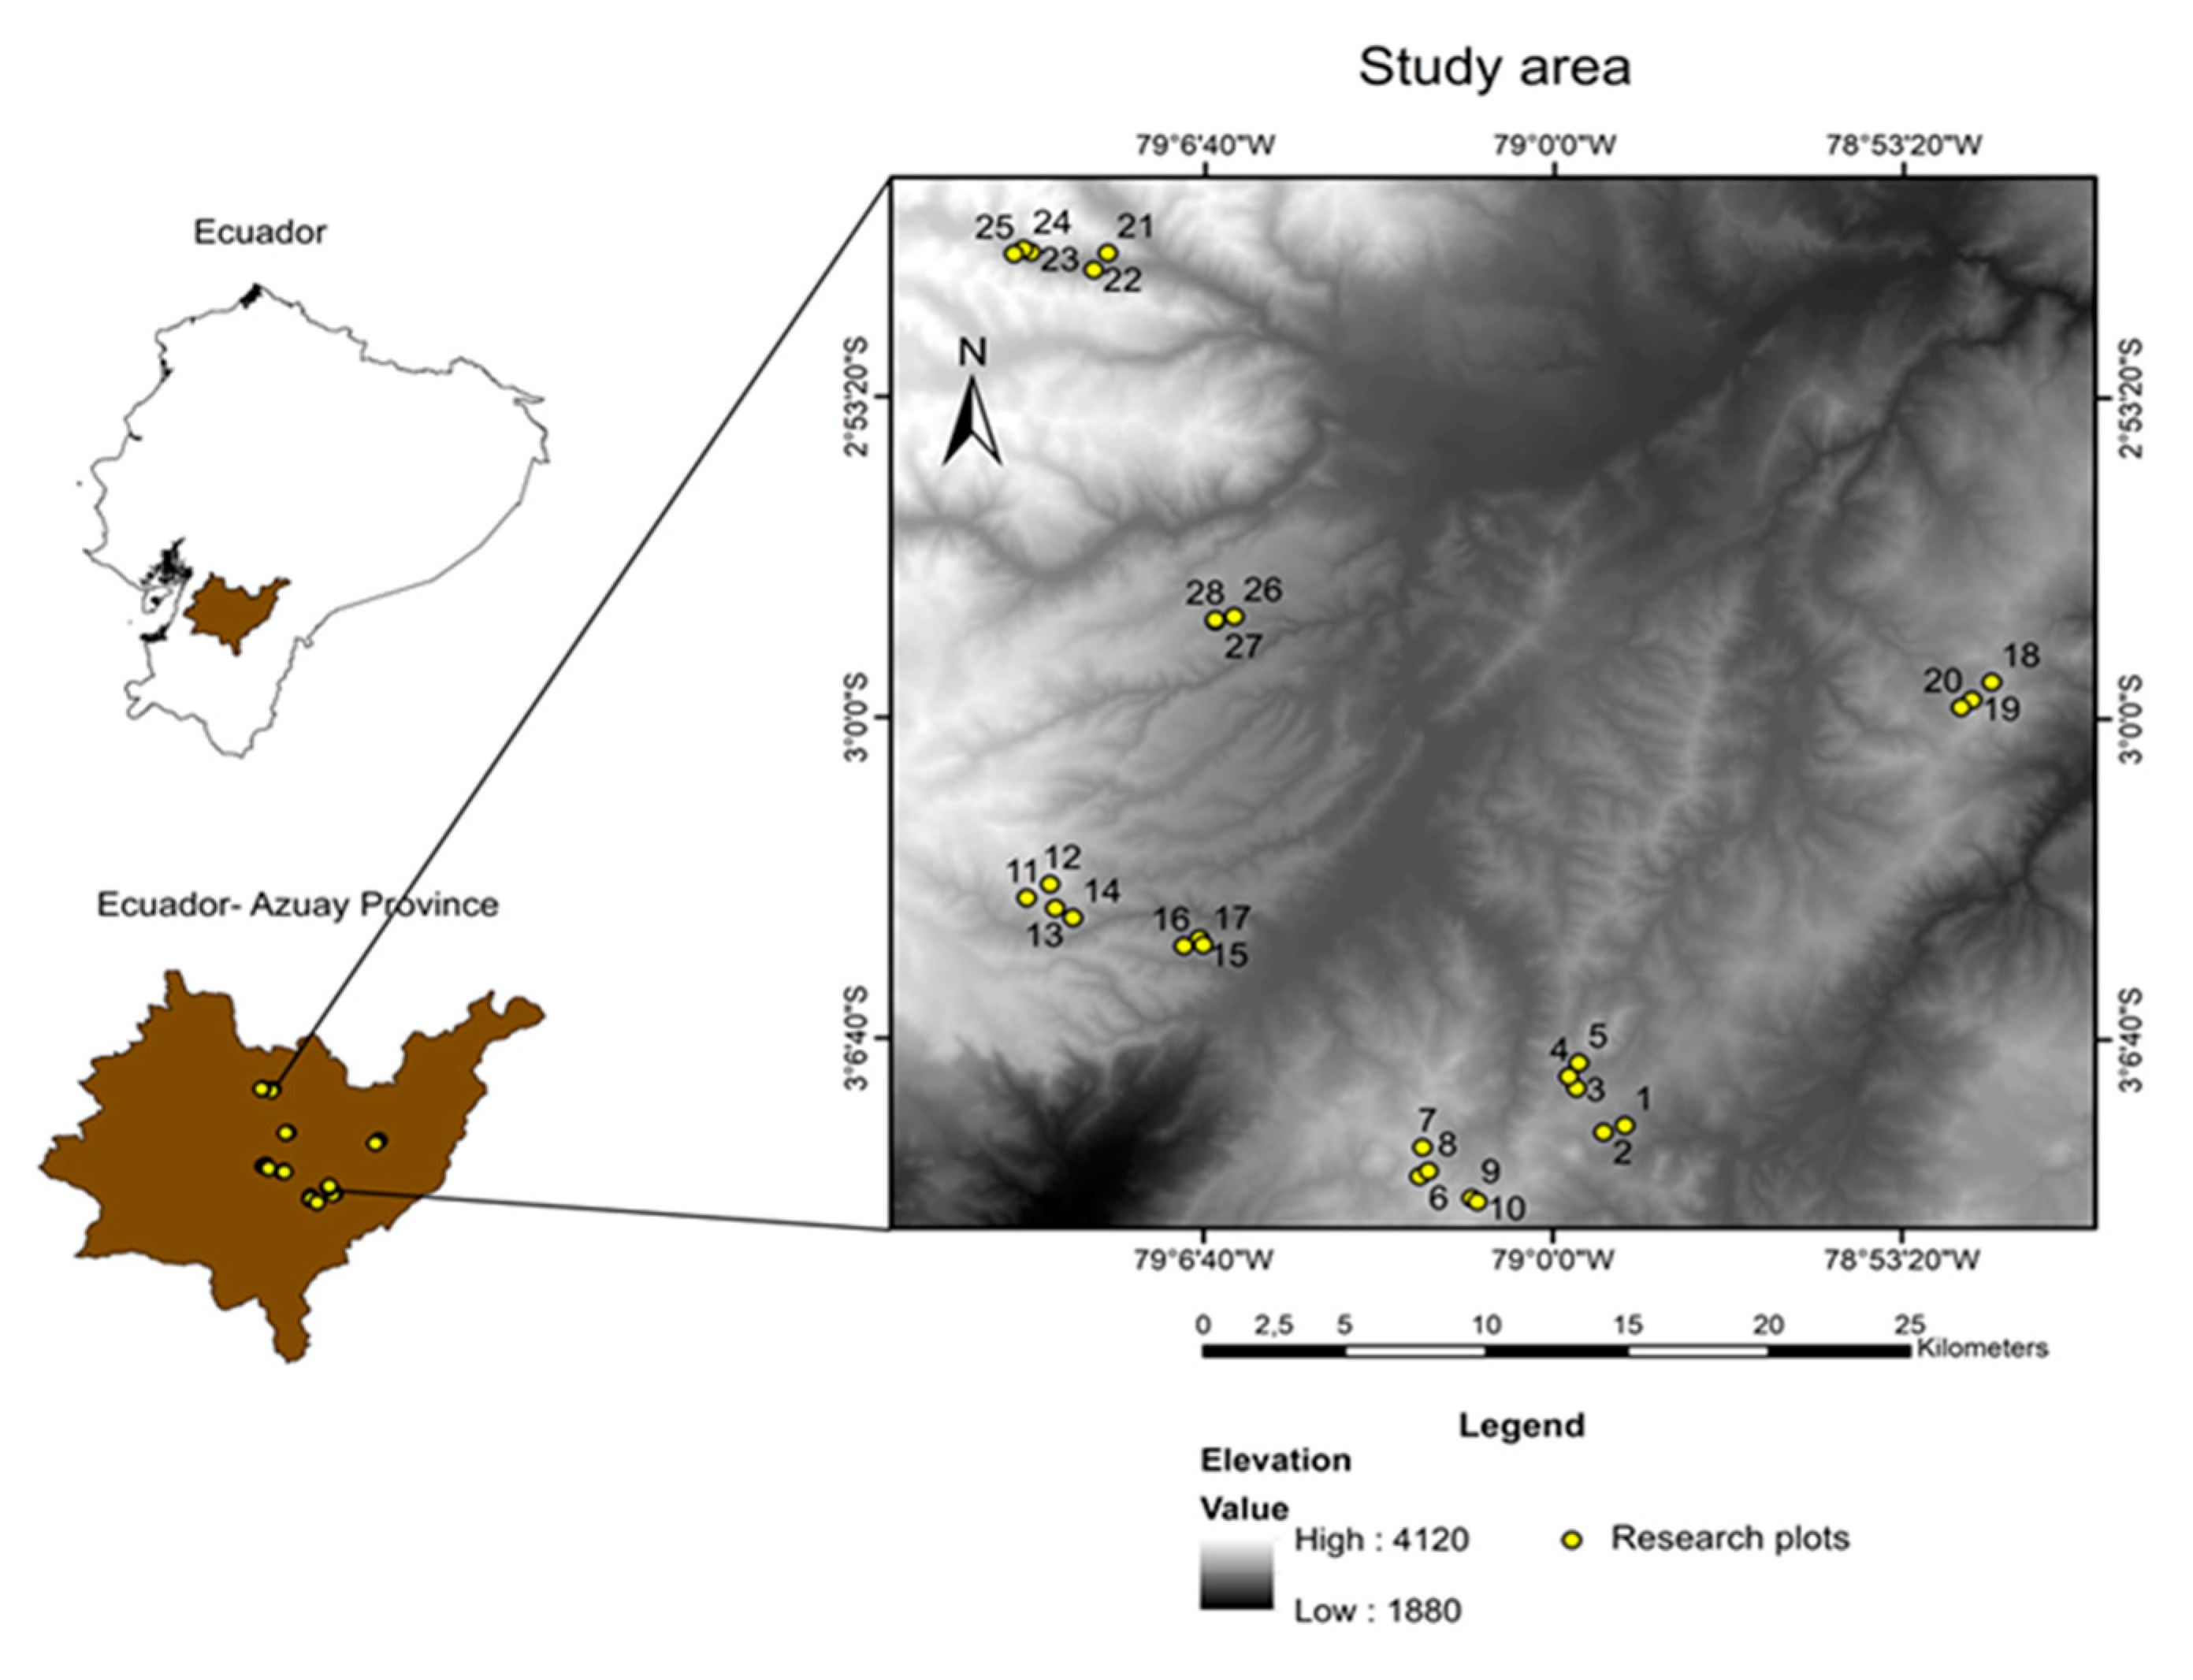
2.1. Study Area

This research adds to the work published by Jadán et al. in 2017 [30]. In this year, we found three floristic groups, 12 indicator species in 20 plots, with trees DBH ≥ 5 and not including mature forests. Nowadays, we incorporate plots within mature forest and evaluate trees with DBH ≥ 10 cm, as they are considered adult trees that are part of the forest mass now and in the future. Furthermore, including only trees with DBH ≥ 10 cm will allow us to monitor ecological dynamics in the future. The study area is located on the eastern slope of the Western Andes Mountain range between 2900 to 3500 m of elevation. The plots were installed within a land use matrix that includes agricultural zones and forests. Annual temperature averages between 6 and 12 °C. Annual rainfall ranges from 800 to 1500 mm [31]. The soil typology corresponds to Vertisols, Andisols and Inceptisols according to the Ministry of Agriculture of Ecuador (http://www.sigtierras.gob.ec/geopedologia/ accessed date: 30 May 2021). Livestock and subsistence agriculture are part of the history of land use in the study area, something common in the province of Azuay [32].

2.2. Vegetation Survey and Data Collection

Vegetation cover maps made available by the Ministry of Agriculture of Ecuador [33] were used to select over 100 forest patches prior to vegetation surveying. We randomly installed 28 plots of 20 m × 25 m (0.05 ha). Plots were placed in the area based on access, forest patch size, and the collaboration of the farm owners. We placed one plot per patch, with a minimum distance between plots of 1 km, and an average distance of 2 km (Figure 1). Plots show an aggregate distribution because there are no continuous forests in the research area. The age since abandonment of the plot was estimated through a temporal analysis using aerial ortho-photographs from 1955, 1980, and 2015 provided by the Military Geographical Institute of Ecuador (IGM), using a methodology similar to that applied in lowland tropical forests [28]. For plots > 70 years, ALA was estimated through interviews with the elderly and from historical records of Cajas National Park.
Plots were sampled from October 2016 to October 2017. In each plot, diameter at breast height (DBH) and total height of all trees with diameters DBH ≥ 10 cm were measured. The total height was calculated through the average of all the trees in the plot. The dominant height was calculated through the average of the 10 tallest trees in each plot. Fern trees with DBH ≥ 10 cm were also included in our database. All individuals were taxonomically identified at the species level directly in the field or by comparison with the specimens of the Loja herbarium (LOJA).
Altitude and slope were measured at the center of the plots. Annual and monthly average rainfall as well as average, minimum, and maximum temperatures were extracted from the WorldClim global climate database (https://www.worldclim.org/), accessed date: 30 May 2021, using the central geographic coordinates of each plot. Composite soil samples were taken at 20 cm depth after the organic layer, from 3 subsamples in each plot. Available chemical values of organic matter (volumetric method by Walkley and Black), pH (electrometric method with pH meter), nitrogen (Dumas method with Dumatherm equipment-automatic nitrogen analyzer), phosphorus (colorimetric method with spectrophotometer), potassium, calcium, magnesium, iron, manganese, copper, and zinc (atomic absorption method with spectrophotometer) were measured in the Agrocalidad laboratory in Quito. For details on calibration and markings of the equipment, see the laboratory website (https://www.agrocalidad.gob.ec/?page_id=39193), accessed date: 30 May 2021.

2.3. Identification of Floristic Groups and Indicator Species

We determine floristic groups using floristic composition data for all plots and a cluster analysis on Bray Curtis distances and the Ward method. To separate floristic groups, we use a cut-off of 50% in distance between similar floristic. We used the “hclust” function in the “stats” R package [34]. Group membership was tested with an ANOSIM similitude analysis (Bray Curtis; p < 0.05) using the “vegdist” function in the “vegan” R package [35]. A non-metric multidimensional scale analysis (NMDS) was performed in order to visualize the spatial distribution of the determined floristic groups. The use of the ISA (indicator species analysis) allows us to find indicator species indicating conservation condition and composition [36]. This analysis was made according to species frequencies and abundances (Indicspecies, p < 0.05) [37]. Indicator species were incorporated into the NMDS to be able to associate them with each floristic group. Statistical analyses were performed using the R packages “Indicspecies” [37].

2.4. Relationship of Floristic Groups and Predictor Variables

We analyzed differences in diversity among the three floristic groups. Diversity was estimated by constructing rarefaction and extrapolation curves using the multinomial probability distribution model on the Hill numbers q = 0 (species richness), q = 1 (exponential of Shannon entropy index), and q = 2 (the inverse of the Simpson concentration) for the sample-based abundance data [38]. We conducted analyses using the package iNEXT for R [39]. Species richness and parameters of plot structure such as tree density (n/ha), basal area (m2/ha), total height (m), and dominant height (m) were considered response variables. Variation and differences in the richness and structure parameters were analyzed by analysis of variance (ANOVA, test Fisher; p < 0.05). To perform this, we checked the assumptions of normality and homoscedasticity, using the residues, and predicted the errors in each response variable.
The relationship between floristic group composition and the predictor variables was determined with the “envfit” function in the “vegan” R package [34]. This function allows for visualization of the significant predictor variables when separating each floristic group in the NMDS analysis [39,40]. To explain the variation in floristic composition, we included, as a predictive variable, a spatial correlation index calculated using geographic distance through the “principal coordinates of proximity matrices-PCNM” function in the “vegan” R package [35]. This distance was calculated using the central geographic coordinates of each plot. The relationship between species richness (variation per plot) and vegetation structure parameters, as response variables, along with the predictor variables, were analyzed using linear models. To decrease the number of correlated variables, the predictor variables were firstly selected by correlation analysis, with the findCorrelation function in the “caret” R package [40]. One of the correlated variables with r > 0.7 was removed. For this procedure, the absolute values of the pair-wise correlations are considered. For two highly correlated variables, the function looks at the mean absolute correlation for each variable and removes the variable with the largest mean absolute correlation [40]. Pearson’s correlations between all the variables are shown in Table S1. Then, for each response variable, the uncorrelated predictor variables were selected using the forward selection (p ≤ 0.05) procedure.
Additionally, a discriminant analysis was carried out to find a discriminant function that allows for entering new plots or patches of forest in the future to the different floristic groups determined in this research. To conduct this, we used the predictor variables that most significantly explained the floristic composition and two variables of the structure of the vegetation that varied among all the floristic groups.

3. Results

Overall, we measured 1230 stems from trees ≥ 10 cm DBH, belonging to 34 families, 51 genera and 83 species. The most diverse family was Asteraceae (11 species), followed by Melastomataceae with nine species, Lauraceae with eight species, Solanaceae with five species, and Chloranthaceae and Rubiaceae with four species each. As well, there were four families with three species each, nine families with two species each, and 15 families with one species each. The species with the largest number of trees was Weinmannia fagaroides (193), followed by Hedyosmum cumbalense (92), Cyathea caracasana (fern tree), and Miconia poortmani with 84 individuals each. There were 60 species with less than 10 individuals.

3.1. Floristics Groups and Indicator Species

The results of the cluster analysis show that the plots form three significantly different floristic groups (ANOSIM r = 0.7; p = 0.001). The first group (FG1) was clustered within 14 plots that corresponded to sites with lower altitude; the average altitude was 3093 m ± 80.4 SD (range 2968–3218 m) while average age was 52.6 ± 14.6 years (range 40–100 years). In the second floristic group (FG2), nine plots were clustered, with an average altitude of 3396 m ± 144.7 SD (range 3055–3500 m), and an average age of 96.7 ± 18.6 SD years of land abandonment (range 56–120 years). Moreover, among the third floristic group (FG3), 5 plots were clustered with an average altitude of 3253 m ± 55.7 SD (range 3160–3299 m), while average age was 161.2 years ± 3.4 (range 155–165 years).
The floristic groups were spatially visualized and highly differentiated in the NMDS (Figure 2). Here, 14 indicator species are shown which were recorded within the floristic groups (Table 1). Two species were associated with the FG1 located at the lowest altitude with Hesperomeles ferruginea as an exclusive species of this group (Figure 2, Table 1). Five species were associated with the FG2 with Gynoxis halli, Hedyosmum cumbalense, and Ocotea infraveolata being exclusive for the group. Seven indicator species were recorded in the FG3 with Hedyosmum goutidianum, Hedyosmum luteyni, Hedyosmum racemosum, and Piper andreanum representing exclusive species for this group (Table 1). These species are spatially distributed within each group very clearly (Figure 2).

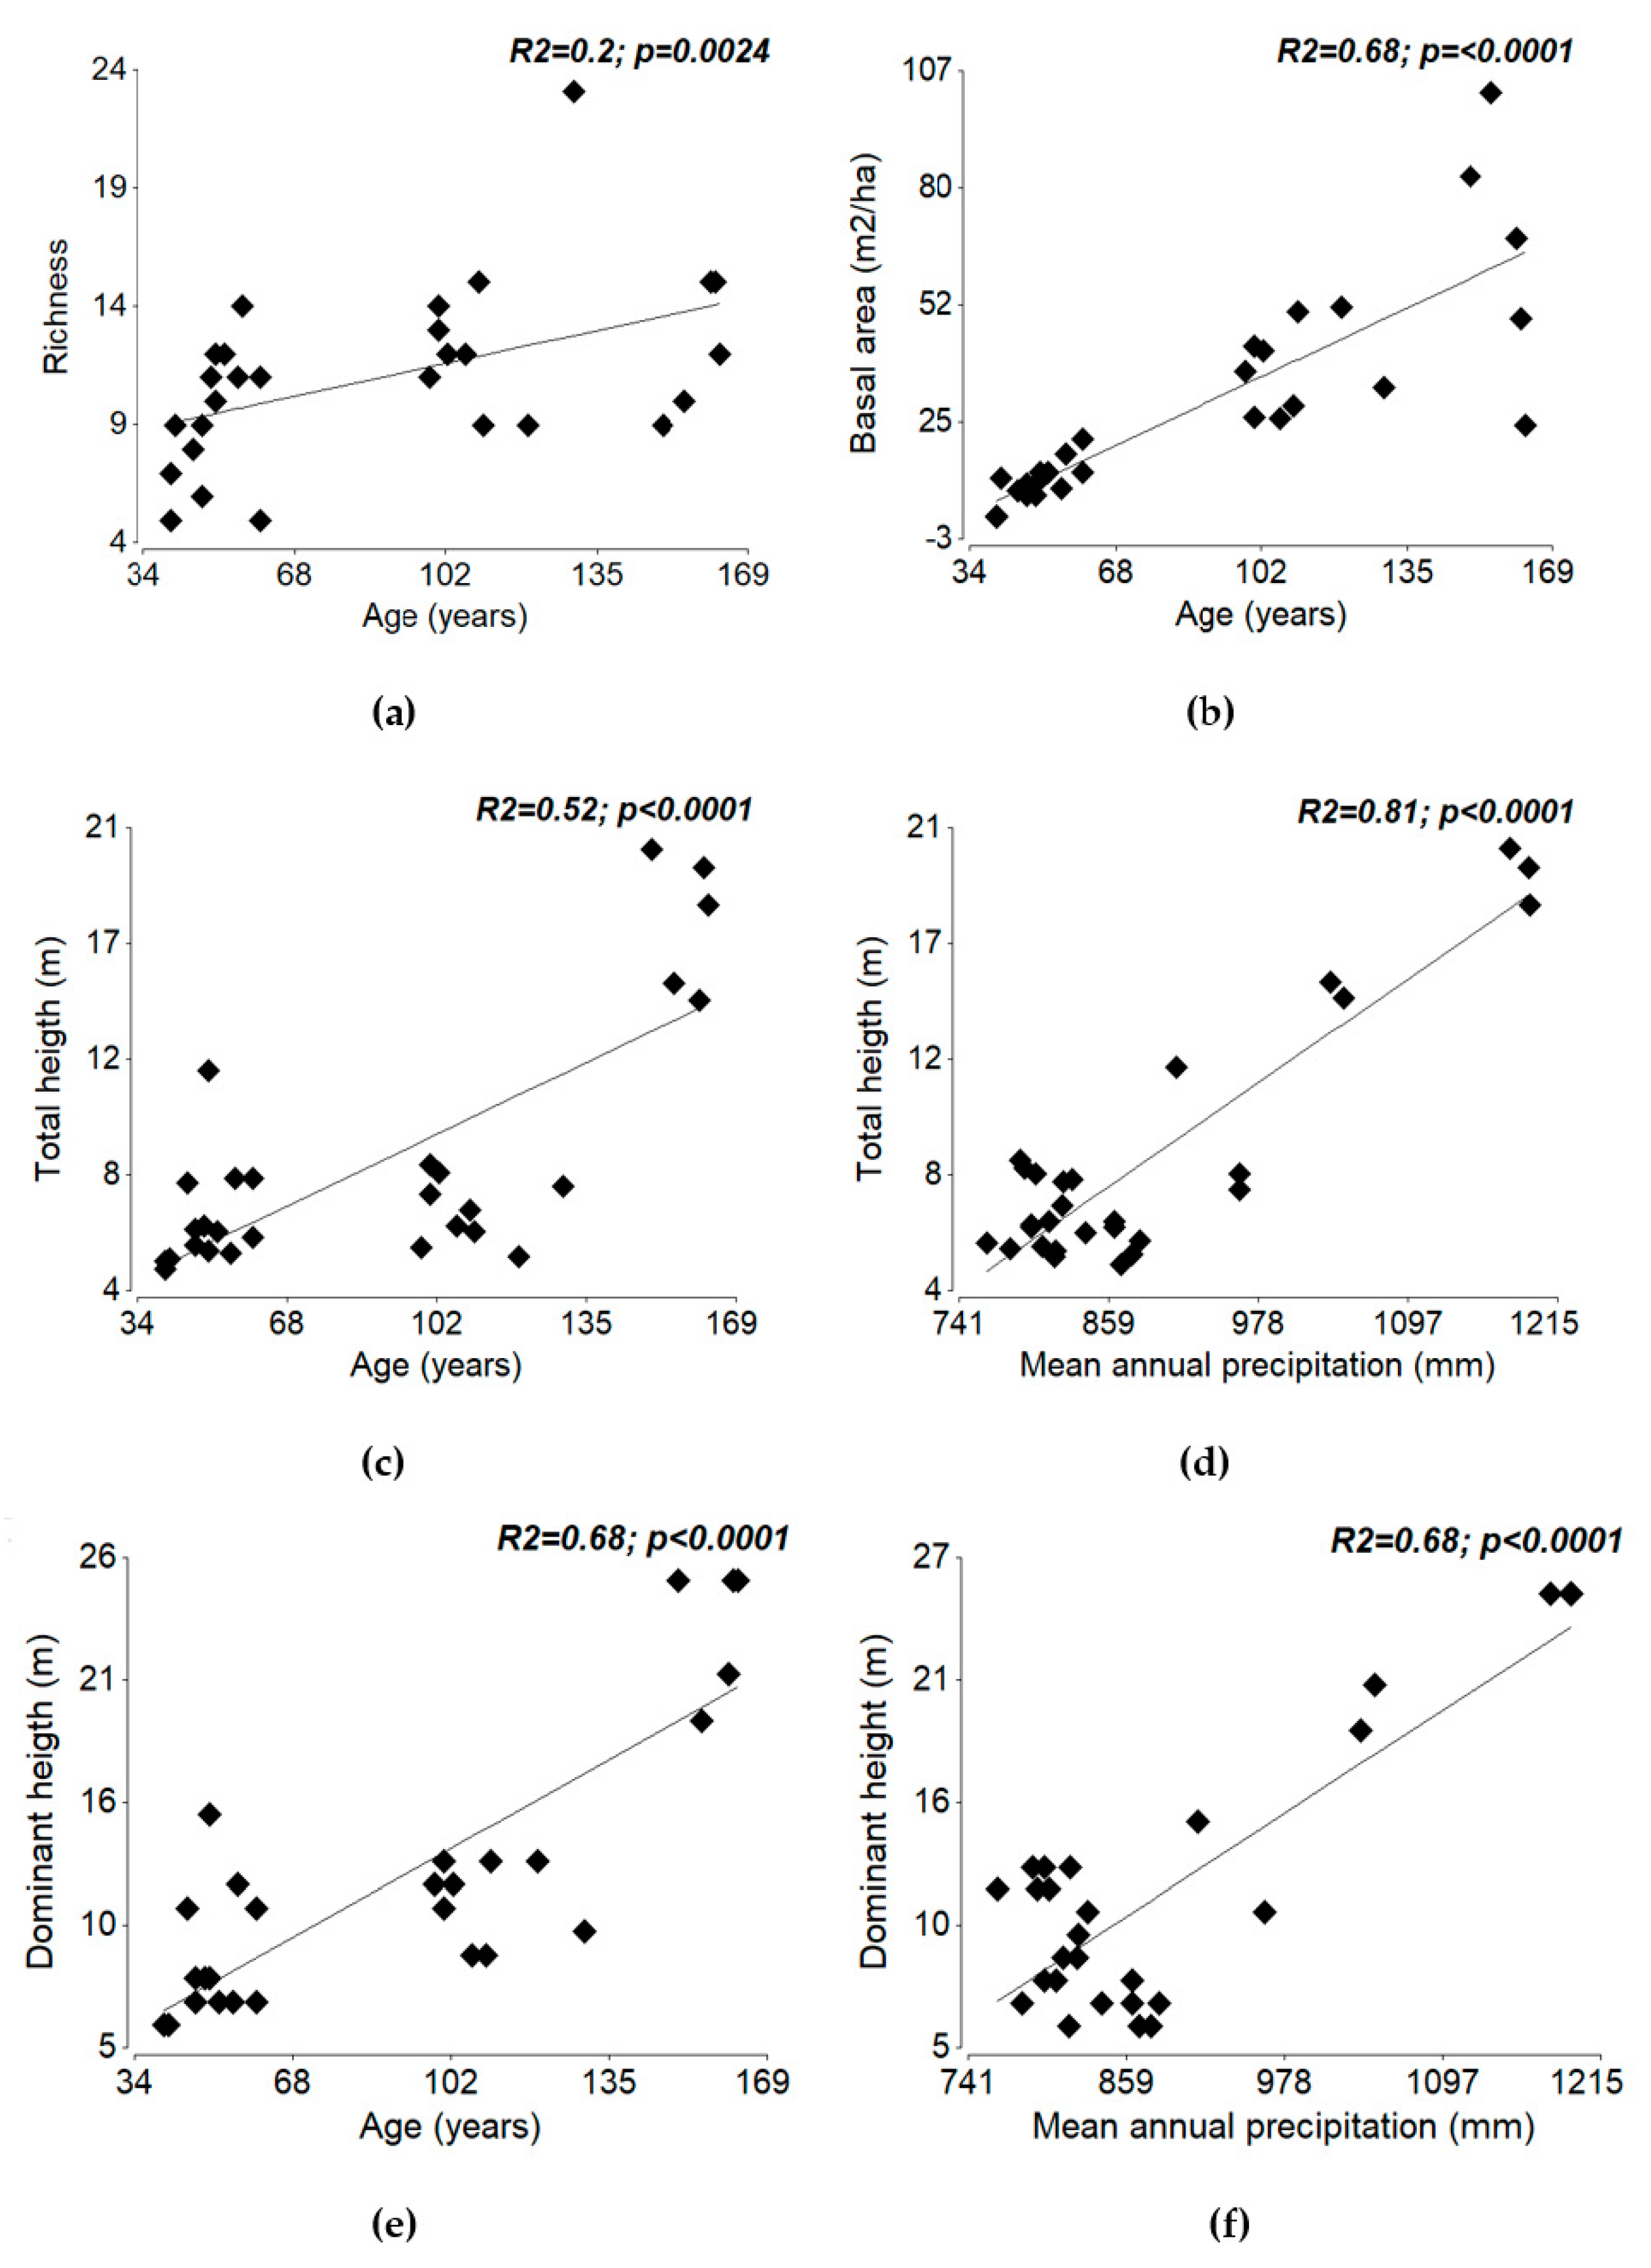
3.2. Floristic Groups and Relationship with Predictor Variables

Predictor’s variables were parametrized using some statistical descriptors such as mean, standard deviation (SD), coefficient of variation (CV), and range (Table S2). Hill numbers showed that higher values of richness, diversity of Shannon and Simpson observed and estimated were registered for FG2 (Table 2). The common species (q = 1) and abundant (q = 2) the three groups reach an asymptotic curve (Figure 3). This does not occur for the species richness of FG1 and FG2, due to the presence of many species with few individuals, which widens the confidence intervals. On the other hand, mature forest plots or FG3 with less than 250 individuals, could vary in their current richness and in their comparison with the other two groups.
The richness of tree species was higher in FG2 (13.2 species ± 1.4 SD) and FG3 (12.2 species ± 2.8 SD), which are located at higher altitudes and have a higher age since abandonment (Figure 4a). Tree density was higher in FG2 (1202.2 n/ha ± 246.7 SD) (Figure 4b). Basal area (65.1 m2/ha ± 30.2 SD) (Figure 4c), total (17.6 m ± 2.5 SD), and dominant height (23 m ± 2.8 SD) (Figure 4c,d) were higher in FG3 which are located at higher altitude and registers a higher age since abandonment.
In the correlation analysis, mean annual temperature, but not age was selected. However, we included age because we considered it to be an important variable to explain ecological secondary succession [28,41,42]. In the NMDS, the first axis was related to two highly positively correlated variables, age and spatial correlation index (Figure 5). FG1 and FG2 are ordered on this axis. FG1 corresponds to the areas of lower altitude and recent age since agricultural abandonment. At the other end of the axis is FG2, where the highest values of spatial correlation are recorded, plots in sites with higher altitude and intermediate age. On the other orthogonal axis, the mean annual precipitation increases at sites with positive spatial correlation. Moreover, the concentration of manganese in the soils is clearly higher than that of FG2 and slightly higher than the average of FG1. This group is characterized by having the oldest forest plots (it is classified as mature forests). Mean monthly precipitation and age showed a strong and significant correlation with the NMDS ordination axes (Table 3, Figure 5). In addition, they were relevant predictors in the separation of floristic groups. However, the spatial correlation is only “nearly significant”, and manganese concentration are, also, the elements that significantly support the variation in the floristic composition, allowing for the division into floristic groups (Table 3). The results of the response variables and the predictor variables are shown in Table S3.
The predictor variables which were retained by forward selection are part of the regressions in each variable, both for richness and structure of the vegetation (basal area and heights). Tree density was not associated with any predictor variable. Age since abandonment was significantly and positively associated with species richness (slope = 0.04; Figure 6a). Age was also important for basal area (slope = 0.5; Figure 6b), total height (slope = 0.08; Figure 6c), and dominant height (slope = 0.03; Figure 6e). Mean annual precipitation was also important for explaining positively and significantly the total height (slope = 0.03; Figure 6d) and dominant height (slope = 0.04; Figure 6f). Calcium was not retained by forward selection in any response variable, but was positively correlated with total height (r = 0.5; p = 0.01) (Table S1).
In the discriminant analysis, the first canonical axis explained 93.8% of the variation between the groups. The second axis explained 6.2%. The canonical discriminant function generated with the highest percentage of explanation was: F = −14.1 + 0.04 × age (years) + mean monthly precipitation (mm) + 0.02 × basal area (m2/ha) + 0.19 × dominant height (m). According to the discriminant functions with standardized data of common variances, dominant height is the most important in the discrimination within the first canonical axis. Basal area was less important in the discrimination.

4. Discussion

4.1. Floristic Groups at Local Scales

Tropical Montane forests are important ecosystems in southern Ecuador. Their conservation and ecological succession status vary across the landscape as they are subjected to strong human modification. The identification of floristic groups, and changes in diversity, and structure of trees can be used to assess their conservation status. In this study, we identified three floristic groups that represented mostly succession trajectories, with FG1 and FG2 representing early stages of regeneration and FG3 representing mature forests. These floristic groups were validated by the occurrence of 14 indicators species among the three floristic groups. These species are important because they are indicators of composition in association with habitat conditions, which is explicit in our floristic groups [36]. In FG1, two indicator species: Hesperomeles ferruginea and Myrsine dependens, are tolerant to light and have been recorded in disturbed secondary forests [41,42]. M. dependens has a high regeneration capacity, and has been registered as a seedling indicator species in high Andean montane forests [29]. On the other side, H. ferruginea presented low dominance (small trees, 1.6% of the total basal area), but high abundance and frequency. Their high seed productivity, plasticity, and ecophysiological adaptation may have facilitated their distribution in disturbed areas, however we notice that this species may be also found in mature Andean montane forests [42,43,44].
Species in FG2 are also characteristic of young forests. Gynoxis halli and Gynoxys azuayensis are heliophytes-pioneers, and have been recorded in secondary forests [45]. However, not all species in FG2 are pioneers. Ocotea infrafoveolata, Gaiadendron punctatum, and Hedysomum cumbalense have been documented as characteristic to mature high Andean forests [1]. Their presence in forests of advanced succession is due to canopy gaps caused by natural or anthropogenic disturbances. In FG3, the indicator species Hedyosmum goutidianum, Hedyosmum luteyni, Hedyosmum racemosum, and Piper andreanum are characteristic of the tropical Andes at altitudes above 3000 m, and are widely distributed in Ecuador [46]. Hedyosmum trees presented high frequency and abundance and were the tallest and largest trees. These species are characteristic of mature forests [47,48], so their presence in this floristic group indicates a good state of conservation.

4.2. Floristic Group Composition, Diversity and Structure, and Their Relationship with Predictor Variables

Age since abandonment remarkably explained floristic composition across our plots (Table 3). Age was directly associated with FG2 and FG3, at higher altitudes (Figure 5). mean monthly precipitation was also associated with high altitude plots (Figure 5). Similarly, manganese concentration explained the floristic group composition and was associated with high altitude plots, that is, where there is greater precipitation. Manganese is associated with a growth enzymes which facilitate certain physiological processes, as well as with germination and the initial establishment of seedlings [49] that may be needed at high altitude. This variable is negatively correlated with age (where the plots of lesser age since abandonment are located—FG1) (Table S1). Therefore, the floristic groups of trees are a result of the interaction of different environmental variables. This is related to the niche theory (see introduction) which has been evaluated and corroborated in different studies on tropical forests [12,13,16].
We found species richness to respond to forest succession [50]. Richness varied significantly (Figure 4a) with higher values in FG2 and FG3, which have a higher forest age (Figure 2). Similar results has been found elsewhere [28,51]. This pattern was similar to that recorded by Yepez [28] in the Andean forests of Colombia, where species richness increases with the age since abandonment, reaching a similarity with primary forests in secondary forests over 40 years of age. Morales [51] affirms that secondary forests are less diverse than primary forests, but the diversity and richness of species increase with age, in tropical forests in Central America. This result is related to secondary succession processes where biological and environmental factors facilitate the colonization of pioneer species in abandoned agricultural areas [52,53]. As pioneers species grow in time, they fulfill vegetative and functional cycles but simultaneously modify vegetation structure [54]. Additionally, the environmental factors of the microhabitat are modified [55]. Based on these modifications, some pioneer species disappear and intermediate or climax species appear [56].
The significant variation of basal area among FG1, FG2, and FG3 (Figure 4c) was positively correlated to forest age, whit largest areas recorded in FG2 and FG3 at higher altitudes (and lower temperatures). This result is in agreement with Yepez [28] who also found basal area to increase significantly with successional age. Comparatively, this result is not consistent with some reports from Ecuador, Peru, and Bolivia [7,9], where the basal area was positively related to temperature. On another side, basal area was positively correlated with precipitation (Table S1). In particular, precipitation was associated with FG2 and FG3 located at higher altitudes, where basal area values are higher. This indicates a direct influence of the rains upon diameter growth [57].
Height (total and dominant) showed similar patterns to the basal area and were linked to age since abandonment (Figure 4c). We also found precipitation to predict tree height. These results indicate complex associations in fragmented landscapes where the low variation in precipitation interacts with other variables to explain vegetation structure [16]. Calcium, which was not retained in the forward selection procedure, was positively and significantly correlated with total height (Table S1) and mean annual precipitation. These correlations indicate that calcium may controls tree growth and height [58].

5. Conclusions

The studied forests plots are heterogeneous. Three floristic groups can be recognized by species composition and the presence of indicator species and are responsive to environmental factors. Structure variables and species richness of the plots are dependent of complex interactions of the age, climate, and soil variables. These plots could be considered as important conservation allies in the planning, ordering, and management of the few areas that remain with their forest cover in southern Ecuador.
Within floristic groups, the variation in species composition was explained by the age since abandonment, climate, and soil variables. Floristic composition was poorly influenced by spatial correlation, so the associations shown are likely to be explained by niche assembly. Similarly, complex interactions of age and climate explained quantitative parameters for richness and structure. However, age explained most response variables and is considered the most important predictor in natural regeneration processes in Tropical Montane forests within the study area.

Supplementary Materials

The following are available online at https://www.mdpi.com/article/10.3390/d13090400/s1. Table S1: Pearson’s correlations between all the variables evaluated, Table S2. Descriptive values of predictor variables recorded in 500 m2 plots, Table S3: Local results of the response and predictor variables.

Author Contributions

Conceptualization, O.J., O.C. and D.A.D.; methodology, O.J., O.C., H.C., F.B. and D.A.D.; writing—original draft preparation, O.J., D.A.D., H.C., F.B. and O.C.; writing—review and editing O.J., D.A.D. and O.C. All authors have read and agreed to the published version of the manuscript.

Funding

This research received no external funding.

Institutional Review Board Statement

Not applicable.

Data Availability Statement

The data to support the results of this research are in the supplementary files.

Acknowledgments

O.J., H.C. and F.B. thank the Research Directorate of the University of Cuenca (DIUC) for the economic financing under the research project called “Relaciones inter-específicas entre hospederos, orquídeas epífitas y microorganismos fitoestimulantes asociados a sus raíces, en bosques nativos andinos de la provincia del Azuay”. This research project was developed under the research permit No. No. 120-2016-DPAA/MAE, granted by the Ministry of the Environment of Ecuador. O.C. thank the UTPL for their support in the culmination of the manuscript. We are grateful to Luis Cayuela for his insightful comments on a previous version of the manuscript. The authors thank Diana Szekely and Gregory Gedeon for their help in the language revision. Finally, we thank the anonymous reviewers who rightly helped improve this manuscript.

Conflicts of Interest

The authors declare no conflict of interest.

References

  1. Báez, S.; Ambrose, K.; Hofstede, R. Ecological and social bases for the restoration of a High Andean cloud forest: Preliminary results and lessons from a case study in northern Ecuador. In Tropical Montane Cloud Forests: Science for Conservation and Management; Bruijnzeel, L., Scatena, F., Hamilton, L., Eds.; Cambridge University Press: Cambridg, UK, 2011; pp. 628–643. [Google Scholar]
  2. Myers, N.; Mittermeier, R.A.; Mittermeier, C.G.; Da Fonseca, G.A.; Kent, J. Biodiversity hotspots for conservation priorities. Nature 2000, 403, 853–858. [Google Scholar] [CrossRef]
  3. De la Cruz-Amo, L.; Bañares-de-Dios, G.; Cala, V.; Granzow-de la Cerda, Í.; Espinosa, C.I.; Ledo, A.; Salinas, N.; Macía, M.J.; Cayuela, L. Trade-offs among aboveground, belowground, and soil organic carbon stocks along altitudinal gradients in Andean tropical montane forests. Front. Plant Sci. 2020, 11, 106. [Google Scholar] [CrossRef] [Green Version]
  4. Rozendaal, D.M.; Chazdon, R.L.; Arreola-Villa, F.; Balvanera, P.; Bentos, T.V.; Dupuy, J.M.; Hernández-Stefanoni, J.L.; Jakovac, C.C.; Lebrija-Trejos, E.E.; Lohbeck, M. Demographic drivers of aboveground biomass dynamics during secondary succession in neotropical dry and wet forests. Ecosystems 2017, 20, 340–353. [Google Scholar] [CrossRef]
  5. Werner, F.A.; Homeier, J. Is tropical montane forest heterogeneity promoted by a resource-driven feedback cycle? Evidence from nutrient relations, herbivory and litter decomposition along a topographical gradient. Funct. Ecol. 2015, 29, 430–440. [Google Scholar] [CrossRef]
  6. Blundo, C.; Malizia, L.R.; Blake, J.G.; Brown, A.D. Tree species distribution in Andean forests: Influence of regional and local factors. J. Trop. Ecol. 2012, 28, 83–95. [Google Scholar] [CrossRef]
  7. Homeier, J.; Breckle, S.; Günter, S.; Rollenbeck, R.T.; Leuschner, C. Tree diversity, forest structure and productivity along altitudinal and topographical gradients in a species-rich ecuadorian montane rain forest. Biotropica 2010, 42, 140–148. [Google Scholar] [CrossRef]
  8. Moser, G.; Röderstein, M.; Soethe, N.; Hertel, D.; Leuschner, C. Altitudinal changes in stand structure and biomass allocation of tropical mountain forests in relation to microclimate and soil chemistry. In Gradients in a Tropical Mountain Ecosystem of Ecuador; Beck, E., Bendix, J., Kottke, I., Eds.; Springer: Berlin/Heidelberg, Germany, 2008; pp. 229–242. [Google Scholar]
  9. Girardin, C.A.; Farfan-Rios, W.; Garcia, K.; Feeley, K.J.; Jørgensen, P.M.; Murakami, A.A.; Cayola Pérez, L.; Seidel, R.; Paniagua, N.; Fuentes Claros, A.F. Spatial patterns of above-ground structure, biomass and composition in a network of six Andean elevation transects. Plant Ecol. Divers. 2014, 7, 161–171. [Google Scholar] [CrossRef]
  10. Báez, S.; Malizia, A.; Carilla, J.; Blundo, C.; Aguilar, M.; Aguirre, N.; Aquirre, Z.; Álvarez, E.; Cuesta, F.; Duque, Á. Large-scale patterns of turnover and basal area change in Andean forests. PLoS ONE 2015, 10, e0126594. [Google Scholar] [CrossRef] [PubMed]
  11. Rezende, V.L.; de Miranda, P.L.; Meyer, L.; Moreira, C.V.; Linhares, M.F.; de Oliveira-Filho, A.T.; Eisenlohr, P.V. Tree species composition and richness along altitudinal gradients as a tool for conservation decisions: The case of Atlantic semideciduous forest. Biodivers. Conserv. 2015, 24, 2149–2163. [Google Scholar] [CrossRef]
  12. Veintimilla, D.; Ngo Bieng, M.A.; Delgado, D.; Vilchez-Mendoza, S.; Zamora, N.; Finegan, B. Drivers of tropical rainforest composition and alpha diversity patterns over a 2520 m altitudinal gradient. Ecol. Evol. 2019, 9, 5720–5730. [Google Scholar] [CrossRef] [Green Version]
  13. Chain-Guadarrama, A.; Finegan, B.; Vilchez, S.; Casanoves, F. Determinants of rain-forest floristic variation on an altitudinal gradient in southern Costa Rica. J. Trop. Ecol. 2012, 28, 463–481. [Google Scholar] [CrossRef] [Green Version]
  14. Guo, Y.; Wang, B.; Li, D.; Mallik, A.U.; Xiang, W.; Ding, T.; Wen, S.; Lu, S.; Huang, F.; He, Y. Effects of topography and spatial processes on structuring tree species composition in a diverse heterogeneous tropical karst seasonal rainforest. Flora 2017, 231, 21–28. [Google Scholar] [CrossRef]
  15. Vlam, M.; Baker, P.J.; Bunyavejchewin, S.; Zuidema, P.A. Temperature and rainfall strongly drive temporal growth variation in Asian tropical forest trees. Oecologia 2014, 174, 1449–1461. [Google Scholar] [CrossRef]
  16. Castellanos-Castro, C.; Newton, A.C. Environmental heterogeneity influences successional trajectories in Colombian seasonally dry tropical forests. Biotropica 2015, 47, 660–671. [Google Scholar] [CrossRef]
  17. Duque, A.; Phillips, J.F.; von Hildebrand, P.; Posada, C.A.; Prieto, A.; Rudas, A.; Suescún, M.; Stevenson, P. Distance decay of tree species similarity in protected areas on terra firme forests in Colombian Amazonia. Biotropica 2009, 41, 599–607. [Google Scholar] [CrossRef]
  18. Hubbell, S.P. The Unified Neutral Theory of Biodiversity and Biogeography (MPB-32); Princeton University Press: Princeton, NJ, USA, 2011. [Google Scholar]
  19. Legendre, P. Studying beta diversity: Ecological variation partitioning by multiple regression and canonical analysis. J. Plant Ecol. 2008, 1, 3–8. [Google Scholar] [CrossRef] [Green Version]
  20. Curatola Fernández, G.F.; Obermeier, W.A.; Gerique, A.; López Sandoval, M.F.; Lehnert, L.W.; Thies, B.; Bendix, J. Land cover change in the Andes of Southern Ecuador—Patterns and drivers. Remote Sens. 2015, 7, 2509–2542. [Google Scholar] [CrossRef] [Green Version]
  21. Zuluaga, G.; Colorado, J.; Rodewald, A. Response of mixed-species flocks to habitat alteration and deforestation in the Andes. Biol. Conserv. 2015, 188, 72–81. [Google Scholar] [CrossRef]
  22. Chacón, G.; Gagnon, D.; Paré, D. Comparison of soil properties of native forests, Pinus patula plantations and adjacent pastures in the Andean highlands of southern Ecuador: Land use history or recent vegetation effects? Soil Use Manag. 2009, 25, 427–433. [Google Scholar] [CrossRef]
  23. Tapia-Armijos, M.F.; Homeier, J.; Espinosa, C.I.; Leuschner, C.; de la Cruz, M. Deforestation and forest fragmentation in South Ecuador since the 1970s–losing a hotspot of biodiversity. PLoS ONE 2015, 10, e0133701. [Google Scholar] [CrossRef] [Green Version]
  24. Jadán, O.; Cedillo, H.; Zea, P.; Peralta, A.; Quichimbo, P.; Vaca, C. Relación entre deforestación y variables topográficas en un contexto agrícola ganadero, cantón Cuenca. Bosques Latid. Cero 2016, 6, 1–13. [Google Scholar]
  25. Tovar, C.; Seijmonsbergen, A.C.; Duivenvoorden, J.F. Monitoring land use and land cover change in mountain regions: An example in the Jalca grasslands of the Peruvian Andes. Landsc. Urban Plan. 2013, 112, 40–49. [Google Scholar] [CrossRef]
  26. Hoffmann, C.; Márquez, J.R.G.; Krueger, T. A local perspective on drivers and measures to slow deforestation in the Andean-Amazonian foothills of Colombia. Land Use Policy 2018, 77, 379–391. [Google Scholar] [CrossRef]
  27. Rubiano, K.; Clerici, N.; Norden, N.; Etter, A. Secondary forest and shrubland dynamics in a highly transformed landscape in the Northern Andes of Colombia (1985–2015). Forests 2017, 8, 216. [Google Scholar] [CrossRef] [Green Version]
  28. Yepes, A.P.; del Valle, J.I.; Jaramillo, S.L.; Orrego, S.A. Recuperación estructural en bosques sucesionales andinos de Porce (Antioquia, Colombia). Rev. Biol. Trop. 2010, 58, 427–445. [Google Scholar]
  29. Jadán, O.; Cedillo, H.; Pillacela, P.; Guallpa, D.; Gordillo, A.; Zea, P.; Díaz, L.; Bermúdez, F.; Arciniegas, A.; Quizhpe, W. Regeneración de árboles en ecosistemas naturales y plantaciones de Pinus patula (Pinaceae) dentro de un gradiente altitudinal andino (Azuay, Ecuador). Rev. Biol. Trop. 2019, 67, 182–195. [Google Scholar] [CrossRef]
  30. Jadán, O.; Toledo, C.; Tepán, B.; Cedillo, H.; Peralta, Á.; Zea, P.; Castro, P.; Vaca, C. Comunidades forestales en bosques secundarios alto-andinos (Azuay, Ecuador). Bosque 2017, 38, 141–154. [Google Scholar] [CrossRef] [Green Version]
  31. INAMHI. Anuario Metereológico; Instituto Nacional de Metereología e Hidrología: Quito, Ecuador, 2014.
  32. Pinos-Arévalo, N.J. Prospectiva del uso del suelo y cobertura vegetal en el ordenamiento territorial-Caso cantón Cuenca. In Estoa. Revista de la Facultad de Arquitectura y Urbanismo de la Universidad de Cuenca; Universidad de Cuenca: Cuenca, Ecuador, 2016; Volume 5, pp. 7–19. [Google Scholar]
  33. MAGAP. Manual de Procedmientos de Geopedología. Proyecto de Levantamiento de Cartografía Temática a Escala 1:25000, Lotes 1 y 2; Ministerio de Agricultura y Ganaderia: Quito, Ecuador, 2015.
  34. R Core Team. R: A Language and Environment for Statistical Computing; R Foundation for Statistical Computing: Vienna, Austria, 2018. [Google Scholar]
  35. Oksanen, J.; Blanchet, F.G.; Kindt, R.; Legendre, P.; Minchin, P.; O’hara, R.; Simpson, G.; Solymos, P.; Stevens, M.; Wagner, H. Community Ecology Package; R Package Version; Vegan: Vienna, Austria, 2013; Volume 2. [Google Scholar]
  36. Bakker, J.D. Increasing the utility of indicator species analysis. J. Appl. Ecol. 2008, 45, 1829–1835. [Google Scholar] [CrossRef]
  37. De Cáceres, M.; Legendre, P.; Wiser, S.K.; Brotons, L. Using species combinations in indicator value analyses. Methods Ecol. Evol. 2012, 3, 973–982. [Google Scholar] [CrossRef]
  38. Chao, A.; Gotelli, N.J.; Hsieh, T.; Sander, E.L.; Ma, K.; Colwell, R.K.; Ellison, A.M. Rarefaction and extrapolation with Hill numbers: A framework for sampling and estimation in species diversity studies. Ecol. Monogr. 2014, 84, 45–67. [Google Scholar] [CrossRef] [Green Version]
  39. Hsieh, T.; Ma, K.; Chao, A. iNEXT Online: Interpolation and Extrapolation (Version 1.0) [Software]. 2013. Available online: http://chaostatnthuedutw/blog/software-downlod/ (accessed on 2 September 2014).
  40. Kuhn, M.; Wing, J.; Weston, S.; Williams, A.; Keefer, C.; Engelhardt, A.; Cooper, T.; Mayer, Z. Caret: Classification and Regression Training. R Package Version 6.0–84. 2019. Available online: https://CRAN.R-project.org/package=caret (accessed on 1 March 2020).
  41. Gelviz-Gelvez, S.M.; Sánchez-Montaño, L.R.; Lopez-Toledo, L.; Barragán, F. The andean forest soil seed bank in two successional stages in northeastern Colombia. Bot. Sci. 2016, 94, 727. [Google Scholar] [CrossRef] [Green Version]
  42. González, W.; Llambí, L.D.; Smith, J.K.; Gámez, L.E. Dinámica sucesional del componente arbóreo en la zona de transición bosque-Páramo en Los Andes Tropicales. Ecotrópicos 2011, 24, 60–79. [Google Scholar]
  43. Homeier, J.; Werner, F.; Gradstein, S.; Breckle, S.; Richter, M. Potential vegetation and floristic composition of Andean forests in South Ecuador, with a focus on the RBSF. Ecol. Stud. 2008, 198, 87. [Google Scholar]
  44. Sarmiento, F.O. Human impacts on the cloud forests of the upper Guayllabamba river basin, Ecuador, and suggested management responses. In Tropical Montane Cloud Forests; Hamilton, L., Juvik, J., Scatena, F., Eds.; Springer: Berlin/Heidelberg, Germany, 1995; pp. 284–295. [Google Scholar]
  45. Goodale, U.M.; Ashton, M.S.; Berlyn, G.P.; Gregoire, T.G.; Singhakumara, B.; Tennakoon, K.U. Disturbance and tropical pioneer species: Patterns of association across life history stages. For. Ecol. Manag. 2012, 277, 54–66. [Google Scholar] [CrossRef]
  46. Jørgensen, P.M.; León-Yánez, S. Catalogue of the Vascular Plants of Ecuador; Missouri Botanical Garden St. Louis: Quito, Ecuador, 1999; Volume 75. [Google Scholar]
  47. Quichimbo, P.; Tenorio, G.; Borja, P.; Cárdenas, I.; Crespo, P.; Célleri, R. Efectos sobre las propiedades físicas y químicas de los suelos por el cambio de la cobertura vegetal y uso del suelo: Páramo de Quimsacocha al sur del Ecuador. Suelos Ecuat. 2012, 42, 138–153. [Google Scholar]
  48. Liu, K.-b.; Colinvaux, P. Forest changes in the Amazon Basin during the last glacial maximum. Nature 1985, 318, 556–557. [Google Scholar] [CrossRef]
  49. Schmidt, S.B.; Husted, S. The biochemical properties of manganese in plants. Plants 2019, 8, 381. [Google Scholar] [CrossRef] [Green Version]
  50. Imai, N.; Tanaka, A.; Samejima, H.; Sugau, J.B.; Pereira, J.T.; Titin, J.; Kurniawan, Y.; Kitayama, K. Tree community composition as an indicator in biodiversity monitoring of REDD+. For. Ecol. Manag. 2014, 313, 169–179. [Google Scholar] [CrossRef]
  51. Moralez_Salazar, M.C.; Robin, L.; Gutiérrez, M.O.; Malavasi, E.O.; Bonilla, M.G. Diversidad y estructura horizontal en los bosques tropicales del Corredor Biológico de Osa, Costa Rica. Rev. For. Mesoam. Kurú 2012, 9, 19–28. [Google Scholar]
  52. Fukami, T.; Lee, W.G. Alternative stable states, trait dispersion and ecological restoration. Oikos 2006, 113, 353–356. [Google Scholar] [CrossRef]
  53. Zanini, L.; Ganade, G. Restoration of Araucaria forest: The role of perches, pioneer vegetation, and soil fertility. Restor. Ecol. 2005, 13, 507–514. [Google Scholar] [CrossRef]
  54. Guariguata, M.R.; Ostertag, R. Neotropical secondary forest succession: Changes in structural and functional characteristics. For. Ecol. Manag. 2001, 148, 185–206. [Google Scholar] [CrossRef]
  55. Fischer, J.; Lindenmayer, D.B. Landscape modification and habitat fragmentation: A synthesis. Glob. Ecol. Biogeogr. 2007, 16, 265–280. [Google Scholar] [CrossRef]
  56. Liebsch, D.; Marques, M.C.; Goldenberg, R. How long does the Atlantic Rain Forest take to recover after a disturbance? Changes in species composition and ecological features during secondary succession. Biol. Conserv. 2008, 141, 1717–1725. [Google Scholar] [CrossRef]
  57. Rowland, L.; Malhi, Y.; Silva-Espejo, J.E.; Farfán-Amézquita, F.; Halladay, K.; Doughty, C.; Meir, P.; Phillips, O.L. The sensitivity of wood production to seasonal and interannual variations in climate in a lowland Amazonian rainforest. Oecologia 2014, 174, 295–306. [Google Scholar] [CrossRef]
  58. Baribault, T.W.; Kobe, R.K.; Finley, A.O. Tropical tree growth is correlated with soil phosphorus, potassium, and calcium, though not for legumes. Ecol. Monogr. 2012, 82, 189–203. [Google Scholar] [CrossRef]
Figure 1. Plot placement and geographic location of study area in southern Ecuador.
Diversity 13 00400 g001
Figure 2. Non-multidimensional metric scaling analysis (NMDS) with three floristic groups and their indicator species of Montane Forest. The codes of the indicator species are described in Table 1. FG: floristic groups.
Diversity 13 00400 g002
Figure 3. Individuals-based abundance rarefaction (solid lines) and extrapolation (dashed lines) of diversity based on the Hill numbers q = 0, q = 1, and q = 2 for three floristic group in Montane Forest. The 95% confidence intervals (gray-shaded regions) were obtained by a bootstrap method based on 50 replications. FG: floristic group.
Diversity 13 00400 g003
Figure 4. Mean ± standard deviation of (a) richness, (b) tree density, (c) basal area, and (d) total and dominant height in three floristic groups in the Andean forests of southern Ecuador. In (d), black triangles stand for dominant height and gray triangles stand for total (average) height. Different letters represent significant differences (Anova; Fisher p < 0.05). FG: floristic group.
Diversity 13 00400 g004
Figure 5. Non-multidimensional metric scaling analysis (NMDS) to visualize the dissimilarity of floristic group composition and its relationship with environmental variables. FG: floristic group; MAT: mean annual temperature; MMP: mean monthly precipitation; SC: spatial correlation; Mn: manganese.
Diversity 13 00400 g005
Figure 6. Linear regressions between response and predictor variables (selected with forward selection). (a) age vs. species richness, (b) age vs. basal area, (c) age vs. total height, (d) mean annual precipitation vs. total height, (e) age vs. dominant height, and (f) mean annual precipitation vs. dominant height. R2: adjusted regression coefficient.
Diversity 13 00400 g006
Table 1. Indicator species for each floristic group and successional status of Montane Forest.
Species-CodeFloristic Groupp
Hesperomeles ferruginea (Pers.) Benth. - HesfeFG10.01
Myrsine dependens (Ruiz & Pav.) Spreng. - Myrde<0.0001
Gaiadendron punctatum (Ruiz & Pav.) G. Don - GaipuFG20.04
Gynoxys azuayensis Cuatrec. - Gynaz<0.0001
Gynoxys hallii Hieron. - Gynha0.002
Hedyosmum cumbalense H. Karst. - Hedcu<0.0001
Ocotea infrafoveolata van der Werff - Ocoin<0.0001
Ageratina dendroides (Spreng.) R.M. King & H. Rob. - AgedeFG30.02
Hedyosmum goudotianum Solms - Hedgo<0.0001
Hedyosmum luteynii Todzia - Hedlu<0.0001
Hedyosmum racemosum (Ruiz & Pav.) G. Don - Hedra<0.0001
Meriania tomentosa (Cogn.) Wurdack - Merto0.02
Nectandra sp. - Necsp0.03
Piper andreanum C. DC. - Pipan<0.0001
Table 2. Species richness (q = 0), exponential of Shannon index (q = 1), and inverse of Simpson index (q = 2) based on the Hill numbers obtained by a bootstrap method based on 50 replications, for three floristic group in Montane Forest.
Floristic GroupsDiversityObservedEstimatedS. E.
FG1q = 04149.36.9
q = 116.1170.9
q = 28.68.70.7
FG2q = 05068.312.2
q = 120.421.81.1
q = 212.7130.7
FG3q = 03443.36.8
q = 116.4191.7
q = 210.110.71.2
Table 3. Significant predictors variables with the NMDS ordination.
Predictor VariablesNMDS Axis 1NMDS Axis 2r2p
Age since abandonment0.9−0.050.70.001
Mean monthly precipitation0.50.80.70.001
Spatial correlation0.8−0.60.20.066
Manganese0.50.80.40.006
Publisher’s Note: MDPI stays neutral with regard to jurisdictional claims in published maps and institutional affiliations.

