Abstract
Recently metamorphosed amphibians transport substantial biomass and nutrients from wetlands to terrestrial ecosystems. Previous estimates (except 1) were limited to either a subset of the community or a single year. Our goal was to examine temporal variability in biomass export of all amphibians within breeding ponds and the composition of that export. We completely encircled ponds with drift fences to capture, count, and weigh emerging recently metamorphosed individuals in Maine (four wetlands, six years) and Missouri (eight wetlands, 2–4 years). We estimated total amphibian biomass export, export scaled by pond surface area, species diversity, and percentage of biomass from anurans. Biomass export and export composition varied greatly among ponds and years. Our estimates were of similar magnitude to previous studies. Amphibian biomass export was higher when species diversity was low and the proportion of anurans was higher. Biomass estimates tended to be highest for juvenile cohorts dominated by a single ranid species: green frogs (Missouri) or wood frogs (Maine). Ranid frogs made up a substantial proportion of amphibian biomass export, suggesting that terrestrial impacts will likely occur in the leaf litter of forests. Future studies should examine the impacts of ranid juveniles on terrestrial ecosystem dynamics.
1. Introduction
Spatial subsidies occur when one ecosystem provides resources to another [1]. This resource transfer can have large effects on recipient ecosystems, including both bottom-up effects through the movement of nutrients and energy [2,3] and top-down effects through movements of animal consumers [4,5]. Additionally, subsidies can have implications for society, such as supporting ecosystem services like pollination and nutrient cycling [6,7] and transporting contaminants that are stored in animal tissues (e.g., heavy metals and persistent organic compounds [8,9,10]). The amount of subsidy varies among and within ecosystems reviewed in [11], which greatly affects how that subsidy influences the recipient system. Given the potential importance of these subsidy effects, it is crucial to quantify the magnitude of resource exports, their variability, and what factors alter that magnitude.
Aquatic-terrestrial linkages are widespread and constitute a large portion of current spatial subsidy research [11]. These linkages probably have the most diverse and precise estimates of spatial subsidy magnitude, but most work has focused on streams [12]. Geographically isolated wetlands make up a substantial portion of freshwater worldwide [13], yet we know very little about their connections to terrestrial systems [12,14]. Maintaining the connections is likely key for conserving ecosystem function and the species that use these wetlands as habitat [15]. Previous work has shown that a single wetland can export over a metric ton of amphibian biomass as recently metamorphosed individuals (i.e., metamorphs [15]) that have a high commercial value [16]. Amphibian biomass export is also much greater than aquatic insect biomass export from the same wetlands [17,18].
We know very little about spatial and temporal variation in amphibian biomass exports. Most studies focus on a subset of the amphibian community (typically 1–3 species [19,20,21]) or a small number of wetlands (1–8) over a single year [15,17,18,20,22], because the data collection for these estimates requires significant time and effort. Estimates from multiple wetlands over multiple years for the whole amphibian community would provide important information on variability among years and sites. These data could also be used to determine what environmental factors affect amphibian biomass export. From the limited data available, shorter hydroperiods tend to increase amphibian biomass export, likely due to lower predator densities [18]. Small wetlands tend to export greater amphibian biomass per unit area than large wetlands [17], which may also be related to hydroperiod and/or predator densities. Low light availability can also limit amphibian biomass productivity through lowered primary production [22]. Other environmental variables are known to affect amphibian survival and size at metamorphosis (e.g., contaminants, pathogens) and are thus likely to affect amphibian biomass export as well.
Amphibian biomass export can have various effects on terrestrial ecosystems. Recently metamorphosed individuals can have very high mortality (75–95%) during the first few months in some terrestrial ecosystems [22,23]. These recently metamorphosed individuals provide prey for terrestrial predators, carcasses for scavengers, or nutrients for decomposers and/or plants (Pauley and Earl, unpubl. data) depending on whether mortality is caused by predation or other causes (e.g., desiccation, disease, starvation). Amphibian tissue contains high amounts of certain nutrients (e.g., P, Ca) [21,23,24], as well as long-chain polyunsaturated fatty acids (e.g., EPA, DHA), which are needed by terrestrial consumers [25]. The juveniles that survive become consumers in the terrestrial ecosystem with the potential to cause top-down effects by consuming terrestrial invertebrates [4]. As ectotherms, amphibians transform a high proportion of their prey’s energy into their own tissue, allowing for nutrient storage and efficient transfer to higher trophic levels [26]. Beetles, true bugs (i.e., Hemiptera), spiders, ants, and worms are common prey for recently metamorphosed amphibians, but dietary preferences vary among species [27,28,29,30]. Differences in diet are important in determining subsequent effects on ecosystem processes like decomposition, pollination, and nutrient cycling [31].
By examining amphibian biomass export as a whole, we can get a general idea of potential effects on terrestrial ecosystems. However, treating amphibians as a single homogenous entity obscures their different functional roles. The three broad groups—ground-dwelling anurans, treefrogs, and caudates—occupy substantially different habitats and likely have different ecosystem effects, notwithstanding more subtle differences among particular species (e.g., differences in prey or microhabitat preferences). Unfortunately, the different effects of these groups are not well described or quantified [31]. Understanding which taxonomic or functional groups tend to dominate amphibian biomass export would inform future studies of terrestrial ecosystem effects.
The goal of this study was to expand on previous work by estimating amphibian biomass export for 12 geographically isolated wetlands monitored for 2–6 years. These data allowed us to better understand the magnitude, characteristics, and temporal and spatial variability of amphibian biomass export. To do so, we made estimates for ponds at three sites in Missouri and one site in Maine using very similar methods for a regional comparison. We examined total amphibian biomass export, amphibian biomass export scaled by pond surface area, species diversity of the amphibians contributing to biomass export, and proportion of export coming from anurans to better identify potential effects on the recipient terrestrial ecosystem. We further examined relationships among these variables and the effects of summer rainfall (a proxy for variation in hydroperiod and pond volume) and pond surface area on biomass export and the community composition of that export. We predicted that greater summer rainfall would decrease amphibian biomass export, as previous work shows that shorter hydroperiods lead to greater amphibian biomass export [18]. We also predicted that total amphibian biomass export would increase with pond area, but that biomass scaled by pond area would be highest for the smallest ponds [17].
2. Materials and Methods
2.1. Study Sites
We examined biomass export at one site in Maine and three sites in central Missouri, USA. In Maine, we collected data on four ponds (124.5–643.9 m2 surface area) in the Dwight B. Demerritt and Penobscot Experimental Forests (Penobscot County) over six years (2004–2009) [32]. In Missouri, we collected data on five ponds (161.1–336.2 m2) in Daniel Boone Conservation Area (DBCA, Warren County, OH, USA) over four years (2004–2007), two ponds at the University of Missouri’s Thomas S. Baskett Wildlife Research and Education Area (hereafter referred to as the Baskett Wildlife Area; Boone County, KY, USA) over three years (2000–2002) [33], and one pond in Mark Twain National Forest (Boone County; about 3 km from sites at Baskett Wildlife Area) for two years (2001–2002) [34]. Ponds at Baskett Wildlife Area and Mark Twain National Forest were less than 400 m2, but their specific dimensions were not measured.
All ponds were fishless and permanent or nearly permanent except for pond two at Baskett Wildlife Area, which dried most summers. Ponds in Maine were artificially drained after the juvenile emergence period was complete in fall 2007 and 2008 to reduce abundances of invertebrate predators. Ponds in Maine were surrounded by second-growth mixed coniferous and deciduous forest with a canopy consisting of balsam fir (Abies balsamea), eastern white pine (Pinus strobus), northern white cedar (Thuja occidentalis), red maple (Acer rubrum), eastern hemlock (Tsuga canadensis), northern red oak (Quercus rubra), and paper birch (Betula papyrifera). Understory trees included American beech (Fagus grandifolia), bigtooth aspen (Populus grandidentata), quaking aspen (Populus tremuloides), and balsam poplar (Populus balsamifera) [32,35]. In Missouri, ponds at DBCA and Baskett Wildlife Area were surrounded by second-growth oak-hickory hardwood forest with a canopy consisting primarily of white oak (Quercus alba), northern red oak (Quercus rubra), and various species of hickory (Carya spp.) with an understory of sugar maple (Acer saccharum) and flowering dogwood (Cornus florida) [33]. The pond at Mark Twain National Forest (edge pond) was located on a forest-grassland habitat edge with similar oak-hickory forest on the west side and grassland on the east side, including mostly Indian grass (Sorghastrum nutans) and big bluestem (Andropogon gerardii) with some fescue (Festuca arundinacea) [34].
Terrestrial habitat around ponds at Baskett Wildlife Area and Mark Twain National Forest was not altered during the study. Forestry practice treatments were applied to the terrestrial habitat around ponds in Maine and at DBCA in Missouri as part of the Land-use Effects on Amphibian Populations (LEAP) project [35,36]. Treatments extended 164 m from each pond’s edge, and that circular area was divided into four quadrants, each receiving one of four forestry treatments: control (uncut), partial cut of 50% canopy cover in Maine [35] and 60% in Missouri [37], clearcut with downed wood removed, and clearcut with downed wood retained. Treatments were randomly assigned, but the two clearcut treatments were always placed opposite each other. Forestry treatments were implemented from November 2003 to April 2004 in Maine [35] and March 2004 to January 2005 in Missouri [37].
2.2. Data Collection
To estimate amphibian biomass export as newly metamorphosed individuals, we completely encircled each pond with a drift fence with paired pitfall traps placed on each side of the fence and buried so the tops were flush with the ground. In Maine, drift fences were 1-m-tall silt fences buried approximately 30 cm underground [32,35]. In Missouri, drift fences were aluminum flashing also buried about 30 cm underground but extending 60 cm above ground [33]. In Maine, pitfall traps were #10 aluminum cans (16.2 cm diameter, 17.8 cm deep) placed every 5 m along the fence. In Missouri at Baskett Wildlife Area and Mark Twain National Forest, pitfall traps were also #10 cans and were placed every 4.5 m along the fence. At DBCA, pitfall traps were plastic nursery pots (23.0 cm diameter, 24.0 cm deep) and were placed every 3 m. In Missouri, due to hotter, drier summers, a wooden board was held 4 cm above each trap to reduce predation, primarily by racoons, and a moist sponge was placed in the bottom of each trap to prevent desiccation [33,34]. Standing water was removed from all traps as needed to prevent drowning. Pitfall traps were open late June/early July to September in Maine [32,35]. In Missouri, traps were open February to early November at DBCA [37,38], year-round from April 2000 to September 2003 at Baskett Wildlife Area [33], and year-round from March 2001 to October 2002 at Mark Twain National Forest [34]. The trapping periods would have captured all or almost all emerging juveniles each year [33].
Traps were checked every 1–3 days depending on capture rates and time of year, such that traps were checked more frequently in hot, dry weather and during times of high amphibian movement. We recorded the date, species, age class, and trap number for each individual captured. Newly metamorphosed individuals found inside the pond drift fence were released on the opposite side of the fence, recorded as metamorphs, and included in amphibian biomass export estimates. Some species were marked as part of other studies [34,35,37,38]. Unmarked juveniles/newly metamorphosed individuals trying to reenter the pond were not released inside the pond fence to avoid double counting individuals. Drift fences and pitfall traps were not entirely effective at capturing individuals from the family Hylidae, including cricket frogs, spring peepers, chorus frogs, and gray treefrogs due to their ability to climb over fences. Recently metamorphosed wood frogs were also not always captured in the Missouri LEAP pitfall traps, and hand captures were used to record some of those individuals produced by the ponds (Rittenhouse and Harper, pers. obs.). As a result, the contribution of hylids and wood frogs in Missouri to biomass export was likely underestimated.
At each pond in Maine and DBCA, we estimated pond length and width using a laser rangefinder (Yardage Pro® Sport 450, Bushnell, Overland Park, KS, USA). Pond surface area was estimated using the formula for an ellipse. To estimate rainfall in Maine and near DBCA, we downloaded monthly precipitation data for 2004–2009 from Climate Data Online through the National Oceanic and Atmospheric Administration (ncdc.noaa.gov, accessed on 2 November 2021) for the weather stations closest to each site: the Hermann, MO weather station near DBCA and the Bangor International Airport near the Maine sites.
To estimate amphibian biomass export as wet mass, we multiplied the number of recently metamorphosed individuals for each species in each year times the average individual mass for that species and summed the mass of all species in each pond in each year. The dominant species were weighed after capture in pitfall traps, and the mean mass for each species was used in biomass estimates. We used published data on mass at metamorphosis for less abundant species (Table 1 and Table 2). We attempted to find estimates close to the appropriate field site and under field conditions to account for potential geographic differences in mass at metamorphosis, but that was not always possible.

Table 1.
Recently metamorphosed species produced by Maine ponds, range of abundance per pond per year, mean wet mass at metamorphosis used in biomass estimates, and the source for individual mass estimates.
Table 2.
Recently metamorphosed species produced by Missouri ponds, range of abundance per pond per year, mean wet mass at metamorphosis used in biomass estimates, and the source for individual mass estimates.
2.3. Data Analysis
For each pond in each year, we estimated total amphibian biomass export as recently metamorphosed individuals (wet mass in g), amphibian biomass export scaled by pond surface area (kg/ha), proportion of biomass from anurans, species richness contributing to biomass, and the Shannon diversity index. Information on pond surface area was not available for ponds at Baskett Wildlife Area and Mark Twain National Forest, so we could not make estimates that scaled by pond area, and these ponds were not used in further analysis.
To better understand which variables affected amphibian biomass export, we used mixed effect models implemented in program R (version 3.6.2) using the package lmerTest (version 3.1-3) [52]. Data for each pond in Maine and DBCA in each year were the replicate data points. We first examined correlations among species richness, the Shannon diversity index, and the proportion of biomass from frogs. Richness and the Shannon diversity index were highly correlated (r = 0.79), so we only included the Shannon diversity index in models, because it is a continuous variable with greater variability. For total summer rainfall, we summed the rainfall (cm) for June, July, and August when most recently metamorphosed individuals emerge. To model total biomass export (1) and export per pond area (2), mixed effect linear models were used (formatted using recommendations of Zuur and Ieno [53]):
where √TotalBiomassij is the square root of the total biomass export observation from the ith pond in the jth year in each region (1), and √BiomassPerAreaij is the square root of the biomass export per pond area observation from the ith pond in the jth year in each region. All independent variables are fixed effects, except for β6j and β7i, which are random intercepts assumed to be normally distributed with mean zero and variances σj2 and σi2, respectively. Pond ID and year in each region were used as random effect terms in all models to account for a lack of independence among estimates from the same pond in different years and from the same year in different ponds due to common weather conditions, respectively. To model diversity (3) and the proportion of biomass from anurans (4), mixed effect linear models were also used:
where Diversityij is the Shannon diversity index from the i-th pond in the j-th year in each region (3), and sin−1(PropAnuranij) is the arcsine of the proportion of biomass coming from anurans from the i-th pond in the j-th year in each region (4). All independent variables are fixed effects, except for β6j and β7i, which are random intercepts assumed to be normally distributed with mean zero and variances σj2 and σi2, respectively. We square root transformed total biomass export and export per pond area and arcsine transformed the proportion of biomass from anurans to meet model assumptions of normality (assessed with the Shapiro-Wilk test) and homoscedasticity. We assessed the fit of these models using the marginal r2 for mixed models [54] implemented through the MuMIn R package (version 1.43.17) [55].
| √TotalBiomassij | ~N (μij, s2) | (1) |
| E(√TotalBiomassij) | = μij | |
| μij | = β0 + β1Region + β2PondAreai + β3Rainfallj + β4Diversityij + β5PropAnuranij + β6jYearj + β7i Pondi | |
| β6j | ~N(0, σj2) | |
| β7i | ~ N(0, σi2) | |
| √BiomassPerAreaij | ~N (μij, s2) | (2) |
| E(√BiomassPerAreaij) | = μij | |
| μij | = β0 + β1Region + β2PondAreai + β3Rainfallj + β4Diversityij + β5PropAnuranij + β6jYearj + β7i Pondi | |
| β6j | ~ N(0, σj2) | |
| β7i | ~ N(0, σi2) | |
| Diversityij | ~ N (μij, s2) | (3) |
| E(Diversityij) | = μij | |
| μij | = β0 + β1Region + β2PondAreai + β3Rainfallj + β6jYearj + β7i Pondi | |
| β6j | ~ N(0, σj2) | |
| β7i | ~ N(0, σi2) | |
| sin−1(PropAnuranij) | ~ N (μij, s2) | (4) |
| E(sin−1(PropAnuranij)) | μij | |
| μij | = β0 + β1Region + β2PondAreai + β3Rainfallj + β6jYearj + β7i Pondi | |
| β6j | ~ N(0, σj2) | |
| β7i | ~ N(0, σi2) | |
3. Results
3.1. Amphibian Biomass Export
In Maine, biomass export of recently metamorphosed individuals varied three orders of magnitude from 0–1822 g wet mass/year and averaged 436 g ± 88 wet mass/year per pond (mean ± standard error). In Missouri, amphibian biomass export was higher and ranged two orders of magnitude from 166–4062 g wet mass/year and averaged 1400 g ± 150. These amounts varied greatly both within and among ponds, though some ponds were more variable than others (Figure 1). When standardized by pond area, much of the variation persisted (Figure 2). Export per pond area was generally lower than that reported by Gibbons et al. [15] for a Carolina bay in South Carolina, but one pond in Missouri exceeded their estimate in one year by 33%.
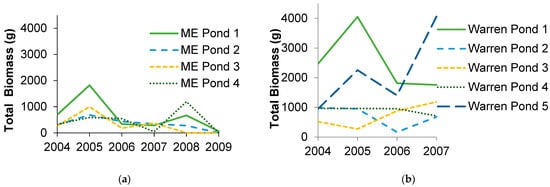
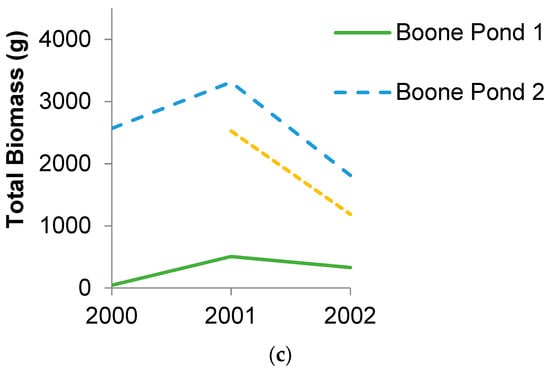
Figure 1.
Total amphibian wet biomass export for (a) four ponds in Penobscot County, Maine (ME) over six years, (b) five ponds in Warren County, Missouri (DBCA) over four years, and (c) three ponds in Boone County, Missouri over two to three years (ponds 1 and 2: Baskett Wildlife Area, edge pond: Mark Twain National Forest).
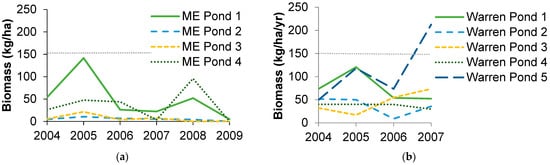
Figure 2.
Amphibian wet biomass export per wetland area for (a) four ponds in Penobscot County, Maine (ME) over six years and (b) five ponds in Warren County, Missouri (DBCA) over four years. Gray line represents amphibian biomass export from a Carolina bay in South Carolina [15].
Total amphibian biomass export was affected by region, species diversity, and the proportion of biomass coming from anurans (Table 3). Biomass export was higher in Missouri than Maine, had a negative relationship with species diversity, and had a positive relationship with the proportion of biomass from anurans. Ponds had higher biomass export when there was a less diverse community of amphibians with a higher proportion of frogs. Biomass export per pond area was affected by region and species diversity. Biomass export per wetland area was higher in Missouri than Maine and had a negative relationship with species diversity. Thus, the biomass per area was higher for less diverse amphibian communities.
Table 3.
Results from mixed models predicting the effects of different variables on amphibian biomass export from geographically isolated wetlands and the community composition of that export. All models had pond and year × region as random variables to account for the lack of independence of biomass estimates from the same pond and from the same year in the same region. Regions included Missouri (MO) and Maine (ME), USA. N = 46 for total biomass export and biomass export per wetland area. N = 45 for diversity and proportion of biomass from anurans, because one pond produced zero juveniles one year. r2 = marginal r2 for mixed effect models.
3.2. Species Composition and Diversity
The number of species comprising amphibian biomass export was generally higher in Missouri than Maine. In Maine, biomass export was dominated by wood frogs and occasionally spotted salamanders. Green frogs also contributed in 2007 and three other species contributed recently metamorphosed individuals in some ponds in some years (Table 1). In Missouri, the highest proportion of biomass export came from three species: spotted salamanders, ringed salamanders, and green frogs, but southern leopard frogs, wood frogs, eastern newts, and American toads sometimes also had large number of recently metamorphosed individuals (>100). Five other species also contributed recently metamorphosed individuals at some ponds in some years (Table 2). The composition of the amphibian biomass export was generally dominated by anurans, but the percentage of biomass from anurans ranged 0.0–100.0% and averaged 79.7 ± 5.8% in Maine and ranged from 2.8–96.1% and averaged 59.8 ± 4.8% in Missouri (Figure 3). In Missouri, the most dominant species (in terms of biomass) in a given pond varied by year, except in three ponds at Daniel Boone Conservation Area, where green frogs always had more biomass than any other species. Across all Missouri sites, green frogs dominated biomass most often, followed by spotted salamanders, ringed salamanders, southern leopard frogs, and wood frogs. In general, years with greater overall biomass export also tended to be highly dominated by green frogs. There were 13 instances where the total biomass was greater than 1000 g, and nine of those were dominated by green frogs (≥58% of biomass). Two ponds produced over 4000 g of wet biomass in a single year, and green frogs made up over 85% of that biomass. When ambystomatid salamanders were dominant in biomass, overall amphibian biomass export estimates tended to be lower. The reason for this varied by state. In Maine, ponds produced many more individual wood frogs (mean 586/pond/year, maximum 2626) than ambystomatid salamanders (67/pond/year, maximum 356), which have similar individual mass. In Missouri, ponds produced similar numbers of green frogs (297/pond/year, maximum 2106) and ambystomatid salamanders (419/pond/year, maximum 1753), but green frogs have more than twice the average individual mass (Table 2).
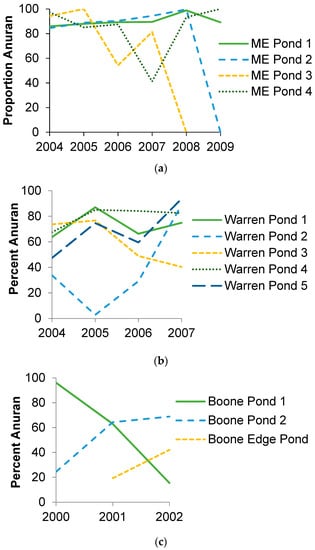
Figure 3.
Percent of amphibian biomass export coming from anurans for (a) four ponds in Penobscot County, Maine (ME) over six years, (b) five ponds in Warren County, Missouri (DBCA) over four years, and (c) three ponds in Boone County, Missouri over two to three years (ponds 1 and 2: Baskett Wildlife Area, edge pond: Mark Twain National Forest).
Amphibian species diversity (i.e., Shannon diversity index) was higher in Missouri than in Maine, but the proportion of biomass coming from anurans was higher in Maine than Missouri (Table 3). Pond area and rainfall had no effect on species diversity or the proportion of biomass coming from anurans.
4. Discussion
Amphibian biomass export in the form of recently metamorphosed individuals is an important connection from geographically isolated wetlands (e.g., ponds, vernal pools, Carolina bays) to surrounding terrestrial ecosystems. We found that the magnitude of amphibian biomass export in Missouri and Maine was highly variable among ponds and years, as was the composition of that biomass. Our study is one of two [56] to present data on the entire amphibian community from multiple wetlands over multiple years (Table 4). Our estimates and many others are likely underestimates due to the inability of pitfall traps to effectively capture hylids, which Fritz and Whiles [17] have shown can make up a substantial portion of biomass export in Illinois. To enable a rough comparison with other studies, we converted all published estimates of amphibian biomass export to common units using the conversion factor of 0.1572 to transform wet mass into grams ash-free dry mass/m2/year [17] (Table 4). Our study sites show values within the range of other studies, though estimates from Ontario are much greater than all other estimates. Of course, there is no way to know whether the single year studies represent typical years, which could bias our perception of amphibian biomass export [21]. Our wetlands had primarily permanent hydroperiods, which may have limited biomass export from the accumulation of predators. Most of the highest estimates come from smaller ponds that dry yearly and likely have lower predator densities [17,18].
Table 4.
Comparison of amphibian biomass export per wetland per year.
Amphibian biomass export was primarily affected by species composition. Total biomass export and biomass export per pond area were greater when diversity was low. Amphibian biomass export tended to be greatest when a single species was dominant and had an extremely productive year. Amphibians are known for their population fluctuations [57,58,59], and the peaks of these fluctuations for dominant species likely correspond to years of high biomass export. There were certain species that tended to be dominant. In Missouri, green frogs’ ability to overwinter as larvae and their large size at metamorphosis may have contributed to their dominance of biomass export. In Maine, the instances of high amphibian biomass export were dominated by recently metamorphosed wood frogs, which is consistent with data from Ontario [18]. The South Carolina estimate consisted of over 95% southern leopard frogs [15], which did occasionally dominate amphibian biomass export in Missouri. When other species, particularly ambystomatid salamanders, were dominant in biomass, overall amphibian biomass export estimates tended to be lower. The reason for this varied by state. In Maine, ponds produced higher mean and maximum numbers of wood frogs than ambystomatid salamanders. In Missouri, ponds produced similar numbers of green frogs and ambystomatid salamanders, but the weight of an individual green frog is more than twice that of an ambystomatid salamander (Table 2).
Trophic position is likely important in regulating amphibian biomass export. We found a positive relationship between total biomass export and the proportion of biomass coming from anurans, which corresponds to the patterns of dominance by ranid frogs. It has previously been suggested that the trophic level of larval anurans versus caudates may influence their net flux of biomass between aquatic and terrestrial ecosystems. The net flux of biomass is estimated by comparing the biomass input to aquatic systems in the form of egg masses (or more rarely larvae [20]) to the biomass export from aquatic to terrestrial systems in the form of emerging juveniles [19,21,24]. The net flux of salamander biomass tends to be imported into ponds [19,20], while the net flux of many anurans is exported to the terrestrial ecosystem [21,24] when examining each species individually. It may be that salamander larvae are more likely to be food limited as predators than tadpoles [24], which as omnivores have a variety of food sources to utilize [60]. When examining the whole amphibian community, salamanders likely limit total amphibian biomass export by eating tadpoles, thereby limiting anuran juvenile production and total biomass export overall.
In our study, we found regional differences in both biomass export and species composition. Missouri had greater amphibian biomass export overall and scaled by wetland area than Maine. This does not appear to be representative of a general latitudinal relationship (Table 4), as seen by the high biomass export per wetland area in Ontario [18]. Differences between Missouri and Maine may thus be due to site characteristics, though we are unable to identify the specific factors underlying these differences. Previous work in mesocosms shows that canopy cover and leaf litter input (both quantity and composition) can be important variables not accounted for in this study [44,61,62]. Missouri also had higher amphibian diversity but lower proportion of biomass that was anurans when compared to Maine. Differences in diversity were expected, because these regional differences are well known. The percentage of biomass from anurans varied from 0–100% among wetlands in both regions but averaged 80% in Maine and 60% in Missouri. Missouri’s lower percentage is likely due to more instances where either spotted or ringed salamanders dominated biomass export.
Pond size and rainfall were not important variables for amphibian biomass export in our study, contrary to predictions. Fritz and Whiles [17] found that extremely small ponds (<70 m2) in Illinois produced the greatest amphibian biomass export per wetland area. These ponds were much smaller than any pond in our study, which may have limited our ability to detect this trend. We also found no effect of summer rainfall, which may be because all of our ponds were permanent except one. The hydroperiods of temporary ponds are greatly affected by rainfall amount, and ponds with shorter hydroperiods can produce greater amphibian biomass export [18]. It is likely that unmeasured environmental variables contributed to the large variability in amphibian biomass export. Future studies should examine additional variables (e.g., primary productivity, canopy cover, herbaceous vegetation) to better understand how wetland characteristics affect amphibian biomass export.
In addition to clarifying the role of wetland characteristics on amphibian biomass export, there is need for further investigation of the implications of these exports for surrounding terrestrial ecosystems. Amphibian juveniles’ roles in terrestrial ecosystems have not been explicitly studied [31], making this a key area for future research. Ponds with the highest biomass export tend to be dominated by ranids this study [15,18], and hylids [24], suggesting that the largest ecosystem impacts will be in forest-floor leaf litter (ranids) and the understory vegetation hylids, [63] rather than in soil. Research on juvenile effects on terrestrial ecosystems in eastern North America should focus on green frogs, wood frogs, southern leopard frogs [15], chorus frogs [24], and gray treefrogs [24]. If juveniles have similar effects to adults, then we could use adult studies to infer potential effects. Most work on adult effects on terrestrial ecosystems has focused on salamanders, which can reduce decomposition through the consumption of detritivores [64,65]. Research on anurans shows they can alter terrestrial nutrient cycling [66,67] and reduce herbivory [68,69], but none of these studies include ranids or hylids. These potential effects would be a good starting place for research on the effects of amphibian biomass export on surrounding terrestrial ecosystems.
Ultimately, the effects of juvenile amphibians on terrestrial ecosystems depend on their density and fate in becoming predators, prey, or carcasses (e.g., through desiccation, disease, starvation). Juvenile density is determined by the number of recently metamorphosed individuals leaving the wetland, movement patterns [70,71], and spatial distributions of mortality [72]. Juveniles are generally found closer to the pond edge than adults, typically less than 100 m [73,74], with frogs moving farther than salamanders [75]. The spatial distribution of surviving juveniles will determine where we expect to see the strongest effects of juvenile amphibians as predators. Juvenile mortality events and thus nutrient additions to predators, scavengers, decomposers, and/or plants are likely concentrated closer to the pond’s edge than surviving individuals [72]. Recent work on amphibian stoichiometry suggests that even when there is a net flux of amphibian biomass into ponds, there is still often export of phosphorus and calcium to the terrestrial ecosystem [21,23,24], which are important limiting nutrients for terrestrial primary production [76,77]. Total amphibian biomass export appears to be the best predictor of amphibian element transfer to terrestrial systems, but species differences in stoichiometry can also be important [78].
We separated data by anurans versus caudates because of their different ecological roles. In future work, it would be useful to differentiate forest-floor anurans from treefrogs, because they also likely have distinct impacts on terrestrial ecosystems, though these have not been well defined [31]. Treefrogs likely consume very different prey items because of differences in invertebrate species composition of the understory vegetation and leaf litter. We did not separate them, because the ability of treefrogs to escape our pitfall traps meant that we were not confident in the accuracy of our treefrog biomass export estimates. Fritz and Whiles [24] were able to estimate treefrog biomass export through larval sampling combined with tracking tadpole developmental stage. Using this method, they found that recently metamorphosed gray treefrogs (Hyla chrysoscelis and versicolor combined) made up a third or more of amphibian biomass export from five of seven ponds in Illinois, as did chorus frogs (Pseudacris crucifer and triseriata combined). Future work should aim to obtain better estimates of hylid biomass export and corresponding impacts on terrestrial ecosystems.
Our work and others show that amphibians represent an important aquatic-terrestrial linkage with the potential to alter community dynamics and ecosystem processes in recipient terrestrial ecosystems [31]. Biomass export tended to be higher when the diversity of recently metamorphosed individuals was lower and there was a higher proportion of anurans, particularly ranid frogs. However, we still know very little about what environmental conditions alter the magnitude and composition of amphibian biomass export and how that will affect the surrounding terrestrial ecosystem. Amphibian populations are susceptible to many types of anthropogenic change, but it is unclear how this might affect amphibian biomass export. Any type of anthropogenic change that decreases larval survival and/or size at metamorphosis may decrease amphibian biomass export. Changes that alter juvenile survival may also alter how that biomass export impacts terrestrial ecosystems. Additionally, some pond-breeding amphibians are invasive species around the world (e.g., Rhinella marina, Lithobates catesbeianus), which may create novel aquatic-terrestrial linkages through biomass export or replace native amphibian biomass export to affect terrestrial ecosystems in new ways. Increasing our knowledge of these processes could aid in maintaining and restoring amphibians’ functional roles in ecosystems and mitigating impacts by invasive species.
Author Contributions
Conceptualization, J.E.E.; methodology, J.E.E., M.L.H.J. and B.B.R.; formal analysis, J.E.E.; investigation, S.M.B., J.E.E., E.B.H., D.J.H., J.R.J., M.S.O., D.A.P., V.D.P., T.A.G.R. and B.B.R.; data curation, T.A.G.R., D.J.H., E.B.H., D.A.P., V.D.P.; writing—original draft preparation, J.E.E.; writing—review and editing, J.E.E., S.M.B., E.B.H., M.L.H.J., D.J.H., J.R.J., D.A.P., V.D.P., T.A.G.R. and B.B.R.; visualization, J.E.E.; project administration, M.L.H.J. and B.B.R.; funding acquisition, M.L.H.J. All authors have read and agreed to the published version of the manuscript.
Funding
This research was funded by U. S. Geological Survey 01CRAG0007 and the National Science Foundation DEB-0239943 and DEB-0239915. This work was partially conducted while a Postdoctoral Fellow (J.E.E.) at the National Institute for Mathematical and Biological Synthesis, an Institute sponsored by the National Science Foundation, the US Department of Homeland Security, and the US Department of Agriculture through NSF Award #EF-0832858, with additional support from The University of Tennessee, Knoxville.
Institutional Review Board Statement
The study was approved by the Animal Care and Use Committee of the University of Missouri (protocol 3368) and University of Maine (protocols A2003-01-01 & A2006-03-03) and by the Missouri Department of Conservation (permits 11390, 11140) and the Maine Department of Inland Fisheries and Wildlife (permits 04-226,05-281,06-377,07-184).
Data Availability Statement
The data presented in this study are openly available in the Knowledge Network for Biocomplexity at doi:10.5063/F1S46QCV.
Acknowledgments
This paper is dedicated to the life and work of Raymond D. Semlitsch, without whom this project would not have been possible. We would like to thank K. Aldeman, T. Altnether, S. Altnether, S. Crouch, J. Deters, M. Doyle, S. James, D. Johnson, G. Johnson, B. Maltais, C.R. Mank, N. Mills, C. Rittenhouse, Z. Slinker, S. Spears, B. Williams for help with field work and data collection at the Missouri sites. We appreciate the support provided by the Missouri Department of Conservation with special thanks to J. Briggler and G. Raeker and to J. Millspaugh and the University of Missouri Department of Fisheries and Wildlife for access to the Baskett Wildlife Area sites. At the Maine field sites, we thank V. Babcock, A. Barker-Hoyt, S. Barteaux, J. Bertman, A. Callahan, C. Corcoranquadt, I. Crabtree, M. Day, R. Dionne, B. Ferry, S. Fitzpatrick, J. Hunter, L. Kling, L. Leighton, K. Matilus, C. Nelson, D. Oscarson, B. Shaw, S. Smietana, D. Veverka, K. Webster, M. Whitby, A. Wolf, and E. Wright for their help in the field and lab. Any use of trade, firm, or product names is for descriptive purposes only and does not imply endorsement by the U.S. Government. The findings and conclusions in this article are those of the authors and do not necessarily represent the views of the U.S. Fish and Wildlife Service, National Oceanographic and Atmospheric Administration, or U.S. Department of Commerce.
Conflicts of Interest
The authors declare no conflict of interest. The funders had no role in the design of the study; in the collection, analyses, or interpretation of data; in the writing of the manuscript, or in the decision to publish the results.
References
- Polis, G.A.; Anderson, W.B.; Holt, R.D. Toward an integration of landscape and food web ecology: The dynamics of spatially subsidized food webs. Annu. Rev. Ecol. Syst. 1997, 28, 289–316. [Google Scholar] [CrossRef] [Green Version]
- Bump, J.K.; Tischler, K.B.; Schrank, A.J.; Peterson, R.O.; Vucetich, J.A. Large herbivores and aquatic-terrestrial links in southern boreal forests. J. Anim. Ecol. 2009, 78, 338–345. [Google Scholar] [CrossRef] [PubMed]
- Helfield, J.M.; Naiman, R.J. Salmon and alder as nitrogen sources to riparian forests in a boreal Alaskan watershed. Oecologia 2002, 133, 573–582. [Google Scholar] [CrossRef]
- McCoy, M.W.; Barfield, M.; Holt, R.D. Predator shadows: Complex life histories as generators of spatially patterned indirect interactions across ecosystems. Oikos 2009, 118, 87–100. [Google Scholar] [CrossRef]
- Knight, T.M.; McCoy, M.W.; Chase, J.M.; McCoy, K.A.; Holt, R.D. Trophic cascades across ecosystems. Nature 2005, 437, 880–883. [Google Scholar] [CrossRef]
- Quinn, T.P.; Carlson, S.M.; Gende, S.M.; Rich, H.B., Jr. Transportation of Pacific salmon carcasses from streams to riparian forests by bears. Can. J. Zool. 2009, 87, 195–203. [Google Scholar] [CrossRef]
- Kremen, C.; Williams, N.M.; Aizen, M.A.; Gemmill-Herren, B.; LeBuhn, G.; Minckley, R.; Packer, L.; Potts, S.G.; Roulston, T.; Steffan-Dewenter, I.; et al. Pollination and other ecosystem services produced by mobile organisms: A conceptual framework for the effects of land-use change. Ecol. Lett. 2007, 10, 299–314. [Google Scholar] [CrossRef]
- Baker, M.R.; Schindler, D.E.; Holtgrieve, G.W.; St. Louis, V.L. Bioaccumulation and transport of contaminants: Migrating sockeye salmon as vectors of mercury. Environ. Sci. Technol. 2009, 43, 8840–8846. [Google Scholar] [CrossRef]
- Blais, J.M.; Kimpe, L.E.; McMahon, D.; Keatley, B.E.; Mallory, M.L.; Douglas, M.S.V.; Smol, J.P. Arctic seabirds transport marine-derived contaminants. Science 2005, 309, 445. [Google Scholar] [CrossRef] [Green Version]
- Walters, D.M.; Fritz, K.M.; Otter, R.R. The dark side of subsidies: Adult stream insects export organic contaminants to riparian predators. Ecol. Appl. 2008, 18, 1835–1841. [Google Scholar] [CrossRef]
- Marczak, L.B.; Thompson, R.M.; Richardson, J.S. Meta-analysis: Trophic level, habitat, and productivity shape the food web effects of resource subsidies. Ecology 2007, 88, 140–148. [Google Scholar] [CrossRef]
- Bartels, P.; Cucherousset, J.; Steger, K.; Eklöv, P.; Tranvik, L.J.; Hillebrand, H. Reciprocal subsidies between freshwater and terrestrial ecosystems structure consumer resource dynamics. Ecology 2012, 93, 1173–1182. [Google Scholar] [CrossRef] [PubMed]
- McDonald, C.P.; Rover, J.A.; Stets, E.G.; Striegl, R.G. The regional abundance and size distribution of lakes and reservoirs in the United States and implications for estimates of global lake extent. Limnol. Oceanogr. 2012, 57, 597–606. [Google Scholar] [CrossRef]
- Smith, L.L.; Subalusky, A.L.; Atkinson, C.L.; Earl, J.E.; Mushet, D.M.; Scott, D.E.; Lance, S.L.; Johnson, S.A. Biological connectivity of seasonally ponded wetlands across spatial and temporal scales. J. Am. Water Resour. Assoc. 2019, 55, 334–353. [Google Scholar] [CrossRef]
- Gibbons, J.W.; Winne, C.T.; Scott, D.E.; Willson, J.D.; Glaudas, X.; Andrews, K.M.; Todd, B.D.; Fedewa, L.A.; Wilkinson, L.; Tsaliagos, R.N.; et al. Remarkable amphibian biomass and abundance in an isolated wetland: Implications for wetland conservation. Conserv. Biol. 2006, 20, 1457–1465. [Google Scholar] [CrossRef]
- DeGregario, B.A.; Willson, J.D.; Dorcas, M.E.; Gibbons, J.W. Commercial value of amphibians produced from an isolated wetland. Am. Midl. Nat. 2014, 172, 200–204. [Google Scholar] [CrossRef]
- Fritz, K.A.; Whiles, M.R. Reciprocal subsidies between temporary ponds and riparian forests. Limnol. Oceanogr. 2021, 66, 3149–3161. [Google Scholar] [CrossRef]
- Schriever, T.A.; Cadotte, M.W.; Williams, D.D. How hydroperiod and species richness affect the balance of resource flows across aquatic-terrestrial boundaries. Aquat. Sci. 2013, 76, 131–143. [Google Scholar] [CrossRef]
- Regester, K.J.; Lips, K.R.; Whiles, M.R. Energy flow and subsidies associated with the complex life cycle of ambystomatid salamanders in ponds and adjacent forest in southern Illinois. Oecologia 2006, 147, 303–314. [Google Scholar] [CrossRef]
- Reinhardt, T.; Steinfartz, S.; Paetzold, A.; Weitere, M. Linking the evolution of habitat choice to ecosystem functioning: Direct and indirect effects of pond-reproducing fire salamanders on aquatic-terrestrial subsidies. Oecologia 2013, 173, 281–291. [Google Scholar] [CrossRef]
- Capps, K.A.; Berven, K.A.; Tiegs, S.D. Modelling nutrient transport and transformation by pool-breeding amphibians in forested landscapes using a 21-year dataset. Freshw. Biol. 2015, 60, 500–511. [Google Scholar] [CrossRef]
- Barzaghi, B.; Ficetola, G.F.; Pennati, R.; Manenti, R. Biphasic predators provide biomass subsidies in small freshwater habitats: A case study of spring and cave pools. Freshw. Biol. 2017, 62, 1637–1644. [Google Scholar] [CrossRef]
- Luhring, T.M.; DeLong, J.P.; Semlitsch, R.D. Stoichiometry and life-history interact to determine the magnitude of cross-ecosystem element and biomass fluxes. Front. Microbiol. 2017, 8, 814. [Google Scholar] [CrossRef]
- Fritz, K.A.; Whiles, M.R. Amphibian-mediated nutrient fluxes across aquatic-terrestrial boundaries of temporary wetlands. Freshw. Biol. 2018, 63, 1250–1259. [Google Scholar] [CrossRef]
- Fritz, K.A.; Whiles, M.R.; Trushenski, J.T. Subsidies of long-chain polyunsaturated fatty acids from aquatic to terrestrial environments via amphibian emergence. Freshw. Biol. 2019, 64, 832–842. [Google Scholar] [CrossRef]
- Pough, F.H. The advantages of ectothermy for tetrapods. Am. Nat. 1980, 115, 92–112. [Google Scholar] [CrossRef]
- Werner, E.E.; Wellborn, G.A.; McPeek, M.A. Diet composition in postmetamorphic bullfrogs and green frogs: Implications for interspecific predation and competition. J. Herpetol. 1995, 29, 600–607. [Google Scholar] [CrossRef] [Green Version]
- Crawford, J.A.; Shepard, D.B.; Conner, C.A. Diet composition and overlap between recently metamorphosed Rana areolata and Rana sphenocephala: Implications for a frog of conservation concern. Copeia 2009, 2009, 642–646. [Google Scholar] [CrossRef]
- Smith, L.M.; Gray, M.J.; Quarles, A. Diets of newly metamorphosed amphibians in west Texas playas. Southwest. Nat. 2004, 49, 257–263. [Google Scholar] [CrossRef]
- Bull, E.L.; Hayes, J.L. Selection of diet by metamorphic and juvenile western toads (Bufo boreas) in northeastern Oregon. Herpetol. Conserv. Biol. 2009, 4, 85–95. [Google Scholar]
- Hocking, D.J.; Babbitt, K.J. Amphibian contributions to ecosystem services. Herpetol. Conserv. Biol. 2014, 9, 1–17. [Google Scholar]
- Popescu, V.D.; Patrick, D.A.; Hunter, M.L., Jr.; Calhoun, A.J.K. The role of forest harvesting and subsequent vegetative regrowth in determining patterns of amphibian habitat use. For. Ecol. Manag. 2012, 170, 163–174. [Google Scholar] [CrossRef]
- Hocking, D.J.; Rittenhouse, T.A.G.; Rothermel, B.B.; Johnson, J.R.; Conner, C.A.; Harper, E.B.; Semlitsch, R.D. Breeding and recruitment phenology of amphibians in Missouri oak-hickory forests. Am. Midl. Nat. 2008, 160, 41–60. [Google Scholar] [CrossRef]
- Rittenhouse, T.A.G.; Semlitsch, R.D. Grasslands as movement barriers for a forest-associated salamander: Migration behavior of adult and juvenile salamanders at a distinct habitat edge. Biol. Conserv. 2006, 131, 14–22. [Google Scholar] [CrossRef]
- Patrick, D.A.; Hunter, M.L., Jr.; Calhoun, A.J.K. Effects of experimental forestry treatments on a Maine amphibian community. For. Ecol. Manag. 2006, 234, 323–332. [Google Scholar] [CrossRef]
- Semlitsch, R.D.; Todd, B.D.; Blomquist, S.M.; Calhoun, A.J.K.; Gibbons, J.W.; Gibbs, J.P.; Graeter, G.J.; Harper, E.B.; Hocking, D.J.; Hunter, M.L., Jr.; et al. Effects of timber harvest on amphibian populations: Understanding mechanisms from forest experiments. Bioscience 2009, 59, 853–862. [Google Scholar] [CrossRef] [Green Version]
- Semlitsch, R.D.; Conner, C.A.; Hocking, D.J.; Rittenhouse, T.A.G.; Harper, E.B. Effects of timber harvesting on pond-breeding amphibian persistence: Testing the evacuation hypothesis. Ecol. Appl. 2008, 18, 283–289. [Google Scholar] [CrossRef]
- Osbourn, M.S. Initial Juvenile Movement fo Pond-Breeding Amphibians in Altered Forest Habitat. Ph.D. Thesis, University of Missouri, Columbia, MO, USA, 2012. [Google Scholar]
- Wilbur, H.M. Competition, predation, and the structure of the Ambystoma-Rana sylvatica community. Ecology 1972, 53, 3–21. [Google Scholar] [CrossRef]
- Takahashi, M.K.; Parris, M.J. Life cycle polyphenism as a factor affecting ecological divergence within Notophthalmus viridescens. Oecologia 2008, 158, 23–34. [Google Scholar] [CrossRef]
- McPherson, L.A.; Holásková, I.; Anderson, J.T. Functional equivalence of created wetland water quality: A comparison of amphibian metamorphic success. Open J. Ecol. 2020, 10, 101177. [Google Scholar] [CrossRef]
- Gordon, A.M.; Yougquist, M.B.; Boone, M.D. The effects of pond drying and predation on Blanchard’s cricket frogs (Acris blanchardi). Copeia 2016, 104, 482–486. [Google Scholar] [CrossRef]
- Rothermel, B.B.; Semlitsch, R.D. Consequences of forest fragmentation for juvenile survival in spotted (Ambystoma maculatum) and marbled (Ambystoma opacum) salamanders. Can. J. Zool. 2006, 84, 797–807. [Google Scholar] [CrossRef]
- Earl, J.E.; Semlitsch, R.D. Reciprocal subsidies in ponds: Does leaf input increase frog biomass export? Oecologia 2012, 170, 1077–1087. [Google Scholar] [CrossRef] [PubMed]
- O’Laughlin, B.E.; Harris, R.N. Models of metamorphic timing: An experimental evaluation with the pond-dwelling salamander Hemidactylium scutatum (Caudata: Plethodontidae). Oecologia 2000, 124, 343–350. [Google Scholar] [CrossRef]
- Hocking, D.J.; Semlitsch, R.D. Effects of experimental clearcut logging on gray treefrog (Hyla versicolor) tadpole performance. J. Herpetol. 2008, 42, 689–698. [Google Scholar] [CrossRef]
- Boone, M.D.; Little, E.E.; Semlitsch, R.D. Overwintered bullfrog tadpoles negatively affect salamanders and anurans in native amphibian communities. Copeia 2004, 2004, 683–690. [Google Scholar] [CrossRef]
- Boone, M.D.; Semlitsch, R.D.; Little, E.E.; Doyle, M.C. Multiple stressors in amphibian communities: Effects of chemical contamination, bullfrogs, and fish. Ecol. Appl. 2007, 17, 291–301. [Google Scholar] [CrossRef]
- Orlofske, S.A.; Hopkins, W.A. Energetics of metamorphic climax in the pickerel frog (Lithobates palustris). Comp. Biochem. Physiol. 2009, 154, 191–196. [Google Scholar] [CrossRef]
- Williams, B.K.; Rittenhouse, T.A.G.; Semlitsch, R.D. Leaf litter input mediates tadpole performance across forest canopy treatments. Oecologia 2008, 155, 377–384. [Google Scholar] [CrossRef]
- Earl, J.E.; Cohagen, K.E.; Semlitsch, R.D. Effects of leachate from tree leaves and grass litter on tadpoles. Environ. Toxicol. Chem. 2012, 31, 1511–1517. [Google Scholar] [CrossRef]
- Kuznetsova, A.; Brockhoff, P.B.; Christensen, R.H.B. lmerTest Package: Tests in linear mixed effects models. J. Stat. Softw. 2017, 82, 1–26. [Google Scholar] [CrossRef] [Green Version]
- Zuur, A.F.; Ieno, E.N. A protocol for conducting and presenting results of regression-type analyses. Methods Ecol. Evol. 2016, 7, 636–645. [Google Scholar] [CrossRef] [Green Version]
- Nakagawa, S.; Johnson, P.C.D.; Schielzeth, H. The coefficient of determination R2 and intra-class correlation coefficient from generalized linear mixed-effects models revisited and expanded. J. R. Soc. Interface 2017, 14, 20170213. [Google Scholar] [CrossRef] [Green Version]
- Bartoń, K. MuMIn: Multi-Model Inference. R Package Version 1.43.17. Available online: https://CRAN.R-project.org/package=MuMIn (accessed on 2 November 2021).
- Atkinson, A.C.; Knapp, D.D.; Smith, L.L. Long-term patterns of amphibian diversity, abundance and nutrient export from small, isolated wetlands. Diversity 2021, 13, 598. [Google Scholar] [CrossRef]
- Pechmann, J.H.K.; Scott, D.E.; Semlitsch, R.D.; Caldwell, J.P.; Vitt, L.J.; Gibbons, J.W. Declining amphibian populations: The problem of separating human impacts from natural fluctuations. Science 1991, 253, 892–895. [Google Scholar] [CrossRef] [PubMed] [Green Version]
- Berven, K.A. Factors affecting population fluctuations in larval and adult stages of the wood frog (Rana sylvatica). Ecology 1990, 71, 1599–1608. [Google Scholar] [CrossRef]
- Marsh, D.M. Fluctuations in amphibian populations: A meta-analysis. Biol. Conserv. 2001, 101, 327–335. [Google Scholar] [CrossRef]
- Altig, R.; Whiles, M.R.; Taylor, C.L. What do tadpoles really eat? Assessing the trophic status of an understudied and imperiled group of consumers in freshwater habitats. Freshw. Biol. 2007, 52, 386–395. [Google Scholar] [CrossRef]
- Earl, J.E.; Castello, P.O.; Cohagen, K.E.; Semlitsch, R.D. Effects of subsidy quality on reciprocal subsidies: How leaf litter species changes frog biomass export. Oecologia 2014, 175, 209–218. [Google Scholar] [CrossRef]
- Earl, J.E.; Luhring, T.M.; Williams, B.K.; Semlitsch, R.D. Biomass export of salamanders and anurans from ponds is affected differentially by changes in canopy cover. Freshw. Biol. 2011, 56, 2473–2482. [Google Scholar] [CrossRef]
- Roble, S.M. Dispersal movements and plant associations of juvenile gray treefrogs, Hyla versicolor Le Conte. Trans. Kans. Acad. Sci. 1979, 82, 235–245. [Google Scholar] [CrossRef]
- Laking, A.E.; Li, Z.; Goossens, E.; Miñarro, M.; Beukema, W.; Lens, L.; Bonte, D.; Verheyen, K.; Pasmans, F.; Martel, A. Salamander loss alters litter decomposition dynamics. Sci. Total Environ. 2021, 776, 145994. [Google Scholar] [CrossRef] [PubMed]
- Wyman, R.L. Experimental assessment of salamanders as predators of detrital food webs: Effects on invertebrates, decomposition and the carbon cycle. Biodivers. Conserv. 1998, 7, 641–650. [Google Scholar] [CrossRef]
- Huang, C.; Wang, C.; Hou, P.L. Toads (Bufo bankorensis) influence litter chemistry but not litter invertebrates and litter decomposition rates in a subtropical forest of Taiwan. J. Trop. Ecol. 2007, 23, 161–168. [Google Scholar] [CrossRef]
- Beard, K.H.; Vogt, K.A.; Kulmatiski, A. Top-down effects of a terrestrial frog on forest nutrient dynamics. Oecologia 2002, 133, 583–593. [Google Scholar] [CrossRef]
- Beard, K.H.; Eschtruth, A.K.; Vogt, K.A.; Vogt, D.J.; Scatena, F.N. The effects of the frog Eleutherodactylus coqui on invertebrates and ecosystem processes at two scales in the Luquillo Experimental Forest, Puerto Rico. J. Trop. Ecol. 2003, 19, 607–617. [Google Scholar] [CrossRef] [Green Version]
- Shuman-Goodier, M.E.; Diaz, M.I.; Almazan, M.L.; Singleton, G.R.; Hadi, B.A.R.; Propper, C.R. Ecosystem hero and villain: Native frog consumes rice pests, while the invasive cane toad feasts on beneficial arthropods. Agric. Ecosyst. Environ. 2019, 279, 100–108. [Google Scholar] [CrossRef]
- Pittman, S.E.; Osbourn, M.S.; Semlitsch, R.D. Movement ecology of amphibians: A missing component for understanding population declines. Biol. Conserv. 2014, 169, 44–53. [Google Scholar] [CrossRef]
- Earl, J.E.; Zollner, P.A. Advancing research on animal-transported subsidies by integrating animal movement and ecosystem modelling. J. Anim. Ecol. 2017, 86, 987–997. [Google Scholar] [CrossRef] [Green Version]
- Earl, J.E.; Zollner, P.A. Effects of animal movement strategies and costs on the distribution of active subsidies across simple landscapes. Ecol. Model. 2014, 283, 45–52. [Google Scholar] [CrossRef]
- Patrick, D.A.; Harper, E.B.; Hunter, M.L., Jr.; Calhoun, A.J.K. Terrestrial habitat selection and strong density-dependent mortality in recently metamorphosed amphibians. Ecology 2008, 89, 2563–2574. [Google Scholar] [CrossRef] [PubMed]
- Scott, D.E.; Komoroski, M.J.; Croshaw, D.A.; Dixon, P.M. Terrestrial distribution of pond-breeding salamanders around an isolated wetland. Ecology 2013, 94, 2537–2546. [Google Scholar] [CrossRef] [PubMed] [Green Version]
- Rittenhouse, T.A.G.; Semlitsch, R.D. Distribution of amphibians in terrestrial habitat surrounding wetlands. Wetlands 2007, 27, 153–161. [Google Scholar] [CrossRef]
- Lang, F.; Bauhus, J.; Frossard, E.; George, E.; Kaiser, K.; Kaupenjohann, M.; Kruger, J.; Matzner, E.; Polle, A.; Prietzel, J.; et al. Phosphorus in forest ecosystems: New insights from an ecosystem nutrition perspective. J. Plant Nutr. Soil Sci. 2016, 179, 129–135. [Google Scholar] [CrossRef]
- Schaberg, P.G.; DeHayes, D.H.; Hawley, G.J. Anthropogenic calcium depletion: A unique threat to forest ecosystem health? Ecosyst. Health 2001, 7, 214–228. [Google Scholar] [CrossRef]
- Knapp, D.D.; Smith, L.L.; Atkinson, C.L. Larval anurans follow predictions of stoichiometric theory: Implications for nutrient storage in wetlands. Ecosphere 2021, 12, e03466. [Google Scholar] [CrossRef]
Publisher’s Note: MDPI stays neutral with regard to jurisdictional claims in published maps and institutional affiliations. |
© 2022 by the authors. Licensee MDPI, Basel, Switzerland. This article is an open access article distributed under the terms and conditions of the Creative Commons Attribution (CC BY) license (https://creativecommons.org/licenses/by/4.0/).