
Integrated Studies of Banana on Remote Sensing, Biogeography, and Biodiversity: An Indonesian Perspective


 ,
, 
Abstract
:1. Introduction
Challenges to Detecting, Identifying and Classifying Banana Herbs
2. Materials and Methods
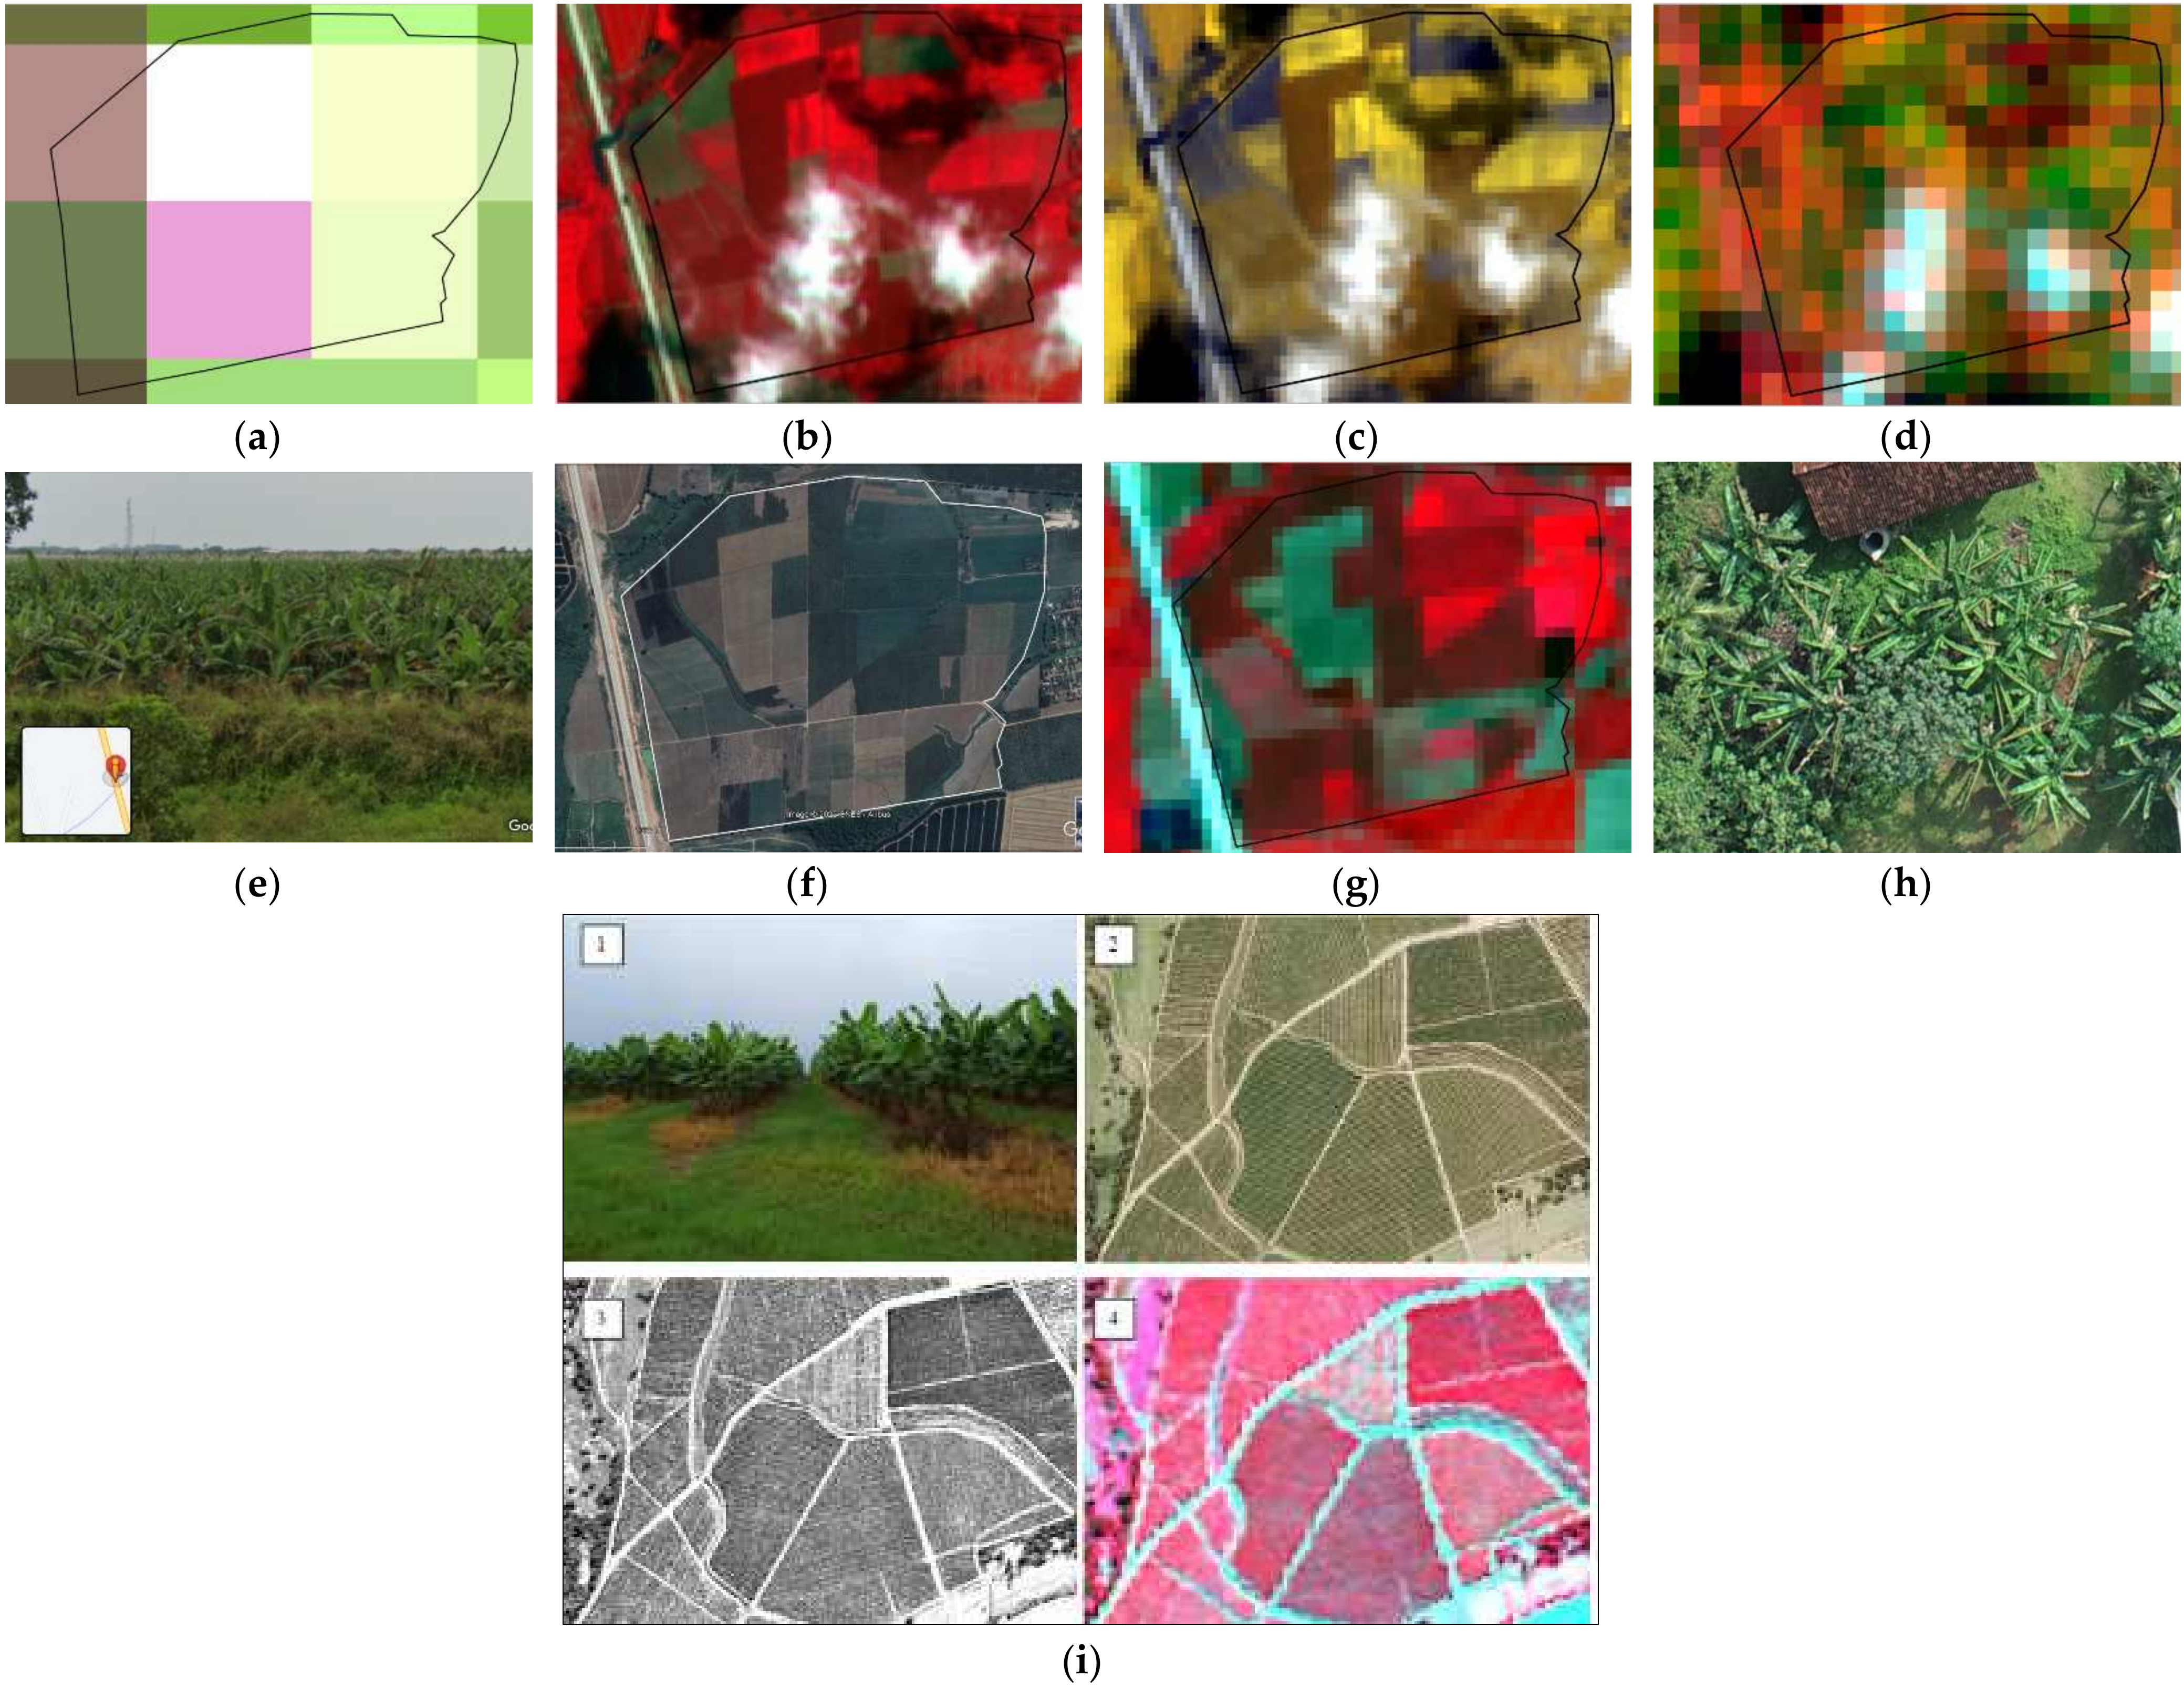
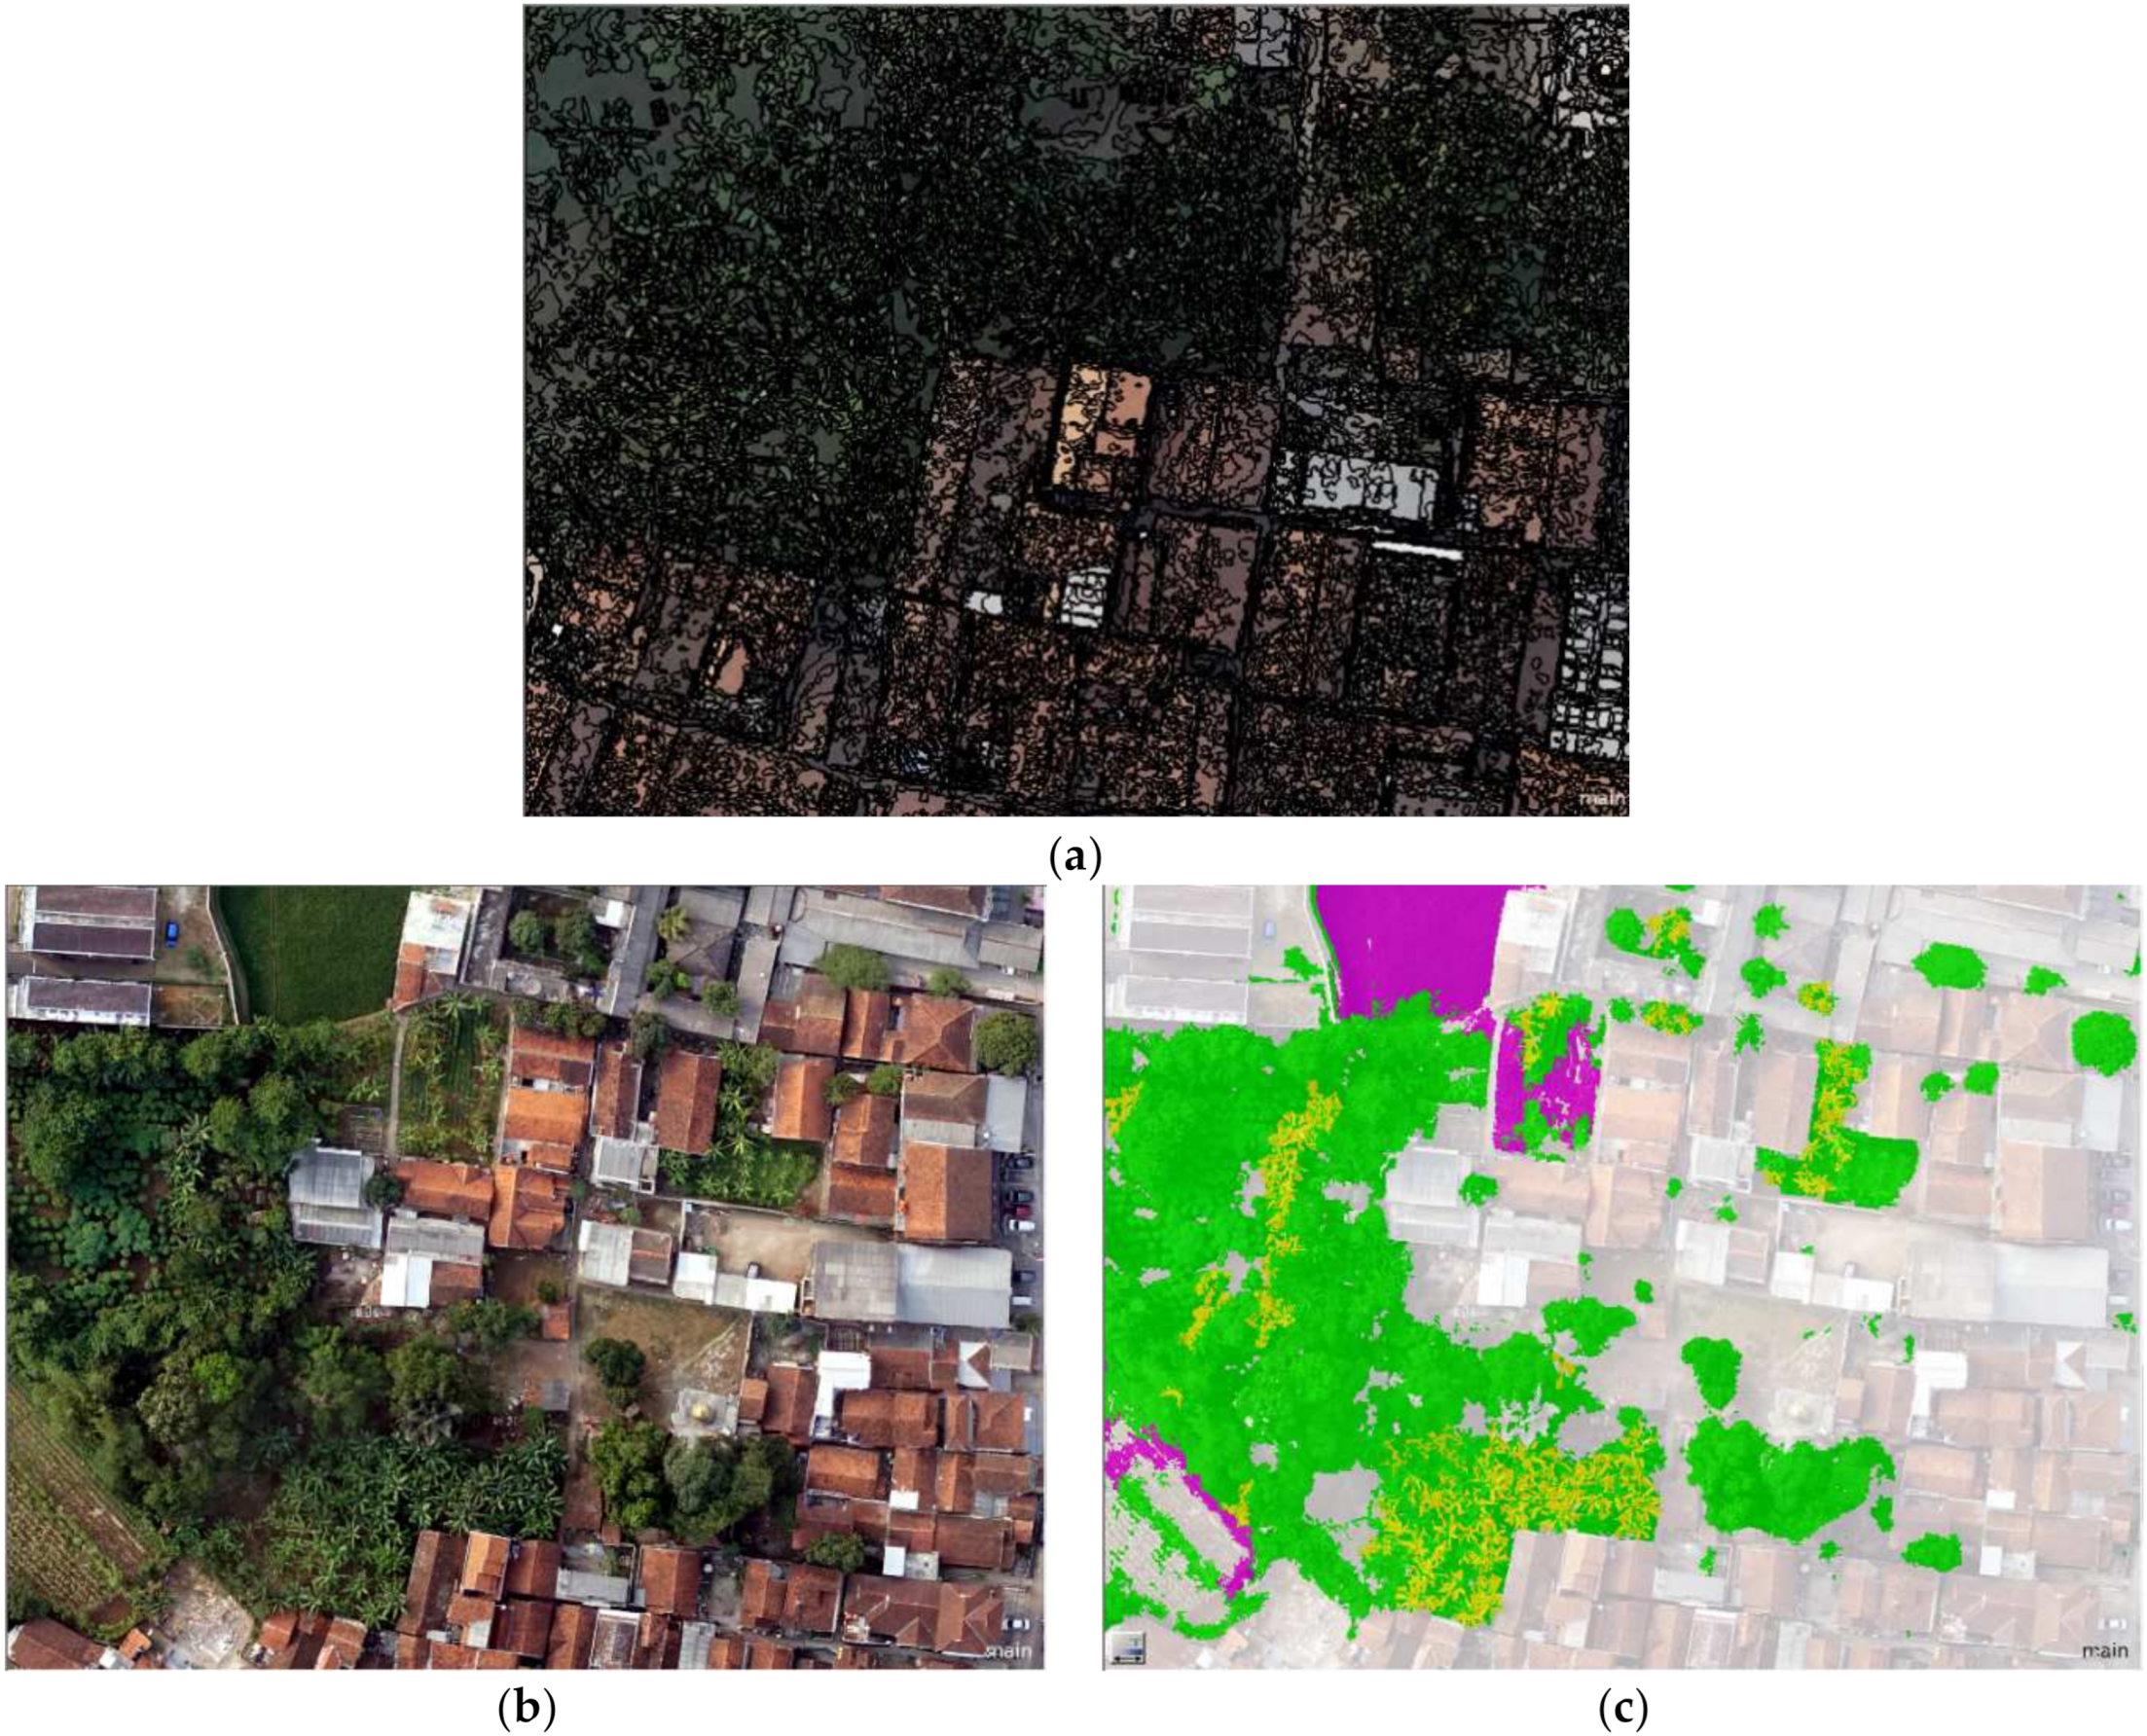
2.1. Use of Aerial Photographs to Observe Individual Banana Herbs
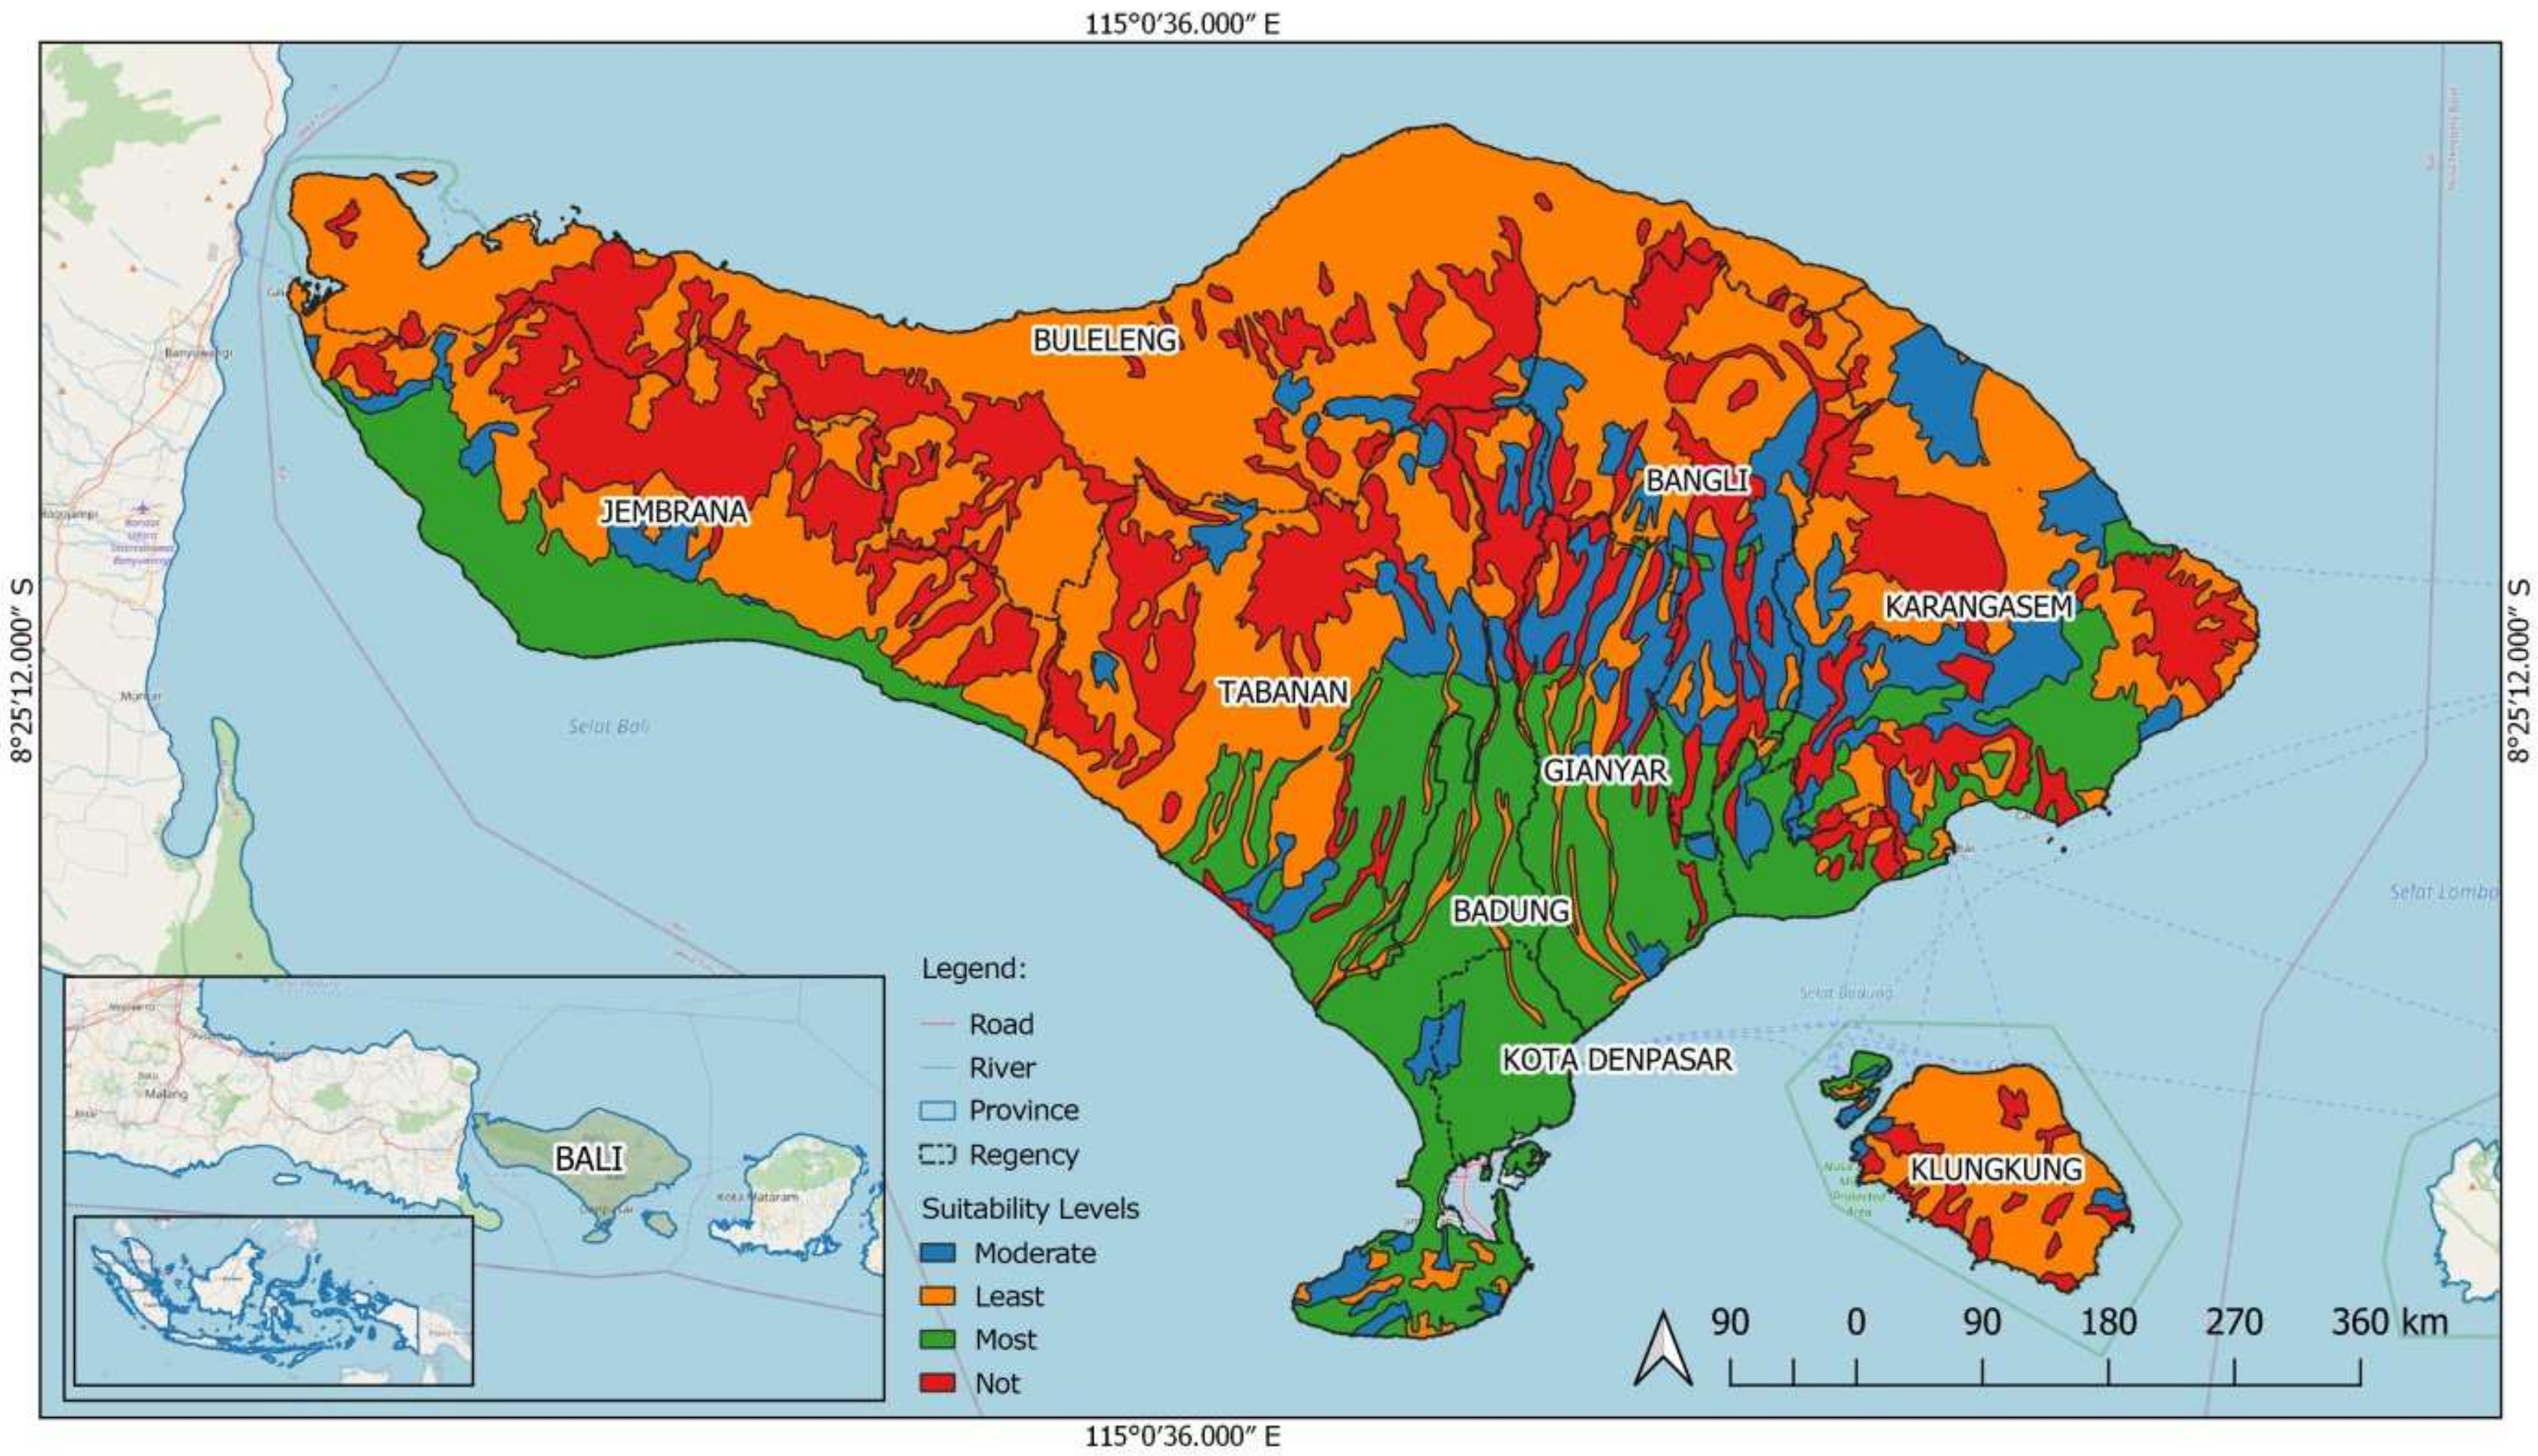
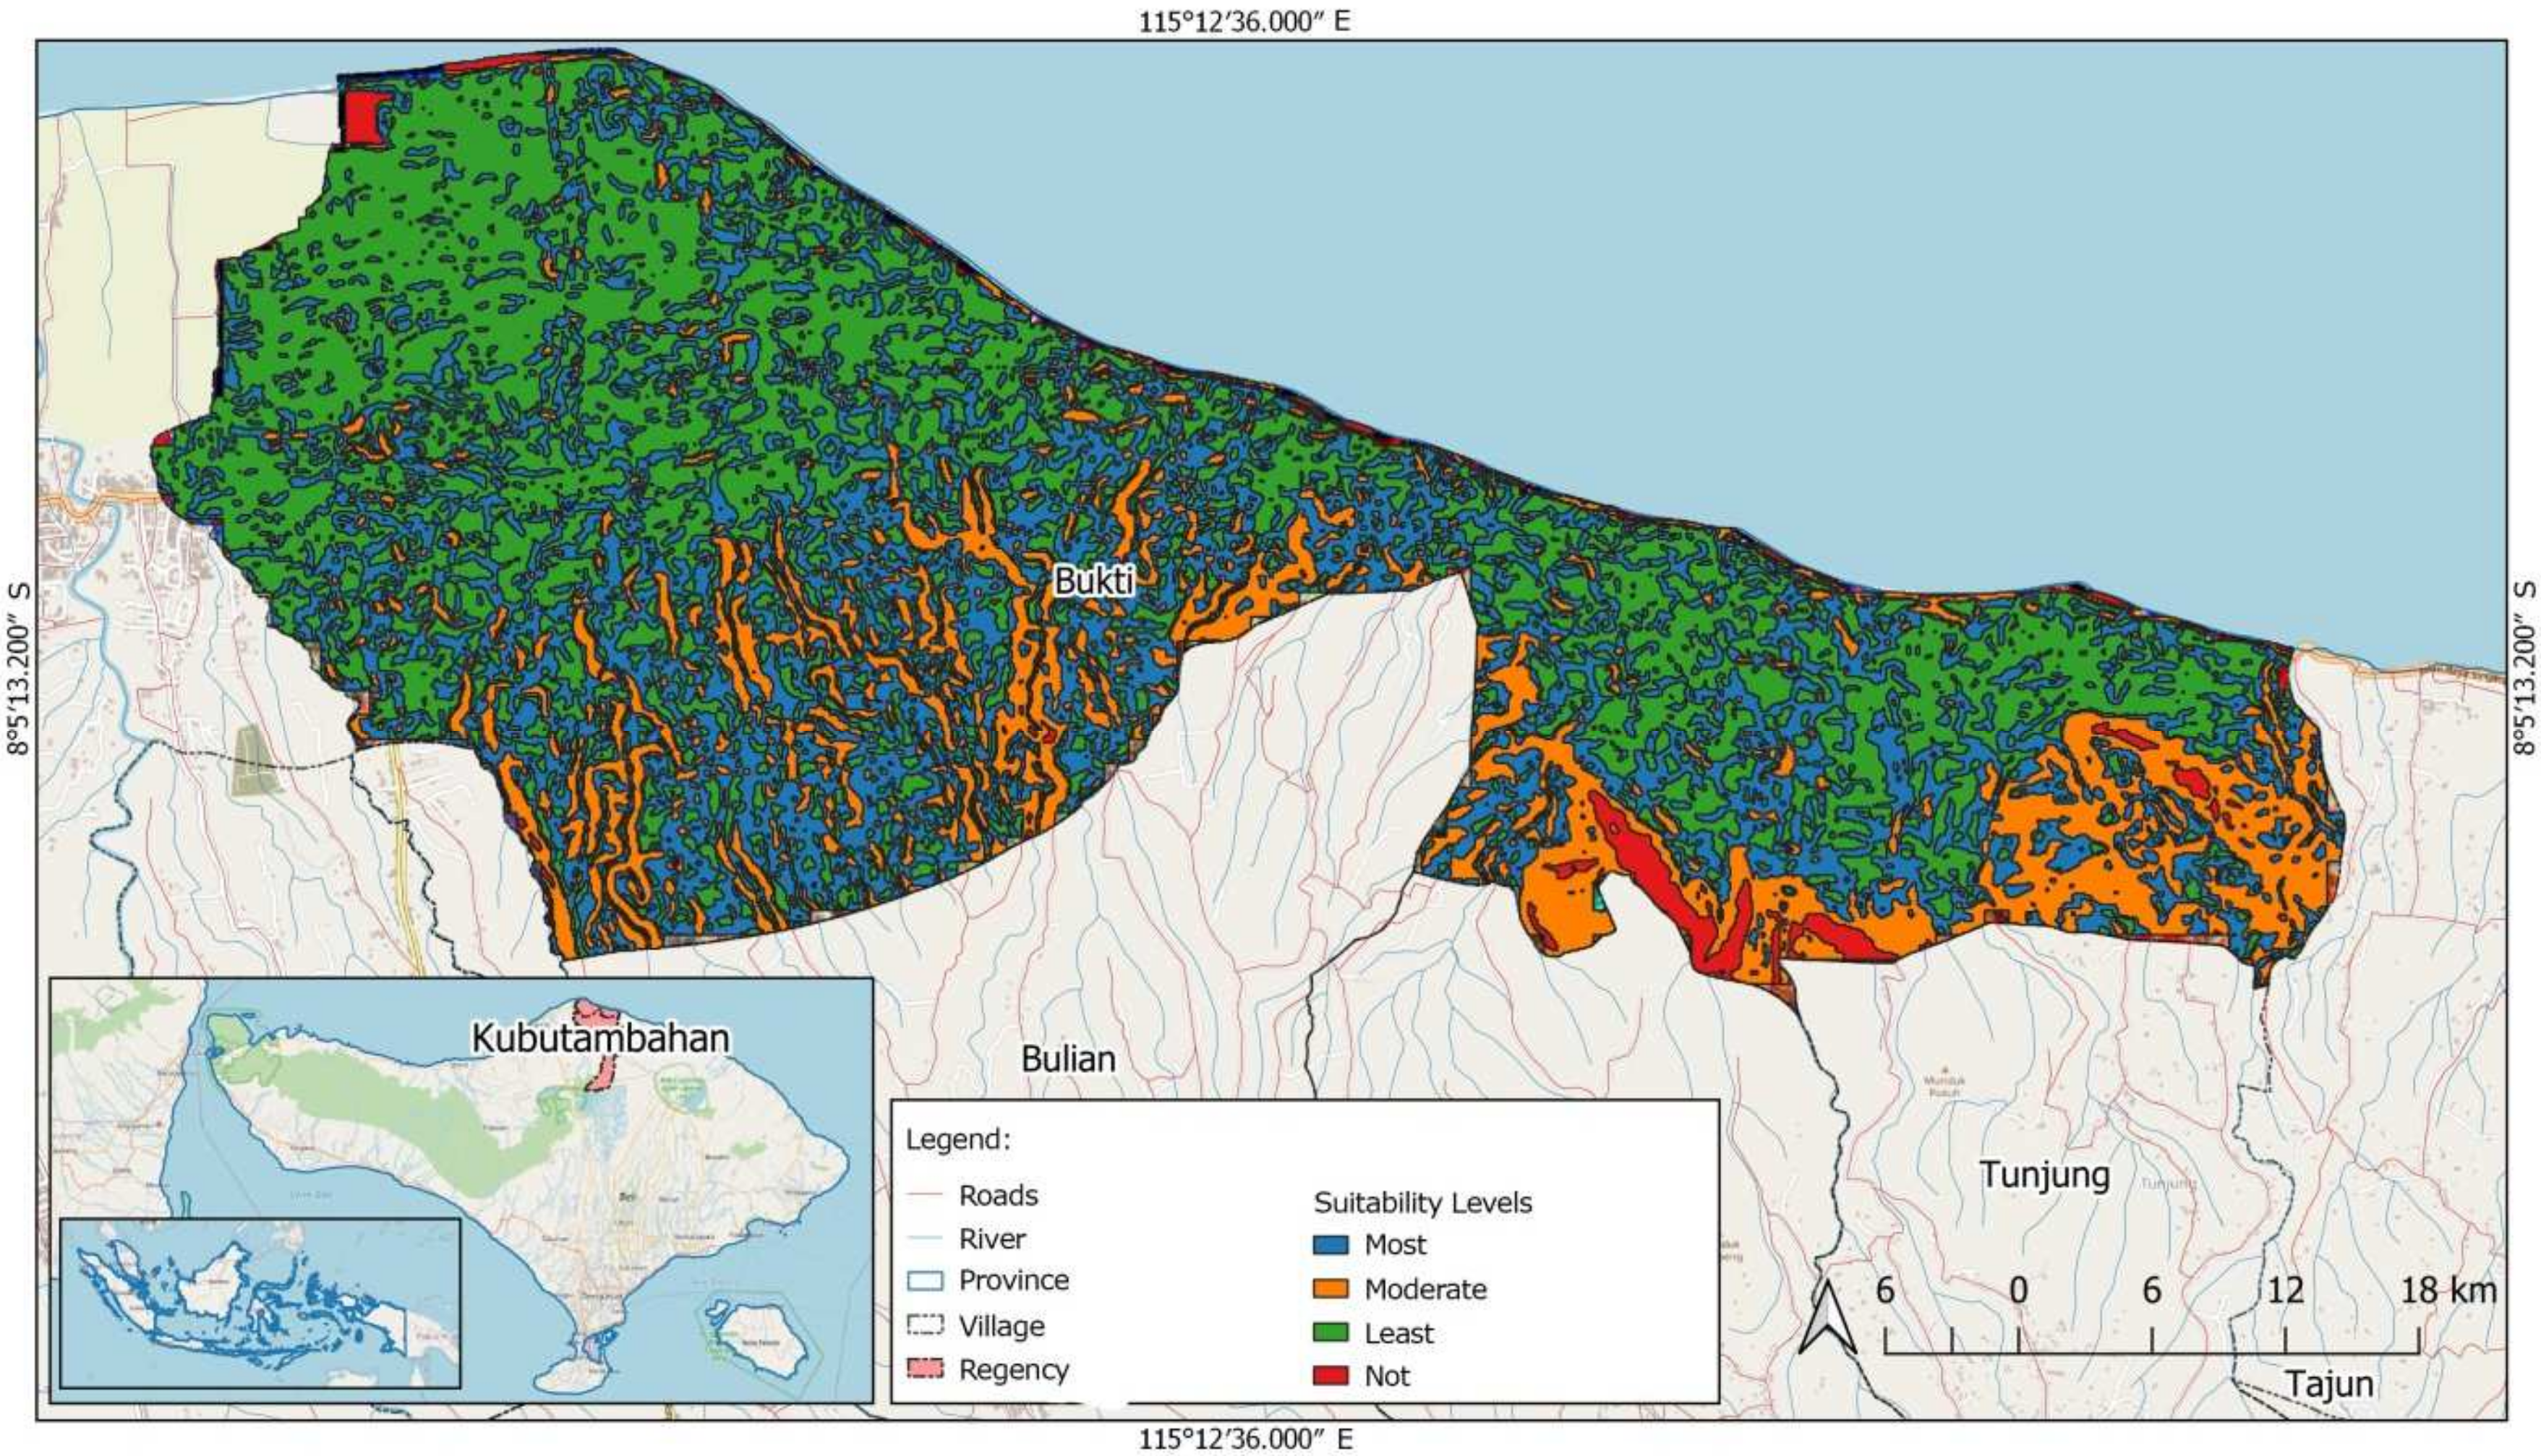
2.2. Observing the Banana Herbs, a Perspective of Biogeography and Biodiversity
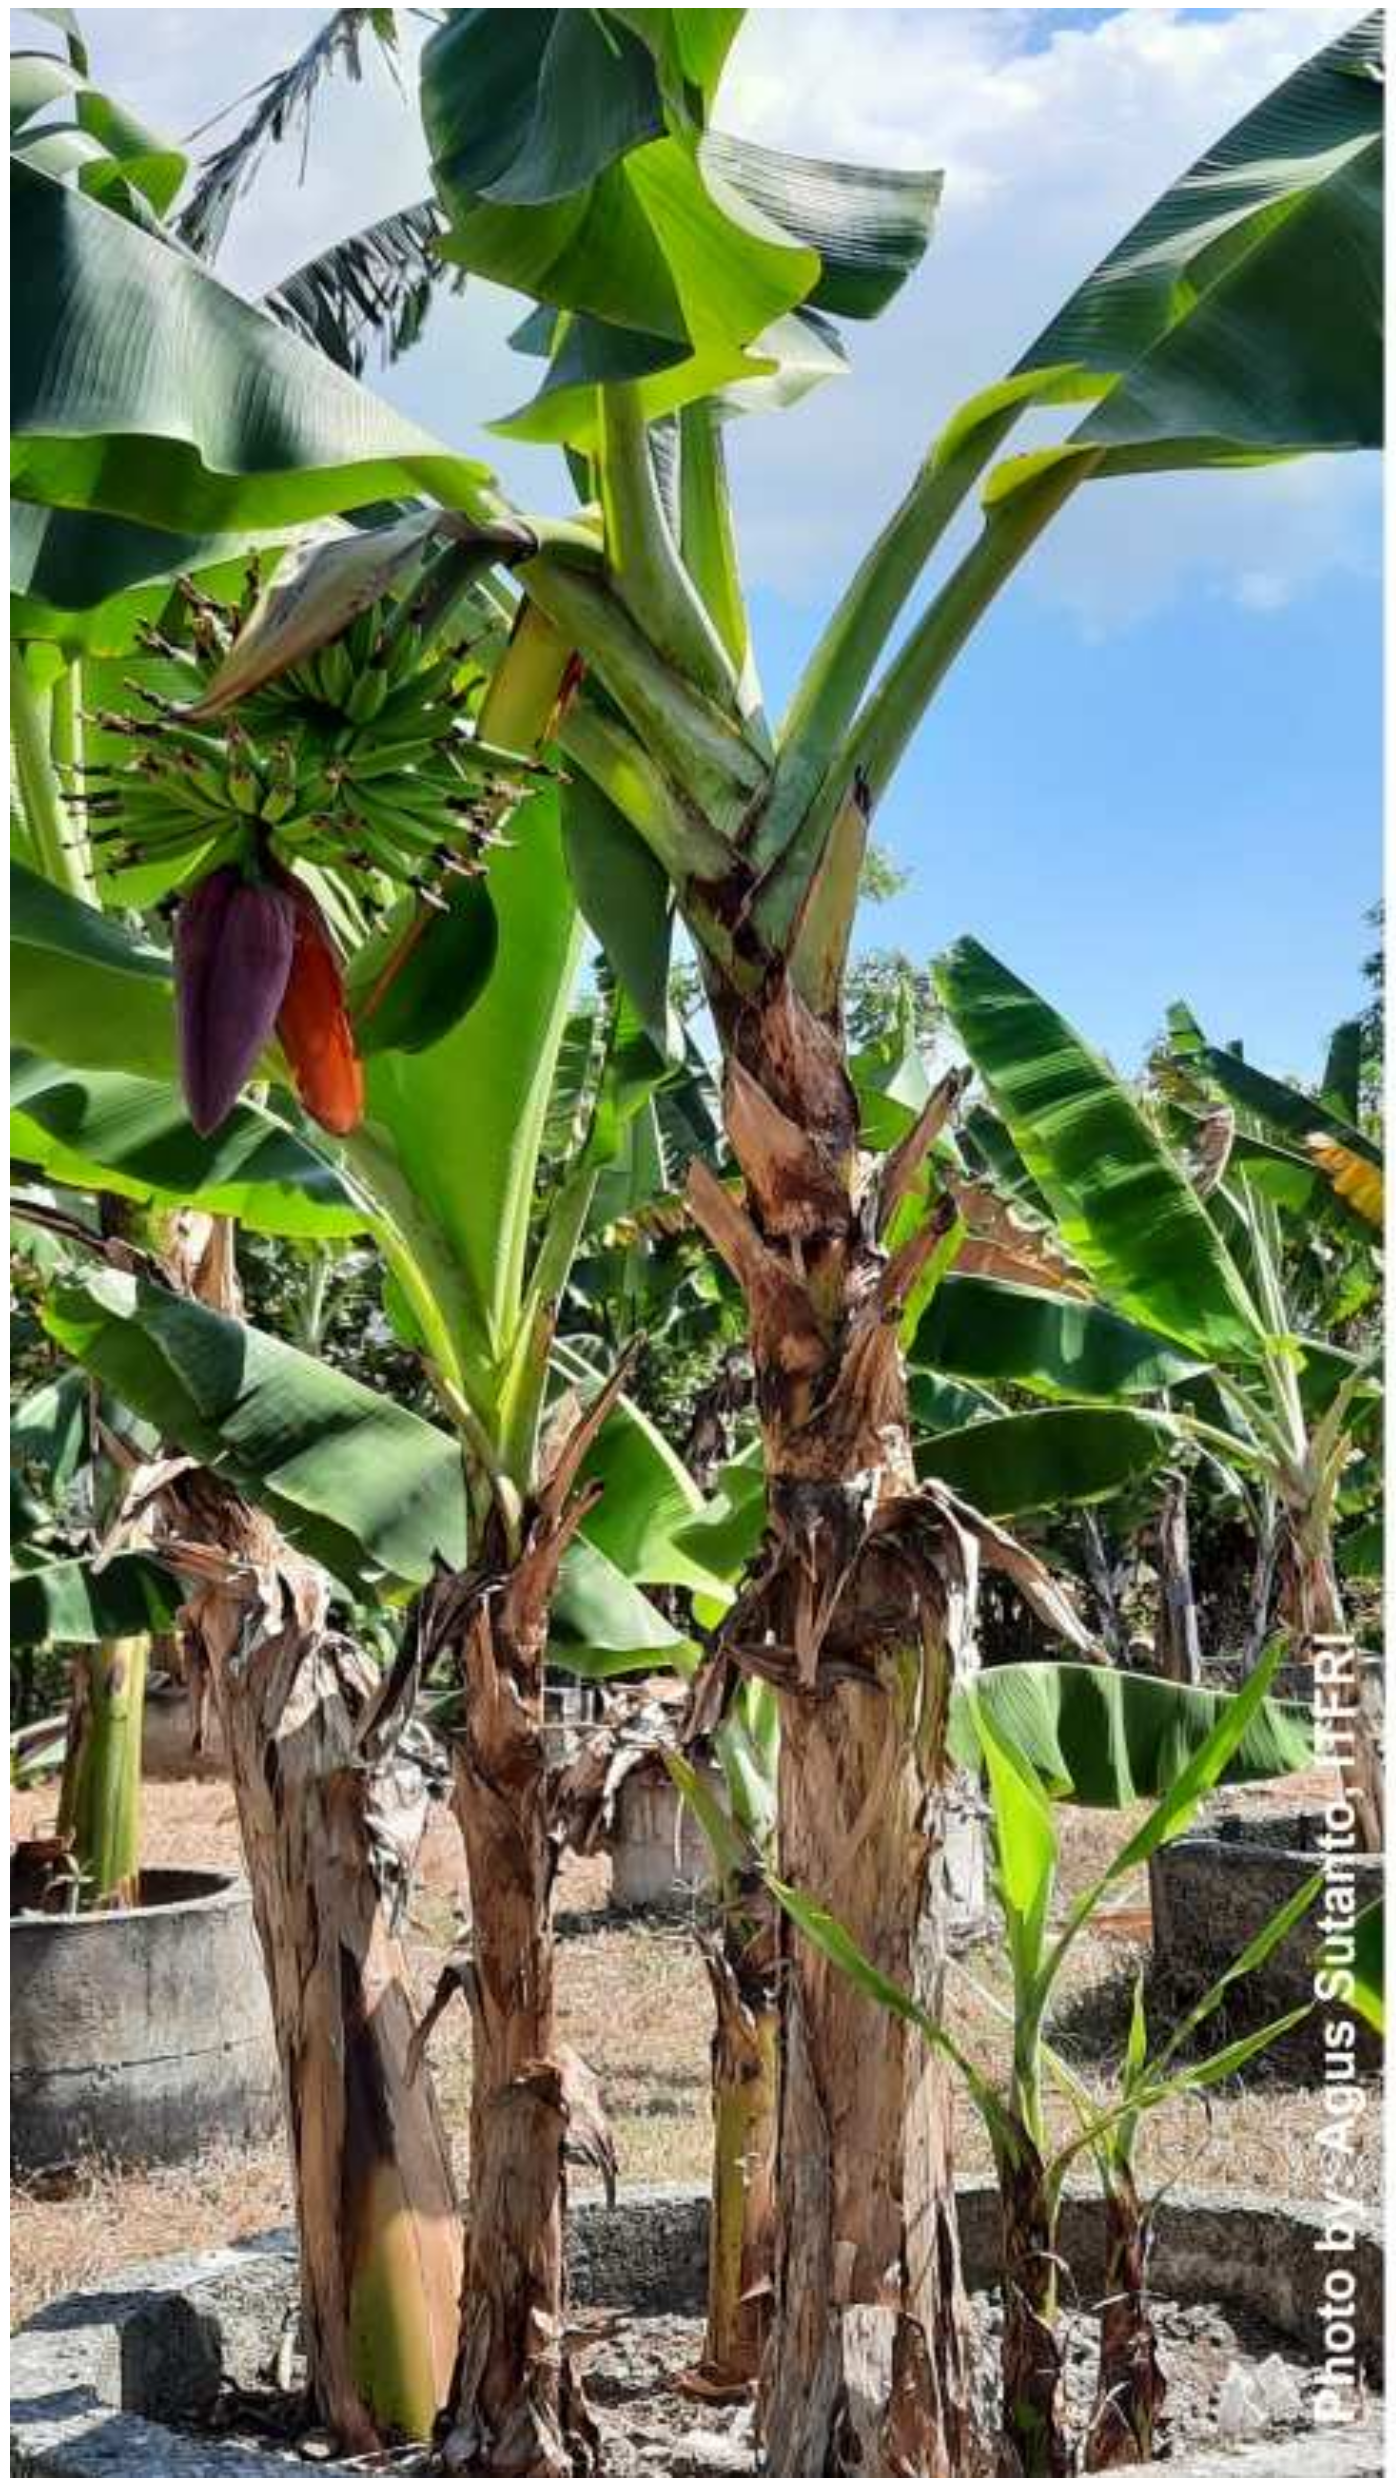
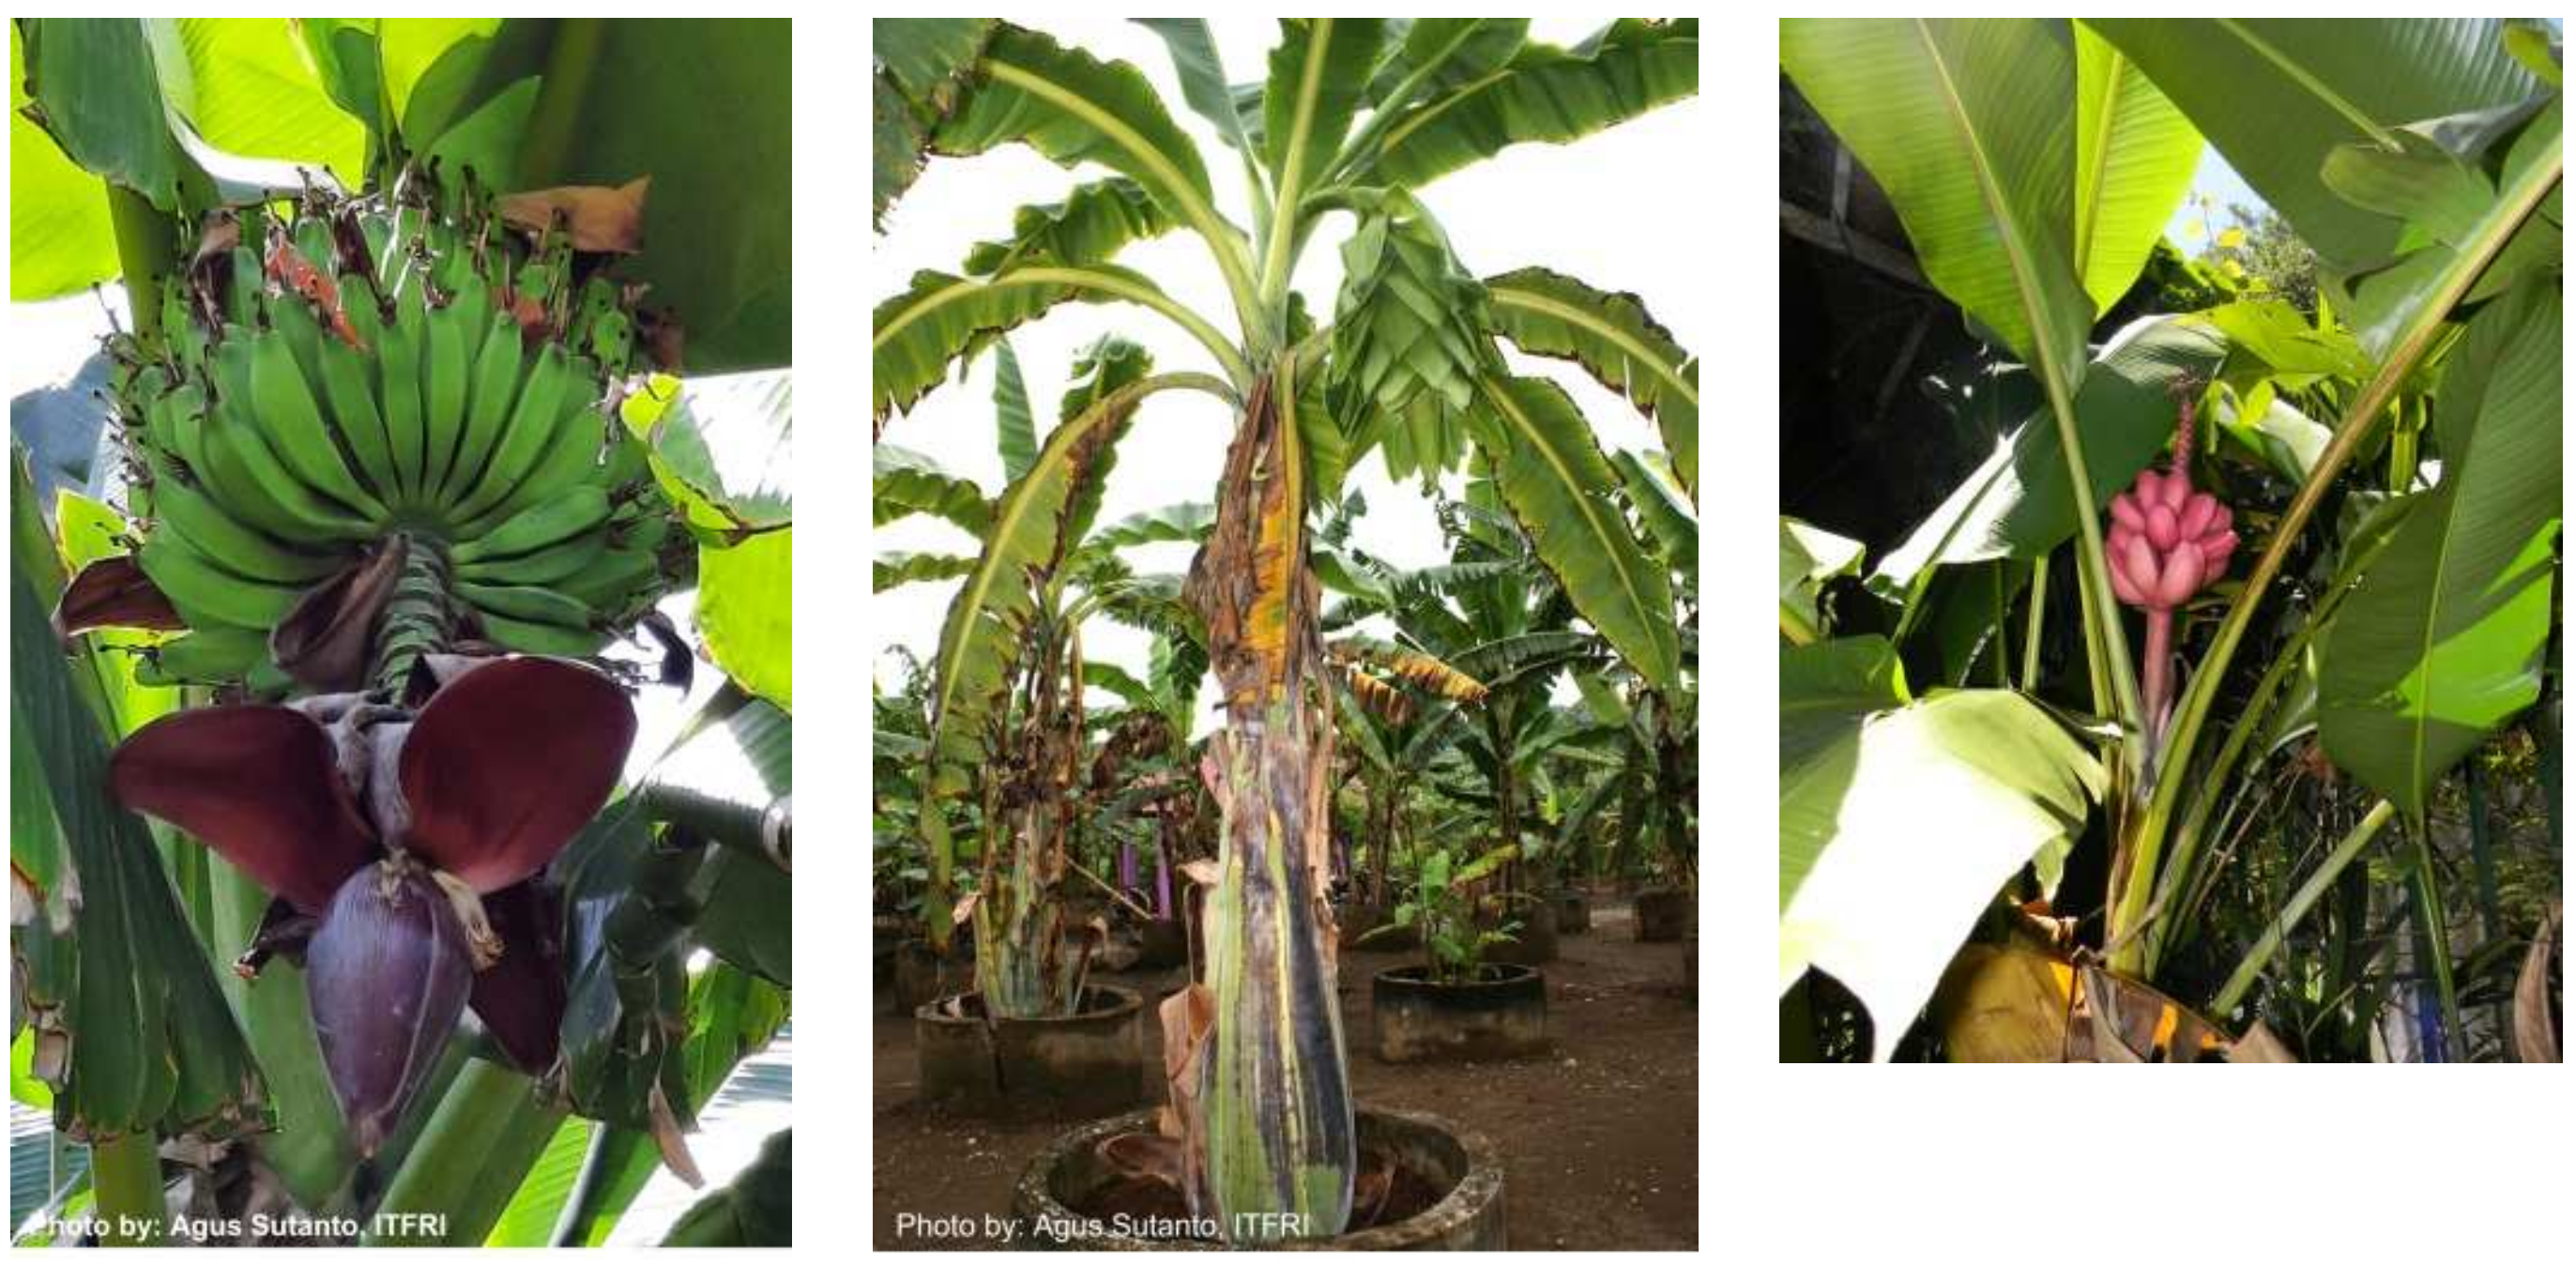
2.3. The Journey to Discover the Musa Troglodytarum
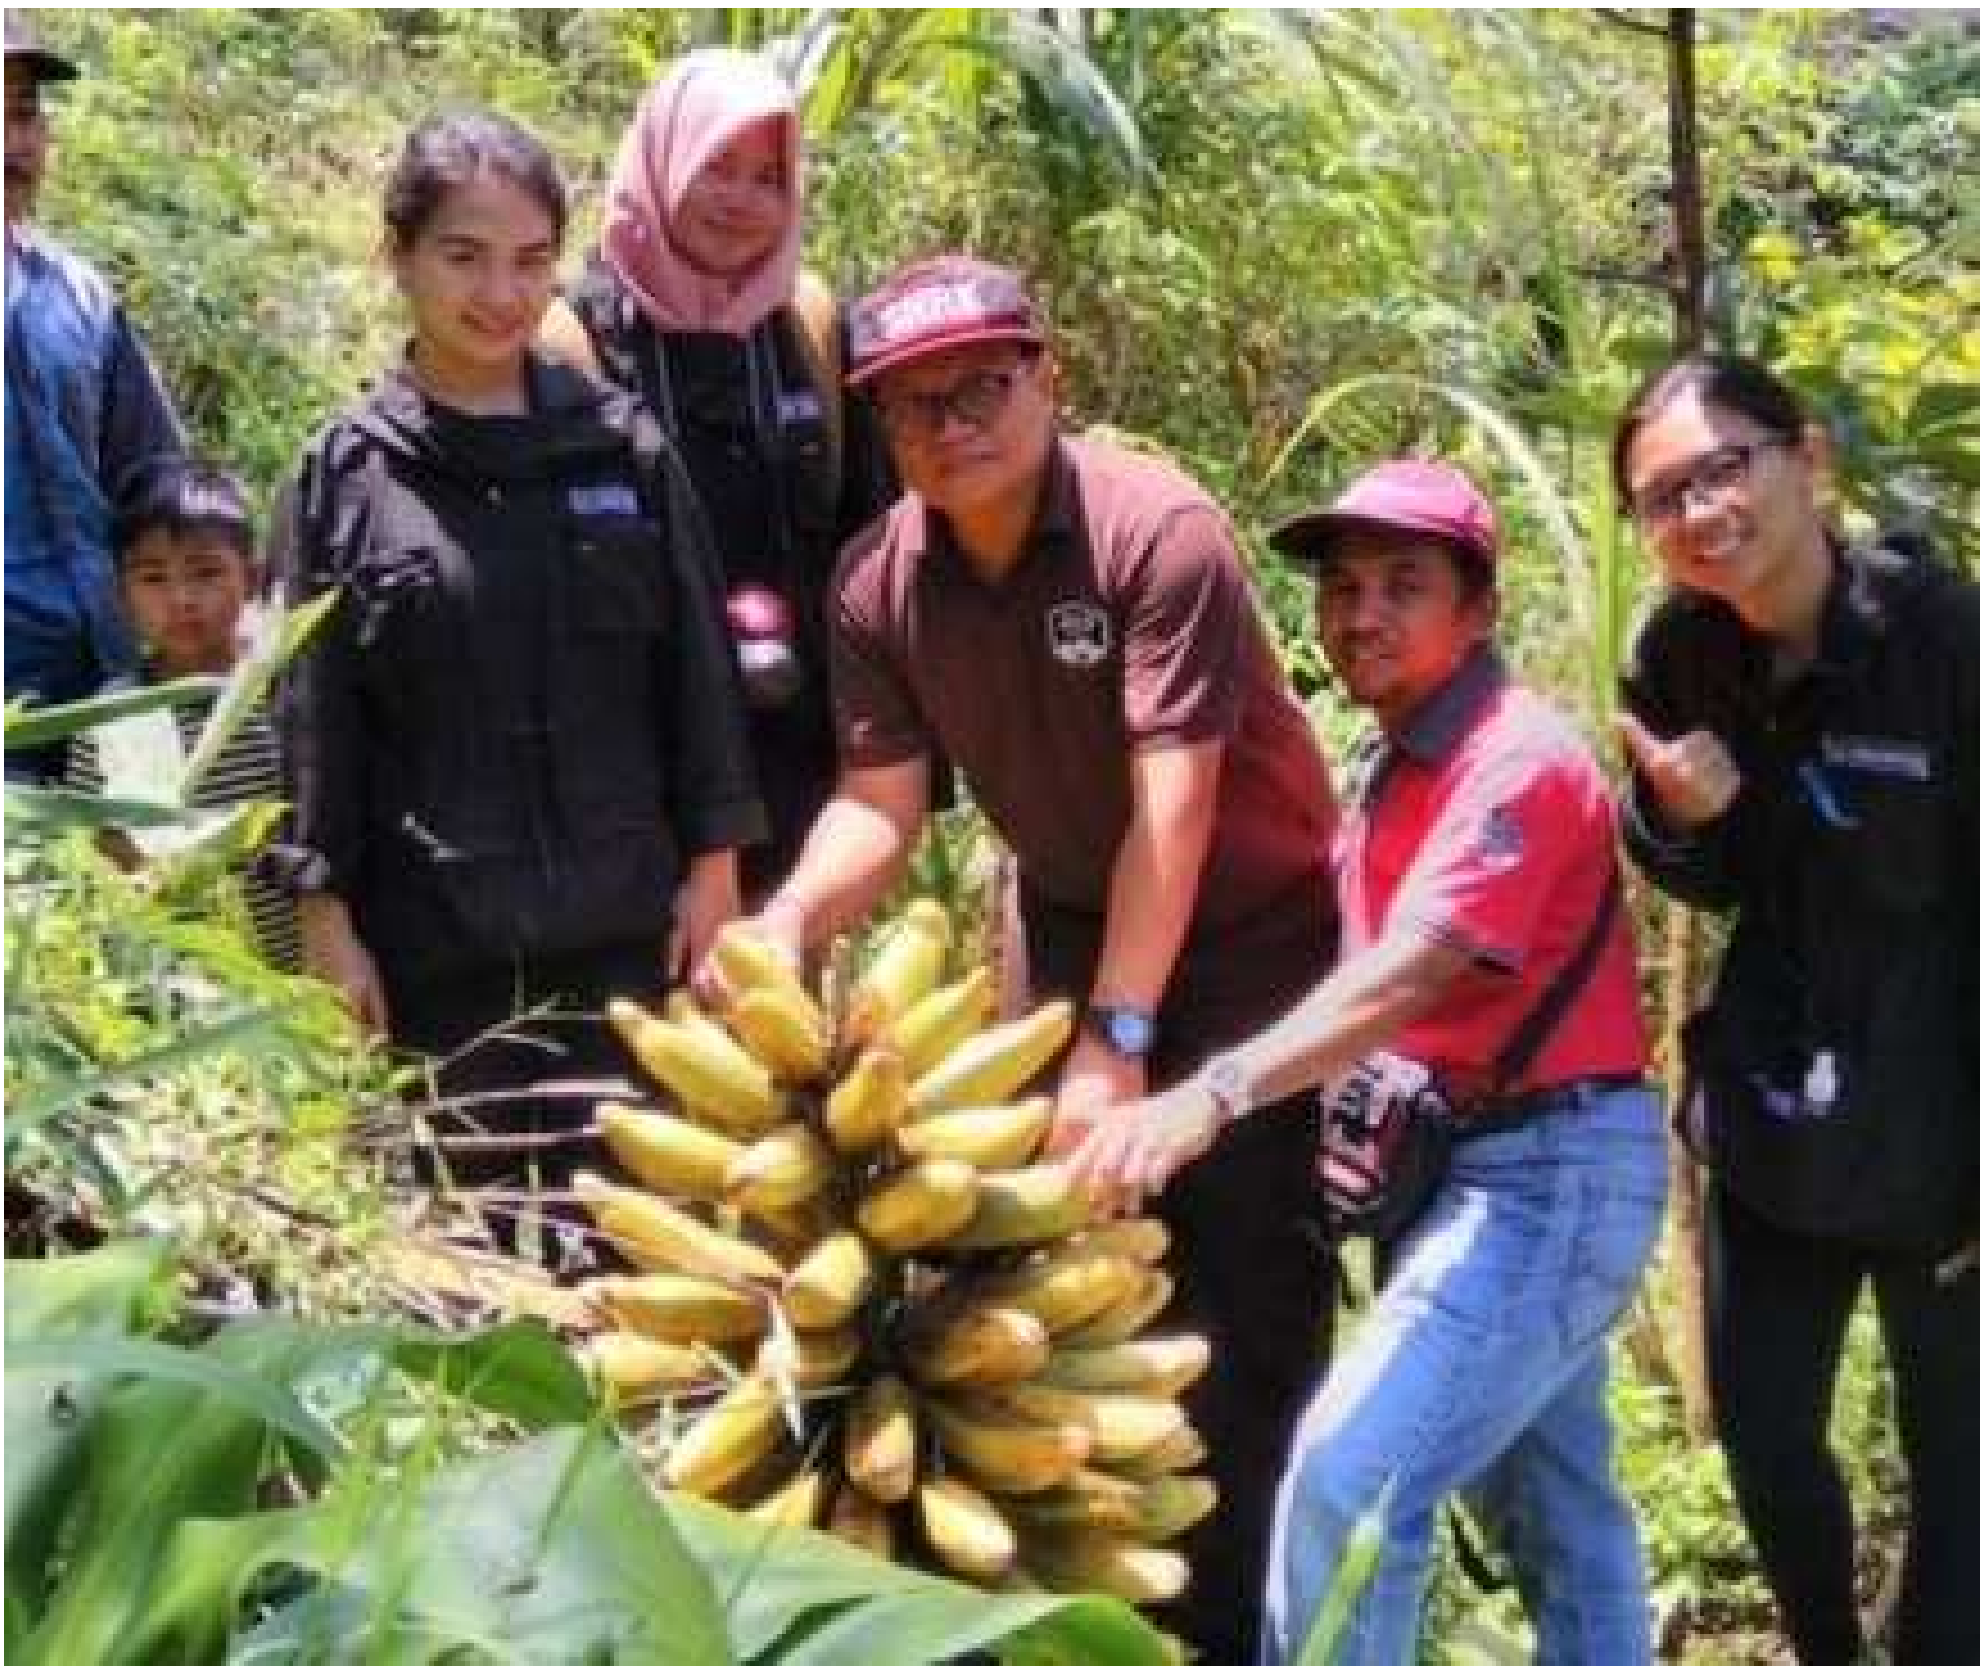
2.4. Use of Bananas for Community Developments and the Role of Ethnography and Domestication in Improving Banana Biodiversity
3. Results and Discussion
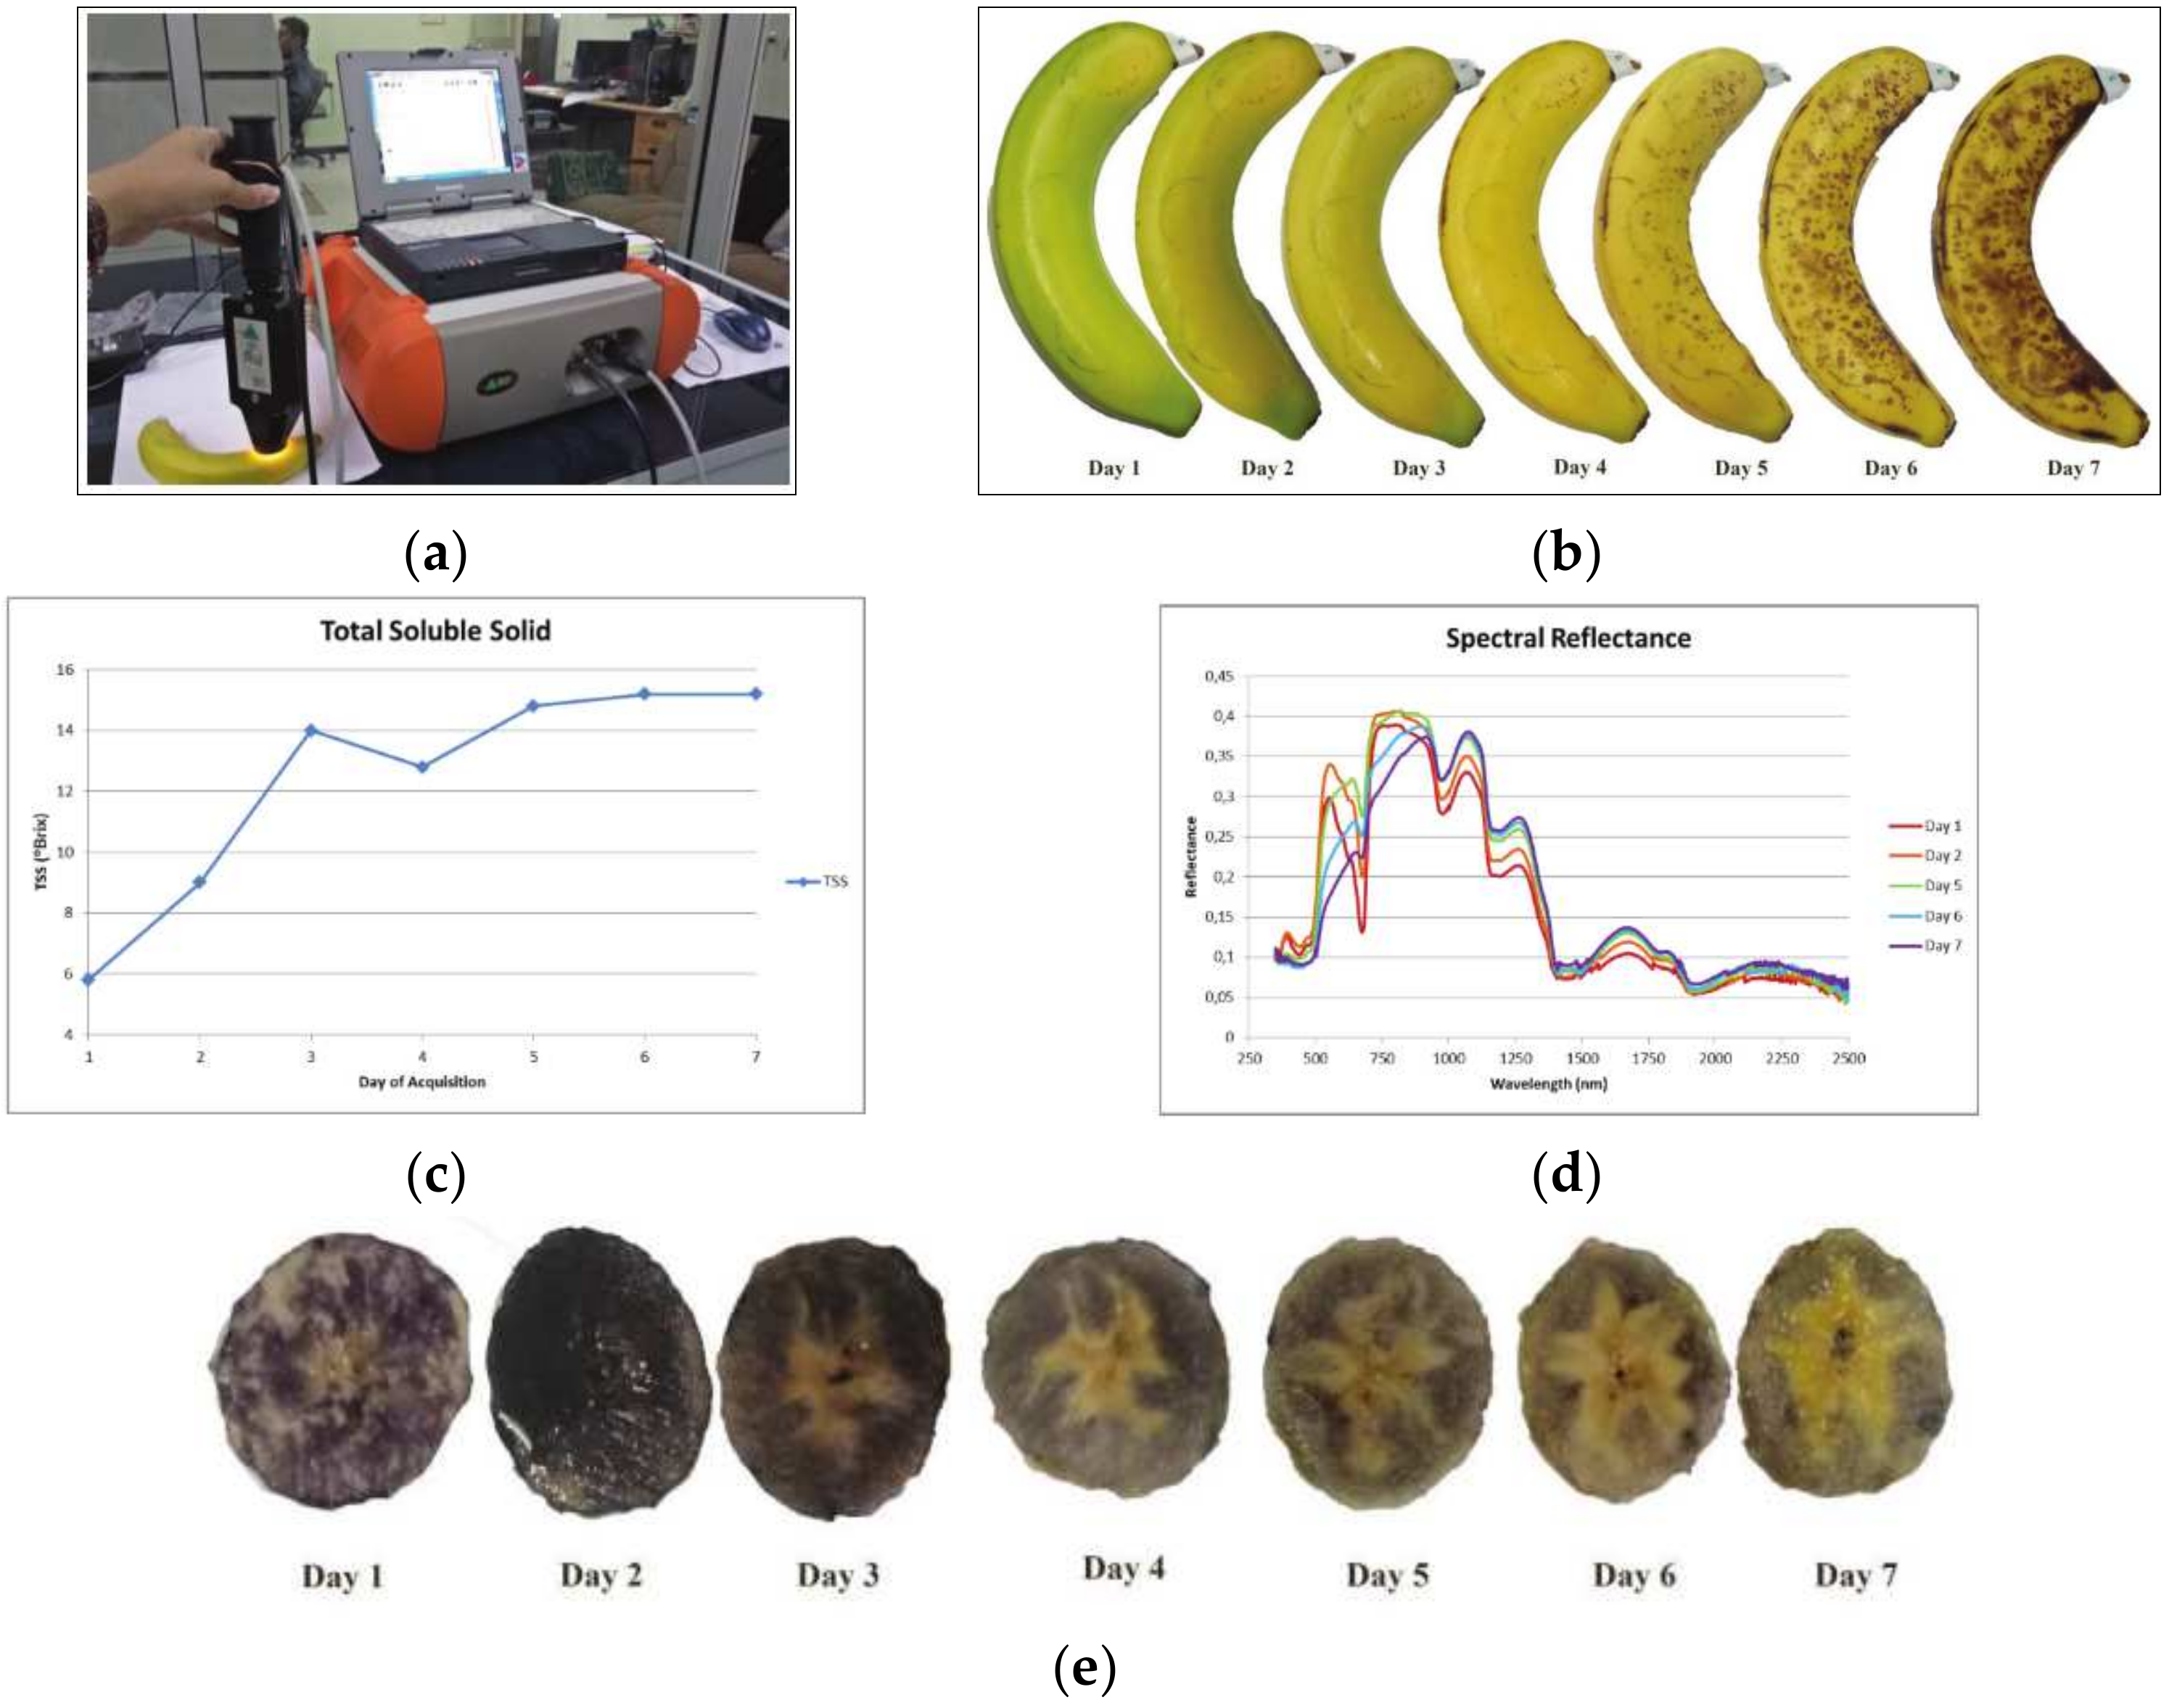
3.1. Observing Banana Fruits through Spectral Reflectance
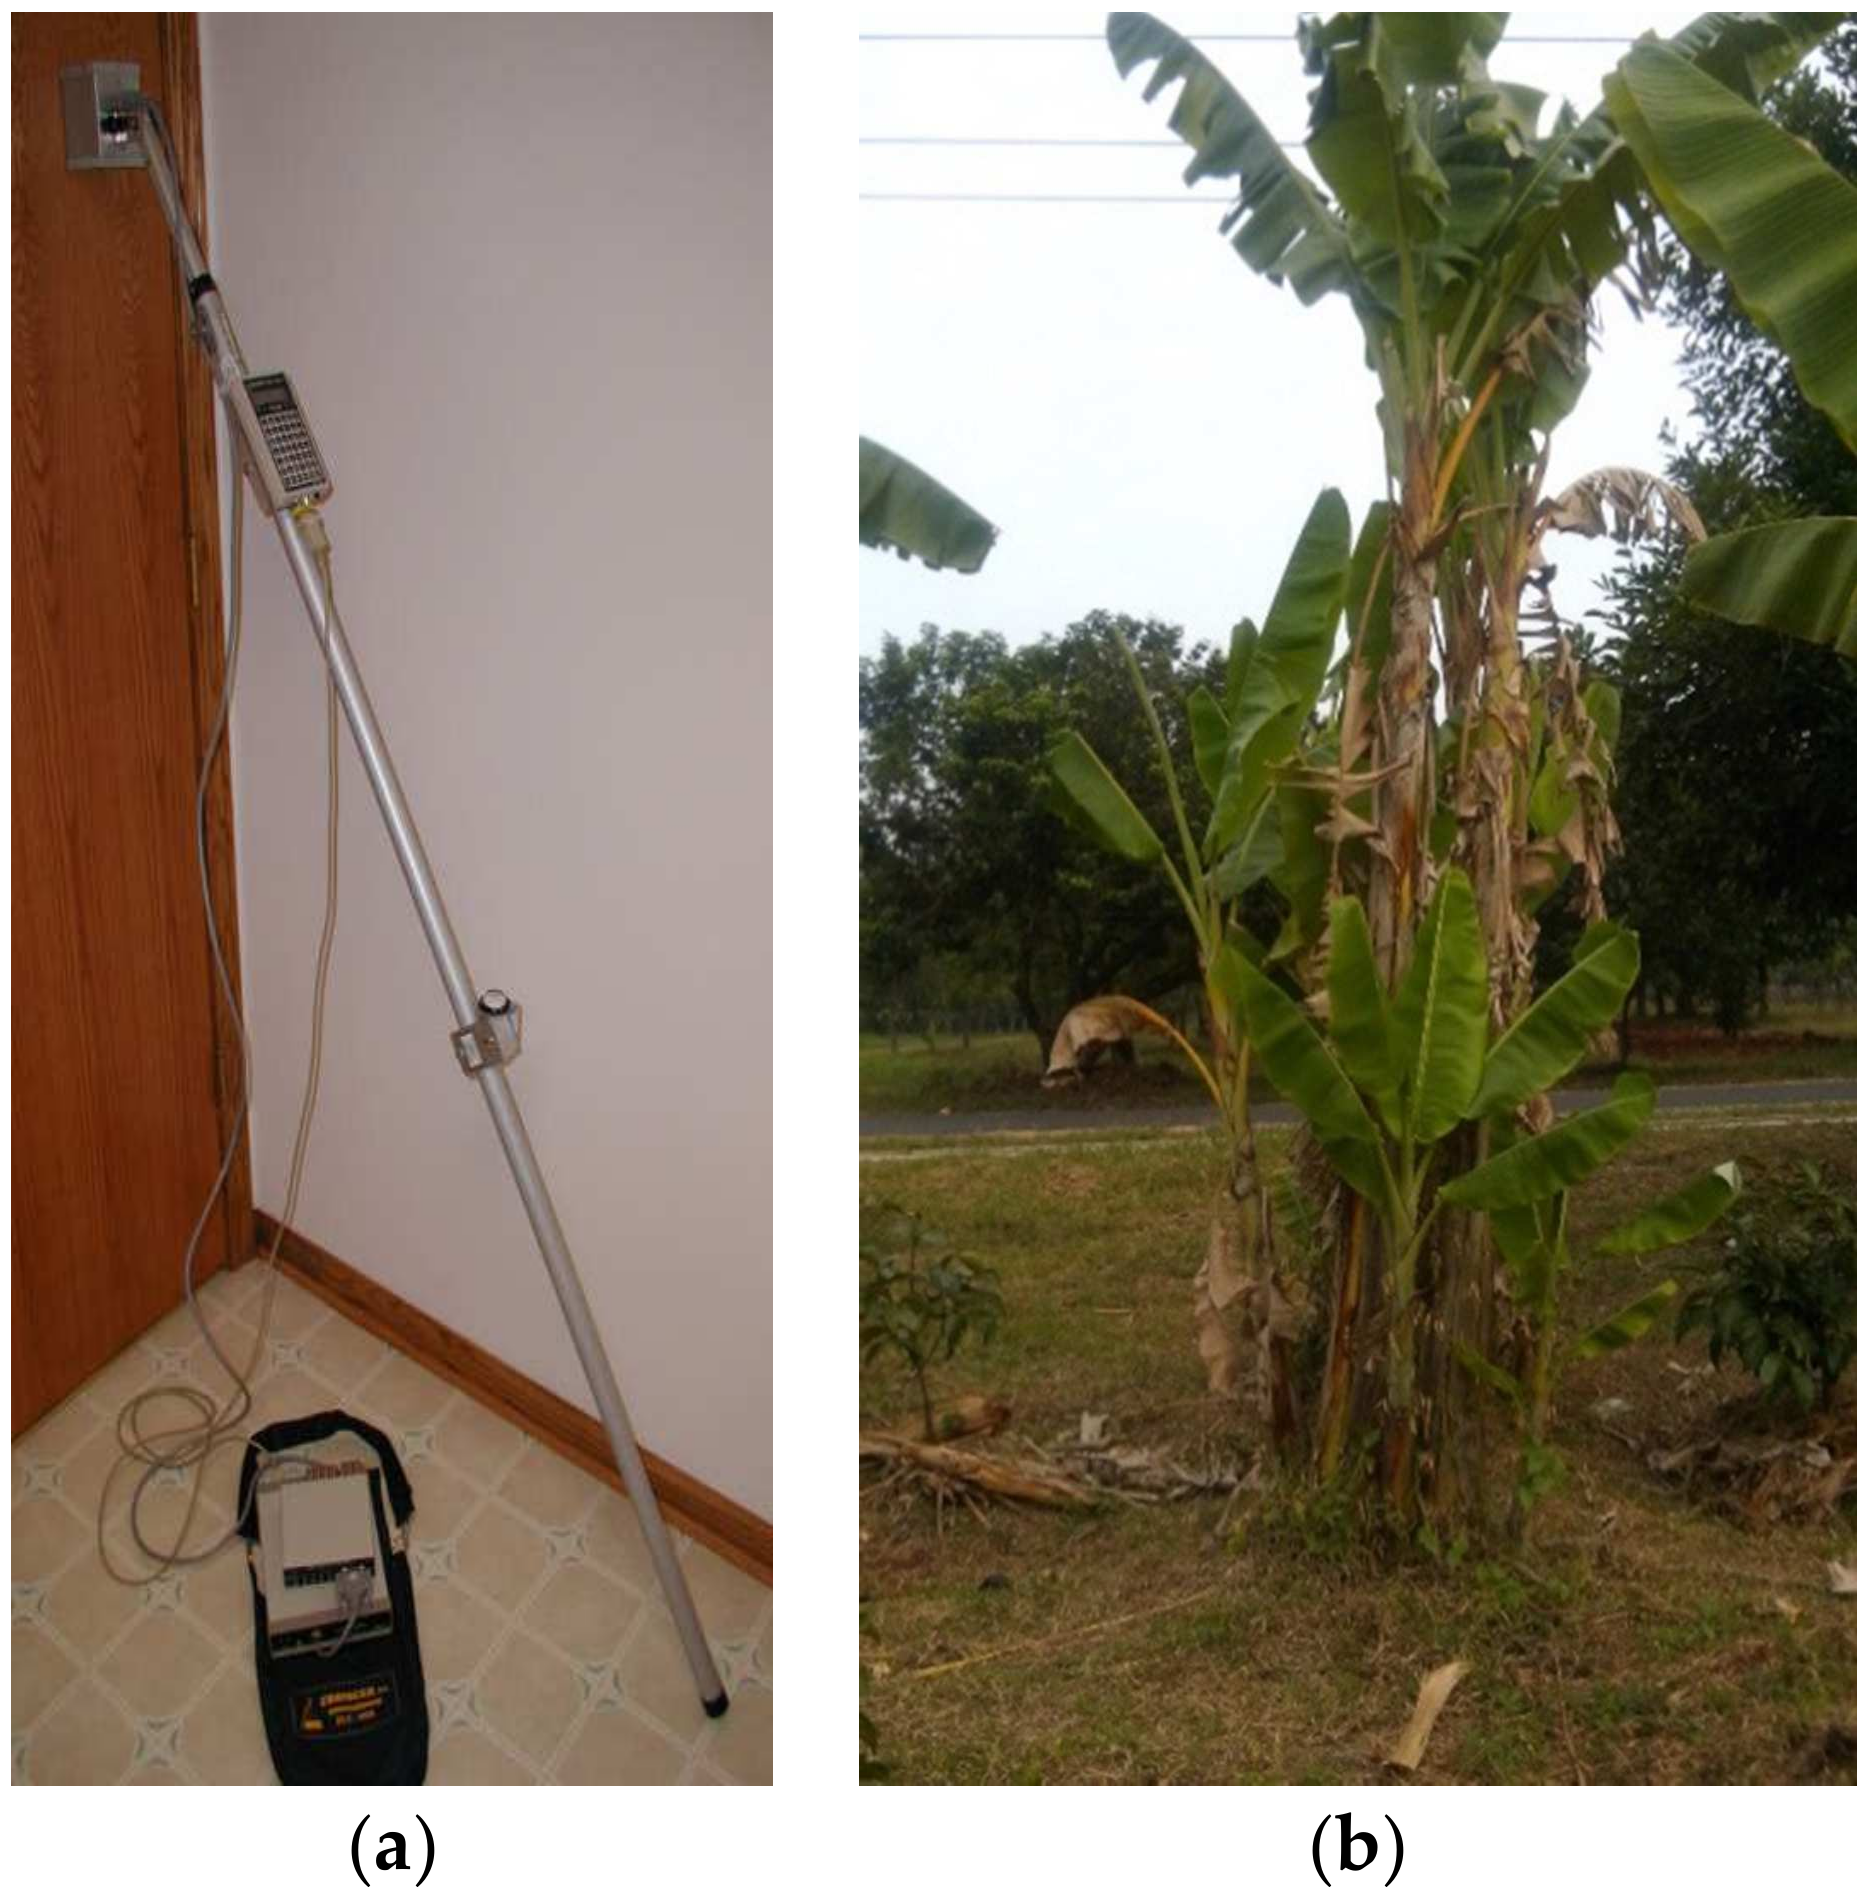
3.2. Observing the Diseases Inflicting Banana Herbs through Spectral Reflectance
3.3. Future Research
4. Conclusions
Author Contributions
Funding
Institutional Review Board Statement
Informed Consent Statement
Data Availability Statement
Conflicts of Interest
Abbreviations
| No | Abbreviation | Expansion |
| 1 | BAM | Beta-amylase |
| 2 | BBTD | Bunchy top disease |
| 3 | DSM | Digital surface model |
| 4 | DTM | Digital terrain model |
| 5 | GIS | Geographic information systems |
| 6 | GNDWI | Green normalized difference water index |
| 7 | GSD | Ground surface distance |
| 8 | OBIA | Implemented object image analysis |
| 9 | LAI | Leaf area index |
| 10 | MODIS | Moderate resolution imaging spectroradiometer |
| 11 | MCARI | Modified chlorophyll absorption in reflectance index |
| 12 | NIR | Near-infrared |
| 13 | NDII | Normalized difference infrared index |
| 14 | NDVI | Normalized difference vegetation index |
| 15 | NDWI | Normalized difference water index |
| 16 | PME | Pectin methylesterase |
| 17 | PMEI | Pectin methylesterase inhibitor |
| 18 | RGB | Red, green, and blue |
| 19 | RWC | Regression water content |
| 20 | RS | Remote sensing |
| 21 | SEBAL | Surface energy balance algorithm for land |
| 22 | TIRS | Thermal infrared sensors |
| 23 | UAV | Unmanned aerial vehicle |
| 24 | VRI | Vegetation ratio index |
| 25 | WCI | Water content index |
| 26 | BXW | Xanthomonas wilt of banana |
References
- D’hont, A.; Denoeud, F.; Aury, J.M.; Baurens, F.C.; Carreel, F.; Garsmeur, O.; Noel, B.; Bocs, S.; Droc, G.; Rouard, M.; et al. The banana (Musa acuminata) genome and the evolution of monocotyledonous plants. Nature 2012, 488, 213–217. [Google Scholar] [CrossRef] [Green Version]
- De Langhe, E.; Vrydaghs, L.; De, P.; Perrier, X.; Denham, T. Why Bananas Matter: An introduction to the history of banana domestication. Ethnobot. Res. Appl. 2009, 7, 165–177. [Google Scholar] [CrossRef] [Green Version]
- Simmonds, N.W. The Evolution of the Bananas; Longmans: London, UK, 1962. [Google Scholar]
- Bakry, F.; Carreel, F.; Jenny, C.; Horry, J.-P. Genetic Improvement of Banana. In Breeding Plantation Tree Crops; Jain, S.M., Priyadarshan, P.M., Eds.; Springer: New York, NY, USA, 2009; ISBN 978-0-387-71199-7. [Google Scholar]
- Perrier, X.; De Langhe, E.; Donohue, M.; Lentfer, C.; Vrydaghs, L.; Bakry, F.; Carreel, F.; Hippolyte, I.; Horry, J.P.; Jenny, C.; et al. Multidisciplinary perspectives on (Musa spp.) domestication. Proc. Natl. Acad. Sci. USA 2011, 108, 11311–11318. [Google Scholar] [CrossRef] [PubMed] [Green Version]
- Wikantika, K.; Dwivanny, F.M.; Ghazali, M.F.; Sutanto, A.; Kamalesha, G. Pisang Indonesia, 1st ed.; ITB Press: Bandung, Indonesia, 2021. [Google Scholar]
- FAO. Banana Market Review–Preliminary Results 2020; FAO: Rome, Italy, 2021; Volume 9. [Google Scholar]
- Harto, A.B.; Prastiwi, P.A.D.; Ariadji, F.N.; Suwardhi, D.; Dwivany, F.M.; Nuarsa, I.W.; Wikantika, K. Identification of banana plants from unmanned aerial vehicles (UAV) photos using object based image analysis (OBIA) method (a case study in Sayang Village, Jatinangor District, West Java). HAYATI J. Biosci. 2019, 26, 7–14. [Google Scholar] [CrossRef]
- Ye, H.; Huang, W.; Huang, S.; Cui, B.; Dong, Y.; Guo, A.; Ren, Y.; Jin, Y. Recognition of banana Fusarium wilt based on UAV remote sensing. Remote Sens. 2020, 12, 1–14. [Google Scholar] [CrossRef] [Green Version]
- Gomez Selvaraj, M.; Vergara, A.; Montenegro, F.; Alonso Ruiz, H.; Safari, N.; Raymaekers, D.; Ocimati, W.; Ntamwira, J.; Tits, L.; Omondi, A.B.; et al. Detection of banana plants and their major diseases through aerial images and machine learning methods: A case study in DR Congo and Republic of Benin. ISPRS J. Photogramm. Remote Sens. 2020, 169, 110–124. [Google Scholar] [CrossRef]
- Ghazali, M.F.; Wikantika, K.; Dwivany, F.M. A preliminary result of monitoring banana (Musa sp) ripening process and its relationship with water content based on remote sensing analysis. Hayati J. Biosci. 2018, 22. [Google Scholar]
- Koesyani, S.F.D.; Dwivany, F.M.; Wikantika, K. Spectral reflectance analysis of banana in fruit ripening process. In Proceedings of the Proceedings Asian Conference on Remote Sensing, Kuala Lumpur, Malaysia, 15–19 October 2018; 2018; pp. 724–729. [Google Scholar]
- Sinha, P.; Robson, A.; Schneider, D.; Kilic, T.; Mugera, H.K.; Ilukor, J.; Tindamanyire, J.M. The potential of in-situ hyperspectral remote sensing for differentiating 12 banana genotypes grown in Uganda. ISPRS J. Photogramm. Remote Sens. 2020, 167, 85–103. [Google Scholar] [CrossRef]
- Neupane, B.; Horanont, T.; Hung, N.D. Deep learning based banana plant detection and counting using high-resolution red-green-blue (RGB) images collected from unmanned aerial vehicle (UAV). PLoS One 2019, 14, 1–22. [Google Scholar] [CrossRef]
- Dare, P.M. Shadow analysis in high-resolution satellite imagery of urban areas. Photogramm. Eng. Remote Sensing 2005, 71, 169–177. [Google Scholar] [CrossRef] [Green Version]
- Filippi, A.M.; Güneralp, İ. Influence of shadow removal on image classification in riverine environments. Opt. Lett. 2013, 38, 1676. [Google Scholar] [CrossRef] [PubMed]
- Delegido, J.; Verrelst, J.; Alonso, L.; Moreno, J. Evaluation of sentinel-2 red-edge bands for empirical estimation of green LAI and chlorophyll content. Sensors 2011, 11, 7063–7081. [Google Scholar] [CrossRef] [PubMed] [Green Version]
- Bramich, J.; Bolch, C.J.S.; Fischer, A. Improved red-edge chlorophyll-a detection for Sentinel 2. Ecol. Indic. 2021, 120, 106876. [Google Scholar] [CrossRef]
- Clevers, J.G.P.W.; Gitelson, A.A. Remote estimation of crop and grass chlorophyll and nitrogen content using red-edge bands on sentinel-2 and-3. Int. J. Appl. Earth Obs. Geoinf. 2013, 23, 344–351. [Google Scholar] [CrossRef]
- Xiao, C.; Li, P.; Feng, Z.; Liu, Y.; Zhang, X. Sentinel-2 red-edge spectral indices (RESI) suitability for mapping rubber boom in Luang Namtha Province, northern Lao PDR. Int. J. Appl. Earth Obs. Geoinf. 2020, 93, 102176. [Google Scholar] [CrossRef]
- Choosumrong, S.; Hataitara, R.; Mekarun, P. Application of UAV multi - spectral camera for estimating bananas disease infestations in complex farming in Phitsanulok Province. In Proceedings of the International Symposium on Geoinformatics for Spatial Infrastructure Development in Earth and Allied Sciences, Phitsanulok, Thailand, 2–4 September 2021; Japan Vietnam Geoinformation Concorcium: Pithsanulok, Thailand, 2021; p. 6. [Google Scholar]
- Silva, T.T.S.; Guerra, H.O.C.; Silva, B.B.; Santos, C.L.M.; Guimarães, J.P.; Santos, J.S. dos Evapotranspiration of banana using the SEBAL algorithm in an irrigated perimeter from the Northeastern Brazil. Brazilian J. Agric. Environ. Eng. 2021, 25, 149–155. [Google Scholar]
- Johansen, K.; Phinn, S. Mapping banana plantations in North Australia from objectoriented classification of SPOT-5 data. In Proceedings of the 28th Asian Conference on Remote Sensing: (ACRS 2007), Kuala Lumpur, Malaysia, 12–16 November 2007; 2007; 1, pp. 139–144. [Google Scholar]
- Nuarsa, I.W.; Dibia, I.N.; Wikantika, K.; Suwardhi, D.; Rai, I.N. Gis based analysis of agroclimate land suitability for Banana plants in Bali Province, Indonesia. HAYATI J. Biosci. 2018, 25, 11–17. [Google Scholar] [CrossRef]
- Wikantika, K.; Ghazali, M.F.; Dwivanny, F.M.; Yayusman, L.F. Desa Bukti: Desa Cerdas Berbasis Pisang Pertama di dunia, 1st ed.; ITB Press: Bandung, Indonesia, 2021. [Google Scholar]
- Hiariej, A.; Laras Arumingtyas, E.; Widoretno, W.; Azrianingsih, R. Phenotypic Variation of Fei Banana (Musa troglodytarum L.) Originated Maluku Islands. Res. J. Pharm. Biol. Chem. Sci. 2015, 6, 652–658. [Google Scholar]
- Dwivany, F.M.; Stefani, G.; Sutanto, A.; Nugrahapraja, H.; Wikantika, K.; Hiariej, A.; Hidayat, T.; Rai, I.N.; Sukriandi, N. Genetic relationship between tongka langit bananas (Musa troglodytarum l.) from galunggung and maluku, indonesia, based on its2. HAYATI J. Biosci. 2020, 27, 258–265. [Google Scholar] [CrossRef]
- Ernatip Upacara ‘Ngaben’ Di Desa Rama Agung–Bengkulu Utara. J. Penelit. Sej. Dan Budaya 2019, 4, 1115–1133. [CrossRef]
- Sunariani, N.N.; Sukarsa, M.; Budhi, M.K.S.; Marhaen, A. Kontribusi Pelaksanaan Ritual Hindu Terhadap Kesempatan Kerja Dan Kesejahteraan Masyarakat Di Kabupaten Badung Provinsi Bali (Studi Kasus Mlaspas Dan Ngenteg Linggih Di Pura Pasek Preteka Desa Abiansemal). J. Ekon. Kuantitatif Terap. 2015, 7, 145–154. [Google Scholar] [CrossRef]
- Banana Smart Village Biodiversity for Better Society. Available online: https://bananasmartvillages-gisitb.opendata.arcgis.com/ (accessed on 14 December 2021).
- Ismail, A.; Rachmadi, M.; Bana, N. Eksplorasi jenis-jenis pisang plantain lokal asal desa Sukaharja dan desa Sukamulih Tasikmalaya, Jawa barat sebagai sumber bibit unggul. J. Apl. Ipteks untuk Masy. 2014, 3, 92–97. [Google Scholar]
- Kasrina, K.; Zulaikha, A. Pisang Buah (Musa Spp): Keragaman Dan Etnobotaninya Pada Masyarakat Di Desa Sri Kuncoro Kecamatan Pondok Kelapa Kabupaten Bengkulu Tengah. In Proceedings of the Prosiding Semirata FMIPA Universitas Lampung, Iguazu, Brazil, 10–12 May 2013; pp. 33–40. [Google Scholar]
- Hapsari, L.; Kennedy, J.; Lestari, D.A.; Masrum, A.; Lestarini, W. Ethnobotanical survey of bananas (Musaceae) in Six districts of East Java, Indonesia. Biodiversitas 2017, 18, 160–174. [Google Scholar] [CrossRef]
- Cheryl, N. Pendataan kesesuaian lahan berupa edafik dan mikroklimat kultivar pisang di pulau Ambon dan pulau Seram, Provinsi Maluku; ITB: Bandung, Indonesia, 2018. [Google Scholar]
- Dwivany, F.M.; Ghazali, M.F.; Suwardhi, D.; Sutanto, A.; Hiariej, A.; Puturuhu, F.; Meitha, K.; Nugrahapraja, H.; Yayusman, L.F.; Kamalesha, G.; et al. Karakterisasi Pisang Berbasis GeoBioSpektral; ITB: Bandung, Indonesia, 2019; ISBN 978-623-7165-62-0. [Google Scholar]
- Gao, B.C. NDWI-A Normalized Difference Water Index for Remote Sensing of Vegetation Liquid Water from Space. Remote Sens. Environ. 1996, 58, 257–266. [Google Scholar] [CrossRef]
- McFeeters, S.K. The Use of The Normalized Difference Water Index (NDWI) in The Delineation of Water Feature. Int. J. Remote Sens. 1996, 17, 425–1432. [Google Scholar] [CrossRef]
- Dwivany, F.; Esyanti, R.R.; Robertlee, J.; Paramaputra, I.C.; Permatadewi, R.K.; Tambun, D.H.; Handayani, R.U.; Sa Pratiwi, A.; Zaskia, H. Environment effect on fruit ripening related gene to develop a new post harvest technology. AIP Conf. Proc. 2014, 1589, 285–287. [Google Scholar] [CrossRef]
- Ploetz, R.C.; Thomas, J.E.; Slabaugh, W.R. Diseases of Banana and Plantain. In Diseases of Tropical Fruit Crops; Ploetz, R.C., Ed.; CABI Publishing: Oxfordshire, UK, 2003; ISBN 0851993907. [Google Scholar]
- Jones, D.R.; Daniells, J.W. Introduction to Banana, Abacá and Enset. In Handbook of Diseases of Banana, Abacá and Enset; Jones, D.R., Ed.; CABI: Oxfordshire, UK, 2018; ISBN 9781780647197. [Google Scholar]
- Soesanto, L.; Mugiastuti, E.; Ahmad, F. Diagnosis Lima Penyakit Utama Karena Jamur Pada 100 Kultivar Bibit Pisang. J. Hama dan Penyakit Tumbuh. Trop. 2013, 12, 36–45. [Google Scholar] [CrossRef]
- Bioversity International. Screening for Resistance to Fusarium Wilt; Bioversity International: Rome, Italy, 2014; Volume 4, Available online: https://www.bioversityinternational.org/e-library/publications/detail/use-of-banana-diversity-for-nutritious-diets/ (accessed on 14 December 2021).
- Huda, M. Pengendalian layu fusarium pada tanaman pisang (Musa paradisiaca l.) secara kultur teknis dan hayati; IPB (Bogor Agricultural University): Bogor Regency, Indonesia, 2010; Available online: https://repository.ipb.ac.id/handle/123456789/27524?show=full (accessed on 14 December 2021).
- Loeillet, D. Close-up banana. Fruitrop Magazine, Montpellier, France, April 2016; 66–124. [Google Scholar]
- Xue, L.; Cao, W.; Luo, W.; Dai, T.; Zhu, Y. Monitoring Leaf Nitrogen Status in Rice with Canopy Spectral Reflectance. Agron. J. 2004, 96, 135–142. [Google Scholar] [CrossRef]
- Hardisky, M.A.; Klemas, V.; Smart, R.M. The Influence of Soil Salinity, Growth Form, and Leaf Moisture on-the Spectral Radiance of ~ partina alterniflora Canopies. Photogramm. Eng. Remote Sens. 1983, 49, 77–83. [Google Scholar]
- Dwivany, F.M.; Nugrahapraja, H.; Fukusaki, E.; Putri, S.P.; Novianti, C.; Radjasa, S.K.; Fauziah, T.; Nirmala Sari, L.D. Dataset of Cavendish banana transcriptome in response to chitosan coating application. Data Br. 2020, 29. [Google Scholar] [CrossRef] [PubMed]
- Martha, F.; Nugrahapraja, H. Transcriptome dataset of ethylene-treated Klutuk Wulung banana. Data Br. 2021, 38, 107376. [Google Scholar] [CrossRef]
- Aulia, A.; Parijadi, R.; Yamamoto, K.; Maulana, M.; Ikram, M. Metabolome Analysis of Banana (Musa acuminata) Treated With Chitosan Coating and Low Temperature Reveals Different Mechanisms Modulating Delayed Ripening. Front. Sustain. Food Syst. 2022, 6, 1–11. [Google Scholar] [CrossRef]
- Nugrahapraja, H.; Putri, A.E.; Martha, D.F. Genome-wide Identification and Characterization of the Pectin Methylesterase (PME) and Pectin Methylesterase Inhibitor (PMEI) Gene Family in the Banana A-genome (Musa acuminata) and B-genome (Musa balbisiana). Res. J. Biotechnol. 2021, 16, 179–191. [Google Scholar]
- Setiabudi, E.; Meitha, K.; Dwivany, F.M. In silico characterization and comparison of the fruit ripening related beta-amylase (BAM) gene family in banana genome A and B. Indones. J. Biotechnol. 2021, 26, 175–182. [Google Scholar] [CrossRef]


| Band | Bandwidth | Band | Bandwidth | Band | Bandwidth | Band | Bandwidth |
|---|---|---|---|---|---|---|---|
| Land/Cloud/Aerosols Boundaries | Ocean Color/Phytoplankton/Biogeochemistry | Surface/Cloud Temperature | Ozone | ||||
| 1 | 620–670 | 11 | 526–536 | 21 | 3.929–3.989 | 30 | 9.580–9.880 |
| 2 | 841–876 | 12 | 546–556 | 22 | 3.929–3.989 | Surface/Cloud Temperature | |
| Land/Cloud/Aerosols Properties | 13 | 662–672 | 23 | 4.020–4.080 | 31 | 10.780–11.280 | |
| 3 | 459–479 | 14 | 673–683 | Atmospheric Temperature | 32 | 11.770–12.270 | |
| 4 | 545–565 | 15 | 743–753 | 24 | 4.433–4.498 | Cloud Top Altitude | |
| 5 | 1230–1250 | 16 | 862–877 | 25 | 4.482–4.549 | 33 | 13.185–13.485 |
| 6 | 1628–1652 | Atmospheric Water Vapour | Cirrus Clouds’ Water Vapour | 34 | 13.485–13.785 | ||
| 7 | 2105–2155 | 17 | 890–920 | 26 | 1.360–1.390 | 35 | 13.785–14.085 |
| Ocean Color/Phytoplankton/Biogeochemistry | 18 | 931–941 | 27 | 6.535–6.895 | 36 | 14.085–14.385 | |
| 8 | 405–420 | 19 | 915–965 | 28 | 7.175–7.475 | ||
| 9 | 438–448 | Surface/Cloud Temperature | Cloud Properties | ||||
| 10 | 483–493 | 20 | 3.660–3.840 | 29 | 8.400–8.700 | ||
| Band Name | Satellite Sensors | Function | |||||||
|---|---|---|---|---|---|---|---|---|---|
| Worldview | Quickbird | SPOT-7 | Sentinel 2 | Landsat 5 | Landsat 7 | Landsat 8 | MODIS. | ||
| Spatial Resolution (m) | 0.31–1.24 | 2.62–6.5 | 1.5–6 | 10, 20, 60 | 60 | 15–30 | 15–30 | 500 | |
| Coastal aerosol | V | V | V | Conducts coastal and aerosol studies | |||||
| Blue | V | V | V | V | V | V | V | Conducts bathymetric mapping, distinguishing soil from vegetation | |
| Green | V | V | V | V | V | V | V | V | Emphasises peak vegetation for assessing plant vigour |
| Red | V | V | V | V | V | V | V | V | Differentiates vegetation slopes |
| Near-Infrared (NIR) | V | V | V | V | V | V | V | V | Emphasises biomass content and shorelines |
| RedEdge | V | V | Conducts vegetation analysis | ||||||
| Short-wave Infrared (SWIR.) | V | V | V | V | Differentiates the moisture content of various soils and vegetation | ||||
| Panchromatic | V | V | V | V | V | Provides a sharper image with a 15-m resolution | |||
| Cirrus | V | V | Provides enhanced detection of cirrus cloud contamination | ||||||
| Thermal infrared sensors (TIRS.) | V | V | Conducts thermal mapping and estimates soil moisture | ||||||
| Individual Herbs | Small to large plantation | Largest Plantation | |||||||
| No | Agro-Climate Parameters | Suitability Levels | |||
|---|---|---|---|---|---|
| Most (S1) | Moderate (S2) | Least (S3) | Not (S4) | ||
| 1 | Elevation | <1200 | 1200–1500 | 1500–2000 | >2000 |
| 2 | Rainfall | 1500–2500 | 1250–1500 | 1000–1250 | <1000 |
| 3 | Dry months | 0–3 | 3–4 | 4–6 | >6 |
| 4 | Slope | <8 | 8–16 | 16–40 | >40 |
| Code | Cultivars | Villages/District | Regency/City | Coordinate | Elevation (asl) | |
|---|---|---|---|---|---|---|
| AMB001 | Tongka Langit (buah besar) a | Waai, Salahutu | Maluku Tengah | −3.566744° | 128.321402° | 12 |
| AMB002 | 40 Hari a | Waai, Salahutu | Maluku Tengah | −3.566744° | 128.321402° | 12 |
| AMB003 | Jawaka a | Waai, Salahutu | Maluku Tengah | −3.559172° | 128.323291° | 8 |
| AMB004 | Susu Ternate | Passo, Baguala | Ambon | −3.641080° | 128.263245° | 32 |
| AMB005 | Yangambi a | Hutumuri, Leitimur Selatan | Ambon | −3.672499° | 128.297543° | 65 |
| AMB006 | Jarum a | Hutumuri, Leitimur Selatan | Ambon | −3.669245° | 128.295009° | 41 |
| AMB007 | Kepok Biasa a | Yapila, Holo, Amahai | Maluku Tengah | −3.242606° | 129.073933° | 38 |
| AMB008 | Abu Ternate a | Yapila, Holo, Amahai | Maluku Tengah | −3.242606° | 129.073933° | 38 |
| AMB009 | Masak Bodo a | Yapila, Holo, Amahai | Maluku Tengah | −3.242606° | 129.073933° | 38 |
| AMB010 | Tanduk a | Layeni, Teon Nila Serua | Maluku Tengah | −3.205472° | 129.034921° | 59 |
| AMB011 | Udang a | Layeni, Teon Nila Serua | Maluku Tengah | −3.205472° | 129.034921° | 59 |
| AMB012 | Mas/Nona a | Layeni, Teon Nila Serua | Maluku Tengah | −3.205472° | 129.034921° | 59 |
| AMB013 | Sun a | Layeni, Teon Nila Serua | Maluku Tengah | −3.207823° | 129.036940° | 57 |
| AMB014 | Akuminata liar (jantung putih) wt | Awaiya, Teluk Elpapuih | Maluku Tengah | −3.197942° | 128.862649° | 38 |
| AMB015 | Akuminata liar (jantung merah) wt | Samasuru, Teluk Elpaputih | Maluku Tengah | −3.246674° | 128.822031° | 15 |
| AMB016 | Tongka Langit (buah kecil) | Hura, Amalatu | Seram Bagian Barat | −3.326760° | 128.697536° | 12 |
| AMB017 | Mulu Bebek a | Hura, Amalatu | Seram Bagian Barat | −3.326760° | 128.697536° | 12 |
| AMB018 | Ambon Hijau (jantung dua) a | Hura, Amalatu | Seram Bagian Barat | −3.326760° | 128.697536° | 12 |
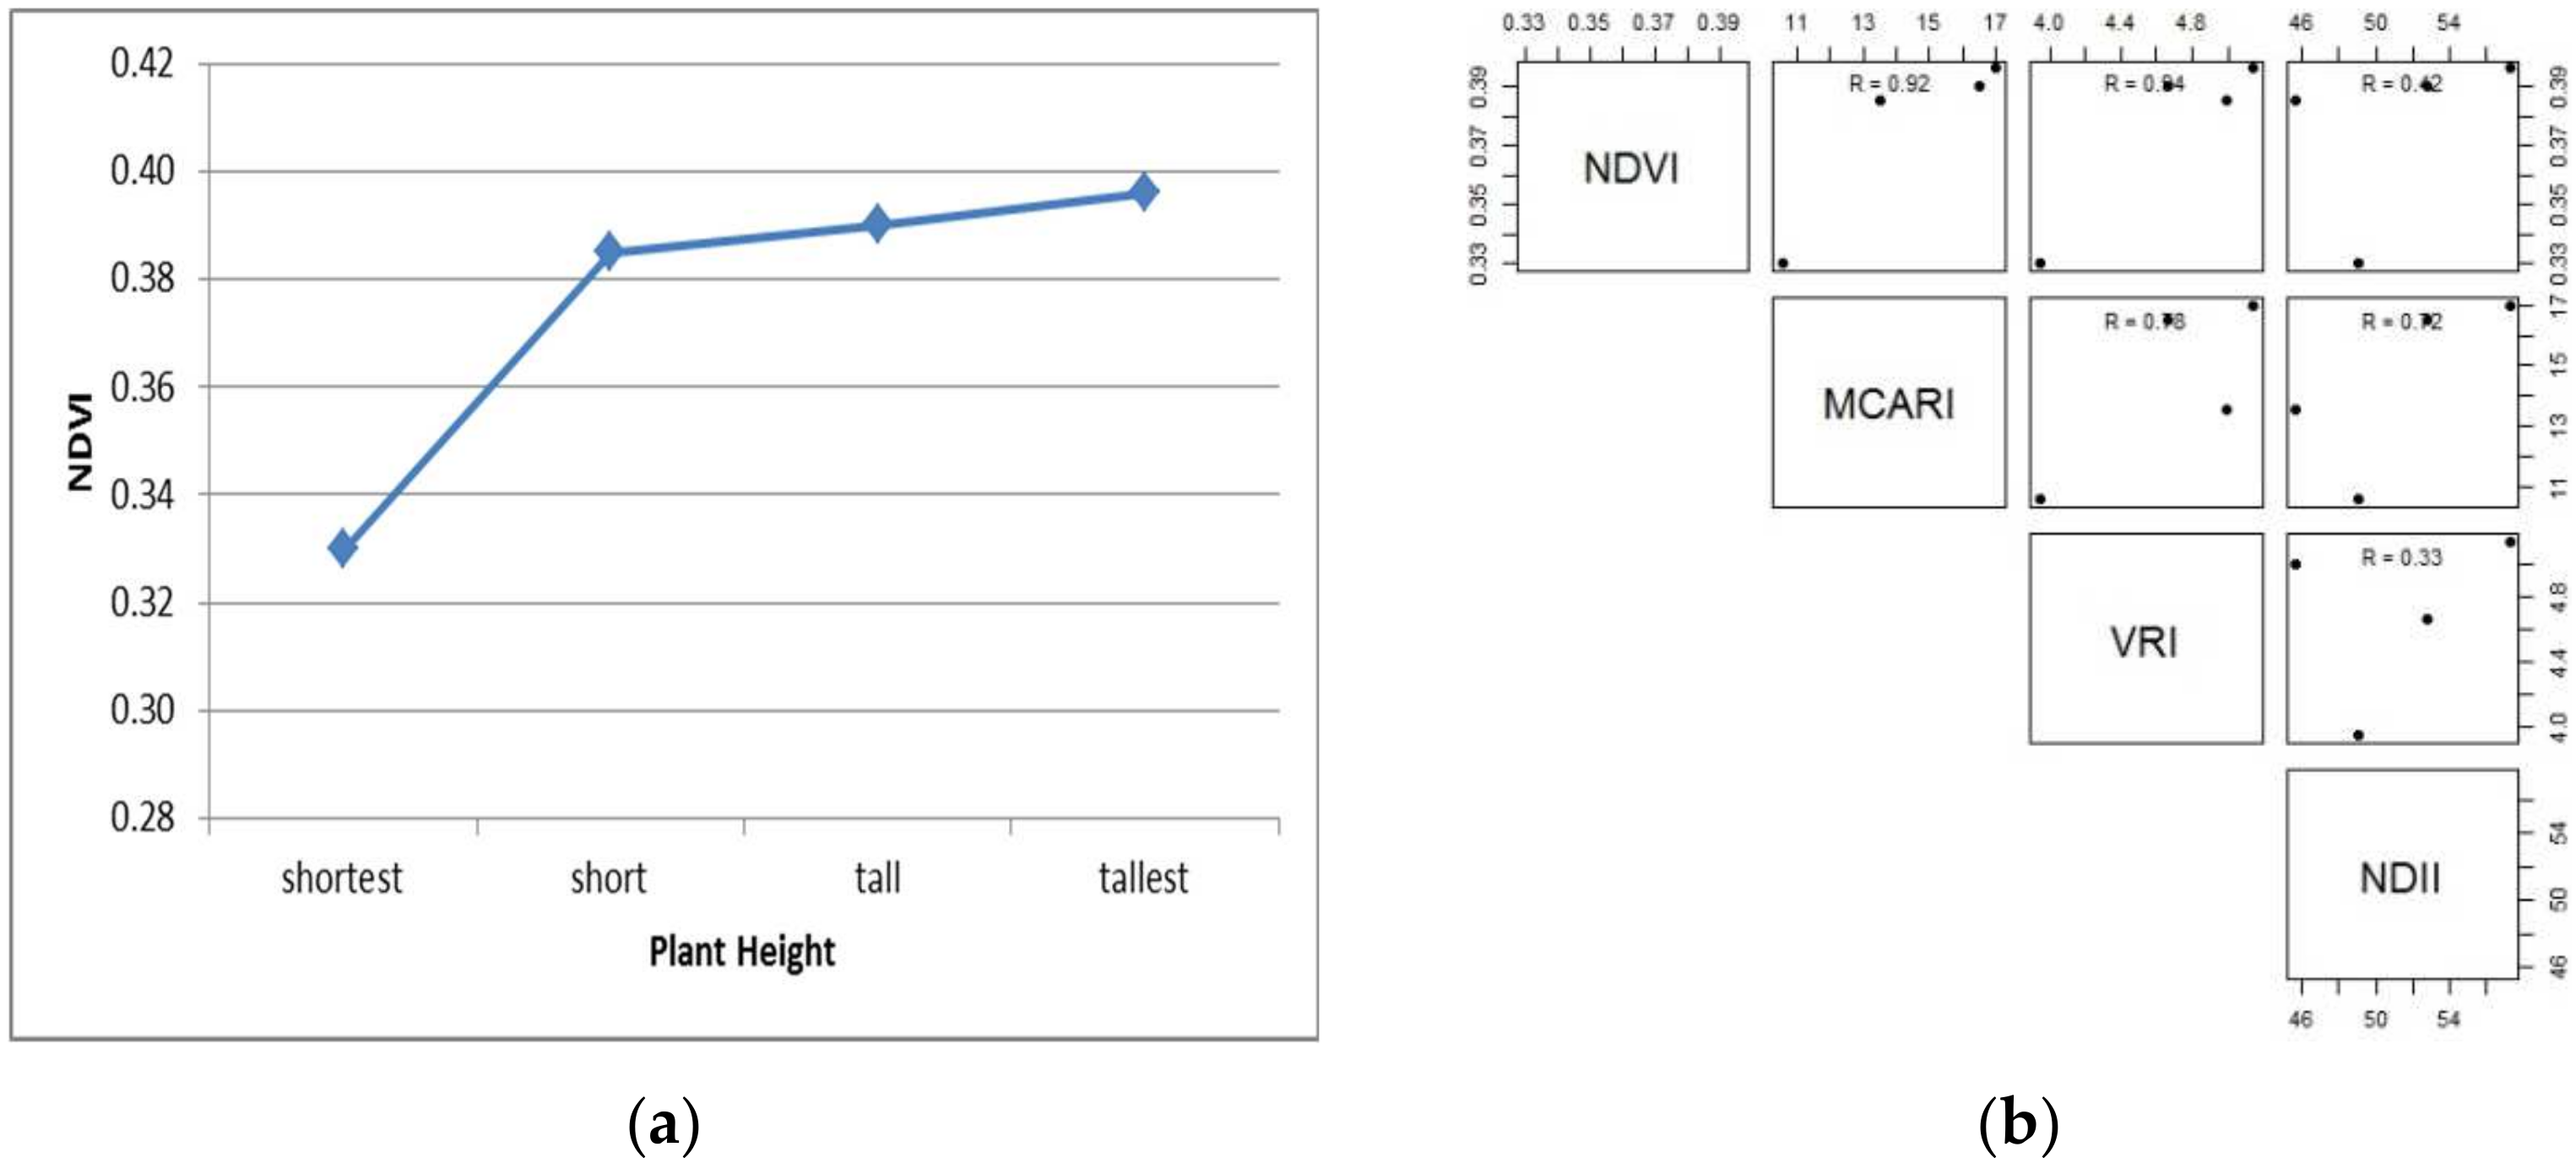
| Plant Height | Wavelength (nm) | |||||||||||||
|---|---|---|---|---|---|---|---|---|---|---|---|---|---|---|
| 520 | 560 | 561 | 600 | 630 | 660 | 661 | 662 | 690 | 760 | 810 | 855 | 1600 | 1650 | |
| shortest | 9.18 | 9.02 | 9.36 | 7.40 | 17.14 | 9.87 | 7.56 | 14.46 | 29.35 | 28.39 | 35.55 | 27.17 | 31.19 | 7.56 |
| short | 10.61 | 8.23 | 6.34 | 5.71 | 8.36 | 5.22 | 4.36 | 13.00 | 34.47 | 31.44 | 41.13 | 23.82 | 22.51 | 5.56 |
| tall | 12.44 | 9.89 | 6.01 | 5.90 | 6.39 | 3.56 | 3.40 | 13.37 | 48.27 | 47.12 | 46.12 | 23.95 | 22.95 | 5.15 |
| tallest | 12.24 | 9.91 | 6.09 | 5.36 | 6.67 | 3.77 | 3.57 | 14.43 | 49.94 | 46.69 | 50.99 | 26.53 | 26.81 | 5.74 |
| Plant Height | Average | NDVI | MCARI | VRI | NDII | |||
|---|---|---|---|---|---|---|---|---|
| Green | Red | NIR | SWIR | |||||
| shortest | 10.42 | 15.31 | 30.37 | 19.38 | 0.33 | 10.54 | 3.94 | 49.11 |
| short | 7.85 | 14.26 | 32.13 | 14.04 | 0.39 | 13.53 | 5.00 | 45.73 |
| tall | 8.13 | 17.15 | 39.06 | 14.05 | 0.39 | 16.51 | 4.66 | 52.75 |
| tallest | 8.05 | 17.93 | 41.40 | 16.28 | 0.40 | 17.02 | 5.15 | 57.29 |
Publisher’s Note: MDPI stays neutral with regard to jurisdictional claims in published maps and institutional affiliations. |
© 2022 by the authors. Licensee MDPI, Basel, Switzerland. This article is an open access article distributed under the terms and conditions of the Creative Commons Attribution (CC BY) license (https://creativecommons.org/licenses/by/4.0/).
Share and Cite
Wikantika, K.; Ghazali, M.F.; Dwivany, F.M.; Novianti, C.; Yayusman, L.F.; Sutanto, A. Integrated Studies of Banana on Remote Sensing, Biogeography, and Biodiversity: An Indonesian Perspective. Diversity 2022, 14, 277. https://doi.org/10.3390/d14040277
Wikantika K, Ghazali MF, Dwivany FM, Novianti C, Yayusman LF, Sutanto A. Integrated Studies of Banana on Remote Sensing, Biogeography, and Biodiversity: An Indonesian Perspective. Diversity. 2022; 14(4):277. https://doi.org/10.3390/d14040277
Chicago/Turabian StyleWikantika, Ketut, Mochamad Firman Ghazali, Fenny Martha Dwivany, Cindy Novianti, Lissa Fajri Yayusman, and Agus Sutanto. 2022. "Integrated Studies of Banana on Remote Sensing, Biogeography, and Biodiversity: An Indonesian Perspective" Diversity 14, no. 4: 277. https://doi.org/10.3390/d14040277