Article

DNA Barcoding of Fresh and Historical Collections of Lichen-Forming Basidiomycetes in the Genera Cora and Corella (Agaricales: Hygrophoraceae): A Success Story?

1
Botanical Research Institute of Texas, Fort Worth, TX 76107, USA
2
Department of Botany, Smithsonian Institution, National Museum of Natural History, 10th St. & Constitution Ave. NW, Washington, DC 20560, USA
3
Department of Biology, George Mason University, Fairfax, VA 22030, USA
4
Botanischer Garten, Freie Universität Berlin, Königin-Luise-Straße 6-8, 14195 Berlin, Germany
5
Negaunee Integrative Research Center, The Field Museum, 1400 South Lake Shore, Chicago, IL 60605, USA
6
Biología y Licenciatura en Biología, Universidad Distrital Francisco José de Caldas, Cra. 4 No. 26D-54, Torre de Laboratorios, Herbario, Bogotá D.C., Colombia
7
Biodiversity Knowledge Integration Center & School of Life Sciences, Arizona State University, Tempe, AZ 85287-4108, USA
8
Charles Darwin Foundation, Puerto Ayora 200305, Santa Cruz Island, Galápagos, Ecuador
9
Instituto Nacional de Biodiversidad, Quito 170506, Ecuador
10
Institut Für Pflanzenwissenschaften, Karl-Franzens-Universität Graz (University of Graz), Holteigasse 6, 8010 Graz, Austria
*
Author to whom correspondence should be addressed.
Diversity 2022, 14(4), 284; https://doi.org/10.3390/d14040284
Submission received: 24 February 2022 / Revised: 2 April 2022 / Accepted: 6 April 2022 / Published: 10 April 2022
(This article belongs to the Special Issue Plant DNA Barcodes, Community Ecology, and Species Interactions)

Abstract

:
Lichens collected worldwide for centuries have resulted in millions of specimens deposited in herbaria that offer the potential to assess species boundaries, phenotypic diversification, ecology, and distribution. The application of molecular approaches to historical collections has been limited due to DNA fragmentation, but high-throughput sequencing offers an opportunity to overcome this barrier. Here, we combined a large dataset of ITS sequences from recently collected material and historical collections, obtained through Sanger, 454, or Illumina Sequencing, to test the performance of ITS barcoding in two genera of lichenized Basidiomycota: Cora and Corella. We attempted to generate new sequence data for 62 fresh specimens (from 2016) and 274 historical collections (collected between 1888 and 1998), for a final dataset of 1325 sequences. We compared various quantitative approaches to delimit species (GMYC, bPTP, ASAP, ABGD) and tested the resolution and accuracy of the ITS fungal barcoding marker by comparison with a six-marker dataset. Finally, we quantitatively compared phylogenetic and phenotypic species delimitation for 87 selected Cora species that have been formally described. Our HTS approach successfully generated ITS sequences for 76% of the historical collections, and our results show that an integrative approach is the gold-standard for understanding diversity in this group.

1. Introduction

Natural history collections are invaluable resources for assessing biodiversity and studying the evolution, biology, ecology, morphology, anatomy, chemistry, and genetics of species [1,2,3]. They have primarily been used for biodiversity, taxonomy, and evolutionary research, but recent efforts, including those employing machine learning, have substantially broadened their use, allowing, for example, the evaluation of shifts associated with climate change [1,4,5,6]. In mycology, historical records have been used, for instance, to analyze changes in the fruiting date of mushrooms and how that relates to climate change [7], and to track phytopathogenic fungi (review by [8]). For lichenology in particular, a unique use of herbarium specimens has been to compare concentrations of different minerals in contemporary versus historical samples to assess how these levels may have changed over time [9,10,11].
High-throughput sequencing (HTS) has revolutionized collections-based research, as the commonly fragmented nature of DNA from historical (archival) specimens generally poses a challenge in Sanger sequencing [12,13]. This problem can be overcome by HTS approaches, not only allowing amplicon sequencing from less-degraded samples but also the assembly of partial or whole genomes in many cases [14,15].
Historical lichen collections, a term utilized here to describe material of at least two decades, have only been used in a limited number of genetic studies. Sohrabi et al. [16] were the first to successfully obtain a sequence acquired from a 75-year-old herbarium specimen of Aspicilia aschabadensis (J. Steiner) Mereschk. Subsequently, Redchenko et al. [17] sequenced multiple archival Caloplaca specimens, including the current record for oldest lichen specimen sequenced (a material from 1859) and Bendiksby et al. [18] sequenced specimens of Staurolemma omphalarioides (Anzi) P.M. Jørg. and Henssen of up to 100 years old. More recently, studies have started to utilize HTS to obtain DNA sequences from historical lichen collections. With two-step PCR and multiple primer combinations, Kistenich et al. [19] aimed to amplify a 900 base-pair mtSSU fragment from 56 specimens of eight different species, varying in age up to 125 years-old. They showed that consensus Ion Torrent sequences presented overall better quality than those generated by Sanger sequencing. Gueidan et al. [20] utilized PacBio amplicon sequencing and successfully recovered target sequence data from 89 of 96 samples (88.5%), with the studied samples being up to 25 years old. More recently, Gueidan and Li [21] furthered their studies to include 384 specimens collected between 1966 and 2020, quadrupling their sampling and including older samples with equivalent success rates (86.5%).
The first molecular study involving a historical basidiolichen collection was that of Schmull et al. [22], who successfully sequence the ITS1 region of a 30-year-old specimen of Dictyonema, describing a new, potentially hallucinogenic lichen, Dictyonema huaorani Dal Forno, Schmull, Lücking, and Lawrey. The first application of HTS for basidiolichen collections has been relatively recent: Lücking et al. [23] described the new species Cora timucua Dal Forno, Kaminsky, and Lücking, known only from archival specimens collected in Florida. The authors were able to generate sequences with both Sanger and Illumina sequencing from a sample from 1901, demonstrating that even Sanger sequencing can still be a valuable tool in attempting to acquire DNA sequences from archival specimens, as also shown by other studies [16,18,19]. Indeed, Sanger sequencing has been used successfully to obtain sequence data from historical collections of non-lichenized Basidiomycota [24,25].
The lichenized basidiomycete genus Cora Fr. presents a notable example of the usefulness of ITS in fungal barcoding for delimiting species and assessing biodiversity, as proposed by Schoch et al. [26]. Cora forms part of the Dictyonematinae subtribe, a lichenized lineage of five genera with different morphologies related to the non-lichenized mushroom genus Arrhenia Fr. [27,28,29]. Within this subtribe, Cora and the related genus Corella Vain. are distinguished by a foliose thallus with a compact surface, whereas the other genera (Acantholichen P.M. Jørg., Cyphellostereum D.A. Reid, Dictyonema C. Agardh ex Kunth) are filamentous or microsquamulose [28]. The taxonomy of foliose basidiolichens has suffered from the typical problems of traditional revisions based largely on herbarium collections that fail to recognize important field characters, such as consistency, lobe arrangement, color, and substrate (Figure 1). In addition, emphasis was historically placed on mycological characters, such as hymenophore anatomy and basidiospores, to establish species boundaries [30]. As a result, for a long time, only a single foliose species was recognized, named Dictyonema pavonium (Sw.) Parmasto and subsequently D. glabratum (Spreng.) D. Hawksw. [31], with all other previously proposed taxa, including those in the genus Corella, as synonyms [30].
Molecular approaches led to the realization that these foliose lichens represented more than one species and also supported the separation of the genera Cora and Corella [27,28]. A first broad sampling using the ITS barcoding locus resulted in an estimated 116 species of Cora and ten of Corella [32]. Although constituting a dramatic increase in species count, this estimate was still considered conservative: quantitative species recognition methods suggested up to 170 species based on the same data, and a novel prediction method, which takes into account unsampled regions and habitat suitability, estimated more than 450 species [32]. Soon after, with much increased sampling, Lücking et al. [33] distinguished 189 species. It is possible to challenge these findings based on potential problems in ITS barcoding, such as improper assessment of intragenomic variation or the occurrence of multiple ITS copies in the genome as a result of hybridization and introgression or gene duplication, possibly leading to taxonomic inflation or the recognition of artifactual taxa [34,35]. On the other hand, ITS has also been shown to lack resolution in recently evolving species complexes, including both non-lichenized and lichenized fungi [35,36,37,38,39], potentially counterbalancing issues with wrongly assessed ITS variation in terms of species counts but introducing additional inaccuracy.
In the genera Cora and Corella and in subtribe Dictyonematinae in general, the topology of ITS-based phylogenies has been found to be highly congruent with those of other markers, such as nuLSU and RPB2 [28,40], suggesting that ITS resolves these lineages accurately. Analysis of intragenomic variation of the ITS in Cora inversa Lücking and B. Moncada using a 454 pyrosequencing approach, did not demonstrate potential gene duplication or hybrid ITS arrays; instead, the variation detected stemmed almost entirely from sequencing errors and had no effect on accurate species delimitation when using a phylogenetic approach [41]. A similar result has been reported for the Rhizoplaca melanophthalma species complex, in which the observed ITS variation did not interfere with species discrimination in that group [42].
Phenotypes in phylogenetically delimited species of Cora are highly consistent with the underlying molecular data [33] and even photobiont haplotypes showed a high level of congruence with the ITS-based phylogeny of the associated mycobionts [43]. Therefore, in these lichenized Basidiomycota, ITS barcoding appears to provide highly accurate assessments of species richness.
Unfortunately, these earlier studies were biased towards geographic areas from which fresh material could be readily sampled. Natural history collections provide access not only to a much broader geographic range, but also to specimens that may have been sampled in regions that are now heavily altered or with their original habitats destroyed, as shown by the example of the possibly extinct Cora timucua [23,44]. Inserted within a broad phylogenetic and phenotypic framework, herbarium collections of Cora and Corella can thus provide unique opportunities to expand taxon and specimen sampling for these genera, to extend our understanding of their biology, and to test assumptions about geographical distributions of species currently only documented by recently collected material. The utility of historical collections in this regard is, however, dependent on the quality of the sequences obtained from these samples.
The United States National Herbarium (USA) at the Smithsonian National Museum of Natural History (SI-NMNH) is home to one of the largest lichen collections worldwide, with over 250,000 specimens. It contains one of the largest and most diverse collections globally of the subtribe Dictyonematinae, with over 400 specimens having broad geographical and temporal representation and unique morphologies. From these collections, we analyzed all Cora and Corella specimens, for a total of 274 samples with collection dates ranging from 1888 to 1998, complementing our already large dataset of 856 recently collected specimens from 18 countries (Figure 2) and representing the largest study of historical lichen collections using molecular approaches including HTS to date focusing on a single genus (most samples belong to Cora).
Our objectives for this study included: (1) testing the success rate of ITS barcoding from historical samples of Cora and Corella and comparing Sanger versus Illumina sequencing success; (2) expanding the existing ITS-based phylogeny with newly generated sequences and assessing the number of phylogenetically delimited species using various quantitative approaches (GMYC, bPTP, ABGD, ASAP) to test our earlier prediction of more than 450 species in this group; (3) further assessing potential intragenomic ITS variation by comparing Sanger and Illumina data from the same specimens; (4) testing the performance of ITS relative to a six-marker dataset using a subset of terminals; and (5) exploring the level of potential cryptic speciation in Cora and Corella by testing for consistency between molecular and morphological data.

2. Materials and Methods

2.1. Newly Generated Sequence Data from Fresh and Historical Collections
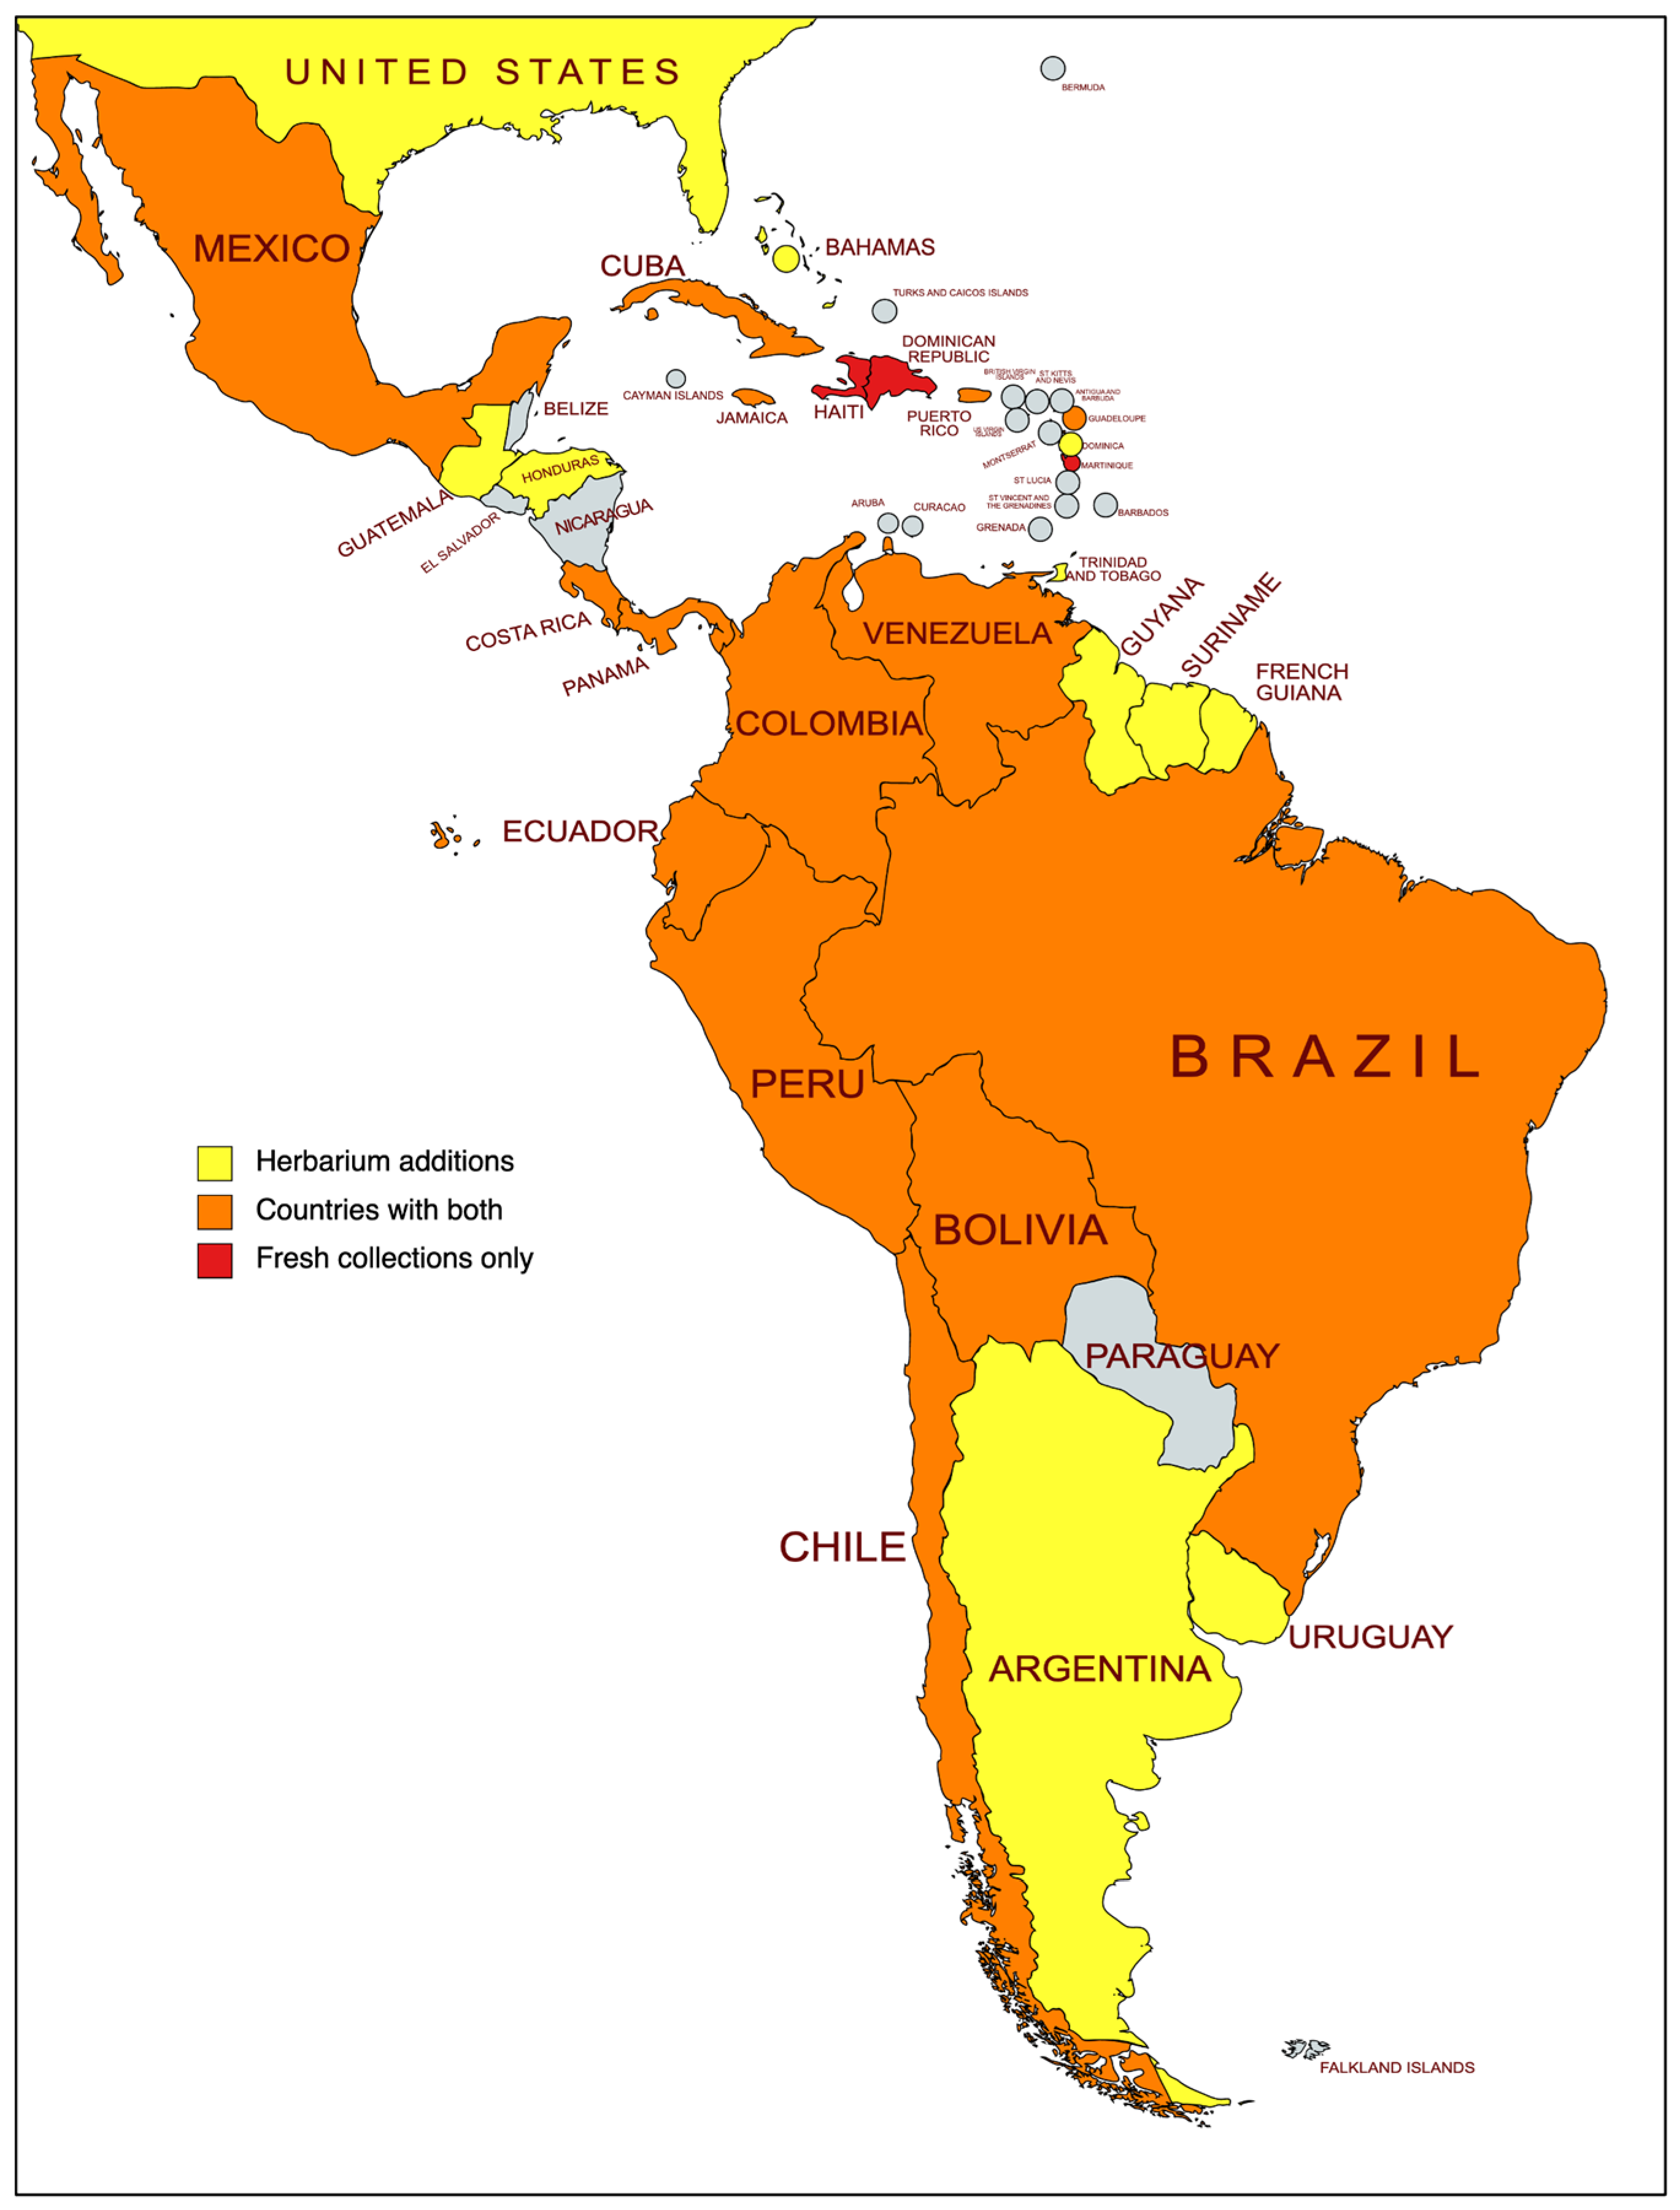
2.1.1. Sampling

Our entire dataset included 1130 unique samples (Table S1), 62 were new for this study (or “fresh specimens” from 2016) and 274 represented “historical specimens” (collected between 1888 and 1998, i.e., at least more than two decades ago). The majority of the contemporary samples (remaining 794 samples in the dataset) were collected during field trips between 2007 and 2018 throughout Mexico, Central and South America, and the Caribbean. The historical samples analyzed here are all deposited at the US Herbarium of the Smithsonian National Museum of Natural History. Contemporary samples are deposited at multiple herbaria (mainly B, CDS, CR, F, GMUF, UDBC, US; but also at CUVC, EB-BUAP, FAUC, KRAM, LPB, QCNE, UPR).

2.1.2. DNA Extractions

DNA was isolated from lichen fragments of approximately 1 cm2 using the PowerSoil®-htp 96 Well Soil DNA Isolation Kit (MO BIO, USA, now the DNeasy® PowerSoil® HTP 96 kit, Qiagen, Germantown, MD, USA) following Marotz et al. [45]. Prior to DNA extraction, each individual lichen fragment was cleaned in 0.85% NaCl and subsequently in sterile water.

2.1.3. PCR, ITS Sanger Sequencing and Assembly

PCR amplification and Sanger sequencing followed the protocols established by Dal Forno et al. [28,40]. Newly generated sequences were organized and assembled in Geneious Prime 2 January 2020. We considered as an “accepted sequence” any piece longer than 100 bp (before any trimming) that matched the target genus.

2.1.4. PCR, ITS Illumina Sequencing and Bioinformatic Analyses

Foliose members of Dictyonematinae (Cora and Corella) were processed with protocols from the Earth Microbiome Project (EMP, https://earthmicrobiome.org/protocols-and-standards/ accessed on 5 July 2017). For the ITS Illumina Amplicon Protocol, primers ITS1F [46] and ITS2 [47] were ordered with Illumina constructs, so there is no need for additional PCR steps to attach Illumina barcodes, following Caporaso et al. [48]. Each sample was amplified with PCR in triplicate [49], with reactions combined after gel electrophoresis. DNA concentrations were measured with QubitTM dsDNA Broad Range Assay Kit (InvitrogenTM, Waltham, MA, USA) and 240 ng of each PCR product was pooled into a single tube for each plate (amplicon pool). Each pool contained 96 samples plus two negatives. The quantity of negative sample added to each amplicon pool was the average used volume per plate (ranging from 11 μL to 30 μL). The post-PCR DNA yields from fresh specimens ranged from 16.7 to 54.4 ng/μL and from 1.9 to 50.48 ng/μL for historical samples. Amplicon pools were then cleaned with UltraClean PCR Clean-Up Kit (MO BIO, Carlsbad, CA, USA) following the manufacturer’s protocol, but followed by one or more additional pool clean ups with AMPure XP beads (Beckman Coulter, Brea, CA, USA; modification from EMP protocol needed, given that only utilizing the suggested clean up kit would not be sufficient to remove primer dimers, unincorporated DNTPs, etc. when visualized in a 1% gel). The two pools (one for each plate) were then combined and a qPCR with a KAPA Library Quantification Kit for Illumina® platforms was performed (Kapa Biosystems, Wilmington, MA, USA). A 2-nM dilution was made and finally sequenced in a MiSeq Kit v2 500 cycles (paired end 2 × 250 bp; Illumina, Inc., San Diego, CA, USA) in house at the Laboratories of Analytical Biology (LAB) of the SI-NMNH (Washington, DC, USA).
Samples were de-multiplexed and processed bioinformatically using QIIME2 [50]. Sequences were de-noised using DADA2 [51]. Taxonomy was assigned with the UNITE dynamic fungal classifier [52] with the “feature-classifier classify-sklearn” option in QIIME2. Newly generated tables were compiled into a single file with Amplicon Sequence Variation (ASV) reads, number of reads per ASV and per sample, number of times that ASV was observed across samples, and taxonomy. All analyses were run on the Smithsonian Institution High Performance Computing Cluster [53] or locally.

2.1.5. Microfluidics PCR, Multi-Marker Illumina Sequencing and Bioinformatic Analyses

For a subset of samples, a microfluidics PCR followed by Illumina sequencing methodology was performed following Gostel et al. [54,55], but adapted to commonly used primer combinations in lichens. This approach and its application in lichenology will be fully treated in a separate publication; but, in summary, this is a PCR-based target enrichment procedure that allows a large number of samples and primer combinations (including genetic markers for both myco- and photobionts and associated microbiome) to be amplified in a single step due to a series of microtubes that intersect, forming a central matrix of thousands of reaction chambers [55]. It is here applied for the first time in lichens. For this current study, five fungi markers were selected (EF3, mitLSU, ITS, nuLSU, nuSSU), amplified with a Microfluidic PCR on a Fluidigm Access Array at the Center for Conservation Genomics (CCG) at the Smithsonian’s National Zoo (Washington, DC, USA) and sequenced on an Illumina MiSeq Kit v3 (600 cycles) at the LAB (SI-NMNH). Samples were de-multiplexed and de-noised using QIIME2 [50], and then assigned taxonomy with a custom database with reference sequences for each of the loci sequenced.

2.2. Phylogenetic Analyses

2.2.1. ITS-Based Phylogeny

A total of 1325 ITS sequences were assembled to infer relationships within the Acantholichen-Corella-Cora clade (Table S1). Acantholichen was included as it represents the sister clade of Corella, with Acantholichen and Corella together sister to Cora [28]. Of the 1325 sequences, 28 represented Acantholichen, 54 Corella, and the remaining 1243 the genus Cora. We used a previously published alignment focusing on the genus Cora [33] as template and added further and newly generated sequences with MAFFT 7 “--add” [56] using the online server [https://mafft.cbrc.jp/alignment/server/add_sequences.html]. The resulting alignment was manually inspected and, after running an initial phylogenetic analysis (see below for settings), terminals were sorted in a phylogenetic order and the alignment reinspected. This approach was repeated several times, until no further alignment inconsistencies were detected. Ambiguously aligned regions were found to be short and were detected only in a broader context between distantly related taxa, whereas closely related taxa within supported subclades did not show notable alignment ambiguities, as assessed through the Guidance2 Server [57] (http://guidance.tau.ac.il/) for smaller subsets of the data. Therefore, ambiguously aligned regions were not removed. The final alignment contained 1325 sequences and was 916 bases long after terminal trimming (File S1). Of these 1325 sequences, 965 were generated with Sanger, 330 with Illumina, and 30 with 454-pyrosequencing approaches. Sequence length (after trimming) varied between 86 and 724 bases (File S1). Short sequences generally corresponded to the ITS1 region obtained through Illumina and 454 pyrosequencing, but some short Sanger sequences covered only the ITS2 region.
We employed RAxML 8 [58] on the CIPRES Science Gateway [59] to reconstruct a maximum likelihood phylogeny based on the ITS data, using the universal GTRGAMMA model and bootstrap pseudo-replicates automatically determined through the RAxML Black Box on the CIPRES server. The resulting tree was visualized in FigTree 1.44 (http://tree.bio.ed.ac.uk/software/figtree/). Using this tree, species-level clades (i.e., species hypotheses) were delimited ad hoc using a combination of stem branch length, support, ecology (substrate, habitat) and distribution of the corresponding terminals, without taking into consideration their morphology.

2.2.2. Six-Marker Phylogeny

Six genetic markers (EF3, mtLSU, ITS, nuLSU, nuSSU, and RPB2) were utilized to infer a species (coalescent) tree in ASTRAL (Accurate Species TRee ALgorithm) III [60] that encompassed a total of 147 terminals representing 83 species (File S2). Each of these loci had the following number of samples and alignment length: EF3 (33 taxa, 421 bp); mtLSU (62 taxa, 649 bp); ITS (147 taxa, 816 bp); nuLSU (139 taxa, 1471 bp); nuSSU (69 taxa, 1268 bp); and RPB2 (11 taxa, 1033 bp). The ITS alignment was separately subjected to ML analysis as described above for the full dataset (File S3).
To compare the resulting ITS-based ML tree with the six-marker ASTRAL tree, generalized Robinson–Foulds distances were calculated between the ASTRAL and the ITS tree in R Studio with the TreeDist package [61,62], following the tutorial by Smith (https://ms609.github.io/TreeDist/articles/Generalized-RF.html accessed on 1 July 2021).

2.3. Quantitative Species Delimitation

2.3.1. Single-Locus Tree-Based Methods

We predicted species limits utilizing the Generalized Mixed Yule Coalescent (GMYC) approach as described by Fujisawa and Barraclough [63] using the R package splits (default settings, including single threshold). We first generated an ultrametric tree in BEAST v1.10.4 [64,65,66], using the following settings according to Lücking et al. [32]: (a) strict molecular clock; (b) GTR substitution model with base frequencies estimated and Gamma and invariant sites with six Gamma categories; (c) speciation through a Yule process with the “yule.birthRate” prior set to an exponential distribution with 4.0 as mean; (d) the “ucld.mean” prior set to an exponential distribution with 0.001 as mean and all other priors with default values; and (e) 100,000,000 MCMC generations.
We also inferred putative species boundaries applying the Poisson Tree Process (PTP), including its Bayesian implementation (bPTP) [67] on the bPTP Web Server (https://species.h-its.org/ptp/ accessed on 15 January 2022), with the following settings: 500,000 MCMC generations, 100 Thinning, and 0.25 Burn-in.

2.3.2. Distance-Based Methods and Barcoding Gap Analyses

For the barcoding gap analysis, we used a subset of the ITS sequence data limited to the genus Cora, retaining only terminals with less than 30% missing data, spanning most or all of the ITS1 and ITS2 region (716 terminals; File S4). This subset corresponded to 175 species-level taxa plus one subspecies delimited ad hoc (see above). We computed a distance matrix using the Kimura 2-parameter model implemented in BioEdit 7 through DNADIST 3.5 [68,69]. Within-species and between-species distances were then assessed by arranging the terminals according to the ITS-based ML phylogeny (see above) and comparing the distances between subsequent terminals, using our ad hoc species hypotheses as grouping variables. We computed a threshold distance value by comparing within-species and between-species distances, selecting the value that best discriminated between the two, retaining a maximum of within-species and a minimum of between-species pairs. The resulting threshold was then used to visualize distance patterns in the full two-dimensional distance matrix between all terminals, enabling the assessment of the predefined species-level clades into three categories: (1) species-level clades well-delimited by the threshold distance; (2) species-level clades with internal variation frequently greater than the threshold distance; and (3) species-complexes in which hypothesized species-level clades were not well-resolved by the threshold distance.
We further employed Automatic Barcode Gap Discovery (ABGD) [70] and Assemble Species by Automatic Partitioning (ASAP) [71] on the same dataset of 716 Cora terminals (File S4), using the corresponding web servers [https://bioinfo.mnhn.fr/abi/public/abgd/abgdweb.html; https://bioinfo.mnhn.fr/abi/public/asap/asapweb.html accessed on 15 January 2022]. For ABDG, we used the following settings: Kimura (K80) 2-parameter model, Pmin = 0.001, Pmax = 0.1, Steps = 10, X (relative gap width) = 1.5, 1.0. 0.5, 0.1 (stepwise), Nbins = 20. For ASAP, we used settings as follows: Kimura (K80) 2-parameter model, Split groups below this probability = 0.01, Keep 10 best scores, Use fixed seed value = −1, Highlights results between the genetic distances = 0.05 and 0.05.

2.3.3. ITS-Based BLAST Performance

We used a subset of 758 terminals with (near) complete ITS sequences as reference (File S5, “BLAST reference subset”), similar to the aforementioned Cora subset but also including Acantholichen and Corella, to assess BLAST performance of four datasets: (1) the ITS1 region only (298 bases, individual length (173–)200–220 bp) of the Cora species in the BLAST reference subset (716 terminals; File S6); (2) the ITS region of all original terminals with less than 10% gaps (including Illumina ASVs, 1217 terminals; File S7); (3) the ITS2 region only (344 bases, individual length 231–263 bp) of this BLAST reference subset (File S8); and (4) a short, subterminal (49 bp from the end of the ITS4 primer) piece of the ITS2 region (85 bases, individual length (43–)50–64 bp) of this BLAST reference subset (File S9). The analysis was performed using the local BLAST function in BioEdit 7 [69,72] with the following settings: E value = 1.0, maximum number of hits to report = 50, gap opening/extending penalty = 0, mismatch penalty = −3, match reward = 1 (see also [73,74]).
BLAST results for each of the scenarios were evaluated as follows. First, we computed the variation of total scores for hits (same species-level clade), self-hits (same terminal), and misses (different species-level clade) for each scenario. Then, we computed the minimum score for hits versus the maximum score for misses for each query, determining to what level a “BLAST gap” existed for each scenario. Finally, we computed the ratio of minimum hit score versus maximum miss score to calculate the proportion of three ratios per query: (1) >1.25, minimum hit score at least 25% higher than maximum miss score; (2) >1.10, minimum hit score at least 10% higher than maximum miss score; and (3) >1.00, minimum hit score higher than maximum miss score.

2.4. Phenotypic Assessment

In order to test the hypothesis that phylogenetically defined taxa in Cora are phenotypically undifferentiated and may reflect taxonomic inflation, we analyzed 87 formally described and sequenced species of Cora [33], plus two outgroup taxa in the genus Corella (Table S2). We established a one-sequence-per-taxon ITS tree, selecting the type sequence for each species when available and using the alignment from Lücking et al. [33] as a template (Table S2). After deleting the non-relevant sequences and keeping only the 89 target sequences (File S10), the alignment was subjected to RAxML 8.2.0 [58] analysis on a local CPU to reconstruct the best-scoring maximum likelihood tree under the universal GTRGAMMA model; bootstrapping was performed with 1000 pseudo-replicates.
For the 87 selected Cora species (and the two Corella), we assembled a matrix for a total of 20 characters, including one ecological character (preferred substrate; row 1), 11 morphological, anatomical, and chemical characters (rows 2–12, based on largely on previous studies [32,33,40], onward simply referred as “phenotypical characters”), and eight chorological characters, defined as biogeographic regions (rows 13–20; Table 1; scores on Table S3). We then defined phenotypes by combining the character scores for the 11 phenotypical characters (columns 2–12 in Table S3) into a character state string for each species. Phenotypes were considered identical if they agreed in the complete string between two species. The number of phenotype characters was kept intentionally low and limited to those that were constant within a lineage to avoid false positives in terms of different phenotypes (the number of potential phenotypes increases exponentially with the number of characters). Our aim was to test if even a very low number of characters would result in a sizable number of distinct phenotypes. A high level of cryptic speciation (or potential taxonomic inflation) could be expected if the number of distinct phenotypes resulting from the combination of these 11 characters was substantially lower than the number of lineages distinguished (87).
For each possible pair of species, we computed molecular phylogenetic distance using the Kimura 2-parameter model implemented in BioEdit 7 through DNADIST 3.5 [68,69]. In parallel, we computed phenotypic distance by calculating total character state difference over all 11 phenotypical characters (columns 2–12 in Table S3).
To assess potentially cryptic speciation, we defined four types of crypticity (Table 2). To avoid confusion with the use of the terms “cryptic” and “crypsis” in zoology, here we propose to add the prefix “phylo-” before cryptic when referring to a phylogeny-based phenetic context. We defined “same” phenotype as total phenotype character distance = 0 (identical) and “similar” phenotype as total phenotype character distance = 1 (low). Taxa differing in more than one character or with a total character distance >1 were considered distinct.
In addition to the maximum likelihood phylogenetic tree based on the ITS barcoding locus, we also computed a cladogram based on all 20 characters using PAUP 4.0b10 [75,76]. To test the hypothesis that tree structure based on phenotype and distribution was significantly different from random (i.e., there was correlated structure in the ecological, phenotypical, and chorological data), we computed 100 random trees in PAUP based on the taxon set to simulate random distribution of character states relative to tree topology. For each tree, we calculated the following five indices based on phenotype character state distribution: parsimony tree length (TL; in steps), consistency index (CI), retention index (RI), rescaled retention index (RC), and homoplasy index (HI). The first and last indices (TL, HI) are proportional to noise in the phenotype data and inversely proportional to structure, whereas the other indices (CI, RI, RC) behave the opposite way.

3. Results

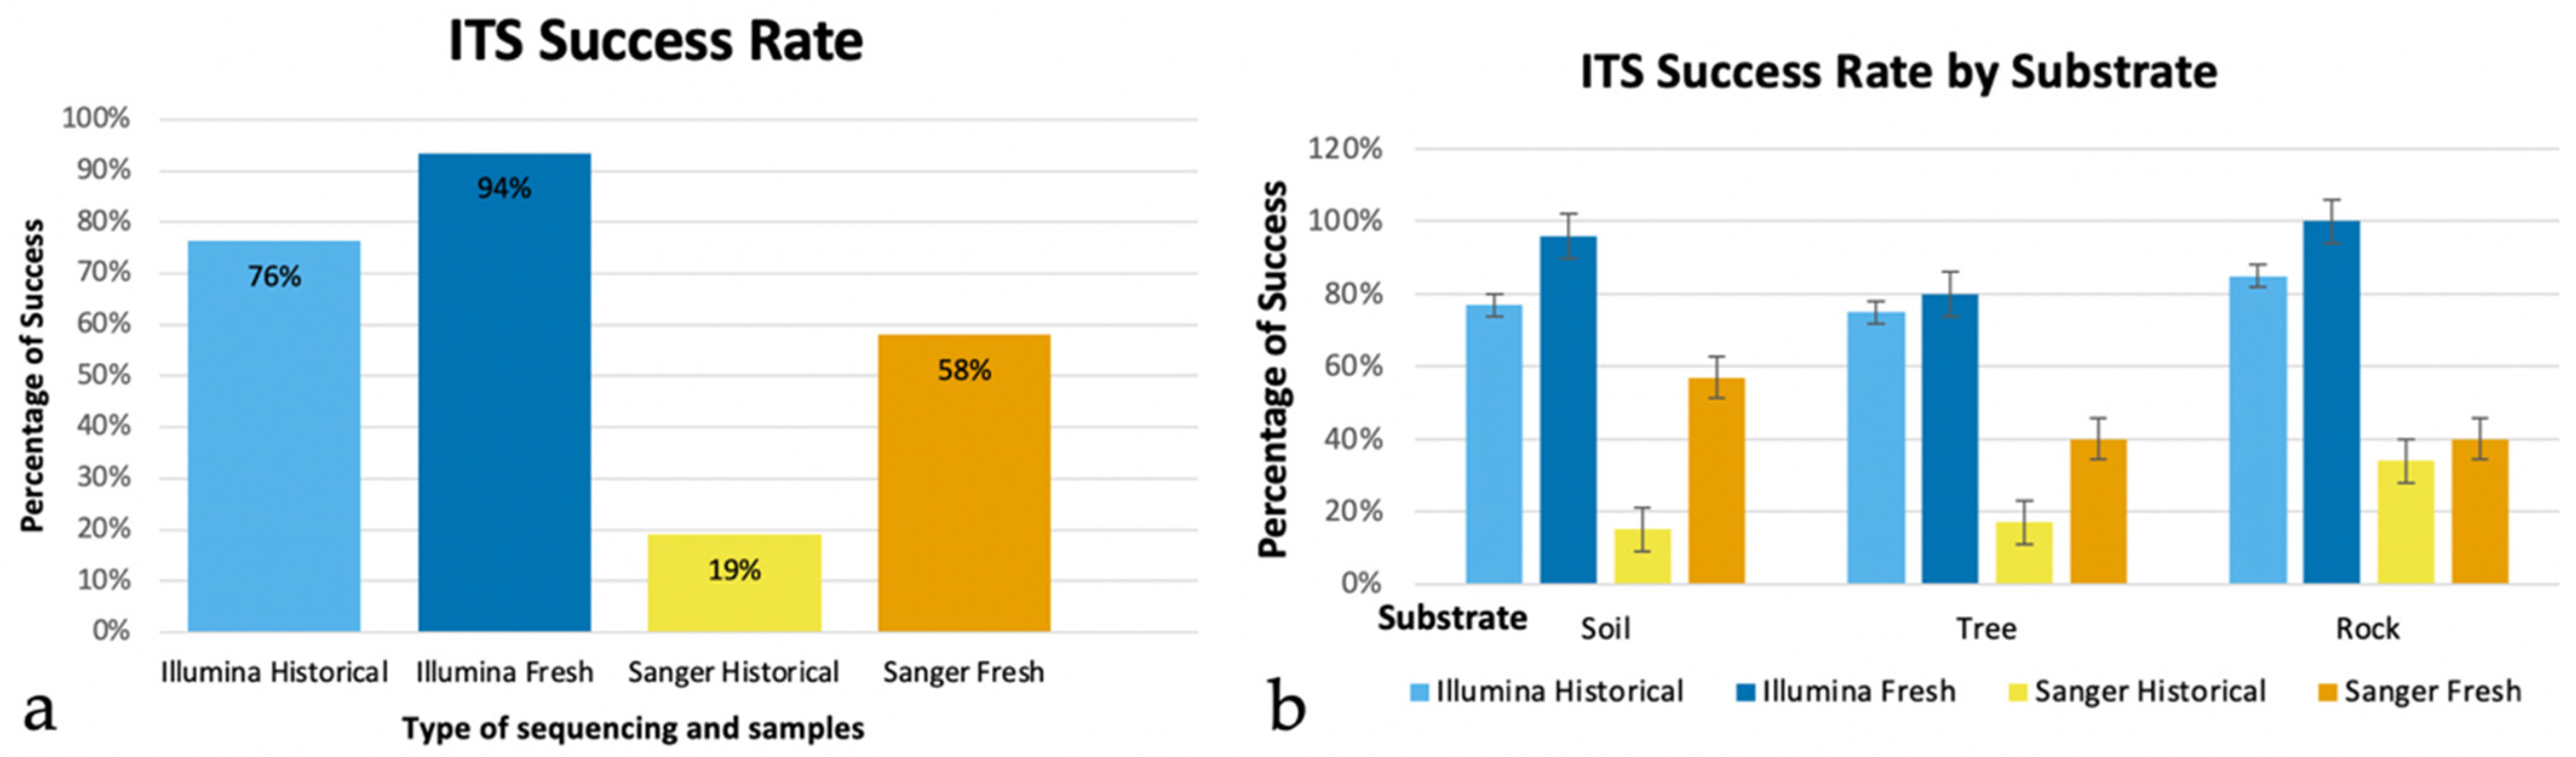
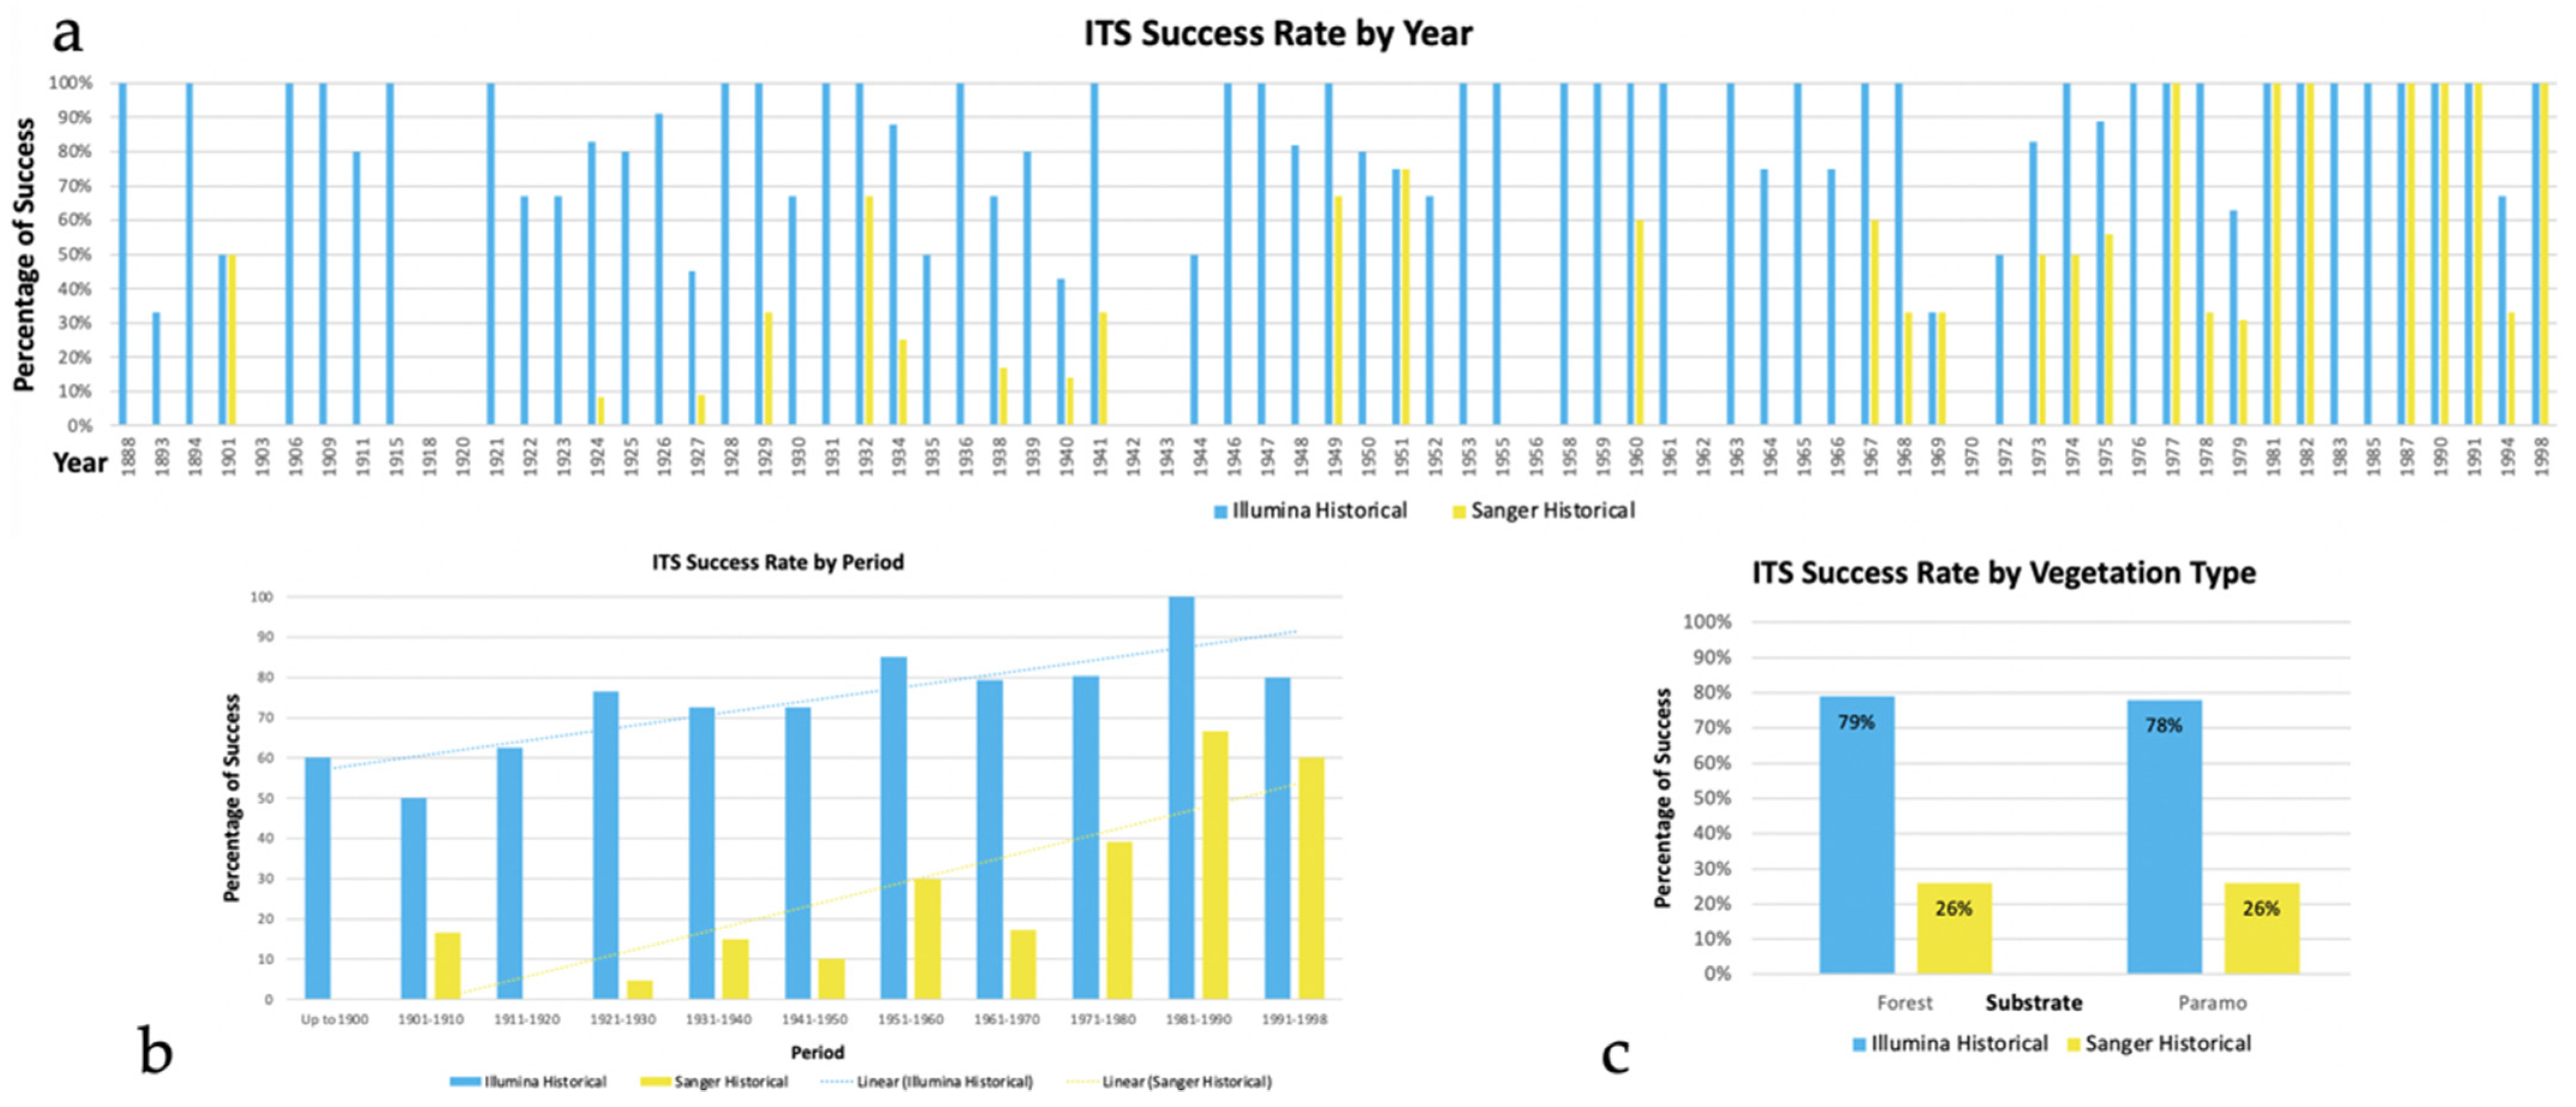
3.1. Comparison of Sequence Performance between Fresh and Historical Collections

The two Illumina MiSeq runs yielded the following raw data:
  • Run 01 (Plates 1 and 2): 331.6 MB (I1 or Indexes), 3.35 GB (R1 or forward reads) and 3.94 GB (R2 or reverse reads) (samples: NSF-001–106 and US-001–086); 8417853 total sequences;
  • Run 02 (Plates 3 and 4): 289 MB (I1 or Indexes), 3.06 GB (R1 or forward reads) and 3.55 GB (R2 or reverse reads) (samples: US-087–278); 11250308 total sequences.
With amplicon sequencing in the Illumina system, we were able to successfully sequence 76.3% or 209 of the 274 historical specimens and 93.6% or 58 of the 62 fresh specimens. With Sanger sequencing, these numbers were substantially lower: 19% of the historical and 58.1% of the fresh specimens (Figure 3a). The difference was, thus, particularly marked for the historical specimens, with a 75% decrease in success between methods, compared to a 38% decrease for the fresh specimens. The pattern was largely consistent among the substrata where these lichens were growing (Figure 3b), although, for the rock substrate, Sanger fresh and historical success rates were more similar.
We did not find a linear pattern in sequencing success dependent on time of historical collections for the Illumina or Sanger sequencing, but overall there was an increase in success for the more recent specimens (Figure 4a,b). There was also no difference in sequencing success when analyzed by habitat in which the specimen was originally collected (Figure 4c), although this information was only available for 17% of the historical samples. Given the high rate of success even for older specimens in the two studied genera, sequencing success may also depend on how the material was collected, dried, and preserved, thus affecting potential initial DNA degradation independent of how long the material has been stored. Unfortunately, data on collection and preservation methods were not available, but we used visual inspection of the condition of the material as a proxy: most successfully sequenced specimens appeared in good condition, as if preserved recently, their colors mostly grey to white-ish, whereas unsuccessfully sequenced specimens often showed discolorations, typically turning yellowish brown. Such discolorations, likely associated with oxidation and DNA degradation, are usually caused when material is collected in the hydrated stage and pressed before fully air-dried, or when a heat source has been used to dry the material, sometimes also in combination with placing the material in alcohol prior to heating, a commonly applied technique in the past.
Beyond the target mycobiont sequences, most Illumina-sequenced samples also produced ASVs for the most commonly found contaminants, such as Penicillium, Cladosporium, Fusarium, and Aspergillus (all Ascomycota). These fungi may already be present in the living lichen specimen but more commonly originate during the drying process or subsequent preservation. In addition, fungi typically occurring in the substrate where lichens were collected (e.g., soil), as well as human-related contaminants were found, including Trichobolus (Ascomycota), Mortierella (Mucoromycota), and Wallemia (Basidiomycota), despite the washes performed prior to DNA extraction. Beyond that, many mushroom species were detected, most likely by the presence of spores in the samples, as well as several basidiomycetous yeasts in the class Tremellomycetes.

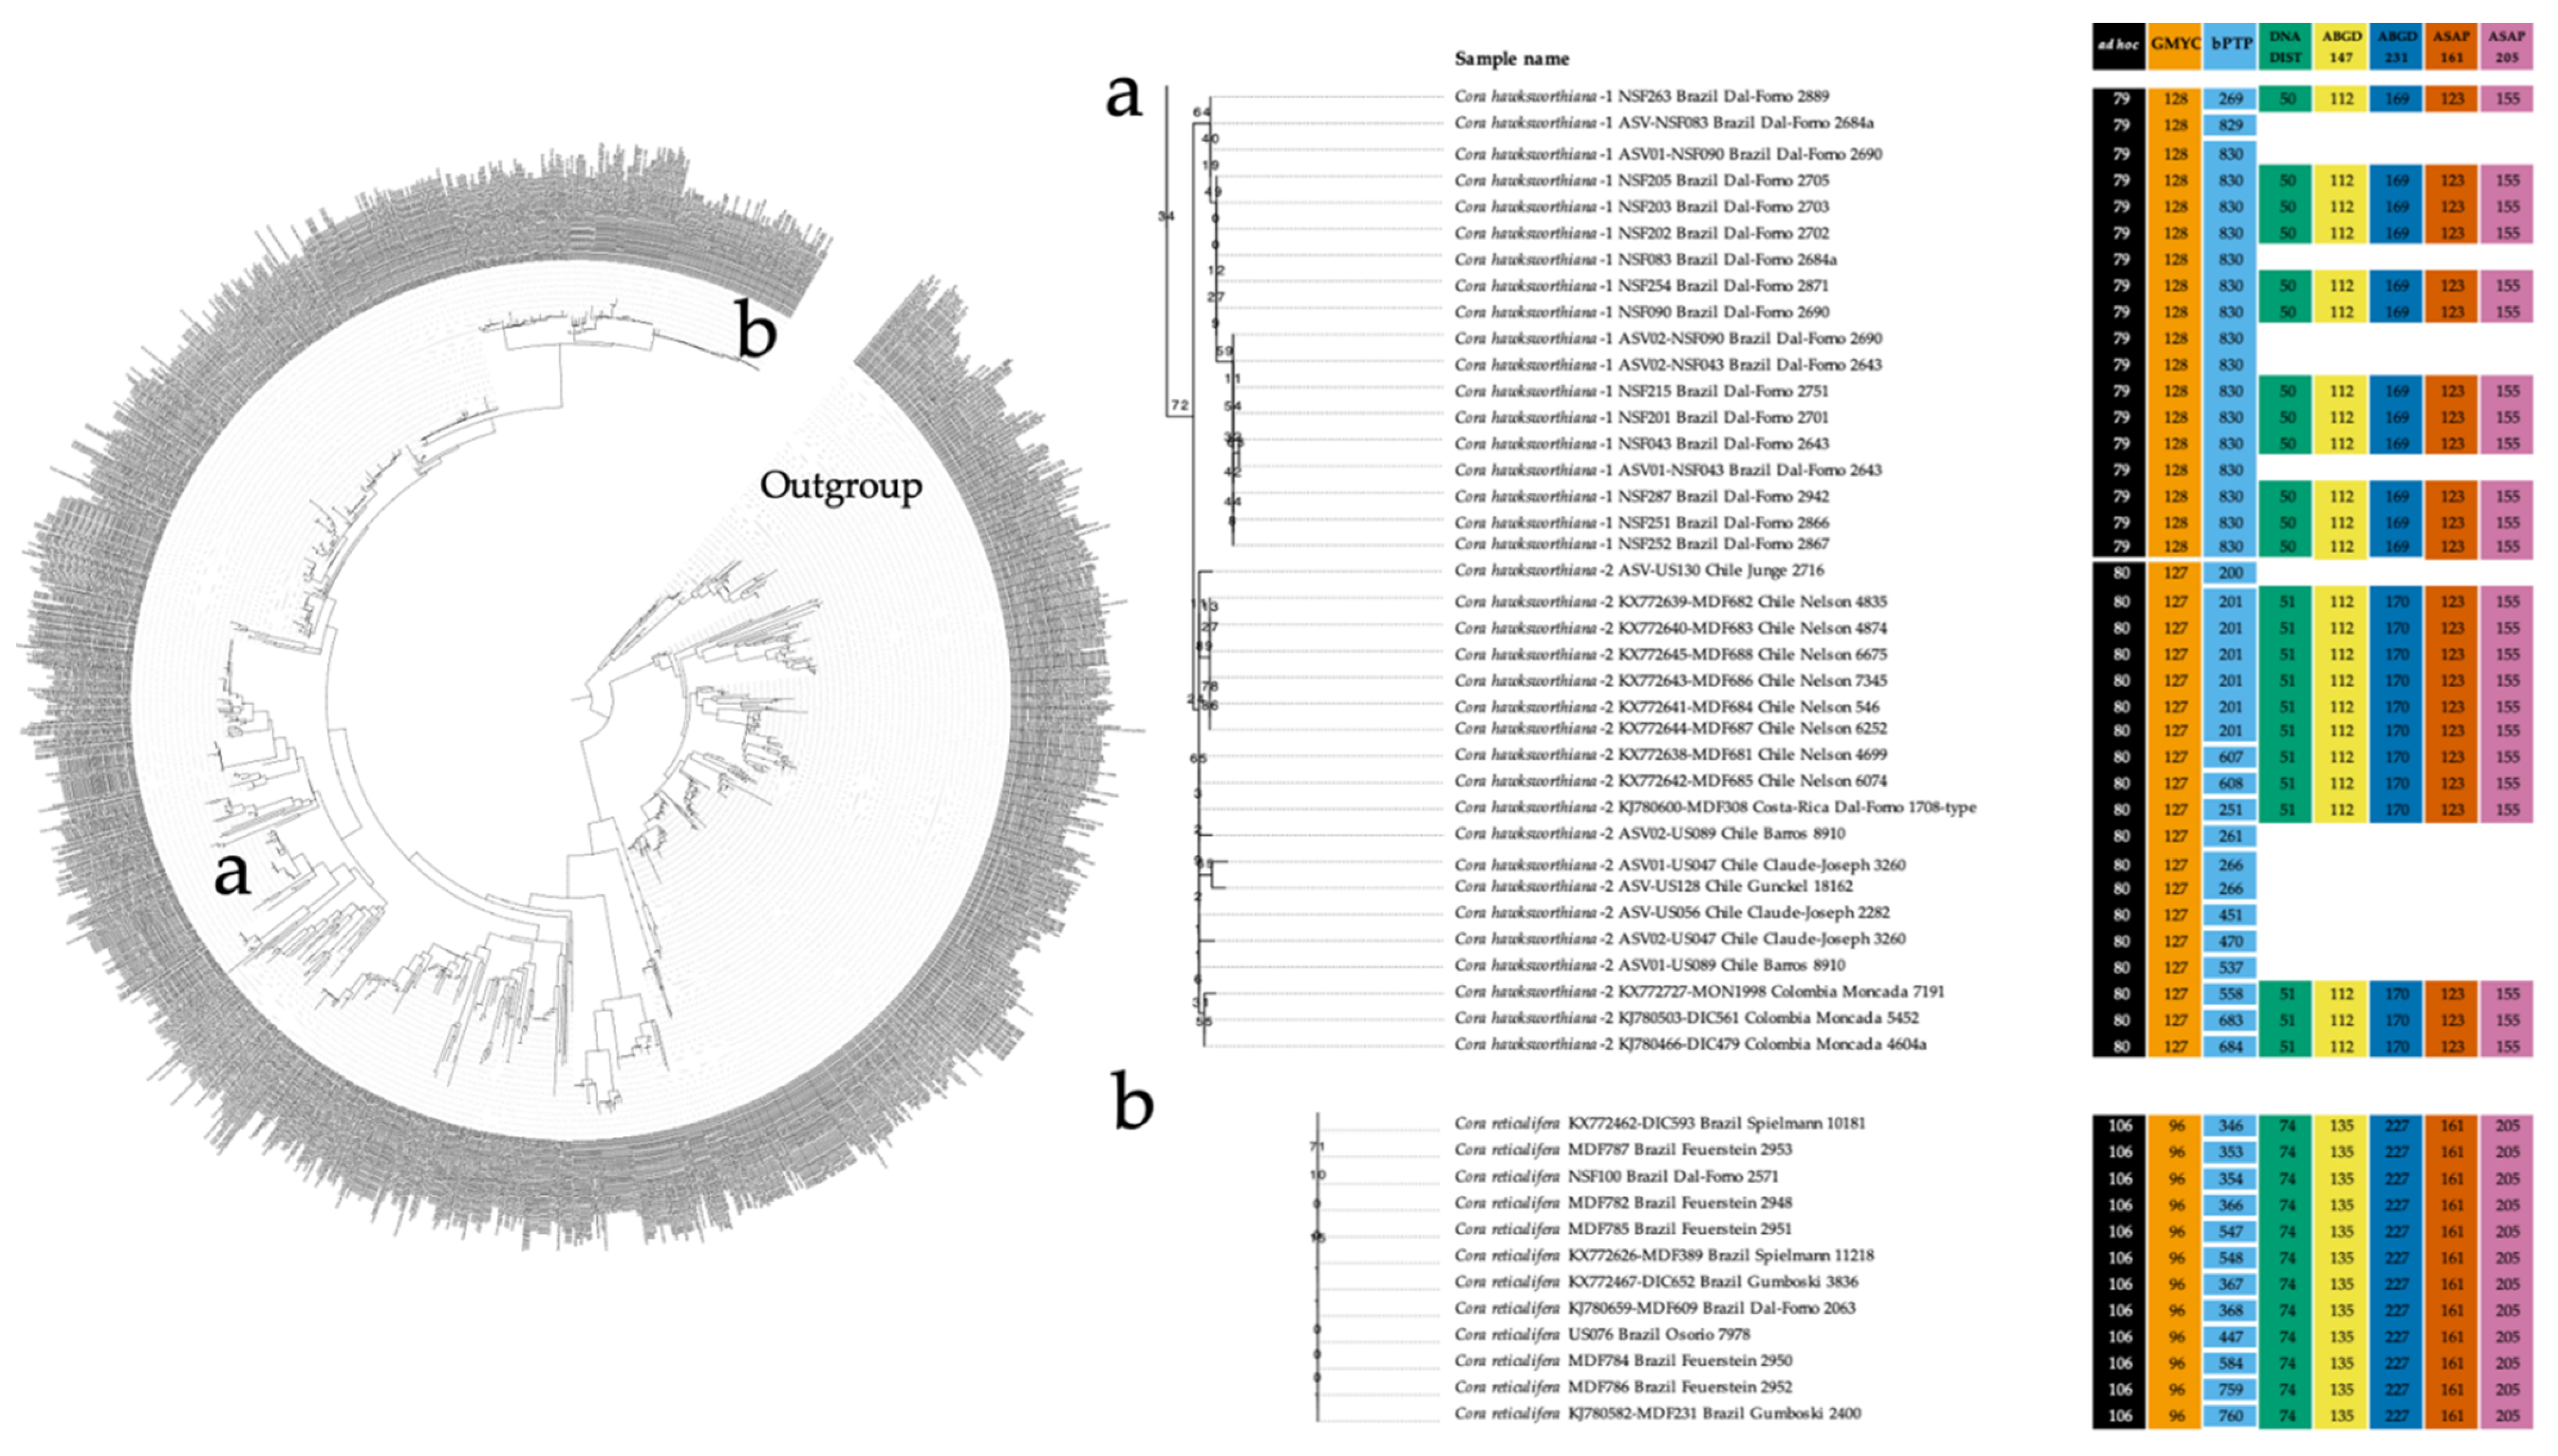
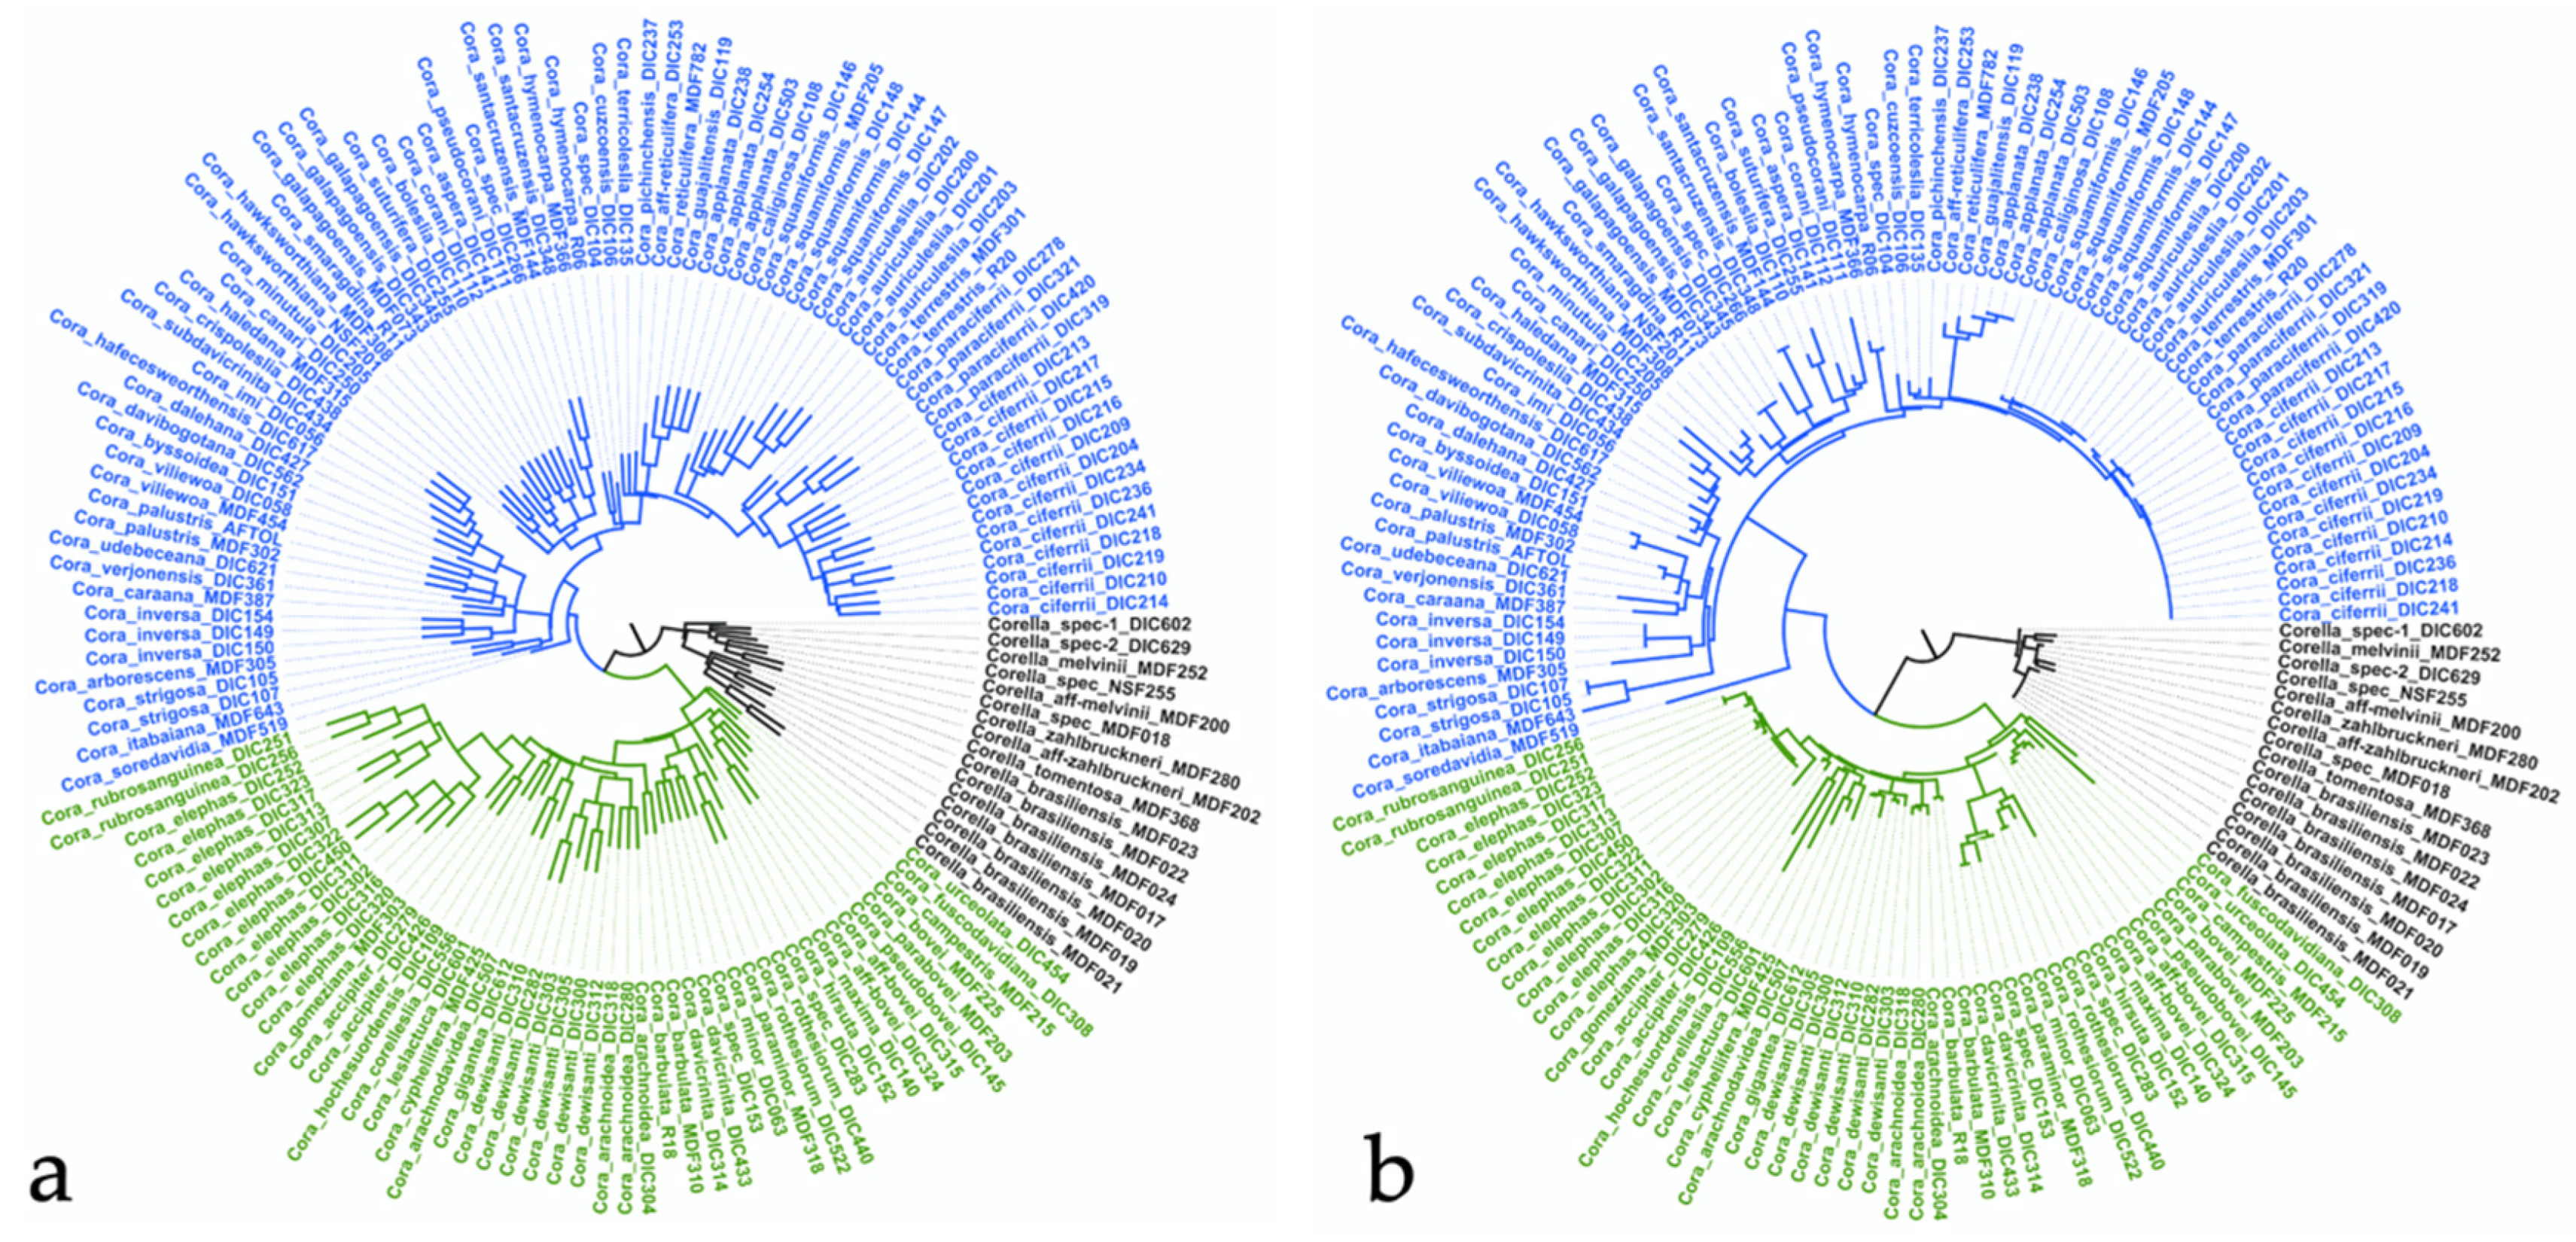
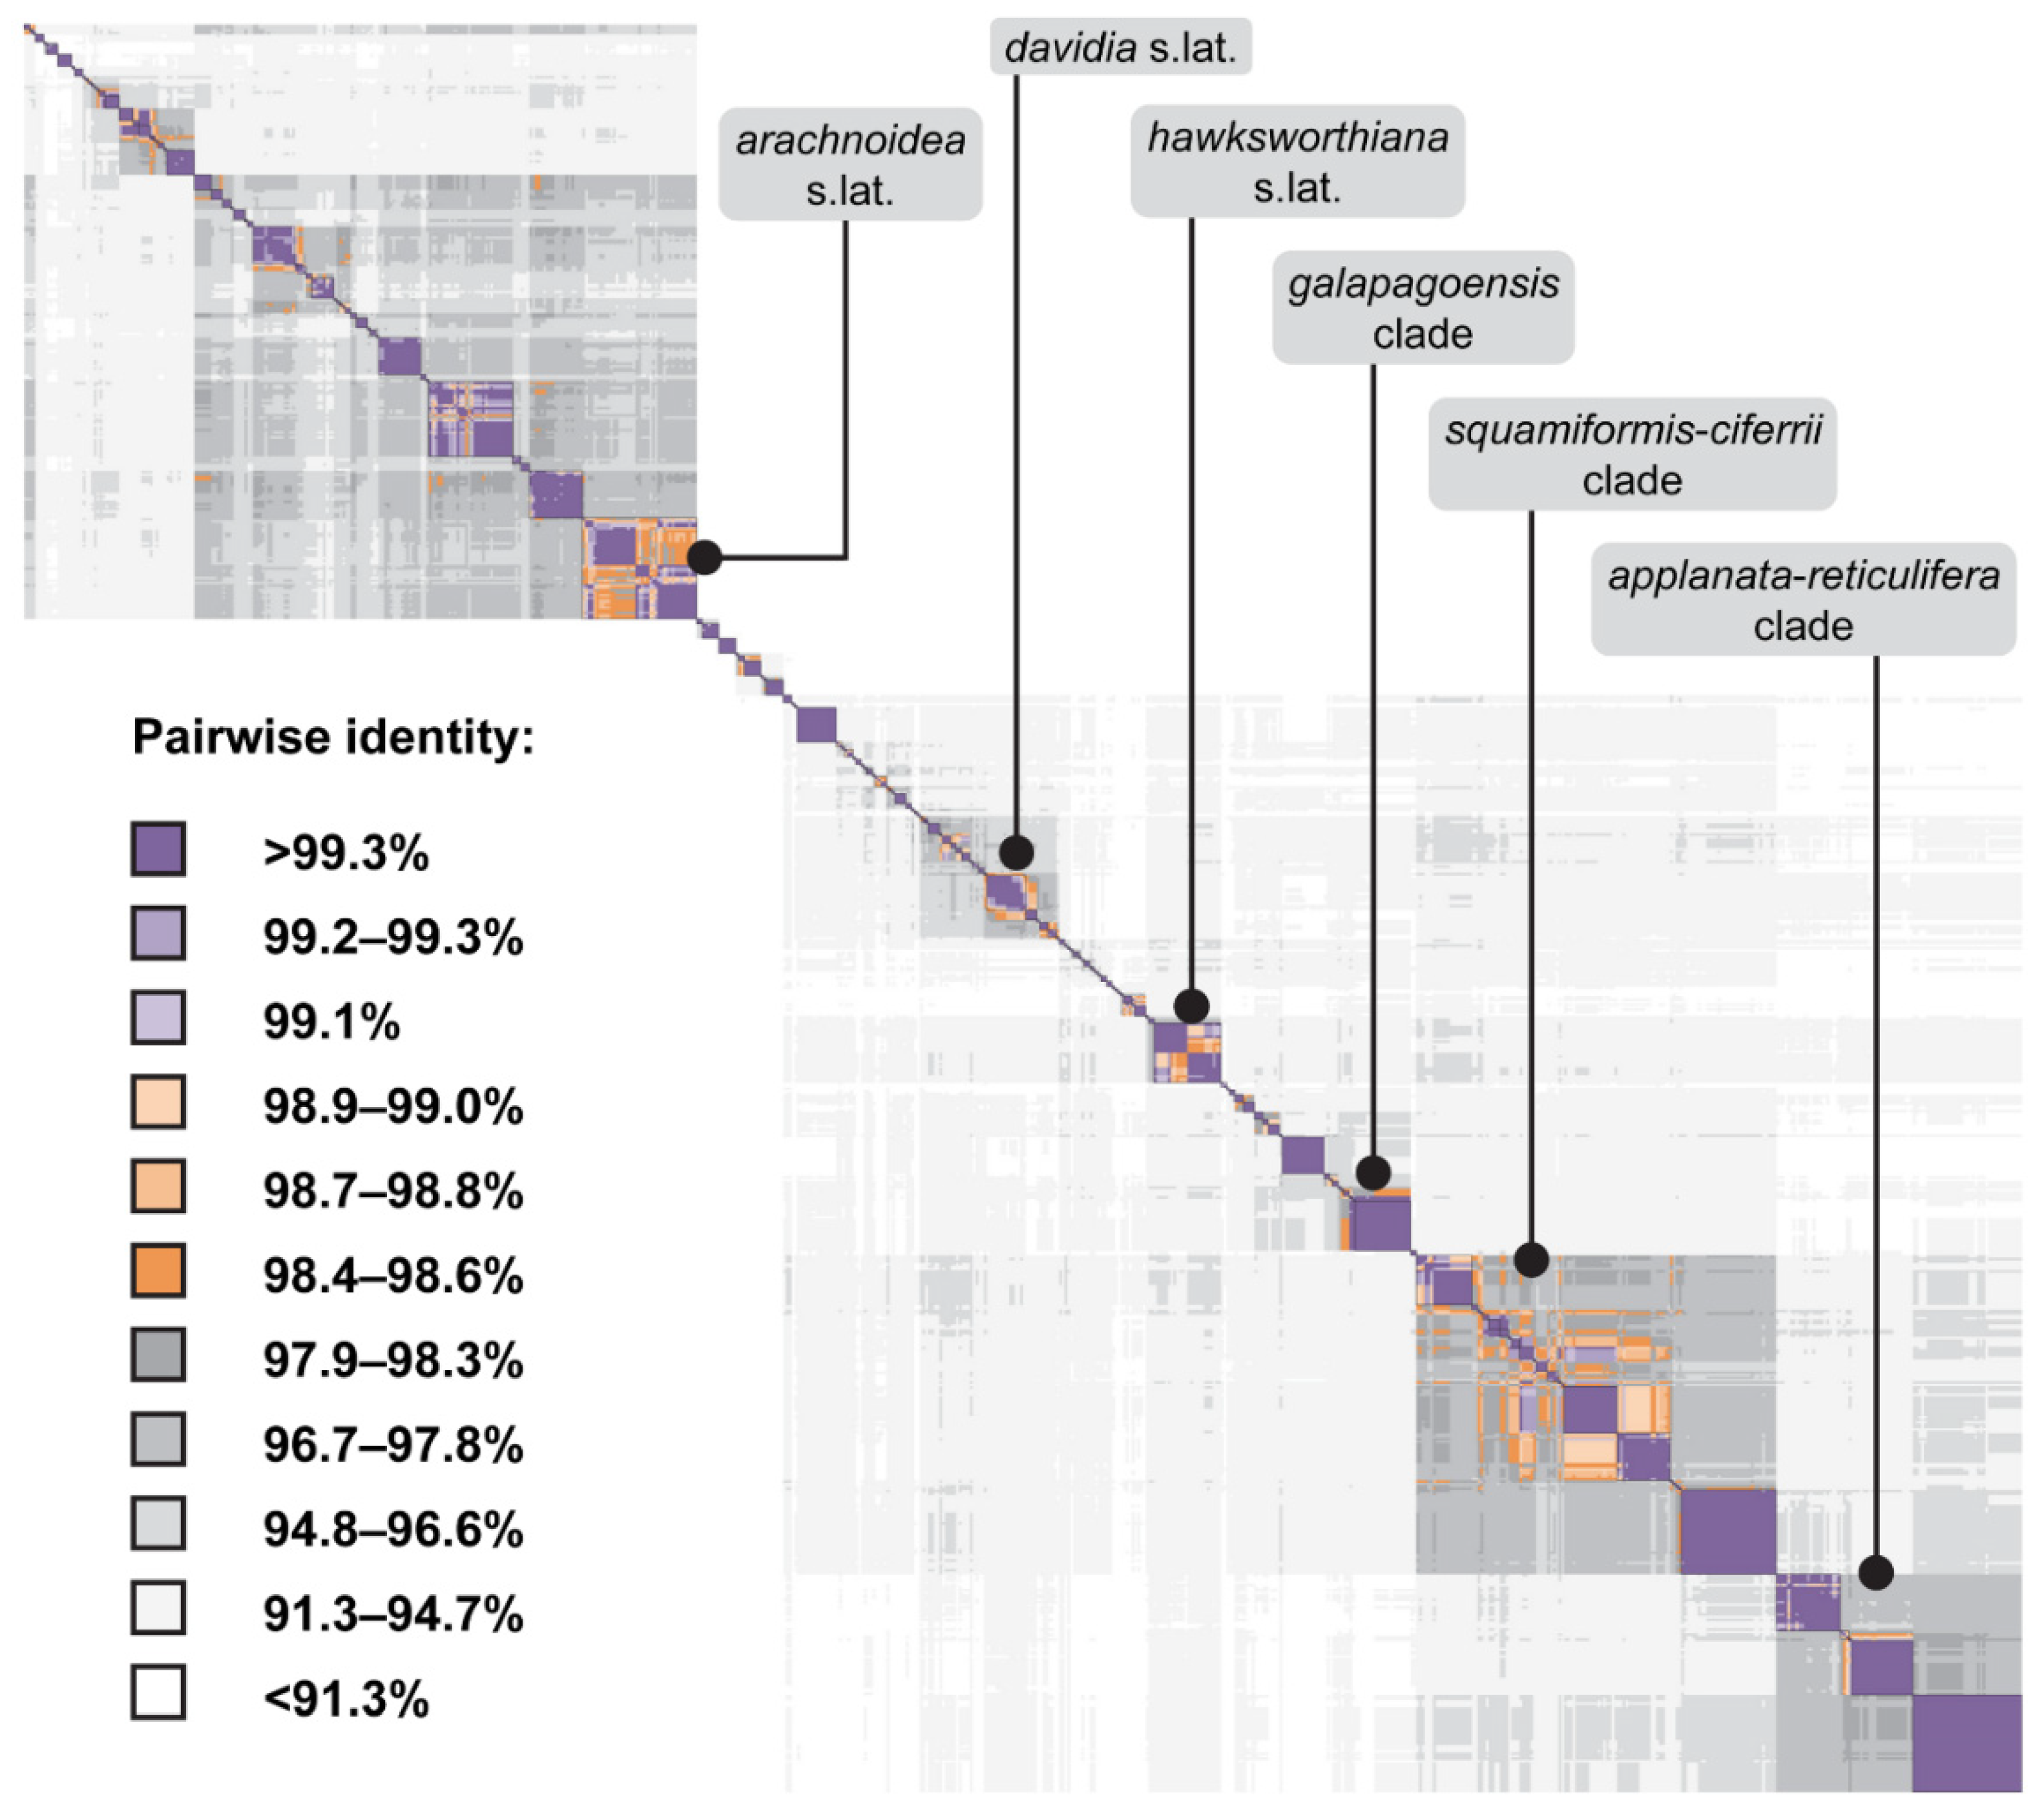
3.2. ITS-Based Phylogeny

Our new ITS tree with 1325 sequences contained 1091 unique samples, collected from 29 different countries (Figure 5 and Figure S1). By utilizing historical specimens, we were able to add records for an additional 11 countries for which the diversity of Cora and Corella species was previously unknown (Figure 2; a singular fresh collection from Sri Lanka not mapped, see [33]).
Given this information, we were able to extend the distribution of six species in Corella and 28 in Cora; for example, Cora davibogotana previously only known from Colombia, is now also reported from Venezuela; and Cora spec-84, before known exclusively from Brazil, is now also known from Uruguay (Figure S1). In all cases, range extensions were to adjacent countries. Countries such as Ecuador, Jamaica, Mexico, Colombia, and Brazil, continue to be well represented by fresh specimens, while for other countries, the addition of new specimens from the herbarium was invaluable. For example, for Panama, we added 18 herbarium collections to compliment the one available fresh specimen, now corresponding to seven or eight species as opposed to just one previously known from the country. Overall, approximately 25–30 additional novel lineages were detected among the herbarium collections alone; however, since these require further studies to be formally described (as either species or at infraspecific level, following the approach proposed by Lücking et al. [34]), they will be treated in a separate publication.

3.3. Comparison between ITS and Astral Six-Marker Tree

Our microfluidics PCR followed by Illumina sequences yielded 239 novel sequences belonging to EF3, mtLSU, nuLSU and nuSSU. ITS data were also highly successful with this approach; however, we already had those sequenced with other methods. Our ITS-based ML tree and the ASTRAL six-marker coalescent tree exhibited very similar topologies (Figure 6), with a normalized Robinson–Foulds distance of 0.0278, suggesting that an ITS-based phylogeny reliably recovers a multi-marker phylogeny in this particular genus.

3.4. Quantitative Species Delimitation Methods

The bPTP species delimitation method estimated the number of species to be between 708 and 889 (mean: 791, output delimitation with 853 clades), with an acceptance rate of 0.826 (Table 3 and Table S4). MCMC generations merged at 249,739 and split at 250,261. The GMYC method, on the other hand, resulted in an estimation of 189 species, with a confidence interval of 145–237 (Table 3 and Table S4).
Barcoding gap analysis using DNADIST via BioEdit resulted in an identity threshold value of 99.4% (distance threshold value = 0.006), retaining 94.6% of all within-species and excluding 95.4% of all between-species pairwise identities based on ad hoc delimitations. Most species delimited ad hoc were well delimited using this threshold value, such as the Cora applanata-reticulifera clade (Figure 7, File S11, Table S4). However, we detected several cases of ad hoc delimited species that may represent more than one taxon (e.g., C. arachnoidea, C. davidia, and C. hawksworthiana), as well as cases of diffuse species complexes where the threshold value did not fully discriminate between ad hoc-delimited species, including the C. galapagoensis clade and the C. squamiformis-ciferrii clade (Figure 7, File S11, Table S4). Overall, we found six cases of ad hoc-delimited species complexes to be potentially merged based on the threshold value, resulting in a possible reduction from 15 to six species. On the other hand, four cases would suggest further splitting, resulting in a potential increase from four to nine species. Applying both corrections strictly to the initial number of 175 ad hoc-delimited species (plus one subspecies) would yield 171 species, a minor difference of only 2.3%.
ABGD on the subset of 716 Cora terminals returned stable results for relative gap width settings X = 1.0, 0.5, and 0.1. Setting X = 1.0 estimated between 147 and 231 species, corresponding to a barcode gap distance between 0.004 and 0.011 (Table 3). The three best-scoring ASAP scenarios (lowest score) estimated 161 species, with the following two scenarios ranging between 128 and 205 species, corresponding the threshold distances of 0.0086 (n = 3), 0.0130, and 0.0046, respectively (Table 3). The best-scoring scenario (161 species), therefore, appears to be a reasonable approximation.
Extrapolation of these distance-based approaches to the entire taxon set (265 ad hoc-delimited species) would result in estimates of 259 species (DNADIST), 223–350 species (ABGD), and (194–)244–310 species (ASAP).

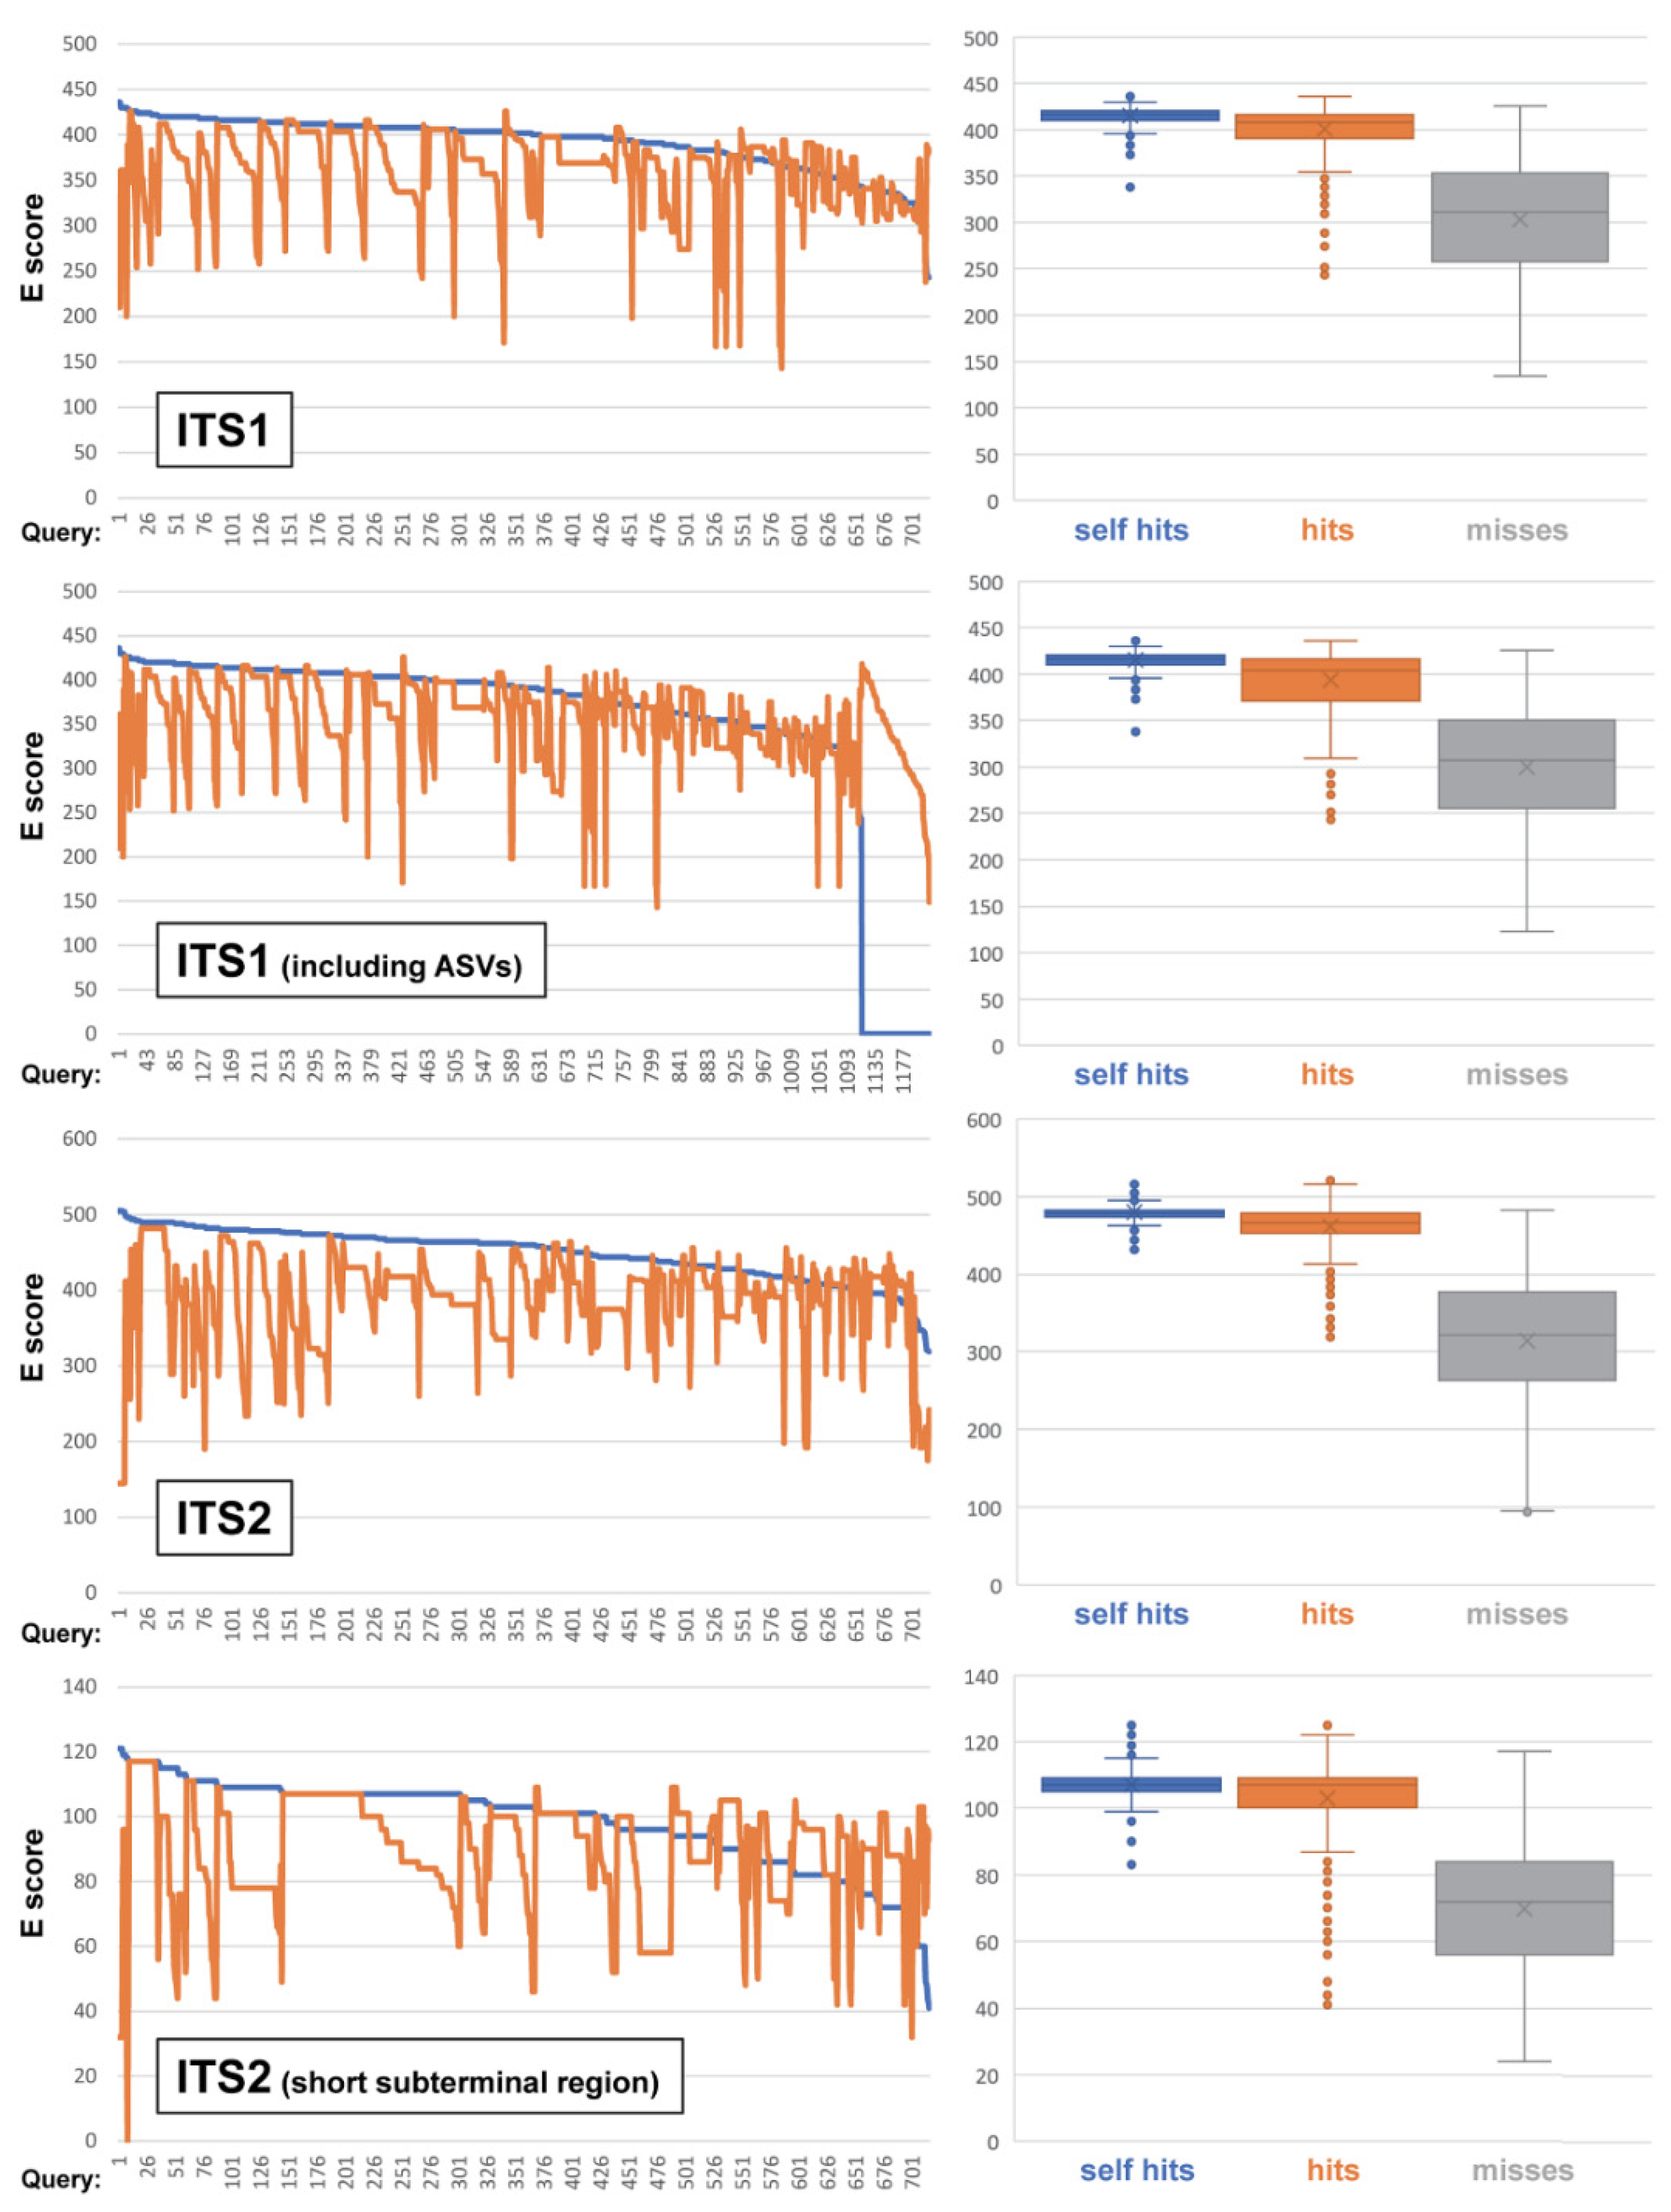
3.5. ITS-Based BLAST Performance

BLAST performance was similar overall among the four scenarios (ITS1 region only, ITS1 including ASVs, ITS2 region only, and short subterminal ITS2 region). In all four cases, BLAST hits with other terminals of the same ad hoc-delimited species yielded E scores comparable to those obtained with self hits, although slightly lower on average, reflecting infraspecific variation (Figure 8). E scores also discriminated well between hits and misses. Upon closer examination, however, the four scenarios showed subtle differences. The best level of discrimination between hits and misses, and hence the highest level of accuracy was found with the ITS2 region: 88% of the queries accurately discriminated between hits and misses (min hit score > max miss score); however, in 53% the min hit score was 10% larger than the max miss score and in 23% of the queries it was 25% larger. The second best-performing subset was the ITS1 region, with 74%, 32%, and 13%, respectively, still spanning a large number of accurate queries but overall with a lower BLAST gap. When incorporating all available ASVs (including smaller fragments from Sanger and HTS) the ITS1 region performed slightly worse (66%, 25%, 11%), due to a number of incomplete query sequences missing parts of diagnostic regions. The short subterminal ITS2 string, making up about one fourth of the entire ITS2 region, had a larger BLAST gap than the other three scenarios, with 27% and 41% of the queries having the min hit score more than 25% and 10% above the max miss score, respectively, but, on the other hand, only 54% of the queries had a min hit score larger than the max miss score, resulting in potential inaccuracy.

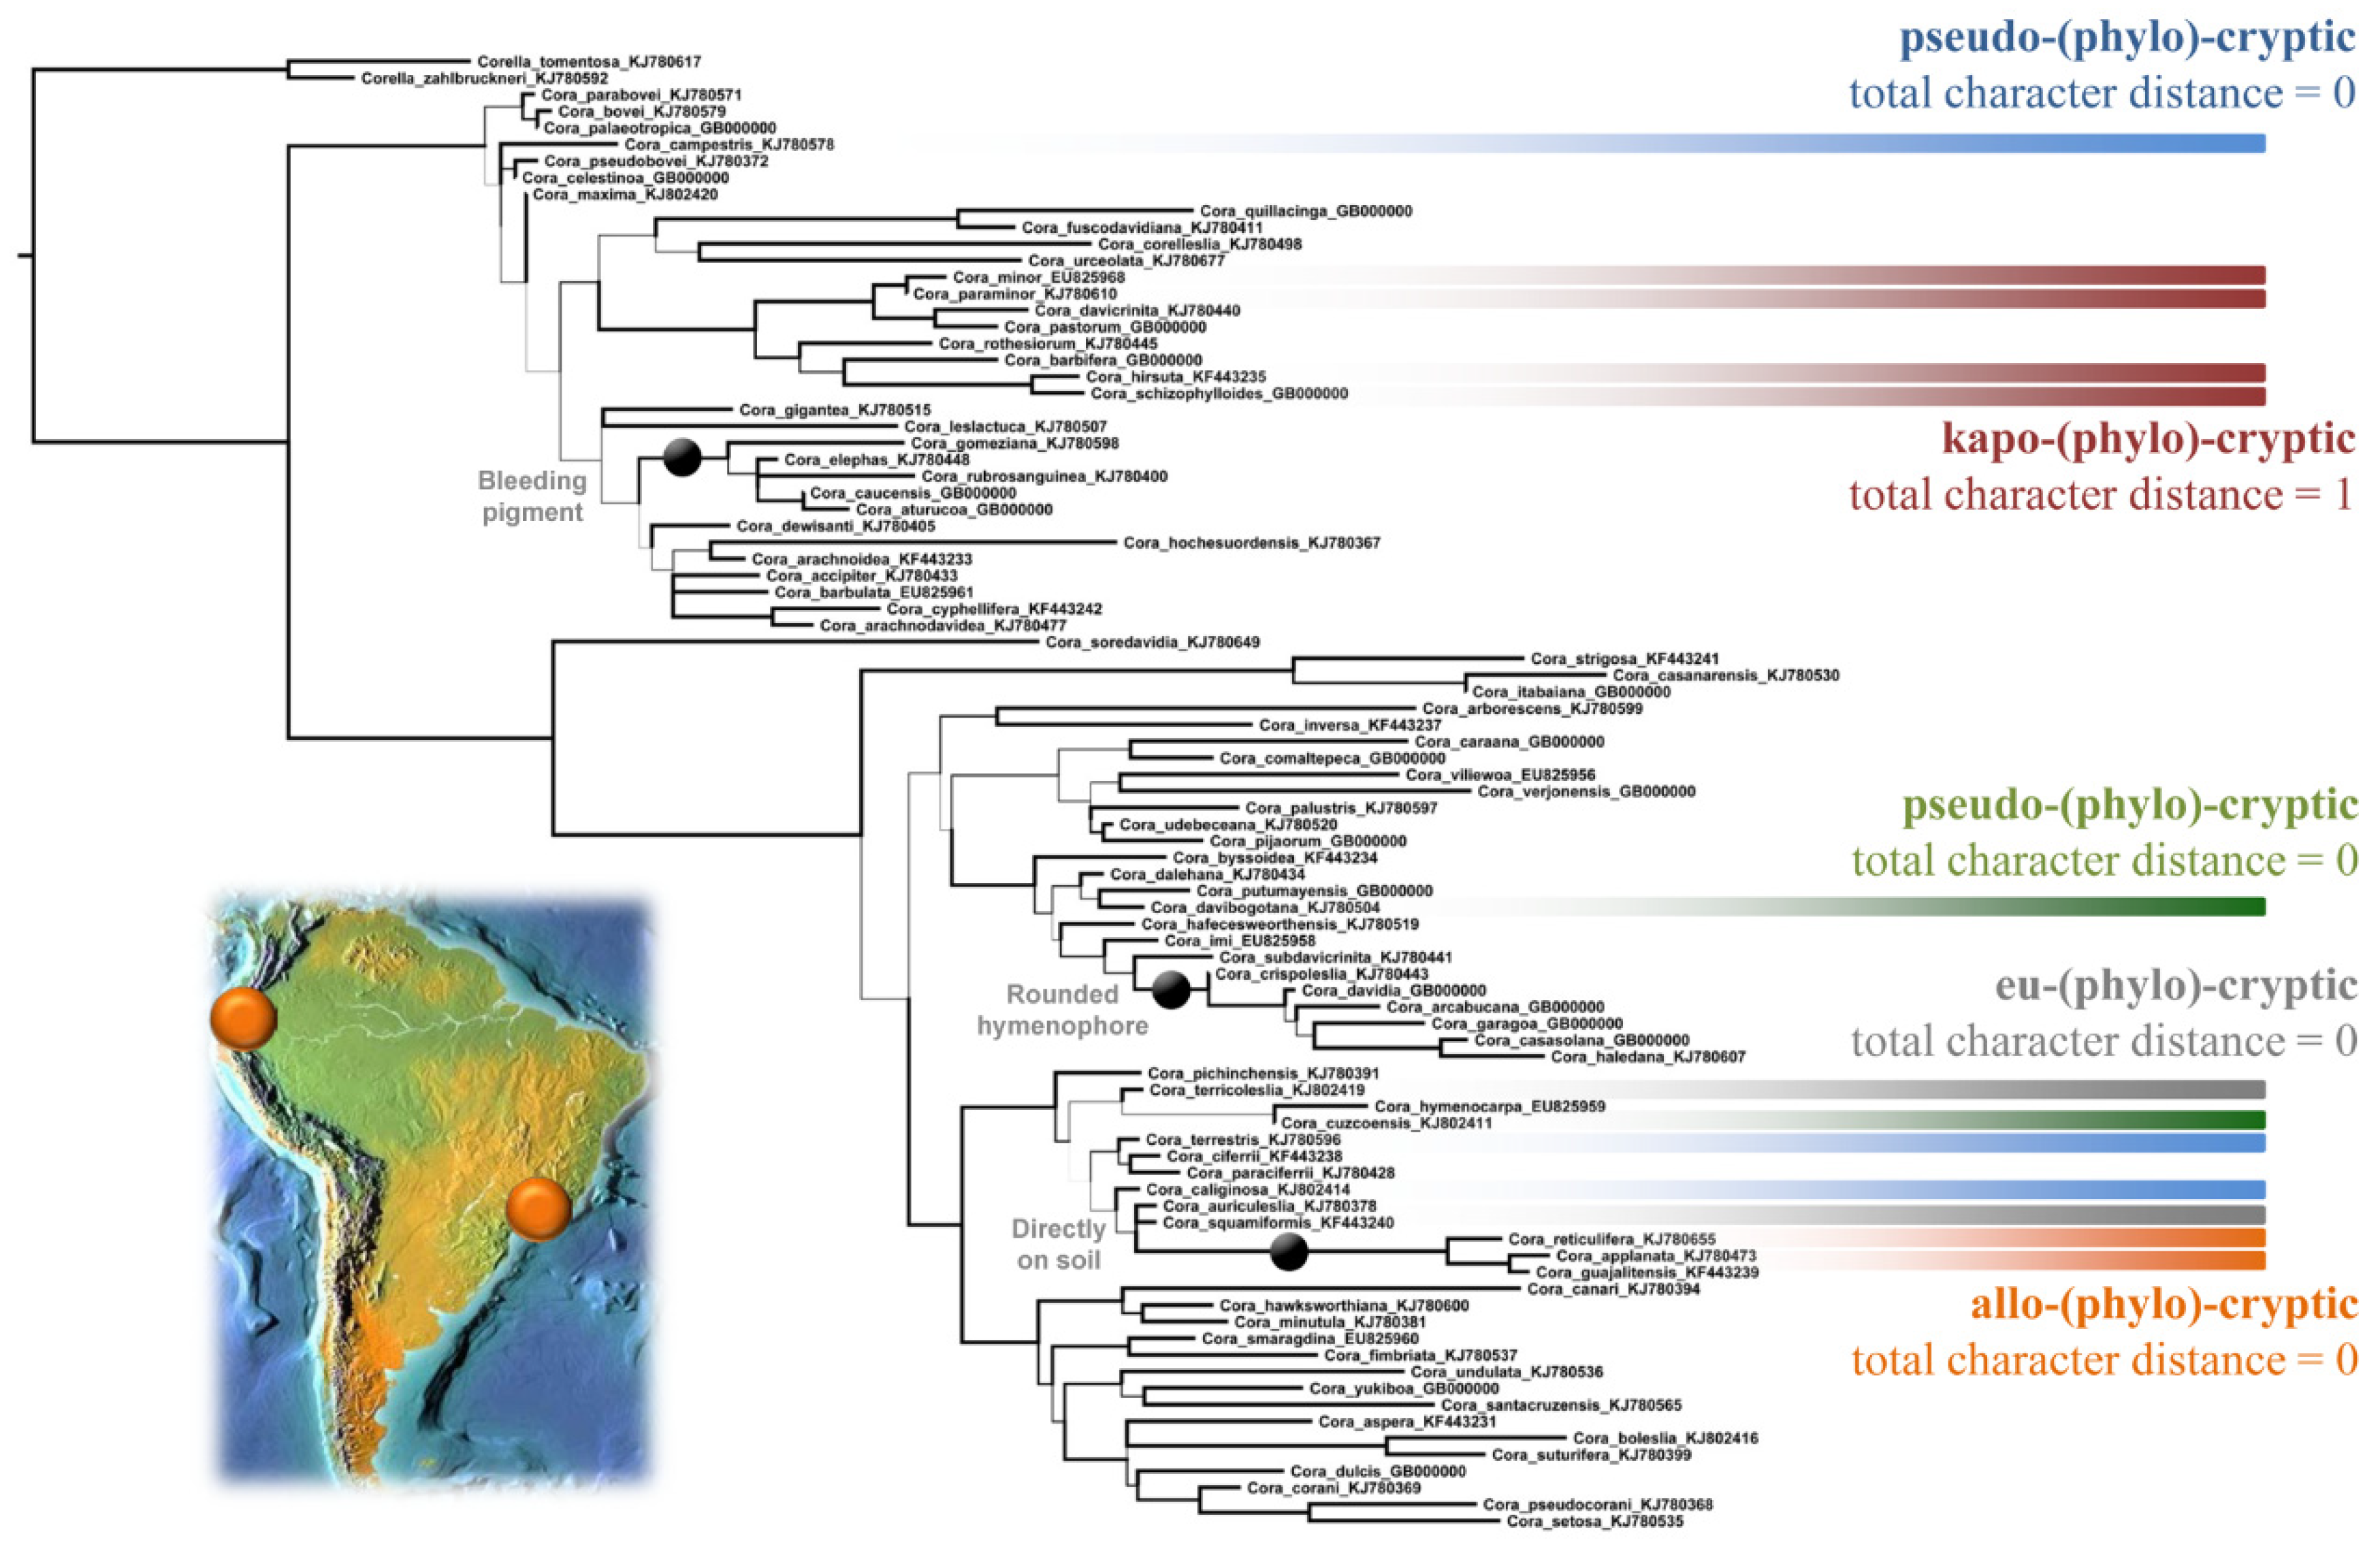
3.6. Phenotype Assessment

Total phylogenetic distance between possible pairs of species ranged between 0 and 120 substitutions, and total phenotype distance between 0 and 16 steps or character state differences (Figure 9). There was no discernible correlation between total phylogenetic and phenotype distance, i.e., phenotype distance did not depend on genetic distance. Mean total phenotype distance over all pairs of species was 7.18 (±2.01); if only pairs of species with a phylogenetic distance of 10 or less were considered, mean total phenotype distance was only marginally different (7.29 ± 2.11). Additionally, if only pairs of species representing sister clades were considered, no difference was detected in mean total phenotype distance (7.23 ± 3.19). Thus, on average, more closely related species were not more phenotypically similar to each other than more distantly related species.
Using only the 11 morphological, anatomical, and chemical characters (columns 2–12 in Table S3), we differentiated 82 distinct phenotypes for the 87 included species of Cora (excluding Corella). Three phenotypes were shared by two lineages each, and one phenotype was shared between three lineages (Figure 10). There was only one instance of two lineages or species that could be considered eu-(phylo-)cryptic, namely the related C. squamiformis and C. terricoleslia (Figure 10); both are terrestrial species known from the central Andes (Bolivia). However, the two are not sister species and so it remains unclear whether the congruent phenotype is the result of symplesiomorphy (cryptic speciation) or homoplasy. There were two instances of kapo-(phylo-)cryptic (“near-cryptic”) sister species (Figure 10), namely C. minor and C. paraminor (both known from Costa Rica), and C. hirsuta and C. schizophylloides (both known from Colombia). In both cases, the two sister species are phylogenetically distinct, with four positional ITS differences in C. minor vs. C. paraminor and 11 positional ITS differences in C. hirsuta vs. C. schizophylloides (File S10), and the phylogenetic separation is supported by a single character in each case (i.e., minor differences in the phenotype): short vs. no sutures in C. minor vs. C. paraminor (a rather subtle feature), and a strigose vs. setose lobe surface in C. hirsuta vs. C. schizophylloides; the latter two also differing in substrate preference (terrestrial vs. epiphytic). Furthermore, there was one case of two closely related, allo-(phylo-)cryptic (i.e., “semi-cryptic”) species, namely C. applanata vs. C. reticulifera: whereas the first is known from the Andes (documented by 32 sequenced samples), the second appears to be restricted to (south-)eastern Brazil and Uruguay (documented by 66 sequenced samples; Figure 10 and Figure S1, Table S4); both exhibit 16 positional ITS differences (File S10) and are, hence, clearly separated phylogenetically, but do not show any discernable phenotypical differences with respect to the tested characters. Finally, there were two instances of pseudo-(phylo-)cryptic species (i.e., the same phenotype having evolved in homoplasy in distantly related lineages), one encompassing three species (C. campestris vs. C. caliginosa vs. C. terrestris in blue) and the other one two species (C. cuzcoensis vs. C. davibogotana in green; Figure 10). Since only eu-, kapo-, and allo-(phylo-)cryptic lineages could be considered as potential “false positives” (i.e., taxa interpreted as species that may in fact represent infraspecific lineages), the potential error of overestimation of the species richness estimate in this dataset, by using phylogeny as sole evidence (i.e., potential taxonomic overinflation), would only be four species, out of 87 (i.e., less than 5%).
Our analysis of the TL, CI, RI, RC, and HI indices derived from phenotypic characters, comparing random, DNA-based, and phenotype-based trees, showed that trees based on phenotype alone were substantially more structured in terms of their phenotypic characters than DNA-based trees (Figure 11). DNA-based trees were also always closer to random trees than to phenotype-based trees in their phenotypic signal. This suggests a relatively high level of homoplasy for individual character states and a low level of character state intercorrelation. On the other hand, the mean pairwise character distance of over seven steps indicates that species generally have distinct morphologies, supporting their phylogenetic delimitation. Overall, closely related species usually look distinct and have different substrate ecologies, whereas distantly related species are more likely to appear similar.
Although there was a strong correlation between phylogenetically defined clades interpreted as species and their associated phenotypic characters, phenotype structure became generally diffuse at deeper nodes, as evidenced by the lack of correlation between phylogenetic and phenotypic distance. However, limited phylogenetic structure was still found for some characters at higher clade levels. Three small clades uniformly contained species with specific phenotype character states that may represent synapomorphies for these clades: one clade containing all species with a bleeding pigment formed upon rewetting previously dried collections (C. rubrosanguinea clade); one clade with species forming adnate, rounded, confluent hymenophores different from the concentrically shaped hymenophores in most other species (C. garagoa clade); and one clade with species colonizing naked soil with completely flattened, adnate thalli (C. reticulifera-applanata clade; Figure 10).

3.7. Intragenomic ITS Variation

Our side-by-side comparison of the same samples sequenced with Illumina and Sanger sequencing yielded 89 specimens for this analysis. However, for 14 of these samples, the regions sequenced were non-overlapping, with less than 50 bp of overlap, or of low quality and, therefore, not included.
For the rest, or 75 samples, 55 (73%) of the Sanger sequence did not show any ambiguity, 11 (15%) showed one ambiguity (=fixed allele), while nine (12%) showed two or more ambiguities (Figure 12a). As for the ASVs, 290 ASVs were detected for these 75 samples, ranging from 1 to 11 per sample. About 30% of the ASVs matched the Sanger sequence exactly (=0 singletons), while most ASVs (61%) presented only one different base pair in comparison to the Sanger sequence (=1 singleton) (Figure 12b). Most samples produced multiple ASVs, but were usually dominated by one or two haplotypes.

4. Discussion

4.1. Use of Archival Specimens

One of the most important results of our study is the finding that over 75% of the historical and nearly 94% of the fresh collected lichen samples yielded sequences with the Illumina platform. Using Sanger sequencing, far lower success rates were achieved for both historical (19%) and fresh (58%) collections. The reasons for the comparatively low success rate using Sanger sequencing on the newly collected material are unknown; in previous attempts to sequence fresh material from these genera, we typically achieved a success rate of 70–90% using Sanger technology. Initial preservation of the material also poses challenges on recent collections, especially if specimens cannot be properly dried when in the field for more than one day and carefully curated shortly afterwards. Nonetheless, the highly successful Illumina sequencing of these added fresh specimens indicates that DNA degradation had not progressed too far and even when these exact samples represented more difficulties with Sanger, Illumina sequencing worked satisfactorily. Regarding historical collections, similar or even higher success rates as in our study have been obtained in other recent studies using HTS to obtain DNA sequences from historical lichen collections [19,20,21], indicating that archival specimens available in herbaria and fungaria around the world may potentially yield usable sequences if the proper DNA extraction and sequencing approaches are taken. This includes many rare taxa, potentially extinct taxa that are no longer found in nature, and other taxa of unique value for which it is difficult to gather fresh material. The fact that so few published sequences currently exist for historical lichen collections is, thus, likely a consequence of the only recently growing awareness of the potential of advanced molecular sequencing methods to unlock these resources [12,13].
It should not be surprising that Illumina HTS yielded significantly better results than Sanger sequencing for archival specimens. DNA fragmentation in ancient herbarium samples is a well-documented phenomenon [1,78], including in lichen-forming fungi [16,18,19,20,79,80]. Considering this, and other postmortem damage known to take place in collected specimens [16,80], the success rate for the samples studied here is remarkably high, which may, in part, be explained by the generally higher sequencing success for Basidiomycota among fungal collections [24,25].
The addition of 318 new sequences from historical collections of Cora and Corella, including those of Cora timucua [23], makes this group one of the best represented among lichens with regard to historical sequences. With 92% of the 2988 GBIF occurrences known for this group (as of 31 January 2022) representing preserved samples (i.e., with a voucher deposited somewhere, not based on observations only), it is clear that historical collections are an invaluable resource that can be used in an integrative framework for describing and detecting new species and inferring relationships among them.
Our results demonstrate that the age of a specimen has some effect on the sequencing success rate, especially with regard to Sanger sequencing. Substrate type may also affect the success rate. However, it appears that other factors may play an important role in the degradation of DNA, such as the techniques employed at the time of collection to dry and preserve the specimens. Since these methods are usually not indicated on the specimen label, it is impossible to discern their potential impact from the role of age or substrate type as a determinant of sequencing success. Given the relatively good success rate we achieved, the fact that age is not a main determinant of success is notable. One important factor to consider is poikilohydry, which plays a major role in diurnal metabolism of lichens and directly relates to mechanisms protecting the DNA [81,82]. Perhaps lichens that undergo pronounced and/or prolonged dry periods maintain effective DNA protection mechanisms, whereas in lichen growing under frequently or permanently humid conditions, the DNA may be less protected from desiccation, a hypothesis already considered by Kistenich et al. [19]. One may, for instance, expect that species growing under more extreme water stress conditions, such as in southern South America or in the high Andes above 4000 m, would show better sequencing success even in archival specimens. However, without systematic comparison across different lichen taxa and a variety of habitats, this remains speculation, and how this would translate into sequencing success rates in Cora is unclear.
An important challenge to sequencing old samples is contamination, stemming from three potential sources: (1) fungi of the microbiome already present in the sample when collected; (2) fungal contaminants emerging due to specimen handling and preservation (e.g., molds); and (3) laboratory contaminants, which are particularly an issue with the highly sensitive HTS approaches. Although the first two potential sources of contamination in archival specimens are beyond the control of the investigator, laboratory contamination can be avoided or reduced to a minimum by applying recommended best practices, such as: (1) avoiding plate extractions and using individual tubes instead; (2) using extreme care when handling specimens and extracts (e.g., wearing gloves, sterilizing all equipment, especially forceps, etc.); (3) extracting DNA under sterile conditions, such as those found on ancient DNA laboratories; and (4) avoid working simultaneously with fresh and historical materials (e.g., in the same sequencing run), since more recently collected samples will tend to dominate a run, even with careful normalization of PCR input as performed here. In any case, potential contamination can be assessed posteriori by analyzing the taxonomic composition of fungal reads in a given sample.
In addition to the target mycobionts, we detected multiple other fungal taxa in our HTS samples. Although some of these, such as Aspergillus or Penicillium, may represent post-sampling contaminants, many others are frequent, opportunistic, or stable residents of the lichen mycobiome [34,83], including in Cora [84,85]. A great deal of evidence indicates the presence of obligately lichenicolous and endolichenic fungi and/or cortical yeasts in lichens [86,87,88,89,90,91,92,93,94,95,96]. With respect to known fungal groups previously found in lichens, in our material we detected ASVs belonging to members of the orders Cystofilobasidiales, Filobasidiales Tremellales, and Trichosporonales, all within the class Tremellomycetes, in 24% of the fresh samples and 22% of the historical samples (and in none of the negative controls) with varying quantity of reads. More than 21 distinct genera were detected within this class, with the most commonly observed genus being Hannaella, a basidiomycetous yeast genus found widely on leaf surfaces of various plants [97]. Even though the presence of fungi may influence humidity and ionic regimen on a thallus surface and subsequently transcriptomic response, without further data and knowledge of the development of these communities of species over time and their role in the symbioses, it is impossible to assign much significance to it at this point.
Presumptive laboratory contaminants were also sometimes observed in some samples. Generally, these were present in very low frequencies (e.g., fewer than 100 reads while the target mycobiont had 30,000 reads) and were not consistent with the inferred ecogeography of the corresponding species, which allowed their recognition and removal. If a sample only showed rare reads (less than 100) and no prevalent ASVs were present, the sample was considered unsuccessfully sequenced and was not included in the downstream analyses.

4.2. Assessment of ITS as a Barcoding Marker and Intragenomic Variation within ITS

Given the reported issues with the use of ITS as a fungal barcoding marker [34,35,36,37], and to address the possible argument that the observed phylogenetic diversity in Cora and Corella may in part be artifactual, we paid special attention to intragenomic variation in the ITS barcoding marker as evidenced by variation in the ASVs and ambiguities in Sanger sequences among our studied samples. Our expectation that potential ambiguities in Sanger sequences, mostly representing double peaks in the sequencing chromatograms, would match dominant and consistent SNPs in the corresponding Illumina ASVs was supported by the data, which allowed us to quantify this phenomenon reliably and in detail.
Since Illumina sequencing did not allow for amplification of the full ITS region, our comparisons were limited to samples for which we successfully sequenced the ITS1 region using both Sanger and Illumina for the same sample. For the 290 ASVs detected in these 75 samples, we detected no variation among the Sanger and the Illumina sequences (30%), one singleton (61%), two singletons (5%), three singletons (2%), and four to seven singletons (equal or less than 1%). Except for two samples for which only Illumina sequences were available, this variation had no effect on the phylogenetic placement of the target reads or the delimitation of phylogenetically defined lineages, supporting our earlier findings based on 454 pyrosequencing data that intragenomic ITS variation in Cora is low and does not lead to artifactual lineages [41]. The observed exceptions relate to two issues: either the target sequence was too short to cover lineage-diagnostic variation, then typically clustering at the base of the target clade or nearby; or the variation could be interpreted as potential hybridization and introgression, given that the ASVs detected were unique within the run, we are discarding the option of contamination in these specific cases, since multiple ASVs were available matching distinct alleles. Although this needs to be tested with genomic approaches, it would not be expected to lead to artifactual taxa, at least not in terms of species counts, as a hybrid component of the ITS would correspond to another, closely related species. We also considered mixed thalli (i.e., chimeric thalli between closely related species) as a potential source for this pattern, but with the methodological approach used here, this cannot be resolved.
Following earlier work with 454 pyrosequencing [32,41] and the increasing use of ITS1 for the Earth Microbiome Project and in other lichen studies [98], we adopted the ITS1 region as the default portion of the ITS barcoding marker for the Illumina sequencing employed here. Nonetheless, our analysis of full-length sequences indicates that at least in some clades, ITS2 showed better resolution for accurately detecting species using ITS-based BLAST identifications. This may be due to the more variable subterminal portion of the ITS2, which makes reliable alignments more challenging, but it appears to be highly discriminant, even between closely related species. Therefore, future metabarcoding using short reads should also attempt to sequence the ITS2 region [99,100,101], or focus on longer amplicon sequencing (PacBio, MINon, etc.) or shotgun sequencing, which might provide ways of overcoming sequence length limitations, although each of these techniques comes with its own disadvantages. However, most of the times, either ITS1 or ITS2 already provide enough resolution for species boundaries, especially within our integrative framework, making an Illumina an ideal method when assessing hundreds of samples [101].
In fungal barcoding approaches, it has been argued that single marker approaches, such as with ITS, may lead to inaccurate results or even cause taxonomic inflation if the data are not properly analyzed and interpreted [34,102]. In the case of Cora and Corella, ITS appears to work remarkably well, even in portions of the backbone, as evidenced by the high level of congruence between our single-marker ITS-based phylogeny and six-marker ASTRAL coalescent tree. At the level of terminal clades, a threshold ITS-based identify value of 99.4% appears to reliably discriminate between species, although some variation is observed which may depend on how recently a species-level clade evolved. In a few recently emerging species complexes, no absolute threshold value could be established and also the ITS-based BLAST results were partially diffuse, whereas in other cases, our initially delimited species-level clades may represent more than one lineage. Overall, these effects largely balance each other in terms of species counts, but may lead to inaccuracies in delimiting species in certain clades. Beyond single-marker ITS approaches, three other strategies could be used to test species delimitation in these cases: (1) multi-marker coalescent approaches [103]; (2) phylogenomics target capture approaches [104,105,106]; and (3) population genetics using microsatellites or RADSeq [107,108,109].
With regard to multi-marker approaches, our data show that ITS performed better for delimiting species than the protein-coding markers RPB2 or EF3, but also the classical markers nuLSU, mtSSU, and mtLSU; in addition, the ITS marker is much easier to generate. Consequently, multi-marker approaches or alternative barcodes do not seem to constitute a promising next step in resolving problematic species complexes or refining the DNA barcoding approach in this group of basidiolichens. Phylogenomic approaches (e.g., target capture), have also shown limitations in resolving recently evolving species [106], and, therefore, we consider the RADseq approach as potentially useful to further assess difficult species complexes in Dictyonematinae in addition to our ongoing metagenomic analyses. For a general barcoding approach, however, including metabarcoding with HTS approaches, we recommend the continued use of the ITS marker, due to its high amplification success and the broad molecular framework it provides to establish species hypotheses in this group of lichen-forming Basidiomycota.

4.3. Accurate Assessment of Phylogenetic Diversity in Cora and Corella

The large amount of ITS data now available allowed us to assess phylogenetic diversity in this group of basidiolichens using various quantitative and semi-quantitative approaches. As an initial approach to establish species hypotheses, we used the same ad hoc delimitation employed in our previous studies [32,33], namely a combination of visual inspection of stem branch lengths and support versus within-clade branch length variation versus geographic origin of the samples. In the present case, this led to the distinction of 265 ad hoc species hypotheses for the entire dataset (including all ASVs) and 175 for the subset of near-complete ITS sequences. Distance-based quantitative approaches (DNADIST-based analysis, ABGD, ASAP) all resulted in numbers within the range of 128–231 for the subset tested and 194–350 for the entire dataset (extrapolated). In contrast, the tree-based method bPTP yielded much higher estimates (709–889 species for the entire dataset). GMYC inferred values more similar to those of distance-based methods, with 189 estimated species in an interval of 145–237. To what extent these estimates might be real remains unclear. If the example of Usnea antarctica versus U. aurantiacoatra is taken as reference, near-identical ITS patterns may indeed hide more than one species [107,108], and lack of ITS-based resolution is also known from other fungi [35,36,37]. It is, therefore, possible that clades currently delimited as a single species with our ad hoc approach or using distance-based methods represent more than one species, although a three-fold increase seems unlikely based on our current knowledge. Consequently, we consider our ad hoc approach reliable at this point, as it is closer to the middle range of distance-based estimates and far below the bPTP delimitation approach, which, in turn, showed highly contrasting results to all other methods. An integrative approach was also the solution Boluda and colleagues [110] proposed to disentangle the incongruencies of the use of chemistry, morphology, molecular data (including multiple species delimitation methods) or phylogeny alone, for species boundaries in the Bryoria sect. Implexae complex.
The inclusion of a large number of historical collections extended the geographic range of sequenced samples, but still left many areas with potential occurrence of Cora (and Corella) unsampled. Thus, compared to the present number of 265 species, our original prediction of 450 species [32] still provides a valid framework and it seems likely that this number will eventually be reached. Undersampled regions notably include the central and southern portion of the Andes (Peru, Bolivia, Chile, Argentina), but also large parts of Central America and western Mexico, as well as the Guyana Highlands.
Overall, the present number of formally described (102), phylogenetically distinguished (by our ad hoc approach, 265), and predicted (>450 [32]) that the species in Cora does not differ from the range of accepted species in the 25 largest ascomycete lichen genera, which lies between 170 and 820 [111]. As such, the diversity now recognized in Cora aligns well with other megadiverse lichenized genera, showing that certain basidiolichen groups may harbor a species diversity similar to the most speciose ascolichen groups, an idea that would have been dismissed by most lichenologists even just a decade ago. Indeed, the observed diversity in these basidiolichens is striking not because there are so many species but because it has not been recognized before, much less at this magnitude. Prior to Parmasto’s monograph [30], six species had been formally described in this group (currently named Cora bovei, C. ciferrii, C. glabrata, C. gyrolophia, C. pavonia, and C. reticulifera) and three more in the genus Corella (C. brasiliensis, C. tomentosa, and C. zahlbruckneri); all nine had been synonymized by Parmasto under one taxon (Dictyonema pavonium). This historical number is remarkably low compared to other genera of similar size (e.g., Sticta), with hundreds of names established in the early literature. The main reason for the comparatively low number of historical epithets in Cora is that important field characters, such as color and substrate, are lost in herbarium specimens if not recorded at the time of collection, which were the primary source of access for researchers in the 19th century but also for modern monographers. This led to the lack of perception of size as an important character, as smaller herbarium specimens were sometimes interpreted as immature. Even field experience did not reveal the true nature of this group of basidiolichens, as the differences in ecology and morphology between specimens were interpreted as environmentally induced variation [112], a concept popular in the second half of the 20th century [113].

4.4. Level of Cryptic Speciation and Potential Taxonomic Inflation

The existence of hidden or unrecognized species within presumably well-known taxa is not an isolated phenomenon in fungi. In many presumably well-known taxa, such as the fly agaric (Amanita muscaria s.lat. [114]), the chanterelle (Cantharellus cibarius s.lat. [115,116,117]), the Lingzhi mushroom (Ganoderma lucidum s.lat. [118]), the true morels (Morchella esculenta s.lat. [119]), and the yellow speckleberry lichen (Pseudocyphellaria crocata s.lat. [120]), species delimitation studies using ITS and other markers have revealed a large number of previously unrecognized lineages.
Although some of these pose difficulties delimiting species phenotypically, other cases, such as Pseudocyphellaria crocata s.lat., often reveal taxonomically useful characters that had not been considered to be diagnostic before. In the genus Cora, given previous failures to properly recognize species diversity and the low number of characters useful for taxonomy, one would expect a number of over 250 species hypothesized from molecular data to go along with a high level of evolutionary crypticity, resulting in many species undistinguishable through their phenotype, potentially resulting in taxonomic inflation. Although the number of taxonomically useful characters in Cora is indeed limited, lacking for instance the diversity of spore types, vegetative propagules, or secondary compounds found in megadiverse ascolichen genera, the comparatively low number of 11 main phenotypes characters led to no less than 82 distinct phenotypes among the 87 analyzed species, rejecting the notion of largely cryptic speciation or taxonomic inflation in this genus. Instead, even with a low amount of perceived options to reliably distinguish species, we demonstrate that the combination of these characters yields sufficient information allowing to differentiate most species detected by molecular methods. Cases of identical phenotypes were in part found in distantly related lineages only (i.e., pseudophylocryptic), thus representing homoplasies rather than genuine cryptic speciation, whereas closely related species were mostly phenotypically distinct. Indeed, among 87 lineages, we identified only one case where two closely related species could not be distinguished by phenotype or chorology (euphylocryptic). Other cases differed either in one character state (kapophylocryptic) or in distribution (allophylocryptic). This supports the phenotype as useful for species-level taxonomy but renders phenotypic characters as of limited value when inferring phylogenetic relationships within this genus, with the exception of a few characters that correlate with larger clades.
Our results thus suggest that phenotype variation, species delimitation and the level of homoplasy in the basidiolichen genus Cora are comparable to large genera of lichenized Ascomycota, in which a limited set of phenotype characters leads to free or partially constrained combinations of character states in individual species. For example, in the crustose genus Lecanora, with 550 species [111], species are usually recognized by a combination of thallus morphology, apothecial disc color, epihymenial and excipular crystals, and chemistry [121,122,123,124,125,126,127,128,129,130], whereas in Usnea, a combination of growth form, branching pattern, thallus sectional structure, branch outgrowths and appendices, and secondary chemistry and pigments define species [131,132,133,134,135,136]. Other examples can be found in foliose Parmeliaceae review in [137], such as Bulbothrix [138], or the crustose genera Caloplaca [139,140], Graphis and Allographa [141,142]. Thus, in both Asco- or Basidiomycota, phenotypical characters may not correspond to molecular phylogenies at all clade levels [31], but they are useful in diagnosing closely related species within clades.
If the remarkable species diversity in Cora is largely not cryptic, the question must again be raised: why has it not been recognized before? As mentioned above, reasons can be looked for in the loss of important features in herbarium collections, similar to mushroom taxonomy, but also in the overinterpretation of variation as ecologically induced and not taxonomic. Cora is, therefore, not really a case of “hidden” diversity, but one of previously unrecognized or “overlooked” diversity.
The notion that phenotypically similar species of Cora are generally only distantly related could be explained by similar selective pressures in ecologically equivalent habitats, but in part also by free variation of a limited set of characters that may not represent functional traits. Once the phylogenetic diversity of Cora has been fully assessed phenotypically, this will be an exciting avenue for future studies. Fortunately, given the techniques to assess phenotype characters in herbarium collections [33], archival specimens for which sequence data are now available can be incorporated in such studies, providing a much broader geographical and ecological framework.

5. Conclusions

We conclude that DNA barcoding in the foliose genera Cora and Corella is indeed a success story, considering that our knowledge of this group of basidiolichens has increased from a single perceived species to one of the largest genera of lichen-forming fungi, detected largely through rigorous application of the fungal ITS barcoding marker within our integrative approach, combining: (1) visual inspection of the molecular data (alignments + phylogeny); (2) phenotypic and anatomical data; and (3) ecology, including habitat and substrate preferences. Almost all species of Cora and Corella have been documented molecularly from the onset, resulting in a broad, near-complete, and steadily-growing phylogenetic framework where additional sequence data can be quickly added, particularly those obtained from further historical specimens, including types.
Our highly successful HTS results indicate that ITS barcoding of collections collected from a couple decades to over a century ago can be used to extend our knowledge of species-level diversity. In particular, the addition of archival samples not only lead to the discovery of novel lineages but made the phylogenies more robust, helped to better assess species distributions, and thus remarkably improved our understanding of levels of inferred endemism.
The high number of species now recognized in Cora is not surprising if compared to large lichenized genera in Ascomycota. What is extraordinary is that the numerous species are not actually cryptic. We emphasize that our broad phylogenetic sampling was only partially responsible for this change, with assessments of the genus in the field being equally important in this case. The key element to uncover this previously unrecognized diversity was our integrative approach, which allowed us to test the reliability of novel taxonomic characters and question classic concepts about environmental variation, in which the addition of historical specimens was invaluable. Traditional concepts largely ignored phenotypically distinct characters, dismissing them as variability. However, it is important to acknowledge that we are at a privileged position in research, where we can employ molecular data to test these phenotypic-based hypotheses. At first glance, phenotypical characters seem less clear in basidiolichens, including its variation and the lack of features usually applicable to lichens in general. In ascolichens, traditional concepts have often focused on both morphological adaptations resulting from the lichen symbiosis as a whole and on characteristic features of the mycobiont. We postulate that the patterns of diversification seen in Cora, namely that phenotypic variation previously regarded as environmentally triggered is actually diagnostic of species-level lineages, will also hold true for many ascolichen genera (or for some lineages within) that have not yet been broadly assessed with molecular methods.
To assess evolutionary patterns related to so-called cryptic speciation, we, therefore, found it useful in this study to introduce more precise definitions of our concept of “crypticity”, taking into account that species may often appear similar but are nevertheless not actually identical (kapo-(phylo-)cryptic vs. eu-(phylo-)cryptic), that phenotypically similar species might nevertheless not be closely related (pseudo-(phylo-)cryptic), and that species distributions patterns (allo- vs. sympatric) must be taken into account when looking at this phenomenon (allo-(phylo-)cryptic). These definitions might prove useful when evaluating cases of cryptic speciation in other lichens, or even more broadly across fungi, even though, in the case of Cora, the majority of the species should no longer be considered cryptic, but instead an example where phenotypic variation had not been yet linked with genetic divergence.

Supplementary Materials

The following supporting information can be downloaded at: https://www.mdpi.com/article/10.3390/d14040284/s1, Figure S1: ITS full-length ML tree; Table S1: List of material used in this study; Table S2: Species utilized on the phenotypic assessment and their GenBank number; Table S3: Scores for the phenotype matrix (20 characters) for the 89 species utilized; Table S4: Full species delimitation results for all specimens; and 11 supplemental files containing data analyzed (File S1: ITS sequence alignment utilized as input in the ML analyses; File S2: Six-marker trees utilized as input in ASTRAL-III, the map file to delimit species in ASTRAL and all six alignments utilized to generate the respective trees; File S3: Only the separated corresponding ITS alignment with the same terminals as ASTRAL six-marker data; File S4: Subset of the ITS sequence data limited to the genus Cora, retaining only terminals with less than 30% gaps; File S5: Subset of 758 terminals with (near) complete ITS sequences, similar to the Cora subset File S4, but also including Acantholichen and Corella; File S6: BLAST performance of dataset 1—with the ITS1 region only; File S7: BLAST performance of dataset 2—entire ITS region of all original terminals with less than 10% gaps, including Illumina ASVs; File S8: BLAST performance of dataset 3—with the ITS2 region only; File S9: BLAST performance of dataset 4—with a short terminal region of the ITS2; File S10: Alignment with 89 target sequences for the phenotypic assessment; File S11: Distance matrix utilized for the barcoding gap analyses).

Author Contributions

Conceptualization, M.D.F., J.D.L., M.G. and R.L.; methodology and analyses, M.D.F., R.L.; lab work, M.D.F., B.M.; funding acquisition, M.D.F., J.D.L., F.B., E.S. and R.L.; first manuscript versions, M.D.F., J.D.L. and R.L.; writing, reviewing and editing, all authors. All authors have read and agreed to the published version of the manuscript.

Funding

This research was funded by the National Science Foundation (DEB 0841405 and PRFB 1609022), the Smithsonian Institution (SI) and the National Museum of Natural History (Peter Buck Postdoctoral Fellowship), the Global Genome Initiative and the SI DNA Barcode Network.

Institutional Review Board Statement

Not applicable.

Informed Consent Statement

Not applicable.

Data Availability Statement

The data presented in this study are available in Supplementary Materials and deposited at GenBank.

Acknowledgments

M.D.F., J.D.L. and R.L. would like to thank the National Science Foundation for financial support and all collaborators who have helped in field expeditions, as well as those who sent material throughout the years. M.D.F. also wishes to thank the Smithsonian Institution and the National Museum of Natural History for a Peter Buck Postdoctoral Fellowship, a grant from the SI DNA Barcode Network (FY18 Award Cycle, PI MDF) and an award from the Global Genome Initiative (GGI-Exp_Sci-2016-069, PIs ES and MDF). M.D.F. would also like to thank Katherine (Katie) Murphy, Niamh Redmond, José Zuniga, Jeffrey Hunt, Jonathan (Jon) Coddington, Sergei Drovetski, Kenan Matterson, Gabriel (Gabe) Johnson, and Julia Steier, for their help in the LAB and project support at the SI-NMNH. Nancy McInerney is thanked for her help and permission to utilize equipment at the CCG. Morgan Gostel and Jerrod Stone from the Botanical Research Institute of Texas are acknowledged for their help with the microfluidics PCR and assessment of herbarium Sanger sequences, respectively. Galapagos specimens examined as part of this study were collected and examined from 2009 to 2013 as part of an NSF sponsored project (DEB 0841405), a project included in the Annual Operative Plan as part of the Galapagos Lichen Inventory by the Charles Darwin Foundation (CDF), approved at the time by the Directorate of the Galapagos National Park (DPNG). We are particularly grateful to successive scientific directors of the research station and technical directors of the Galapagos National Park for their continued support. The Galapagos Lichen Inventory is now part of the national biodiversity assessment “Biodiversidad Genética del Ecuador”, led by the Instituto Nacional de Biodiversidad del Ecuador (INABIO). For research and specimen permits we are particularly indebted to Danny Rueda, Daniel Lara Solís, Galo Quedaza and Victor Carrión from DPNG, and Diego Inclán, Francisco Prieto and Rosa Batallas (INABIO). This publication is contribution number 2447 of the Charles Darwin Foundation for the Galapagos Islands. Lastly, we thank the reviewers for their contributions to the improvement of this manuscript.

Conflicts of Interest

The authors declare no conflict of interest.

References

  1. Funk, V.A. Collections-based science in the 21st Century. J. Syst. Evol. 2018, 56, 175–193. [Google Scholar] [CrossRef] [Green Version]
  2. Holmes, M.W.; Hammond, T.T.; Wogan, G.; Walsh, R.E.; LaBarbera, K.; Wommack, E.A.; Martins, F.M.; Crawford, J.C.; Mack, K.L.; Bloch, L.M.; et al. Natural history collections as windows on evolutionary processes. Mol. Ecol. 2016, 25, 864–881. [Google Scholar] [CrossRef] [PubMed] [Green Version]
  3. Salvador, R.B.; Cunha, C.M. Natural history collections and the future legacy of ecological research. Oecologia 2020, 192, 641–646. [Google Scholar] [CrossRef] [PubMed]
  4. MacLean, H.J.; Nielsen, M.E.; Kingsolver, J.G.; Buckley, L.B. Using museum specimens to track morphological shifts through climate change. Philos. Trans. R. Soc. B Biol. Sci. 2019, 374, 20170404. [Google Scholar] [CrossRef] [Green Version]
  5. Hedrick, B.P.; Heberling, J.M.; Meineke, E.K.; Turner, K.G.; Grassa, C.J.; Park, D.S.; Kennedy, J.; A Clarke, J.; A Cook, J.; Blackburn, D.C.; et al. Digitization and the Future of Natural History Collections. BioScience 2020, 70, 243–251. [Google Scholar] [CrossRef]
  6. Schindel, D.E.; Cook, J.A. The next generation of natural history collections. PLOS Biol. 2018, 16, e2006125. [Google Scholar] [CrossRef] [Green Version]
  7. Kauserud, H.; Stige, L.C.; Vik, J.O.; Økland, R.H.; Høiland, K.; Stenseth, N.C. Mushroom fruiting and climate change. Proc. Natl. Acad. Sci. USA 2008, 105, 3811–3814. [Google Scholar] [CrossRef] [Green Version]
  8. Ristaino, J.B. The Importance of Mycological and Plant Herbaria in Tracking Plant Killers. Front. Ecol. Evol. 2020, 7. [Google Scholar] [CrossRef] [Green Version]
  9. Purvis, O.; Dubbin, W.; Chimonides, P.; Jones, G.; Read, H. The multi-element content of the lichen Parmelia sulcata, soil, and oak bark in relation to acidification and climate. Sci. Total Environ. 2008, 390, 558–568. [Google Scholar] [CrossRef]
  10. Agnan, Y.; Séjalon-Delmas, N.; Probst, A. Comparing early twentieth century and present-day atmospheric pollution in SW France: A story of lichens. Environ. Pollut. 2013, 172, 139–148. [Google Scholar] [CrossRef] [Green Version]
  11. Minganti, V.; Drava, G.; de Pellegrini, R.; Modenesi, P.; Malaspina, P.; Giordani, P. Temporal trends (1981–2007) of trace and rare earth elements in the lichen Cetraria islandica (L.) Ach. from Italian herbaria. Chemosphere 2014, 99, 180–185. [Google Scholar] [CrossRef] [PubMed]
  12. Stiller, M.; Knapp, M.; Stenzel, U.; Hofreiter, M.; Meyer, M. Direct multiplex sequencing (DMPS)—A novel method for targeted high-throughput sequencing of ancient and highly degraded DNA. Genome Res. 2009, 19, 1843–1848. [Google Scholar] [CrossRef] [PubMed] [Green Version]
  13. Bieker, V.; Martin, M.D. Implications and future prospects for evolutionary analyses of DNA in historical herbarium collections. Bot. Lett. 2018, 165, 409–418. [Google Scholar] [CrossRef] [Green Version]
  14. Staats, M.; Erkens, R.; van de Vossenberg, B.T.; Wieringa, J.; Kraaijeveld, K.; Stielow, B.; Geml, J.; Richardson, J.-E.; Bakker, F.T. Genomic Treasure Troves: Complete Genome Sequencing of Herbarium and Insect Museum Specimens. PLoS ONE 2013, 8, e69189. [Google Scholar] [CrossRef] [Green Version]
  15. Cong, Q.; Shen, J.; Zhang, J.; Li, W.; Kinch, L.N.; Calhoun, J.V.; Warren, A.D.; Grishin, N.V. Genomics Reveals the Origins of Historical Specimens. Mol. Biol. Evol. 2021, 38, 2166–2176. [Google Scholar] [CrossRef]
  16. Sohrabi, M.; Myllys, L.; Stenroos, S. Successful DNA sequencing of a 75 year-old herbarium specimen of Aspicilia aschabadensis (J. Steiner) Mereschk. Lichenol. 2010, 42, 626–628. [Google Scholar] [CrossRef]
  17. Redchenko, O.; Vondrák, J.; KOŠNAR, J. The oldest sequenced fungal herbarium sample. Lichenol. 2012, 44, 715–718. [Google Scholar] [CrossRef]
  18. Bendiksby, M.; Mazzoni, S.; Jørgensen, M.H.; Halvorsen, R.; Holien, H. Combining genetic analyses of archived specimens with distribution modelling to explain the anomalous distribution of the rare lichen Staurolemma omphalarioides: Long-distance dispersal or vicariance? J. Biogeogr. 2014, 41, 2020–2031. [Google Scholar] [CrossRef]
  19. Kistenich, S.; Halvorsen, R.; Schrøder-Nielsen, A.; Thorbek, L.; Timdal, E.; Bendiksby, M. DNA Sequencing Historical Lichen Specimens. Front. Ecol. Evol. 2019, 7. [Google Scholar] [CrossRef] [Green Version]
  20. Gueidan, C.; Elix, J.A.; McCarthy, P.M.; Roux, C.; Mallen-Cooper, M.; Kantvilas, G. PacBio amplicon sequencing for metabarcoding of mixed DNA samples from lichen herbarium specimens. MycoKeys 2019, 53, 73–91. [Google Scholar] [CrossRef]
  21. Gueidan, C.; Li, L. A long-read amplicon approach to scaling up the metabarcoding of lichen herbarium specimens. MycoKeys 2022, 86, 195–212. [Google Scholar] [CrossRef] [PubMed]
  22. Schmull, M.; Dal-Forno, M.; Lücking, R.; Cao, S.; Clardy, J.; Lawrey, J.D. Dictyonema huaorani (Agaricales: Hygrophoraceae), a new lichenized basidiomycete from Amazonian Ecuador with presumed hallucinogenic properties. Bryologist 2014, 117, 386–394. [Google Scholar] [CrossRef]
  23. Lücking, R.; Kaminsky, L.; Perlmutter, G.B.; Lawrey, J.D.; Forno, M.D. Cora timucua (Hygrophoraceae), a new and potentially extinct, previously misidentified basidiolichen of Florida inland scrub documented from historical collections. Bryologist 2020, 123, 657–673. [Google Scholar] [CrossRef]
  24. Osmundson, T.W.; Robert, V.A.; Schoch, C.L.; Baker, L.J.; Smith, A.; Robich, G.; Mizzan, L.; Garbelotto, M.M. Filling Gaps in Biodiversity Knowledge for Macrofungi: Contributions and Assessment of an Herbarium Collection DNA Barcode Sequencing Project. PLoS ONE 2013, 8, e62419. [Google Scholar] [CrossRef] [PubMed] [Green Version]
  25. Voitk, A.; Saar, I.; Lücking, R.; Moreau, P.-A.; Corriol, G.; Krisai-Greilhuber, I.; Thorn, R.G.; Hay, C.R.; Moncada, B.; Gulden, G. Surprising Morphological, Ecological and ITS Sequence Diversity in the Arrhenia acerosa Complex (Basidiomycota: Agaricales: Hygrophoraceae). Sydowia 2021, 73, 133. [Google Scholar] [CrossRef]
  26. Schoch, C.L.; Seifert, K.A.; Huhndorf, S.; Robert, V.; Spouge, J.L.; Levesque, C.A.; Chen, W.; Fungal Barcoding Consortium; Fungal Barcoding Consortium Author List; Bolchacova, E.; et al. Nuclear ribosomal internal transcribed spacer (ITS) region as a universal DNA barcode marker for Fungi. Proc. Natl. Acad. Sci. USA 2012, 109, 6241–6246. [Google Scholar] [CrossRef] [Green Version]
  27. Lawrey, J.D.; Lücking, R.; Sipman, H.J.; Chaves, J.L.; Redhead, S.A.; Bungartz, F.; Sikaroodi, M.; Gillevet, P.M. High concentration of basidiolichens in a single family of agaricoid mushrooms (Basidiomycota: Agaricales: Hygrophoraceae). Mycol. Res. 2009, 113, 1154–1171. [Google Scholar] [CrossRef]
  28. Dal-Forno, M.; Lawrey, J.D.; Sikaroodi, M.; Bhattarai, S.; Gillevet, P.M.; Sulzbacher, M.; Lücking, R. Starting from scratch: Evolution of the lichen thallus in the basidiolichen Dictyonema (Agaricales: Hygrophoraceae). Fungal Biol. 2013, 117, 584–598. [Google Scholar] [CrossRef]
  29. Lodge, D.J.; Padamsee, M.; Matheny, P.B.; Aime, M.C.; Cantrell, S.A.; Boertmann, D.; Kovalenko, A.; Vizzini, A.; Dentinger, B.T.M.; Kirk, P.M.; et al. Molecular phylogeny, morphology, pigment chemistry and ecology in Hygrophoraceae (Agaricales). Fungal Divers. 2014, 64, 1–99. [Google Scholar] [CrossRef] [Green Version]
  30. Parmasto, E. The Genus Dictyonema (‘Thelephorolichenes’). Nova Hedwig. 1978, 29, 99–144. [Google Scholar]
  31. Hawksworth, D.L. A New Name for Dictyonema pavonium (Swartz) Parmasto. Lichenologist 1988, 20, 101. [Google Scholar] [CrossRef]
  32. Lücking, R.; Dal-Forno, M.; Sikaroodi, M.; Gillevet, P.M.; Bungartz, F.; Moncada, B.; Yánez-Ayabaca, A.; Chaves, J.L.; Coca, L.F.; Lawrey, J.D. A single macrolichen constitutes hundreds of unrecognized species. Proc. Natl. Acad. Sci. USA 2014, 111, 11091–11096. [Google Scholar] [CrossRef] [PubMed] [Green Version]
  33. Lücking, R.; Forno, M.D.; Moncada, B.; Coca, L.F.; Vargas-Mendoza, L.Y.; Aptroot, A.; Arias, L.J.; Besal, B.; Bungartz, F.; Cabrera-Amaya, D.M.; et al. Turbo-taxonomy to assemble a megadiverse lichen genus: Seventy new species of Cora (Basidiomycota: Agaricales: Hygrophoraceae), honouring David Leslie Hawksworth’s seventieth birthday. Fungal Divers. 2016, 84, 139–207. [Google Scholar] [CrossRef]
  34. Lücking, R.; Leavitt, S.D.; Hawksworth, D.L. Species in lichen-forming fungi: Balancing between conceptual and practical considerations, and between phenotype and phylogenomics. Fungal Divers. 2021, 109, 99–154. [Google Scholar] [CrossRef]
  35. Lücking, R.; Aime, M.C.; Robbertse, B.; Miller, A.N.; Ariyawansa, H.A.; Aoki, T.; Cardinali, G.; Crous, P.W.; Druzhinina, I.S.; Geiser, D.M.; et al. Unambiguous identification of fungi: Where do we stand and how accurate and precise is fungal DNA barcoding? IMA Fungus 2020, 11, 1–32. [Google Scholar] [CrossRef]
  36. Stielow, J.; Lévesque, C.; Seifert, K.; Meyer, W.; Irinyi, L.; Smits, D.; Renfurm, R.; Verkley, G.; Groenewald, M.; Chaduli, D.; et al. One fungus, which genes? Development and assessment of universal primers for potential secondary fungal DNA barcodes. Persoonia-Mol. Phylogeny Evol. Fungi 2015, 35, 242–263. [Google Scholar] [CrossRef] [Green Version]
  37. Al-Hatmi, A.M.; Ende, A.G.V.D.; Stielow, J.B.; van Diepeningen, A.D.; Seifert, K.A.; McCormick, W.; Assabgui, R.; Gräfenhan, T.; De Hoog, G.S.; Levesque, C.A. Evaluation of two novel barcodes for species recognition of opportunistic pathogens in Fusarium. Fungal Biol. 2016, 120, 231–245. [Google Scholar] [CrossRef]
  38. Kelly, L.J.; Hollingsworth, P.M.; Coppins, B.J.; Ellis, C.J.; Harrold, P.; Tosh, J.; Yahr, R. DNA barcoding of lichenized fungi demonstrates high identification success in a floristic context. N. Phytol. 2011, 191, 288–300. [Google Scholar] [CrossRef]
  39. Pino-Bodas, R.; Martín, M.P.; Burgaz, A.R.; Lumbsch, H.T. Species delimitation in Cladonia (Ascomycota): A challenge to the DNA barcoding philosophy. Mol. Ecol. Resour. 2013, 13, 1058–1068. [Google Scholar] [CrossRef]
  40. Dal Forno, M.; Bungartz, F.; Yánez-Ayabaca, A.; Lücking, R.; Lawrey, J.D. High levels of endemism among Galapagos basidiolichens. Fungal Divers. 2017, 85, 45–73. [Google Scholar] [CrossRef]
  41. Lücking, R.; Lawrey, J.D.; Gillevet, P.M.; Sikaroodi, M.; Dal-Forno, M.; Berger, S.A. Multiple ITS Haplotypes in the Genome of the Lichenized Basidiomycete Cora inversa (Hygrophoraceae): Fact or Artifact? J. Mol. Evol. 2014, 78, 148–162. [Google Scholar] [CrossRef] [PubMed]
  42. Bradshaw, M.; Grewe, F.; Thomas, A.; Harrison, C.H.; Lindgren, H.; Muggia, L.; Clair, L.L.S.; Lumbsch, H.T.; Leavitt, S.D. Characterizing the ribosomal tandem repeat and its utility as a DNA barcode in lichen-forming fungi. BMC Evol. Biol. 2020, 20, 2. [Google Scholar] [CrossRef] [PubMed] [Green Version]
  43. Dal Forno, M.; Lawrey, J.D.; Sikaroodi, M.; Gillevet, P.M.; Schuettpelz, E.; Lücking, R. Extensive photobiont sharing in a rapidly radiating cyanolichen clade. Mol. Ecol. 2021, 30, 1755–1776. [Google Scholar] [CrossRef] [PubMed]
  44. Dal Forno, M.; Kaminsky, L.; Lücking, R. IUCN Red List of Threatened Species: Cora timucua. 2020. Available online: https://www.iucnredlist.org/ (accessed on 23 January 2022).
  45. Marotz, C.; Amir, A.; Humphrey, G.; Gaffney, J.; Gogul, G.; Knight, R. DNA extraction for streamlined metagenomics of diverse environmental samples. BioTechniques 2017, 62, 290–293. [Google Scholar] [CrossRef] [Green Version]
  46. Gardes, M.; Bruns, T.D. ITS primers with enhanced specificity for basidiomycetes—Application to the identification of mycorrhizae and rusts. Mol. Ecol. 1993, 2, 113–118. [Google Scholar] [CrossRef]
  47. White, T.J.; Bruns, T.; Lee, S.; Taylor, J. Amplification and direct sequencing of fungal ribosomal RNA genes for phylogenetics. In PCR Protocols: A Guide to Methods and Applications; Innis, M.A., Gelfand, D.H., Sninsky, J.J., White, T.J., Eds.; Academic Press: San Diego, CA, USA, 1990; pp. 315–322. [Google Scholar]
  48. Caporaso, J.G.; Lauber, C.L.; Walters, W.A.; Berg-Lyons, D.; Huntley, J.; Fierer, N.; Owens, S.M.; Betley, J.; Fraser, L.; Bauer, M.; et al. Ultra-high-throughput microbial community analysis on the Illumina HiSeq and MiSeq platforms. ISME J. 2012, 6, 1621–1624. [Google Scholar] [CrossRef] [Green Version]
  49. ITS Illumina Amplicon Protocol. Earth Microbiome Project. Available online: https://earthmicrobiome.org/protocols-and-standards/its/ (accessed on 5 July 2017).
  50. Bolyen, E.; Rideout, J.R.; Dillon, M.R.; Bokulich, N.A.; Abnet, C.; Al-Ghalith, G.A.; Alexander, H.; Alm, E.J.; Arumugam, M.; Asnicar, F. QIIME 2: Reproducible, Interactive, Scalable, and Extensible Microbiome Data Science. Peer J. Prepr. 2018. [Google Scholar] [CrossRef]
  51. Callahan, B.J.; Mcmurdie, P.J.; Rosen, M.J.; Han, A.W.; Johnson, A.J.A.; Holmes, S.P. DADA2: High-resolution sample inference from Illumina amplicon data. Nat. Methods 2016, 13, 581–583. [Google Scholar] [CrossRef] [Green Version]
  52. Abarenkov, K.; Zirk, A.; Piirmann, T.; Pöhönen, R.; Ivanov, F.; Nilsson, R.H.; Kõljalg, U. UNITE QIIME Release Fungi 2; UNITE Community: Tuckingmill, UK, 2020. [Google Scholar] [CrossRef]
  53. Hydra Smithsonian Institution. High Performance Computing Cluster; Smithsonian Institution: Washington, DC, USA, 2022. [Google Scholar]
  54. Gostel, M.R.; Coy, K.A.; Weeks, A. Microfluidic PCR-based target enrichment: A case study in two rapid radiations of Commiphora (Burseraceae) from Madagascar. J. Syst. Evol. 2015, 53, 411–431. [Google Scholar] [CrossRef]
  55. Gostel, M.R.; Zúñiga, J.D.; Kress, W.J.; Funk, V.A.; Puente-Lelievre, C. Microfluidic Enrichment Barcoding (MEBarcoding): A new method for high throughput plant DNA barcoding. Sci. Rep. 2020, 10, 1–13. [Google Scholar] [CrossRef]
  56. Katoh, K.; Rozewicki, J.; Yamada, K.D. MAFFT online service: Multiple sequence alignment, interactive sequence choice and visualization. Briefings Bioinform. 2019, 20, 1160–1166. [Google Scholar] [CrossRef] [PubMed] [Green Version]
  57. Sela, I.; Ashkenazy, H.; Katoh, K.; Pupko, T. GUIDANCE2: Accurate detection of unreliable alignment regions accounting for the uncertainty of multiple parameters. Nucleic Acids Res. 2015, 43, W7–W14. [Google Scholar] [CrossRef] [PubMed] [Green Version]
  58. Stamatakis, A. RAxML version 8: A tool for phylogenetic analysis and post-analysis of large phylogenies. Bioinformatics 2014, 30, 1312–1313. [Google Scholar] [CrossRef] [PubMed]
  59. Miller, M.A.; Pfeiffer, W.; Schwartz, T. The CIPRES science gateway: Enabling high-impact science for phylogenetics researchers with limited resources. In Proceedings of the 1st Conference of the Extreme Science and Engineering Discovery Environment: Bridging from the Extreme to the Campus and Beyond, New York, NY, USA, 16–19 July 2012; pp. 1–8. [Google Scholar]
  60. Zhang, C.; Rabiee, M.; Sayyari, E.; Mirarab, S. ASTRAL-III: Polynomial time species tree reconstruction from partially resolved gene trees. BMC Bioinform. 2018, 19, 15–30. [Google Scholar] [CrossRef] [PubMed] [Green Version]
  61. Smith, M.R. TreeDist: Distances between Phylogenetic Trees. Comprehensive R Archive Network. Bioinformatics 2020, 36, 5007–5013. [Google Scholar] [CrossRef]
  62. Smith, M.R. Information theoretic generalized Robinson–Foulds metrics for comparing phylogenetic trees. Bioinformatics 2021, 37, 2077–2078. [Google Scholar] [CrossRef]
  63. Fujisawa, T.; Barraclough, T.G. Delimiting Species Using Single-Locus Data and the Generalized Mixed Yule Coalescent Approach: A Revised Method and Evaluation on Simulated Data Sets. Syst. Biol. 2013, 62, 707–724. [Google Scholar] [CrossRef] [Green Version]
  64. Suchard, M.A.; Lemey, P.; Baele, G.; Ayres, D.L.; Drummond, A.J.; Rambaut, A. Bayesian phylogenetic and phylodynamic data integration using BEAST 1.10. Virus Evol. 2018, 4, vey016. [Google Scholar] [CrossRef] [Green Version]
  65. Drummond, A.J.; Rambaut, A. BEAST: Bayesian evolutionary analysis by sampling trees. BMC Evol. Biol. 2007, 7, 1–8. [Google Scholar] [CrossRef] [Green Version]
  66. Drummond, A.J.; Suchard, M.A.; Xie, D.; Rambaut, A. Bayesian Phylogenetics with BEAUti and the BEAST 1.7. Mol. Biol. Evol. 2012, 29, 1969–1973. [Google Scholar] [CrossRef] [Green Version]
  67. Zhang, J.; Kapli, P.; Pavlidis, P.; Stamatakis, A. A general species delimitation method with applications to phylogenetic placements. Bioinformatics 2013, 29, 2869–2876. [Google Scholar] [CrossRef] [PubMed] [Green Version]
  68. Felsenstein, J. PHYLIP—Phylogeny Inference Package (Version 3.57c); University of Washington: Seattle, WA, USA, 1995. [Google Scholar]
  69. Hall, T.A. BioEdit: A User-Friendly Biological Sequence Alignment Editor and Analysis Program for Windows 95/98/NT. Nucleic Acids Symp. Ser. 1999, 41, 95–98. [Google Scholar] [CrossRef]
  70. Puillandre, N.; Lambert, A.; Brouillet, S.; Achaz, G. ABGD, Automatic Barcode Gap Discovery for primary species delimitation. Mol. Ecol. 2012, 21, 1864–1877. [Google Scholar] [CrossRef] [PubMed]
  71. Puillandre, N.; Brouillet, S.; Achaz, G. ASAP: Assemble species by automatic partitioning. Mol. Ecol. Resour. 2021, 21, 609–620. [Google Scholar] [CrossRef] [PubMed]
  72. Hall, T.; Biosciences, I.; Carlsbad, C. BioEdit: An Important Software for Molecular Biology. GERF Bull. Biosci. 2011, 2, 60–61. [Google Scholar]
  73. Altschul, S.F.; Gish, W.; Miller, W.; Myers, E.W.; Lipman, D.J. Basic local alignment search tool. J. Mol. Biol. 1990, 215, 403–410. [Google Scholar] [CrossRef]
  74. Madden, T. The BLAST Sequence Analysis Tool. In The NCBI Handbook; National Center for Biotechnology Information (US): Bethesda, MD, USA, 2003. [Google Scholar]
  75. Swofford, D. PAUP*: Phylogenetic Analysis Using Parsimony (*and Other Methods); Sinauer Associates: Sunderland, MA, USA, 2003. [Google Scholar] [CrossRef]
  76. Swofford, D.L.; Sullivan, J. Phylogeny Inference Based on Parsimony and Other Methods Using PAUP*. The Phylogenetic Handbook: A Practical Approach to DNA and Protein Phylogeny; Sinauer Associates: Sunderland, MA, USA, 2003; Volume 7, pp. 160–206. [Google Scholar]
  77. Wong, B. Points of view: Color blindness. Nat. Methods 2011, 8, 441. [Google Scholar] [CrossRef]
  78. Bakker, F.T.; Bieker, V.C.; Martin, M.D. Editorial: Herbarium Collection-Based Plant Evolutionary Genetics and Genomics. Front. Ecol. Evol. 2020, 8, 603948. [Google Scholar] [CrossRef]
  79. Ohmura, Y.; Uno, K.; Hosaka, K.; Hosoya, T. DNA Fragmentation of herbarium specimens of lichens, and significance of epitypification for threatened species of Japan. In Proceedings of the 10th International Mycological Congress, Bangkok, Thailand, 3–9 August 2014; p. 151. [Google Scholar]
  80. Gueidan, C.; Aptroot, A.; Cáceres, M.E.D.S.; Binh, N.Q. Molecular phylogeny of the tropical lichen family Pyrenulaceae: Contribution from dried herbarium specimens and FTA card samples. Mycol. Prog. 2016, 15. [Google Scholar] [CrossRef]
  81. Kranner, I.; Zorn, M.; Turk, B.; Wornik, S.; Beckett, R.P.; Batič, F. Biochemical traits of lichens differing in relative desiccation tolerance. N. Phytol. 2003, 160, 167–176. [Google Scholar] [CrossRef] [PubMed] [Green Version]
  82. Kranner, I.; Beckett, R.; Hochman, A.; Nash, T.H. Desiccation-Tolerance in Lichens: A Review. Bryologist 2008, 111, 576–593. [Google Scholar] [CrossRef]
  83. Hawksworth, D.L.; Grube, M. Lichens redefined as complex ecosystems. N. Phytol. 2020, 227, 1281–1283. [Google Scholar] [CrossRef]
  84. Sierra, M.A.; Danko, D.C.; Sandoval, T.A.; Pishchany, G.; Moncada, B.; Kolter, R.; Mason, C.E.; Zambrano, M.M. The Microbiomes of Seven Lichen Genera Reveal Host Specificity, a Reduced Core Community and Potential as Source of Antimicrobials. Front. Microbiol. 2020, 11, 398. [Google Scholar] [CrossRef] [Green Version]
  85. Hodkinson, B.P.; Gottel, N.R.; Schadt, C.W.; Lutzoni, F. Photoautotrophic symbiont and geography are major factors affecting highly structured and diverse bacterial communities in the lichen microbiome. Environ. Microbiol. 2012, 14, 147–161. [Google Scholar] [CrossRef]
  86. Prillinger, H.; Kraepelin, G.; Lopandic, K.; Schweigkofler, W.; Molnár, O.; Weigang, F.; Dreyfuss, M.M. New species of Fellomyces Isolated from Epiphytic Lichen Species. Syst. Appl. Microbiol. 1997, 20, 572–584. [Google Scholar] [CrossRef]
  87. Mark, K.; Laanisto, L.; Bueno, C.G.; Niinemets, Ü.; Keller, C.; Scheidegger, C. Contrasting co-occurrence patterns of photobiont and cystobasidiomycete yeast associated with common epiphytic lichen species. N. Phytol. 2020, 227, 1362–1375. [Google Scholar] [CrossRef]
  88. Arnold, A.E.; Miadlikowska, J.; Higgins, K.L.; Sarvate, S.D.; Gugger, P.; Way, A.; Hofstetter, V.; Kauff, F.; Lutzoni, F. A Phylogenetic Estimation of Trophic Transition Networks for Ascomycetous Fungi: Are Lichens Cradles of Symbiotrophic Fungal Diversification? Syst. Biol. 2009, 58, 283–297. [Google Scholar] [CrossRef] [Green Version]
  89. Duarte, A.; Passarini, M.R.Z.; Delforno, T.; Pellizzari, F.; Cipro, C.V.Z.; Montone, R.C.; Petry, M.; Putzke, J.; Rosa, L.H.; Sette, L.D. Yeasts from macroalgae and lichens that inhabit the South Shetland Islands, Antarctica. Environ. Microbiol. Rep. 2016, 8, 874–885. [Google Scholar] [CrossRef]
  90. Lindgren, H.; Diederich, P.; Goward, T.; Myllys, L. The phylogenetic analysis of fungi associated with lichenized ascomycete genus Bryoria reveals new lineages in the Tremellales including a new species Tremella huuskonenii hyperparasitic on Phacopsis huuskonenii. Fungal Biol. 2015, 119, 844–856. [Google Scholar] [CrossRef] [PubMed]
  91. Millanes, A.M.; Diederich, P.; Wedin, M. Cyphobasidium gen. nov., a new lichen-inhabiting lineage in the Cystobasidiomycetes (Pucciniomycotina, Basidiomycota, Fungi). Fungal Biol. 2015, 120, 1468–1477. [Google Scholar] [CrossRef] [PubMed] [Green Version]
  92. DePriest, P.T.; Ivanova, N.V.; Fahselt, D.; Alstrup, V.; Gargas, A. Sequences of Psychrophilic Fungi Amplified from Glacier-Preserved Ascolichens. Can. J. Bot. 2000, 78, 1450–1459. [Google Scholar] [CrossRef] [Green Version]
  93. Spribille, T.; Tuovinen, V.; Resl, P.; Vanderpool, D.; Wolinski, H.; Aime, M.C.; Schneider, K.; Stabentheiner, E.; Toome-Heller, M.; Thor, G.; et al. Basidiomycete yeasts in the cortex of ascomycete macrolichens. Science 2016, 353, 488–492. [Google Scholar] [CrossRef] [PubMed] [Green Version]
  94. Lawrey, J.D.; Diederich, P. Lichenicolous Fungi: Interactions, Evolution, and Biodiversity. Bryologist 2003, 106, 80–120. [Google Scholar] [CrossRef]
  95. Diederich, P.; Lawrey, J.D.; Ertz, D. The 2018 classification and checklist of lichenicolous fungi, with 2000 non-lichenized, obligately lichenicolous taxa. Bryologist 2018, 121. [Google Scholar] [CrossRef]
  96. Tuovinen, V.; Ekman, S.; Thor, G.; Vanderpool, D.; Spribille, T.; Johannesson, H. Two Basidiomycete Fungi in the Cortex of Wolf Lichens. Curr. Biol. 2019, 29, 476–483.e5. [Google Scholar] [CrossRef] [Green Version]
  97. Li, Q.; Li, L.; Feng, H.; Tu, W.; Bao, Z.; Xiong, C.; Wang, X.; Qing, Y.; Huang, W. Characterization of the Complete Mitochondrial Genome of Basidiomycete Yeast Hannaella oryzae: Intron Evolution, Gene Rearrangement, and Its Phylogeny. Front. Microbiol. 2021, 12. [Google Scholar] [CrossRef]
  98. Fernández-Mendoza, F.; Fleischhacker, A.; Kopun, T.; Grube, M.; Muggia, L. ITS1 metabarcoding highlights low specificity of lichen mycobiomes at a local scale. Mol. Ecol. 2017, 26, 4811–4830. [Google Scholar] [CrossRef]
  99. Banchi, E.; Ametrano, C.G.; Stanković, D.; Verardo, P.; Moretti, O.; Gabrielli, F.; Lazzarin, S.; Borney, M.; Tassan, F.; Tretiach, M.; et al. DNA metabarcoding uncovers fungal diversity of mixed airborne samples in Italy. PLoS ONE 2018, 13, e0194489. [Google Scholar] [CrossRef]
  100. Wright, B.; Clair, L.L.S.; Leavitt, S.D. Is targeted community DNA metabarcoding suitable for biodiversity inventories of lichen-forming fungi? Ecol. Indic. 2019, 98, 812–820. [Google Scholar] [CrossRef]
  101. Olds, C.G.; Berta-Thompson, J.W.; Loucks, J.J.; Levy, R.A.; Wilson, A.W. Applying a Modified Metabarcoding Approach for the Sequencing of Macrofungal Specimens from Fungarium Collections. bioRxiv 2021. [Google Scholar] [CrossRef]
  102. Leavitt, S.D.; Johnson, L.; St. Clair, L.L. Species Delimitation and Evolution in Morphologically and Chemically Diverse Communities of the Lichen-forming Genus Xanthoparmelia (Parmeliaceae, Ascomycota) in Western North America. Am. J. Bot. 2011, 98, 175–188. [Google Scholar] [CrossRef] [PubMed]
  103. Jiang, S.-H.; Lücking, R.; Liu, H.-J.; Wei, X.-L.; Xavier-Leite, A.B.; Portilla, C.V.; Ren, Q.; Wei, J.-C. Twelve New Species Reveal Cryptic Diversification in Foliicolous Lichens of Strigula s.lat. (Strigulales, Ascomycota). J. Fungi 2022, 8, 2. [Google Scholar] [CrossRef]
  104. Leavitt, S.D.; Grewe, F.; Widhelm, T.; Muggia, L.; Wray, B.; Lumbsch, H.T. Resolving evolutionary relationships in lichen-forming fungi using diverse phylogenomic datasets and analytical approaches. Sci. Rep. 2016, 6, 22262. [Google Scholar] [CrossRef]
  105. Pizarro, D.; Divakar, P.K.; Grewe, F.; Leavitt, S.D.; Huang, J.-P.; Grande, F.D.; Schmitt, I.; Wedin, M.; Crespo, A.; Lumbsch, T. Phylogenomic analysis of 2556 single-copy protein-coding genes resolves most evolutionary relationships for the major clades in the most diverse group of lichen-forming fungi. Fungal Divers. 2018, 92, 31–41. [Google Scholar] [CrossRef]
  106. Lücking, R.; Moncada, B.; Widhelm, T.J.; Lumbsch, H.T.; Blanchon, D.J.; de Lange, P.J. The Sticta Filix—Sticta Lacera Conundrum (Lichenized Ascomycota: Peltigeraceae Subfamily Lobarioideae): Unresolved Lineage Sorting or Developmental Switch? Bot. J. Linn. Soc. 2021, boab083. [Google Scholar] [CrossRef]
  107. Grewe, F.; Lagostina, E.; Wu, H.; Printzen, C.; Lumbsch, T. Population genomic analyses of RAD sequences resolves the phylogenetic relationship of the lichen-forming fungal species Usnea antarctica and Usnea aurantiacoatra. MycoKeys 2018, 43, 91–113. [Google Scholar] [CrossRef]
  108. Lagostina, E.; Grande, F.D.; Andreev, M.; Printzen, C. The use of microsatellite markers for species delimitation in Antarctic Usnea subgenus Neuropogon. Mycologia 2018, 110, 1047–1057. [Google Scholar] [CrossRef]
  109. Widhelm, T.J.; Grewe, F.; Huang, J.; Ramanauskas, K.; Mason-Gamer, R.; Lumbsch, H.T. Using RADseq to understand the circum-Antarctic distribution of a lichenized fungus, Pseudocyphellaria glabra. J. Biogeogr. 2021, 48, 78–90. [Google Scholar] [CrossRef]
  110. Boluda, C.; Rico, V.; Divakar, P.; Nadyeina, O.; Myllys, L.; McMullin, T.; Zamora, J.C.; Scheidegger, C.; Hawksworth, D. Evaluating methodologies for species delimitation: The mismatch between phenotypes and genotypes in lichenized fungi (Bryoria sect. Implexae, Parmeliaceae). Persoonia-Mol. Phylogeny Evol. Fungi 2019, 42, 75–100. [Google Scholar] [CrossRef] [PubMed] [Green Version]
  111. Lücking, R.; Hodkinson, B.P.; Leavitt, S.D. The 2016 classification of lichenized fungi in the Ascomycota and Basidiomycota—Approaching one thousand genera. Bryologist 2017, 119, 361. [Google Scholar] [CrossRef]
  112. Larcher, W.; Vareschi, V. Variation in Morphology and Functional Traits of Dictyonema glabratum from Contrasting Habitats in the Venezuelan Andes. Lichenologist 1988, 20, 269–277. [Google Scholar] [CrossRef]
  113. Hawksworth, D.L. Some advances in the study of lichens since the time of E. M. Holmes. Bot. J. Linn. Soc. 1973, 67, 3–31. [Google Scholar] [CrossRef]
  114. Geml, J.; Laursen, G.A.; O’Neill, K.; Nusbaum, H.C.; Taylor, D.L. Beringian origins and cryptic speciation events in the fly agaric (Amanita muscaria). Mol. Ecol. 2006, 15, 225–239. [Google Scholar] [CrossRef] [PubMed]
  115. Ogawa, W.; Endo, N.; Fukuda, M.; Yamada, A. Phylogenetic analyses of Japanese golden chanterelles and a new species description, Cantharellus anzutake sp. nov. Mycoscience 2018, 59, 153–165. [Google Scholar] [CrossRef]
  116. Leacock, P.R.; Riddell, J.; Wilson, A.W.; Zhang, R.; Ning, C.; Mueller, G.M. Cantharellus chicagoensis sp. nov. is supported by molecular and morphological analysis as a new yellow chanterelle in midwestern United States. Mycologia 2016, 108, 765–772. [Google Scholar] [CrossRef]
  117. Buyck, B.; Hofstetter, V. The contribution of tef-1 sequences to species delimitation in the Cantharellus cibarius complex in the southeastern USA. Fungal Divers. 2011, 49, 35–46. [Google Scholar] [CrossRef]
  118. Hapuarachchi, K.K.; Wen, T.C.; Deng, C.Y.; Kang, J.C.; Hyde, K.D. Mycosphere Essays 1: Taxonomic Confusion in the Ganoderma lucidum Species Complex. Mycosphere 2015, 6, 542–559. [Google Scholar] [CrossRef]
  119. Du, X.-H.; Zhao, Q.; O’Donnell, K.; Rooney, A.P.; Yang, Z.L. Multigene molecular phylogenetics reveals true morels (Morchella) are especially species-rich in China. Fungal Genet. Biol. 2012, 49, 455–469. [Google Scholar] [CrossRef]
  120. Moncada, B.; Reidy, B.; Lücking, R. A phylogenetic revision of Hawaiian Pseudocyphellaria sensu lato (lichenized Ascomycota: Lobariaceae) reveals eight new species and a high degree of inferred endemism. Bryologist 2014, 117, 119–160. [Google Scholar] [CrossRef]
  121. Lumbsch, H.T.; Elix, J. Lecanora. In Flora of Australia Volume 56A, Lichens 4; CSIRO Publishing: Clayton, VIC, Australia, 2004; ISBN 0-643-09056-8. [Google Scholar]
  122. Guderley, R. Die Lecanora subfusca-Gruppe in Süd-Und Mittelamerika. J. Hattori Bot. Lab. 1999, 87, 131–257. [Google Scholar] [CrossRef]
  123. Guderley, R.; Lumbsch, H.T. Notes on Multispored Species of Lecanora Sensu Stricto. Lichenologist 1999, 31, 197–203. [Google Scholar] [CrossRef]
  124. Lumbsch, H.T.; Plümper, M.; Guderley, R.; Feige, G.B. The Corticolous Species of Lecanora Sensu Stricto with Pruinose Apothecial Discs. Symb. Bot. Ups. 1997, 32, 131–161. [Google Scholar]
  125. Lumbsch, H.T.; Feige, G.B.; Elix, J.A. A Revision of the Usnic Acid Containing Taxa Belonging to Lecanora sensu stricto (Lecanorales: Lichenized Ascomycotina). Bryologist 1995, 98, 561–577. [Google Scholar] [CrossRef]
  126. Lumbsch, H.T.; Guderley, R.; Elix, J.A. A Revision of Some Species in Lecanora sensu stricto with a Dark Hypothecium (Lecanorales, Ascomycotina). Bryologist 1996, 99, 269–291. [Google Scholar] [CrossRef]
  127. Zhao, X.; Leavitt, S.D.; Zhao, Z.T.; Zhang, L.L.; Arup, U.; Grube, M.; Pérez-Ortega, S.; Printzen, C.; Śliwa, L.; Kraichak, E.; et al. Towards a revised generic classification of lecanoroid lichens (Lecanoraceae, Ascomycota) based on molecular, morphological and chemical evidence. Fungal Divers. 2016, 78, 293–304. [Google Scholar] [CrossRef]
  128. Bungartz, F.; Elix, J.A.; Printzen, C. Lecanoroid lichens in the Galapagos Islands: The genera Lecanora, Protoparmeliopsis, and Vainionora (Lecanoraceae, Lecanoromycetes). Phytotaxa 2020, 431, 1–85. [Google Scholar] [CrossRef]
  129. Guzow-Krzemińska, B.; Łubek, A.; Malíček, J.; Tønsberg, T.; Oset, M.; Kukwa, M. Lecanora stanislai, a new, sterile, usnic acid containing lichen species from Eurasia and North America. Phytotaxa 2017, 329, 201–211. [Google Scholar] [CrossRef]
  130. Tripp, E.A.; Morse, C.A.; Keepers, K.G.; Stewart, C.A.; Pogoda, C.S.; White, K.H.; Hoffman, J.R.; Kane, N.C.; McCain, C.M. Evidence of substrate endemism of lichens on Fox Hills Sandstone: Discovery and description of Lecanora lendemeri as new to science. Bryologist 2019, 122, 246–259. [Google Scholar] [CrossRef]
  131. Gerlach, A.D.C.L.; Clerc, P.; da Silveira, R.M.B. Taxonomy of the corticolous, shrubby, esorediate, neotropical species of Usnea Adans. (Parmeliaceae) with an emphasis on southern Brazil. Lichenologist 2017, 49, 199–238. [Google Scholar] [CrossRef]
  132. Gerlach, A.D.C.L.; Toprak, Z.; Naciri, Y.; Caviró, E.A.; da Silveira, R.M.B.; Clerc, P. New insights into the Usnea cornuta aggregate (Parmeliaceae, lichenized Ascomycota): Molecular analysis reveals high genetic diversity correlated with chemistry. Mol. Phylogenet. Evol. 2019, 131, 125–137. [Google Scholar] [CrossRef]
  133. Truong, C.; Clerc, P. The lichen genus Usnea (Parmeliaceae) in tropical South America: Species with a pigmented medulla, reacting C+ yellow. Lichenologist 2012, 44, 625–637. [Google Scholar] [CrossRef] [Green Version]
  134. Truong, C.; Bungartz, F.; Clerc, P. The lichen genus Usnea (Parmeliaceae) in the tropical Andes and the Galapagos: Species with a red-orange cortical or subcortical pigmentation. Bryologist 2011, 114, 477–503. [Google Scholar] [CrossRef]
  135. Truong, C.; Rodriguez, J.M.; Clerc, P. Pendulous Usnea species (Parmeliaceae, lichenized Ascomycota) in tropical South America and the Galapagos. Lichenologist 2013, 45, 505–543. [Google Scholar] [CrossRef] [Green Version]
  136. Herrera-Campos, M.A.; Clerc, P.; Nash, T.H. Pendulous Species of Usnea from the Temperate Forests in Mexico. Bryologist 1998, 101, 303–329. [Google Scholar] [CrossRef]
  137. Thell, A.; Crespo, A.; Divakar, P.K.; Kärnefelt, I.; Leavitt, S.D.; Lumbsch, H.T.; Seaward, M.R.D. A review of the lichen family Parmeliaceae—History, phylogeny and current taxonomy. Nord. J. Bot. 2012, 30, 641–664. [Google Scholar] [CrossRef]
  138. Kirika, P.M.; Divakar, P.K.; Buaruang, K.; Leavitt, S.D.; Crespo, A.; Gatheri, G.W.; Mugambi, G.; Benatti, M.N.; Lumbsch, H.T. Molecular phylogenetic studies unmask overlooked diversity in the tropical lichenized fungal genus Bulbothrix s.l. (Parmeliaceae, Ascomycota). Bot. J. Linn. Soc. 2017, 184, 387–399. [Google Scholar] [CrossRef]
  139. Vondrák, J.; Frolov, I.; Arup, U.; Khodosovtsev, A. Methods for phenotypic evaluation of crustose lichens with emphasis on Teloschistaceae. Chornomorski Bot. J. 2013, 9, 382–405. [Google Scholar] [CrossRef]
  140. Frolov, I.; Vondrák, J.; Fernández-Mendoza, F.; Wilk, K.; Khodosovtsev, A.; Halıcı, M.G. Three New, Seemingly-Cryptic Species in the Lichen Genus Caloplaca (Teloschistaceae) Distinguished in Two-Phase Phenotype Evaluation. Ann. Bot. Fenn. 2016, 53, 243–262. [Google Scholar] [CrossRef] [Green Version]
  141. Lücking, R.; Archer, A.W.; Aptroot, A. A world-wide key to the genus Graphis (Ostropales: Graphidaceae). Lichenologist 2009, 41, 363–452. [Google Scholar] [CrossRef]
  142. Lücking, R.; Kalb, K. Formal Instatement of Allographa (Graphidaceae): How to Deal with a Hyperdiverse Genus Complex with Cryptic Differentiation and Paucity of Molecular Data. Herzogia 2018, 31, 535–561. [Google Scholar] [CrossRef]
Figure 1. Comparison of fresh samples in their natural habitat (a,b) versus dried and deposited in the herbarium (c,d)—(a,c): Cora spec-023 (Dal Forno 2042), (b,d): Cora cyphellifera (Dal Forno 1808).
Diversity 14 00284 g001
Figure 2. Map showing country-based availability of sequenced contemporaneous (fresh) and historical (herbarium) samples of Cora (and Corella) throughout the Americas (generated with mapchart.net).
Diversity 14 00284 g002
Figure 3. Overall ITS Success Rate in Illumina versus Sanger sequencing with historical and fresh samples (a), including a comparison by substrate (b). Color pallet proposed by Wong [77].
Diversity 14 00284 g003
Figure 4. Percentage of success in sequencing historical samples between the two tested sequencing platforms (Illumina, Sanger) by year (a), by period of time (b), and vegetation type (c).
Diversity 14 00284 g004
Figure 5. ITS fungal barcoding tree inferred by maximum likelihood for the genus Cora, including the Acantholichen-Corella clade as outgroup (1325 terminals), and two examples of the results of species delimitation approaches. Cora hawksworthiana (a) is currently considered a single species, but could potentially be further divided into two—one from Brazil and another for Chile, Colombia, and Costa Rica—based on the ad hoc, GMYC, DNADIST, and ABGD-231 approaches. In contrast, Cora reticulifera (b), an abundant common species from southeastern Brazil and Uruguay, with a uniform phenotype and ecology, was delimited as a single species by all methods, except in bPTP, which recovered each sample as a separated species. For the full-length tree as well as species delimitations for all specimens, see Figure S1 and Table S4.
Diversity 14 00284 g005
Figure 6. Comparison between inferred ASTRAL six-marker species tree (a) and ITS maximum likelihood tree (b). The different colors simply denote the two major clades in Cora, with Corella in black as the outgroup.
Diversity 14 00284 g006
Figure 7. Barcoding gap analysis using DNADIST in BioEdit. The different colors represent pairwise identity percentages (see legend). Highlighted clades show instances where the DNADIST and the ad hoc approaches inferred different species delimitations, potentially over- or underestimating species richness.
Diversity 14 00284 g007
Figure 8. BLAST results for the four different scenarios (ITS1 only, ITS1 including ASVs, ITS2, and short subterminal ITS2 region). The left column of graphs shows the terminals for each subset ranked by the minimum E score for hits (blue line), as opposed by the maximum E score for misses (orange line). The right row of graphs shows the corresponding overall distribution of E scores for self-hits, hits, and misses, for each subset.
Diversity 14 00284 g008
Figure 9. Distance between possible pairs of species for ITS (0–120 bp substitutions), and phenotype (0–16 characters steps). Blue dots on the left side of the graph correspond to closely related species pairs only, orange dots to all other species pair comparisons.
Diversity 14 00284 g009
Figure 10. Clade structure (87 Cora species plus two Corella outgroup) highlighting types of crypticity observed throughout the tree. The inset map highlights the allopatric distribution of C. applanata (northern Andes) vs. C. reticulifera (southeastern Brazil).
Diversity 14 00284 g010
Figure 11. Analyses showing TL, CI, RI, RC, and HI indices derived from phenotypic characters comparing random (Random), DNA-based (DNA), and phenotype-based (Phenotype) trees, assuming that DNA-based trees represent the underlying “true” phylogeny. For DNA-based trees, the corresponding index is always between that of random and phenotype-based trees, but in all cases closer to the random trees, indicating that phenotype structure correlates little with deeper nodes and mostly with terminal lineages.
Diversity 14 00284 g011
Figure 12. ITS1 variation observed within specimens. The fixed alleles graph (a) shows the percentages in which Sanger sequences presented ambiguities (0–7) in the ITS1 (e.g., an “R” whereas the Illumina reads showed either an “A” or “G”, the majority showing none). The singleton alleles graph (b) shows the percentage of ASVs in which Illumina reads differed from the Sanger sequences by 0–7 base pairs aside from the fixed alleles (e.g., 61% of all ASVs showed 1 bp different then the corresponding Sanger sequence they were being compared to).
Diversity 14 00284 g012
Table 1. Ecological (1), phenotypical (11), and chorological (8) characters and states scored for the selected 87 species in the genus Cora (plus two Corella). Only the 11 phenotypical characters (Size through Bleeding pigment) were utilized for generating the character strings.
Character\State012345?
1Substrate arocksoilgroundepiphytic
2Sizesmall
(lobes > 1 cm)
10édium
(lobes 1–3 cm)
large
(lobes > 3cm)
3Sutures babsentshortlong
4Color cgrey(grey-) brownolive (-green)greenaeruginous
5Surfaceevengranular-
rugose
pittedbroadly undulatenarrowly
undulate
6Trichomes dabsentpresent (felty)present (setose)present (strigose)
7Marginglabrouspilosegranulargranular-pilose
8Sorediaabsentpresent
9Cortexabsentviaduct-
shaped
collapsedcompactedprosoplecten-
chymatous
paraplecten-
chymatous
10Papillaeabsentpresent
11Hymenophorerounded-
confluent
concentricresupinate-
cyphelloid
cyphelloidnot
observed
12Bleeding pigmentabsentpresent
13Central Americaabsentpresent
14Caribbeanabsentpresent
15Galapagosabsentpresent
16Northern Andesabsentpresent
17Central Andesabsentpresent
18Southern Andesabsentpresent
19Eastern Brazilabsentpresent
20Asiaabsentpresent
a Soil means growing directly on bare soil, while ground means growing between terrestrial vegetation, e.g., over grasses. b Sutures refer to the lines apparent between two lobes, typically appearing as if the lobes have been sown together—short: only present along a small part of the lobes (see Figures 3I,K and 4G in [33]); long: present along most of the lobes (see Figures 5F and 7D,N in [33]). c Color when fresh or rewetted, not dried specimen. d Most samples are glabrous, but those with trichomes can be further divided—felty (rare, see Figure 8K,L in [33]): with short hairs formed by single hyphae; setose (most common type, see Figures 3L, 5O and 7K,L in [33]): with distinct hairs composed of at least partly agglutinate hyphae; strigose (few species, see Figures 4D,E and 10E,F in [33]): with conspicuous, long trichomes always composed of agglutinate hyphae.
Table 2. Definition of different types of crypticity within an evolutionary context and the corresponding terms used in other studies [34].
Proposed TermEtymologyPhenotype DistancePhylogenetic RelationshipDistribution
Eu-(phylo-)cryptic
(“cryptic”)
Greek:
eús, eû = good
zero
(same phenotype)
closely related
or sister species
sympatric
Kapo-(phylo-)cryptic
(“near-cryptic”)
Greek:
kápos = somewhat
very low
(similar phenotype)
closely related
or sister species
sympatric
Allo-(phylo-)cryptic
(“semi-cryptic”)
Greek:
állos = other
zero or very low
(same or similar phenotype)
closely related
or sister species
allopatric
Pseudo-(phylo-)cryptic
(“homoplasic”)
Greek:
pseudḗs = false
zero or very low
(same or similar phenotype)
unrelated or
distantly related
sympatric
or allopatric
Table 3. Species delimitation methods utilized and their respective results.
DatasetMethodSettingsEstimateOther Metrics:
Cora 1325 TerminalsbPTPmin791 (mean) 708 (min)889 (max)
Cora 1325 TerminalsGMYCsingle189145–237 (confidence interval)36.02878 (likelihood ratio) 1.50E-08 (LR Test)
Cora 1325 Terminalsad hoc 265
Extrapolated Barcode gap/threshold distance
Cora 716 Terminalsad hoc 175265 N/A
Cora 716 TerminalsDNADIST 171259 0.0060
Prior maximal distance Barcode gap/threshold distance
Cora 716 TerminalsABGDPartition 22313500.001668 0.0040
Cora 716 TerminalsABGDPartition 32313500.002783 0.0040
Cora 716 TerminalsABGDPartition 41472230.004642 0.0110
ASAP scorep-valueBarcode gap/threshold distance
Cora 716 TerminalsASAPK80-216124411.00.16200.0086
Cora 716 TerminalsASAPK80-212819413.50.00250.0130
Cora 716 TerminalsASAPK80-220531017.50.20200.0046
Cora 716 TerminalsASAPJC691612449.50.13000.0086
Cora 716 TerminalsASAPJC6914321718.50.07960.0102
Cora 716 TerminalsASAPJC6920531018.50.2460.0046
Cora 716 TerminalsASAPSimple1612448.50.14000.0086
Cora 716 TerminalsASAPSimple20531017.00.22600.0046
Publisher’s Note: MDPI stays neutral with regard to jurisdictional claims in published maps and institutional affiliations.

