
Functional and Taxonomic Overlap in Shore Fish Assemblages in a Tropical Seascape


1
UMR Entropie, Labex Corail, IRD, Université de Perpignan, 66000 Perpignan, France
2
UMR Entropie, Labex Corail, Université de la Nouvelle-Calédonie, CEDEX BP, 98851 Nouméa, New Caledonia, France
3
UR 227, Labex Corail, IRD-BP, 98841 Nouméa, New Caledonia, France
*
Author to whom correspondence should be addressed.
†
Deceased.
Diversity 2022, 14(5), 310; https://doi.org/10.3390/d14050310
Submission received: 2 February 2022
/
Revised: 17 March 2022
/
Accepted: 18 March 2022
/
Published: 20 April 2022
(This article belongs to the Special Issue Ecological Connectivity among Tropical Coastal Ecosystems)
Abstract
:The relationships between shore fish assemblages from habitats neighboring coral reefs have received little attention in the Indo-Pacific. The present study is based on the extensive sampling (539,000 fish; 898 taxa) of three fish assemblages: reefs, mangroves, and soft-bottoms in a large bay of New Caledonia. Species area curves indicate that sampling was nearly exhaustive in all three habitats (262 species in mangroves, 342 on soft-bottoms, 594 on reefs). Combinations of life-history traits were used as proxies of ecological functions. The species and functional overlaps were highest between soft-bottoms and mangroves and lowest between mangroves and reefs. These overlaps were lower than most recent studies in the Indo-Pacific, a result probably linked to the extent of the sampling in the present study. The life-history traits of species found exclusively in one habitat as opposed to several habitats were not a random selection within the species pool. Overlapping species were mostly large species that fed on nekton, large invertebrates, or plankton; exclusive species were mostly sedentary, solitary, and of small size, except for plankton-feeding species, which mostly had large home ranges and formed large schools. Herbivores were seldom found in several habitats. Functional redundancy was correlated to species richness, and was highest in reef fish assemblages. Functions common to several habitats had very seldom the same relative redundancy, implying that these functions had not the same importance for each assemblage. Functions exclusive to one habitat generally had low redundancy. These functional attributes and species overlap suggest that these three assemblages have a low level of interaction, despite the fact that they share extensive boundaries. These findings may have important applications in the management of shore fish assemblages.
Keywords:
connectivity; adjacent habitats; species overlap; functional overlap; fish; assemblages; reefs; mangroves; soft-bottoms1. Introduction
Connectivity between habitats within a lagoon seascape can be essential to the functioning of communities. Over most of their range, coral reefs are surrounded by many other habitats, in particular soft-bottoms and mangroves. However, the relationships between coral reef fish assemblages and the fish assemblages from habitats adjacent to reefs are still poorly documented in the Indo-Pacific. More attention has been directed on this issue in the Caribbean compared to the Indo-Pacific (see reviews by [1,2,3,4,5,6,7,8]). It has often been assumed that patterns described in the Caribbean may apply to the Indo-Pacific [6], but recent works suggest major differences, and these authors also indicate that more data are needed for the Indo-Pacific [8,9]. In particular, most families use a larger number of habitats in the tropical Atlantic compared to the Indo-Pacific. However, nearly 20% of known reef species in the central Pacific would use habitats other than reefs, according to [8]. These peri-reefal habitats are used by juveniles as well as adults [10], with a much higher use by juveniles in the tropical Atlantic compared to the Indo-Pacific.
The number of species sampled in the Indo-Pacific in this context until now has been relatively low (a maximum of 282 reef species in a study by [8] in Papua New Guinea) compared to the known species diversity of over 3000 reef fish species in this realm [11]. It could therefore be that important interactions across habitats have not been detected or have received less attention than they deserve.
With over 1800 coastal species [12], of which more than 1450 species can be considered as reef associated [13], New Caledonia can be considered as representative of this biogeographical region (Central Pacific). New Caledonia is an ideal region to analyze the importance of habitat on the functioning of fish assemblages within complex seascapes. In particular, its southwest lagoon is located in an area with a high habitat diversity which can be easily accessed (Figure 1; Supplementary Materials Table S1). This region of New Caledonia is also characterized by a high diversity of coastal fishes [12,13] and most other marine organisms [14].
Our main objective is to quantify the convergences and divergences in both taxonomical and functional structures between fish assemblages within a seascape in order to better understand how these assemblages may either interact or be independent. We propose to combine a taxonomic analysis with a functional analysis over the widest array of species sampled [15,16,17,18] for this purpose to date in the Central Pacific (sensu [11]). Indeed, most studies looked at the taxonomic composition e.g., [6,8,19,20,21] but seldom considered life-history traits, besides diet [8]. The latter is usually studied with respect to the potential energy transfers between habitats as well as their potential role as functional reservoir for herbivory (see [8] for a review).
Besides broad ecological functions such as the just cited herbivory, it is difficult to define functions within assemblages [22]. Life-history traits combinations, often labeled “functional entities” (FE) [23,24], are therefore used as proxies for the functional diversity within assemblages. We will combine the analysis of these FEs with taxonomic analyses.
We will investigate two other parameters, species redundancy, i.e., the number of species within a FE, and “functional vulnerability”, as defined by [24], which is the proportion of FEs containing a single species. Species redundancy within FEs is thought to be indicative of the resilience capacity of an assemblage [25,26]; a large overlap within the same FE across habitats could potentially favor resilience against perturbations. On the other hand, a high proportion of vulnerable FEs would suggest potentially more fragile assemblages [27].
Numerous habitats have been explored to understand how reef fish assemblages depend on neighboring habitats. Seagrass, macroalgal beds, soft-bottoms, and mangroves have been the most studied (see [8] for a review). In the present study, samples from seagrass, macroalgal beds and soft-bottoms could not be separated and therefore were grouped as “soft-bottoms”. The combination of these soft-bottoms with mangroves and reefs covers most of the seascape of our study zone (Figure 1; Supplementary Materials Table S1) and therefore should be representative of the functioning of their fish assemblages.
2. Materials and Methods
2.1. Sampling
All the sampling took place during one year, 1988, (to avoid seasonal effect) in St. Vincent Bay in the southwest lagoon of New Caledonia, where coral reefs cover 93.4 km2 [28], soft-bottoms 230.7 km2 [29], and mangroves 30.6 km2 [30] (Figure 1; Supplementary Materials Table S1). None of the area sampled belonged to a protected area. Experimental fishing permits were obtained from the “Direction de l’Environnement” of the South Province of New Caledonia in Nouméa. No endangered or protected species at that time were interfere with, harmed, or captured during this experiment. Species were determined in the field, if possible; otherwise, they were later identified in the lab or sent to specialists. Large numbers of specimens were sent to museums, in particular the Museum of Natural History in Paris (MNHN), the Bishop Museum in Hawaii (the curator was then J. Randall), and the Smithsonian Institute (Washington). Minor samples were sent to other museums (e.g., Australian Museum in Sydney for gobies; Western Australia Museum—G. Allen; Royal Ontario Museum—R. Winterbottom; California Natural History Museum, British Museum in London). A local collection was also created in Nouméa which now gathers more than a thousand species and over 5000 specimens. Fricke et al. [12] indicate where specimens can be found. Besides collections for museums, numerous fish were dissected for their gut content and gonads (over 30,000 fish) [31], length frequencies were performed for the most abundant species (over 50,000 fish measured), and otoliths were also collected for numerous species (see [32]).
In order to obtain an exhaustive inventory, at least two methods were used in each habitat (Supplementary Materials Table S2). All samples were taken during daytime, with the exception of fyke nets, which catch fish all day long. However, it was not possible to use the same methods in all habitats. Visual censuses could not be performed in mangroves because the water was too murky; rotenone could not be performed on soft-bottoms because the fish densities were too low. The sampling effort was yet considerable in all habitats and most abundant or frequent species were recorded, as SAR curves will attest (Species Area Relationship).
Underwater-visual census was used on coral reefs and soft-bottoms (see [33] for details). Two divers, one on each side of a 50 m (reef) or 250 m (soft-bottom) transect line, recorded all the fish species they could detect. For each record, the observers noted species, size (cm) and number. Transects were usually laid perpendicular to the depth contours in order to cover as many reef habitats as possible.
Rotenone collecting was used on coral reefs and in mangroves: a surrounding net 60 m long, 4 m high with a 2 cm stretched mesh, was first set. Setting the net was performed as rapidly as possible, in order to minimize the number of fish escaping the net. The net had a heavy weight line in order to enable the best contact with the bottom. Once the net set, 7 L of rotenone mix were poured into the net by three divers. The mix was prepared from rotenone powder (8% active substance), sea water, and liquid soap. Fish were collected by a team of six people, two divers on the bottom, two snorkelers for mid water and surface, and two small boats with dip nets to collect fish drifting on the surface. In mangroves, the rotenone stations were set at ebbing tide in areas where the bottom was covered with less than 50 cm of water at low tide, so that fish which dropped on the bottom could be easily collected despite the lack of visibility.
Rotenone is quickly dispersed in the marine environment and is rapidly destroyed (less than a day—see Supplementary Materials Table S3) by sunlight and is mainly active on fish, with very little side mortality on invertebrates; in particular, coral is not affected [34].
Sampling with rotenone is nowadays a controversial issue, see [34] for a debate and Supplemental Materials Table S3 for a bibliography on its use. At the time of our sampling (1988), this method was, however, commonly used (see Supplementary Materials Table S3), but nowadays we certainly recommend against its use for sampling in highly diversified and/or fragile environments. Indeed, large collections of reef fish species for museums are no longer needed, as the number of species needing to be described is rapidly decreasing [35], samples to analyze the biology or ecology of fish are quickly evolving and require less and less tissues, and, in many cases, fish are no longer killed (e.g., genetics, gut contents, stable isotopes). In addition, a number of new non-lethal techniques are emerging which could contribute differently to our vision of reef fish assemblages, such as for instance video recordings (see [36] for a review), probably hydro-acoustics (e.g., [37]) and environmental DNA (e.g., [38,39]).
A fyke net was used in mangroves [40]. Each fyke net set comprised a barrier net 50 m long, 1.2 m high with a 2 cm stretch mesh, and a cod end with a 15 mm stretched mesh. Soaking time was 12 h, with the net set at high tide and fish retrieved from the cod end every 6 h.
Gill nets were used in mangroves. Each gill net sampling station was a combination of three nets, each net being 3 m high and 70 m long, with 40, 60, and 80 mm stretched meshes, respectively. Soaking time was 6 h, the net being set at high tide.
A shrimp trawl was used on soft-bottoms. The shrimp trawl net (14 m headrope, 2 cm-mesh codend, tickler chain) was towed at a mean speed of 2.3 knots for 30 min, covering an area of 14,900 m2. A fish trawl was also used on soft-bottoms (16.4 m headrope, 2.5 cm-mesh codend, rubber rollers) being towed at a mean speed of 3 knots for 23 min, covering 25,600 m2.
For all methods the fish were sorted to the species [12] and the number of fish and weight per species was recorded.
2.2. Life History Traits and Biological Parameters
Four life-history traits were considered to describe the functional role of the species: diet, species size, home range, and schooling behavior. Each species’ traits can be found in [41] and FISHBASE.
Diet (D): as diet is by far the most studied trait in coastal tropical assemblages (see [8] for a review), we detailed this trait with three levels of analysis. The first level was a simple classification that divided species into four groups: piscivores (P), carnivores (C), herbivores (H), and plankton feeder (Z). Detritus feeders were included with herbivores, as very few species use detritus as a dominant food item. This classification was retained to build FEs (see further). As most fish species eat several food items, we built a second classification based on the first two major food items known for each species, unless the first food item comprises more than 50% of the diet, and then only this food item is noted. The food items were classified in seven categories: n: nekton (fish and large swimming invertebrates), m1: macrobenthos (>5 mm), m2: microbenthos (<5 mm), a1: large fleshy algae or seagrass, a2: turf and microalgae, co: coral and sponges, d: detritus or unidentified organic material from the bottom layer. For instance, the class “nm1” indicates a species eating mainly nekton and using macrobenthos as a secondary food source. Last, for each of the previous diet classes, an average trophic level (TL) was estimated from values given by FishBase (see https://www.fishbase.de/fishonline/english/fol_fishaspart.htm, accessed on 30 January 2022, for algorithms and TL values) for the species found in this class.
Species size (S): based on the maximum known size of each species, fish were allocated to six size groups: <8 cm; 8–16 cm; >16–30 cm; >30–50 cm; >50–80 cm; >80 cm.
Home range (H): species were grouped into four classes: territorial (very restricted home range, usually less than 10 m2), sedentary (small home ranges usually less than 500 m2), mobile (species which are not bound to a specific area, but do not necessarily change constantly of area), and very mobile (species which are constantly on the move and are not bound to a specific area).
Adult (non-spawning) schooling behavior (B): species were grouped into five classes: solitary species (nearly always alone), paired species (form pairs), species making small schools or groups (on average 3–20 fish per school), species making medium size schools (20–50 fish per school), and species making large schools (>50 fish per school).
Two biological parameters were also investigated:
Geographical range: an index of the extent of the geographical distribution of each species was estimated following [42] and based upon checklists. For each species, the number of 5° × 5° geographical cells (in the Indo-Pacific) where the species has been recorded was counted.
2.3. Functional Entities
Functional entities (FE) were defined as the combination of the four life-history traits (DSHB) in the order of diet (D) (first level), size (S), home-range (H), schooling behavior (B). These functional entities will be considered as a proxy of functional groups, knowing that true ecological functions within reef fishes are still poorly understood [22]. Functional entities can be characterized by their number of species, which will be defined here as “redundancy”. In order to compare the redundancy amongst habitats, a relative redundancy was estimated by taking into account the species richness of each habitat.
2.4. Relative Richness and Species Accumulation Curves
It is not possible to compare directly the species richness amongst habitats because the methods and the sampling efforts were different for each habitat. The comparison of species richness was therefore based on species accumulation curves. The latter were obtained within each habitat by assigning to each station a number at random, whichever the sampling method. Then, the cumulative number of species was obtained by ranking the stations according to this random number. The procedure was repeated 100 times for each habitat and the medium value retained.
3. Results
A total of 539,000 fish were either caught or observed during this survey. The highest numbers were caught or observed on soft-bottoms (402,000), followed by coral reefs (90,000) and mangroves (47,000). The cumulated species curves for each habitat (Figure 2) showed that, despite the sampling effort, the asymptote was not reached for either reefs or soft-bottoms. However, fitting these curves with equation [1] indicated that for a sampling increase by 30%, the proportion of new species for each habitat would be less than 4% (Figure 2). Doubling the sampling effort would only add 5.7% more species for reefs, 9% for mangroves, and 6.3% for soft-bottoms (Figure 2).
3.1. Taxonomy
3.1.1. Species
A total of 895 taxa were observed or caught (Supplementary Materials Table S4). The highest number of species was found on reefs (R) (594) followed by soft-bottoms (SB) (342) and mangroves (M) (262) (Chi2 test: M < SB < R (p < 0.001; a posteriori p < 0.01). There were 47 species (4.6%) common to all three habitats (Figure 3; Supplementary Materials Table S4). The largest overlap was between reefs and soft-bottoms with 151 species, followed by the overlap between soft-bottoms and mangroves (105 species), the lowest overlap being between mangroves and reefs with 90 species (Figure 3; Supplementary Materials Table S4; Global p < 0.001; a posteriori 151 > (105–90) p < 0.01; p > 0.05 for SB_M and R_M). Reefs had the highest proportion of exclusive species (67%) (found only in that habitat), soft-bottoms and mangroves having similar proportions of exclusive species (38.9% and 43.5%, respectively) (Global difference % exclusives p < 0.001; a posteriori R < (SB-M), p < 0.001).
3.1.2. Genera
A total of 343 genera were observed, the maximum (208) being observed on reefs followed by soft-bottoms (172) and mangroves (143) (Figure 3; Supplementary Materials Table S4 Global p < 0.001; M < (SB-R) p < 0.001). For all three habitats, 42 genera (12.3%) were common. There was a major difference in the overlaps between habitats at the genus level compared to the species level. More genera were common (p < 0.05) to mangroves and reefs (106 genera) than to mangroves and soft-bottoms (74). Of the total, 102 genera (49% of the genera found on reefs) were exclusive to reefs. For mangroves and soft-bottoms, the proportions were similar, with 32.6% and 32.9% exclusive genera, respectively. These exclusive genera were significantly less diverse (1.8 species/genus on reefs, 1.3 for mangroves, and 1.2 for soft-bottoms) than average (2.9 species/genus for reefs, 1.8 for mangroves, 2.0 for soft-bottoms). The most speciose of these exclusive genera were found on reefs and grouped small species (Trimma, Eviota, Norfolkia, Ecsenius) as well as Labridae (Bodianus, Coris) and Holocentridae (Myripristis), which are all strongly linked to hard substrates. Only three genera were exclusively found in mangroves, with three species each (Liza, Eleotris, and Strongylura). No genus exclusive to soft-bottom had three species or more.
3.1.3. Families
A total of 101 families were observed. The number of families was similar in all 3 habitats (66 on reefs, 70 on soft-bottoms, 63 in mangroves) (Supplementary Materials Table S4; Figure 4). Thirty-five families (34%) were common to all three habitats. Three families were common only to reefs and mangroves, whereas thirteen families were common to mangroves and soft-bottoms. Sixteen families were exclusive to reefs, twelve to mangroves, and ten to soft-bottoms. Most of these exclusive families had only one species, the most speciose being the Pseudochromidae (reefs) and the Eleotridae (mangroves), with five species each.
The profiles of species frequencies amongst families were different for the three habitats (Supplementary Materials Table S5; Figure 4). On reefs, a large proportion of species were concentrated in few families (Figure 4), whereas the profiles for mangroves and soft-bottoms were similar, with a lower contribution of the most speciose families. The proportion of families represented by a single species was the highest on reefs (61% of families) followed by soft-bottoms (57%) and mangroves (49%).
The species exclusive to each habitat had a specific distribution across families (Supplementary Materials Table S5). Four families (Blenniidae, Gobiidae, Apogonidae, and Syngnathidae) had species composition with more than 50% exclusive species in each habitat. In other words, it is possible to determine the habitat of each assemblage with only these four families alone. Other families had specifically high proportion of exclusive species in each habitat (Supplementary Materials Table S5), in particular: Labridae, Pomacentridae, Chaetodontidae, Scaridae, Muraenidae, Holocentridae, and Acanthuridae on reefs; Clupeidae and Sphyraenidae on soft-bottoms; Mugilidae and Eleotridae in mangroves.
3.2. Diet and Trophic Level
A comparison of the trophic level spectra across habitats (Figure 5) indicates a high similarity. However, two peaks exist for reef fish, one at trophic level 2.0 and another at 2.8, which respectively correspond to herbivores and mixed diets of plankton and algae, whereas one peak exists for both mangrove and soft-bottoms at trophic level 4.4, which corresponds to piscivores (Supplementary Materials Table S6). The most important trophic group (TL 3.1 to 3.8; Figure 5; Supplementary Materials Table S6) in all habitats was carnivores, with 56.4% for coral reef species, 51.5% for soft-bottom, and 54.2% for mangroves. Within this group, there were differences across habitats for the subgroups. Thus, reef fish were characterized by sessile invertebrate feeders and invertebrate/detritus feeders (class m2d), whereas soft-bottom fish had higher frequencies of micro-invertebrate feeders (class m1) and mangroves had higher frequencies of macroinvertebrates feeders, with a secondary contribution of plankton in their diet (class m2-z). The highest trophic levels (adding nekton feeding species: n, n-m1, n-z) represented a larger proportion of the species on soft-bottoms (22.6%) and mangroves (22.7%) compared to coral reefs (12.5%) (SB-M > R, p < 0.01). Plankton feeders represented a larger proportion of species on soft-bottoms (22.3%) than reefs (16.5%) or mangroves (14.1%). Detritus feeders were mainly found in mangroves, but accounted for only 3.8% of the species (Supplementary Materials Figure S1C). Herbivores represented an important group only for reefs (14.2% of species, versus 4.7% for soft-bottoms, and 7.3% for mangroves).
Within a habitat, the diets of exclusive species had different trophic spectra compared to overlapping species (Supplementary Materials Figure S1; Supplementary Materials Table S6). In particular, species exclusive to reefs displayed a peak at the trophic level (TL) 2.7, which corresponds to species feeding primarily on plankton but with a strong complement in microalgae, most of these species belonging to Pomacentridae. In contrast, these exclusive reef fish species had a lower proportion of species with a TL higher than 3.6, which corresponds to macro-carnivores and piscivores. There were no differences in the TL spectra for soft-bottom fish between exclusive and overlapping species. For mangroves, the exclusive species had a higher frequency of species, between TL 2.5 and 3.1, which corresponds to species for which detritus is an important food item as well as specific plankton feeders such as Ambassidae and Apogonidae.
3.3. Other Traits
Reef fish were markedly different from soft-bottoms and mangroves (Chi2 p < 0.001) as they had a larger proportion of species characterized by small sizes (38% <16 cm; p < 0.001), narrow home ranges (67% territorial or sedentary), and low gregarity (65% solitary or paired species) (Supplementary Materials Table S7). These differences were even more pronounced for the species exclusive to reefs, as 56% of them were <16 cm, 78% were territorial or sedentary, and 71% were solitary or paired. Species from soft-bottoms and mangroves had more similar traits, the major difference being larger sizes for mangrove species (30.9% of species >50 cm compared to 20.5% for soft-bottom fish) (Supplementary Materials Table S7). More exclusive species were mobile and very mobile on soft-bottoms and mangroves (81% versus 64%) than on reefs, and there were less very small species on soft-bottoms (25.6% versus 3.6% species <7 cm) (Supplementary Materials Table S7).
Species common to all habitats were characterized by large sizes (32% >50 cm) and large home ranges (74% mobile or very mobile) and tended to form medium size schools (41%) (Supplementary Materials Table S7). The species common to mangroves and soft-bottoms were characterized by very large species (>50 cm, 24%), forming large schools (26%), and being very mobile (65%) (Supplementary Materials Table S7). The other overlapping species had less prominent traits. Thus, the species common to mangroves and reefs were characterized by a large proportion (46%) of species between 30 and 80 cm and by species forming small to medium size schools (41%), whereas the species common to reefs and soft-bottoms were characterized mainly by medium size species (71% between 8 and 30 cm) (Supplementary Materials Table S7).
There was no difference in average PLD, nor in PLD distribution (Supplementary Materials Figure S2) across biotopes (reefs: 33.4 ± 1.6 days; mangroves: 38.9 ± 8.4 days; soft-bottoms: 33.1 ± 4.5 days). The distribution of geographical ranges according to habitat (Figure 6) indicates a larger proportion of species with wide geographical ranges for reefs compared to mangroves or soft-bottoms and, consequently, very little endemism (species with a geographical index less than 5). No difference in PLD nor in geographical range index could be detected between overlapping and exclusive species within a habitat.
3.4. Functional Entities
The number of functional entities (FE) was larger for reefs than soft-bottoms and mangroves (Figure 3; Supplementary Materials Table S4). The overlap in FE amongst habitats was large and the proportion of overlap (ratio of the number of overlapping FE in a habitat to the total number of FE) was higher than for the taxonomic levels (Figure 3; Supplementary Materials Table S4).
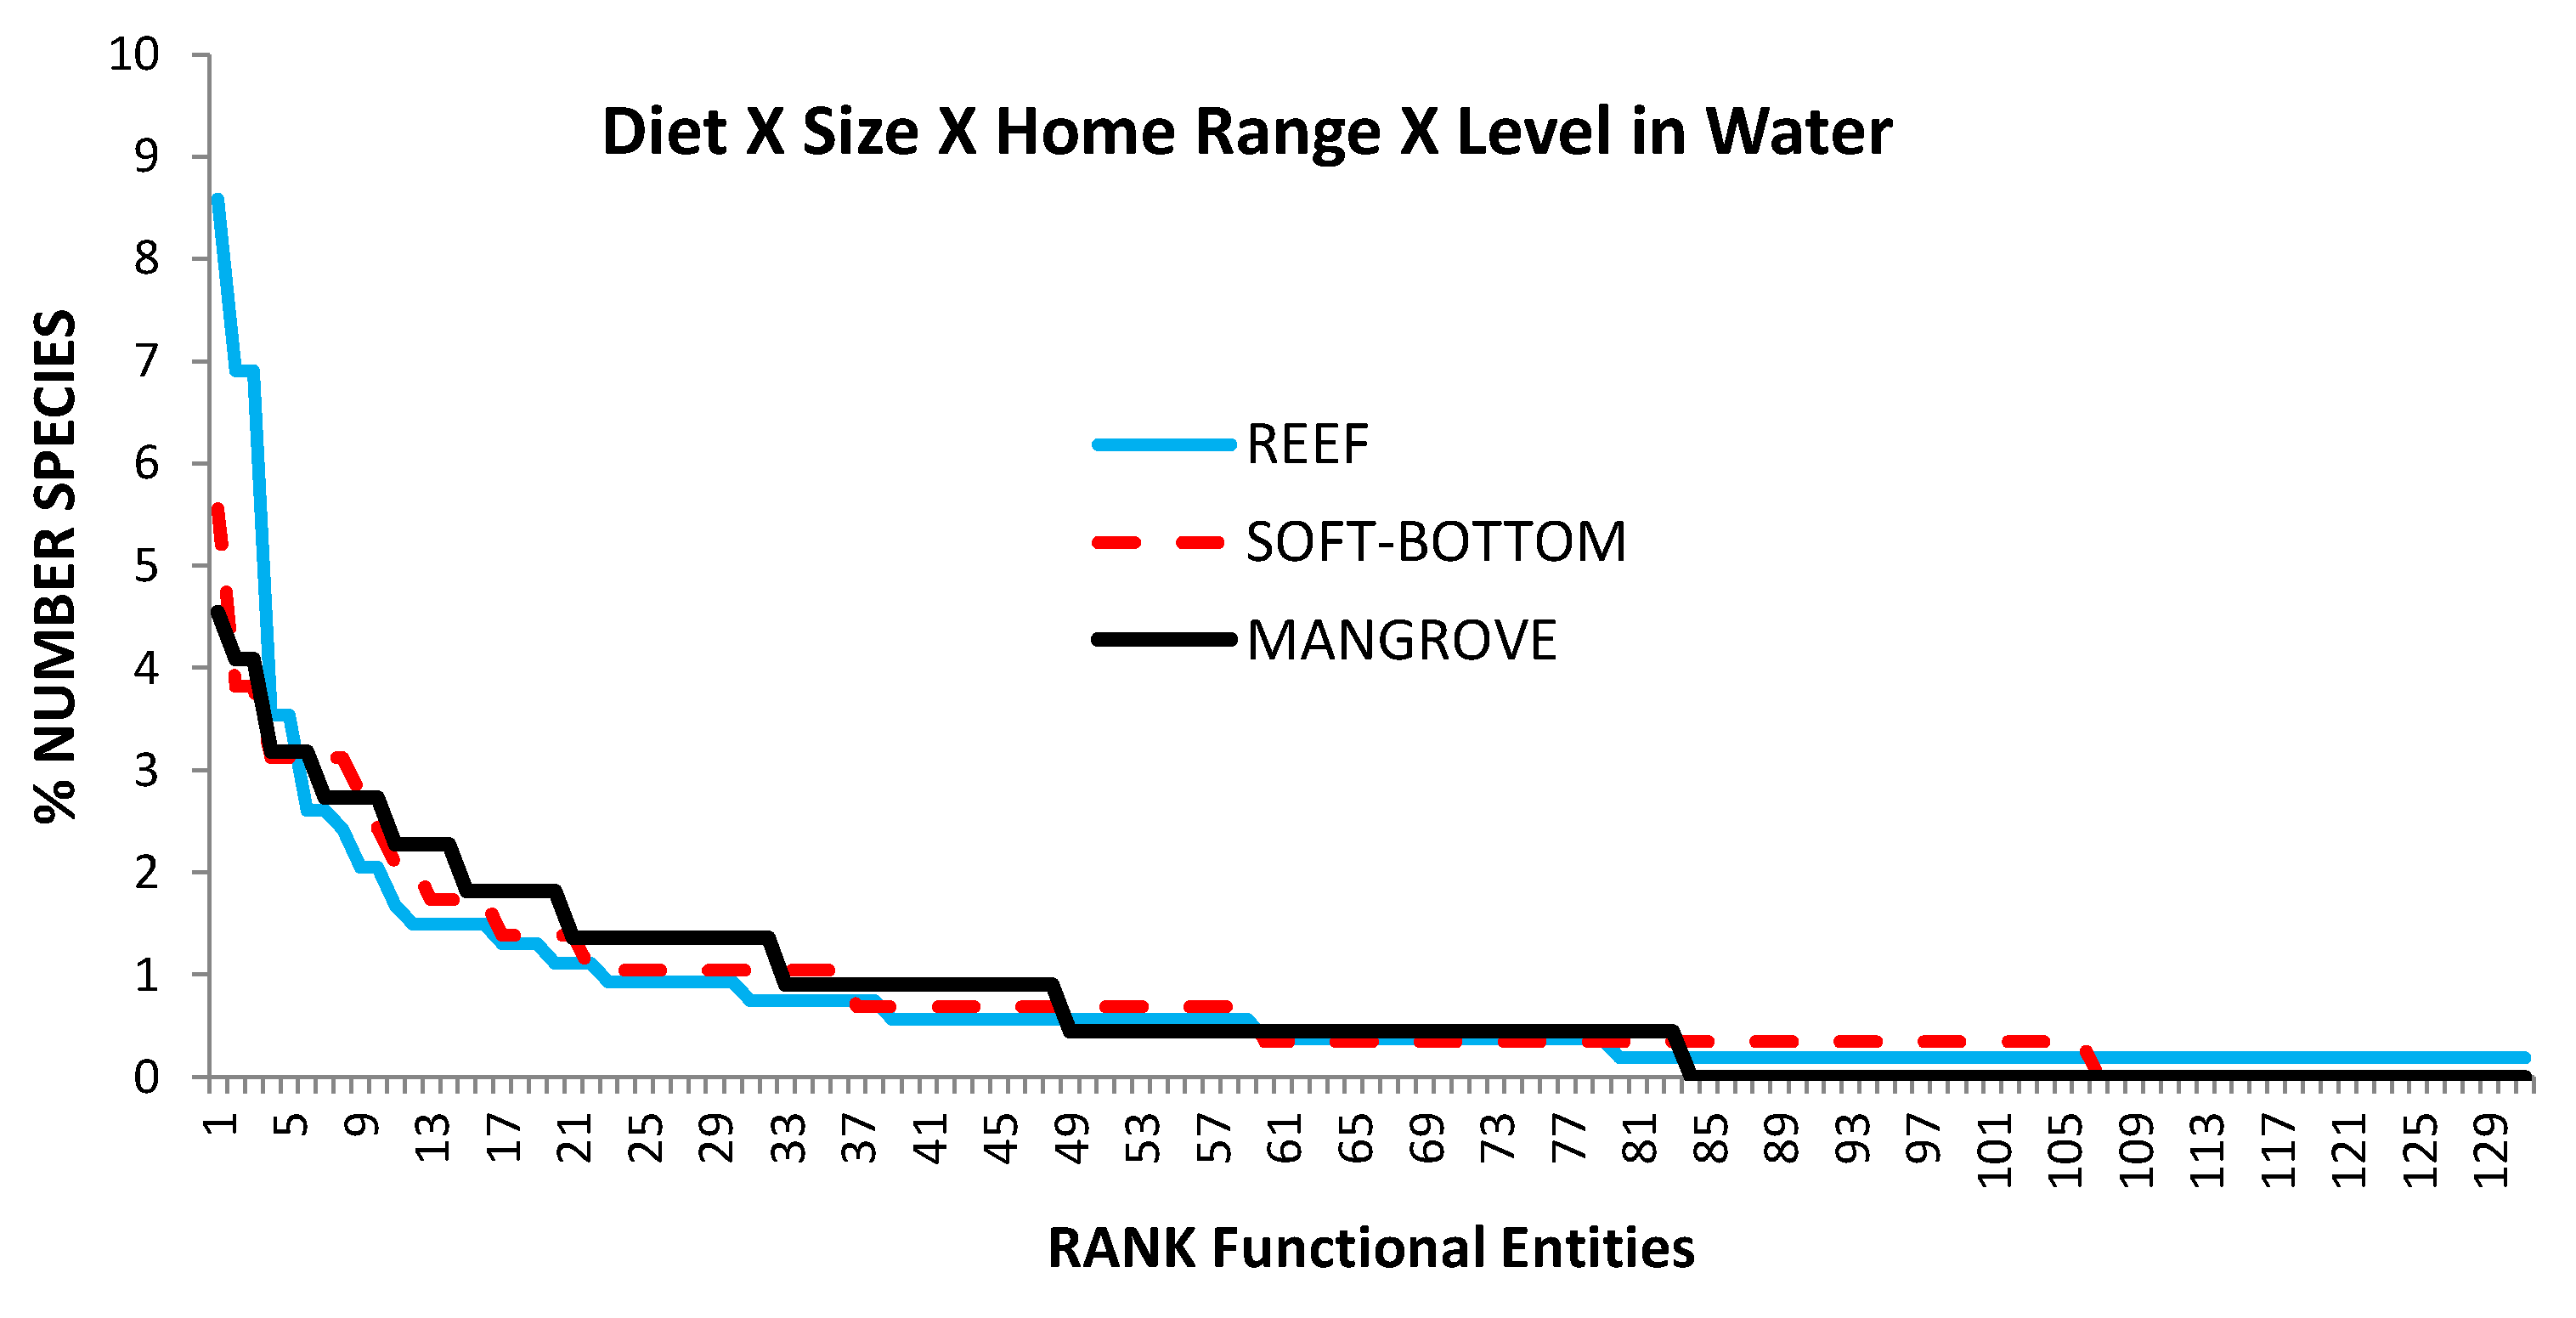
There was no significant difference in the distribution (Kolmogorov–Smirnov test) of the relative redundancy across habitats (Figure 7). However, 34% of the species on coral reefs were found in 5% of the FE, whereas this proportion dropped to 19% for soft-bottoms and 16% for mangroves.
The most redundant FEs were different from one habitat to the next and very few FEs had a similar redundancy ranking in two or more habitats (Table 1). Only the FE “C221” (small sedentary and solitary carnivores) was ranked first for mangroves and second for the two other habitats. Herbivores were never in the most redundant groups (Table 1). Sedentary fish dominated the most diverse groups (six out of the nine most diverse groups) but were found only once in the other groups (Table 1). Territorial species were found only in one diverse group (Table 1), while solitary species dominated these redundant FEs as they were found in twelve of them (and were present in the first six groups of each habitat).
The overlap in FEs showed some convergence across habitat combinations (Table 2). In particular, the redundancy of overlapping species within FEs was low for all combinations (between 1.3 and 1.6 species/FE), with only six overlapping FEs having more than three species.
4. Discussion
4.1. Extent of the Survey
Despite some limitations (see further), this experiment is still by far the largest of its kind that we are aware of, with half a million fish analyzed, representing 895 taxa. It is, however, difficult to compare with other works, as species accumulation curves or species area relationships are not available in the literature at these scales for any of the three habitats studied here. Faunce and Serafy [1] state for mangroves that “sampling efficiency evaluations are extremely rare in the literature”. Blaber [3] indicated in a review on mangroves and fish that the largest number of species recorded for mangrove fish in the Indo-Pacific was in the region of Embley (Australia) with 197 species [47], closely followed by a survey in India with 195 taxa [48], and in the Kakadu Park (North Australia) with 161 species over 93 stations [49]. In the present study, we reached 262 species on a much smaller area, which would be nearly 40% of mangrove fish species in the Indo-Pacific according to Blaber [3]. Besides using several methods, of which rotenone and fyke nets are seldom used in this environment, the present survey was conducted on a variety of mangrove types, which contributed to the high diversity observed. Similarly, Pitman et al. [50] demonstrated that heterogeneous mangroves had higher densities and diversities in Moreton Bay (Australia). In contrast to Barnes et al. [6], who used underwater visual censuses in mangroves at Orpheus island (Great Barrier Reef), or Sambrook [8], who used video cameras in Papua New Guinea, it was not possible to use visual methods nor video cameras in St. Vincent Bay’s mangroves because of the high turbidity. Surveys on soft-bottoms are usually conducted either with a shrimp trawl or a fish trawl, both being seldom combined as in the present study. The addition of visual or video surveys has been rarely performed on soft-bottoms, but see recent work with stationary video cameras by Malet et al. [51] or the review on the uses of videos to assess fish assemblages by Harvey et al. [52]. As a result, very few studies in the Indo-Pacific regions reach such species diversities. A very extensive survey of North Australia’s soft-bottoms [53] reported 237 species from 890,000 fish, which is less than the 362 species (for 402,000 fish) in the present survey conducted on a far smaller area, the trawlable area being less than 120 km2 in St. Vincent Bay versus several thousand km² in the Gulf of Carpentaria. Reef fish inventories often reach high species numbers in New Caledonia. Allen [54] found 507 species of reef associated fish on a much wider bay (Diahot Bay, 1600 km2) and predicted the presence of 759 species. Kulbicki and Williams [55] found 658 species on Ouvea Atoll, which is also a much larger area (950 km2), thus suggesting that the present study (594 species for a reef area of 93 km2 in a 350 km2 bay) is probably a very representative sample of the reef fish assemblage in St. Vincent Bay.
A major problem when analyzing assemblages from adjacent habitats is the use of different sampling methods and strategies. It was impossible to use a similar method across all three habitats because of their very nature. The combination of at least two methods for each habitat and an extensive sampling enabled satisfactory species accumulation curves, as doubling the sampling would have theoretically brought, at most, a 9% increase in diversity for mangroves. The area sampled represents less than 2% of the coastal areas of New Caledonia. The 895 species collected represent 64% of the coastal species known for the Grande Terre (approx. 1400 species) and 52% of all coastal species known for the entire archipelago (1730 species [12]). Despite this sampling effort, some questions remain for several compartments within each habitat. On reefs, pelagic species were probably underestimated, as neither rotenone nor visual censuses enable a good account of species swimming fast and high in the water column [17]. On soft-bottoms, a number of burrowing species, such as Gobiidae, Opistognathidae, Muraenidae, and Ophichthidae are probably missing. Similarly, very small species such as Tripterigiidae or Syngnathidae were probably under-sampled [17]. Only the use of rotenone or another ichthyocide would enable the catch of such species, but this was technically not possible (depth, current, low densities, high silt levels). Mangroves were the most challenging habitat to sample, as indicated by numerous studies, e.g., [15,16]. Fyke nets allowed the catch of many small transient species. The use of multiple mesh sizes on the gill nets allowed a good coverage of the bottom and water column, but some large species, such as rays and sharks, escaped these nets. Similarly, some of the large moray eels specific to mangroves were caught neither by nets nor by rotenone. Rotenone is very difficult to use in mangroves because currents wash the rotenone away and the silt tends to flocculate the rotenone. In addition, the mud on the bottom of most mangroves makes it very difficult to recover bottom dwelling species. Therefore, it is likely that families such as Gobiidae, Eleotridae, Microdesmidae, Muraenidae, and Ophichthidae were under-sampled in mangroves. A number of nocturnal species are probably not accounted for. However, trawl nets catch rather similar assemblages in New Caledonia [17], and rotenone as well as fyke nets catch of both daytime and nocturnal species.
4.2. Overlap
The fish assemblages in St. Vincent Bay are not independent from one another, with a number of species, genera, families, and life-history trait combinations (FEs) which are common to two or three of the habitats we studied. The level of overlap depends on the organization level considered, increasing as the taxonomical level increases from species to families, which is logical as the number of entities decreases. The interesting point is that FEs, despite a higher number (156) of entities than families (101), show a higher degree of overlap across habitats. Similarly, PLD distributions were not different across habitats, which is opposite to expectations [44], whereas for reefs there is a significant gradient for this parameter according to oceanic influence. This suggests a stronger functional than taxonomical convergence amongst assemblages from different habitats. This has already been described for reef fish species at a global level [56], life-history trait combinations being less variable across space than taxonomical structures [25].
There are few studies in the Indo-Pacific comparable to the present work, the most extensive being by [8] in PNG and by [57] in Zanzibar. Sambrook et al. [58] indicate that, on a global scale, nearly 20% of reef fish use different habitats, and in her study in PNG she [8] found this overlap to reach 35%. Berkström et al. [57] found in Zanzibar over 40%, which are both higher than our findings (20–24%). On the opposite end, [59] also found close to 20% of reef species using various habitats during a study in the Philippines. Due to varying methods across surveys, the families and life-history traits involved can be notably different. Thus, our study points to the importance of small species belonging to families such as Apogonidae, Gobiidae, Blenniidae, and Pomacentridae, whereas these families are less diverse in other studies comparing mangroves, soft-bottoms, and reefs in the Indo-Pacific [8,21]. The difference is likely linked to the methods used, most previous studies employing methods which are not well adapted to the detection of these small, often cryptic, species. This importance of small species is analogous to the findings of [60,61] on reefs which show that these species make a major contribution to the functioning of reef fish assemblages (see also [62]). It could therefore be that much of the functioning at a multi-habitat scale is linked to small species, which so far have been understudied.
There are several ways to estimate overlaps, either looking at all species present in the lagoon (“global overlap”) or restricting the estimate to the species common to the habitats considered (“habitat combination overlap”). The difference between methods can be significant (e.g., for soft-bottom—mangrove combination) and, unfortunately, it is often difficult to have both estimates in most publications. Our results show, however, that the overlap for the various habitat combinations varies between 4 and 15%, whereas the global overlap reaches 20–24%. In other words, our species overlap is much lower than in most of the literature (see reviews by [1,2,3,4,5,6,7,8]). This lower level of overlap could be due to the higher species coverage of our study, most other studies getting potentially an over-estimate of overlap because they looked only at a restricted number of species. This raises questions regarding our understanding of the functioning of these fish assemblages and potentially also their management. Previous studies (see review by [8]) show that a high proportion of the overlapping species may present a commercial or patrimonial importance and, therefore, this justifies a multi-habitat management. Presence/absence, as in our study, does not indicate how important a species may be in terms of abundance, biomass, production, or energy transfers. In addition, our study did not investigate other important habitats such as seagrass [63] or macroalgae beds ([64] for a review). Therefore, one should remain cautious on the true consequences of the low species overlap we found. In particular, in contrast to this low species overlap, we found a high overlap for functional entities (FEs). This opposition between species and functions converges with the findings of [56], who indicated that functional overlap was prevalent over species overlap in both the Caribbean and the Great Barrier Reef.
At one end, reefs and mangroves show low species and functional overlaps, which suggests that exchanges between these two habitats are the lowest within the lagoon, which is not the usual message. Indeed, much of the literature suggests that mangroves are important habitats for the functioning of reef fish assemblages (see review by [5], but there is seldom a comparative approach with other habitats to evaluate if this role is more or less important than other habitats (see, however, [8])). At the other end, soft-bottoms and mangroves have both higher species and functional overlaps, suggesting that there are relatively more exchanges between these habitats than between reefs and mangroves. This does not come as a surprise as these two habitats share the presence of soft sediments, a high turbidity, a low spatial variability (in comparison to reefs), and a high temporal variability. These differences should, however, not hide the high functional relative overlap for the three habitats together (21%), despite a low species overlap (6%). This suggests a commonality in the functioning of these three assemblages; in particular, they share a large proportion of solitary carnivores of small to medium size, most of them being territorial or sedentary, but few of these species are common to the three habitats. In our opinion, this calls for a co-management of the various habitats, as it is likely that the species within the overlapping FEs will either suffer or resist in a similar manner to disturbances and are probably important in the overall functioning of the lagoon system.
4.3. Exclusiveness
Opposite to overlaps, many species, genera, families, and life-history trait combinations were found exclusively in one of the three habitats, the proportion of exclusiveness being far greater on reefs, whereas mangroves and soft-bottoms displayed similar proportions of exclusive species but two to three times lower than reefs. Exclusive and overlapping species had an extremely similar life-history trait structure, with the exception of a higher proportion of carnivores for the mangroves exclusive species. This convergence suggests that most exclusive species do not fill specific niches compared to overlapping species. However, two families, Apogonidae and Blenniidae, display a very high proportion of exclusive species in all three habitats, and two other families (Gobiidae and Syngnathidae) do similarly in two habitats, which suggests that there is a high degree of adaptation in these families. Two of them (Apogonidae and Blenniidae) are characterized by much shorter PLDs than average (respectively 23.7 days, 25.9 days vs. 34.6 days for all species), narrower geographical ranges, small size, and restricted home ranges. High levels of specialization in closely related reef fish species are common (e.g., [65,66]) and this is expected in highly diverse assemblages (e.g., [67]).
4.3.1. Reefs
Reef fish assemblages differ from those from mangroves or soft-bottoms at both the taxonomical and the life-history levels. Several important families characterize reef fish assemblages and are nearly absent from mangroves or soft-bottoms, such as Holocentridae, Scaridae, Tripetrygiidae, or Chaetodontidae. This has already been described in numerous studies (see [8] for a review). Several diet classes are important in reef fish assemblages but far less developed in the other habitats, such as the various types of algae feeders and the sessile invertebrate feeders. Sessile invertebrates are rare in both mangroves and soft-bottoms, however, in St. Vincent Bay, large sponges (genus Ircinia) shelter specific fish species [17]. Algae may be at times abundant on soft-bottoms (seagrass beds and macroalgae reefs—see [64] for a review) and they may gather large schools of herbivores, in particular Siganidae, but these habitats usually lack the small herbivores (e.g., Pomacentridae, Pomacanthidae, some Blenniidae) as found on a larger scale in New Caledonia by Wantiez [68]. Exclusive reef species can also be characterized by the high proportion of small (<8 cm) species and the dominance of species with narrow home ranges, either solitary or paired, whereas on soft-bottoms and mangroves there is a higher proportion of very large species (>80 cm), most of them characterized by wide home ranges and medium to large schools. These life-history traits can be related to the environment of these habitats, reefs offering a much higher habitat diversity, more shelters, a higher diversity of prey, and, probably, a lower temporal variability in their resource levels. Small reef fish species usually have a high metabolism (see [61]). This means a need for a high level of food availability and, probably, wide diet spectra, which can only be offered by reefs. In contrast, the presence of large mobile carnivores and piscivores amongst the soft-bottoms and mangrove habitats is indicative of the necessity to roam over large territories in order to access sufficient food levels within these two habitats.
4.3.2. Mangroves
There are few specific families or life-history traits in these fish assemblages. This habitat is characterized by large schooling detritus feeders, belonging to several families (Scatophagidae, Ephipididae, Mugilidae, Platacidae). As mentioned in the previous paragraph, large carnivores and piscivores display a larger relative diversity in mangroves than on reefs. Small species feeding on small invertebrates are relatively more diverse than in the other habitats. All these specific species can be related to the type of resources available in mangroves. Detritivores feed upon a thin layer of micro-organisms on top of the sediment. We do not know why this film is targeted in mangroves, as it exists elsewhere in the lagoon [69]; perhaps the mangrove forest harbor calmer waters which allow for a better development of these organisms. Large piscivores are found in the mangrove channels where they target small schooling plankton feeders such as Ambassidae, Clupeidae, or Leiognathidae, which take refuge in the mangrove root system at high tide but are flushed out at high tide.
4.3.3. Soft-Bottoms
Only Carangidae and Clupeidae have a high proportion of species found exclusively over soft-bottoms. Leiognathidae are also characteristic of sheltered soft-bottoms. These three families consist of pelagic species, feeding on nekton or plankton and forming medium to very large schools [70]. They make up a high proportion of soft-bottom fish assemblages, probably because of the lack of shelter and the importance of primary production in St. Vincent Bay [71]. Tetraodontidae and Ostraciidae constitute another unexpected group. They can be relatively abundant [17], probably taking advantage of their physical (armored skin, spines and spikes, ability to increase body volume by swallowing water) as well as chemical (poisonous skin and flesh) defenses to compensate for the lack of refuges and their slow swimming speed. These fish are also able to feed upon sessile invertebrates such as sponges, tunicates, or cnidarians [31], which are avoided by most other invertebrate feeders.
5. Conclusions
Despite the fact that the present work is based upon the presence/absence of information, thanks to the number of species involved and the use of several sampling methods for each habitat, it provides useful information on some of the characteristics of the overlaps and differences between three related lagoon fish assemblages. Most of the species studied in this work have a very wide geographical range, and therefore it is likely that a number of these findings are applicable to many situations in the Indo-Pacific. However, one should also keep in mind that the environmental characteristics of St. Vincent Bay may generate some specific situations. In particular, most of the lagoon is shallow (27 m maximum), very turbid in most parts, and has a large range of habitats. This work shows that there is more functional group overlap than species overlap between mangroves, soft-bottoms, and reefs. This suggests different histories in the building of functions within each habitat. This work is an initial step in analyzing the global functioning of a lagoon system. New methods such as eDNA or high-resolution video may contribute greatly to a better knowledge of fish diversity in such seascapes. Information on the density, biomass, and size frequencies has to be analyzed to better understand the specificities of the overlapping or exclusive species. Moreover, investigation on the movements of major species (microchemistry of otoliths, tagging) and their use of resources (C and N isotope analysis, diet analysis) would be very useful in understanding the global functioning of this system.
Supplementary Materials
The following supporting information can be downloaded at: https://www.mdpi.com/article/10.3390/d14050310/s1, Figure S1: A—comparison of the trophic level spectra between exclusive and all species according to habitat. B—comparison of the trophic level between overlapping species and all species. Figure S2: distribution of Pelagic Larval Duration across habitats. Table S1: geomorphology of St Vincent Bay [26,28,30]. Table S2: sampling effort. Table S3: major references rotenone for reef fish sampling. Table S4. Number and proportion (%) of taxa (i.e., including sp. and spp.), genera, families, and functional groups per habitat. Table S5: the 20 most speciose families per habitat. Table S6. frequency (% species) within diet categories. Table S7: frequency (% species) within size, home-range and schooling categories (per habitat). Data: list of species per habitat, with life-history traits per species, PLD and Geographical range index. All the raw data (species list per habitat, life-history traits, PLD, and geographical range index) are available as Supplementary Materials Table “Data”.
Author Contributions
M.K. and L.W.: conception, data acquisition, data analysis, and writing. P.T.: conception and data acquisition. G.M.T.: data acquisition. All available authors have read and agreed to the published version of the manuscript. All authors have read and agreed to the published version of the manuscript.
Funding
This research received no external funding.
Institutional Review Board Statement
Not applicable.
Data Availability Statement
Initial data on mangroves can be found in P.Thollot’s PhD thesis [24], for soft bottoms in L.Wantiez’s PhD thesis [26] and for reef data in M.Kulbicki PhD thesis [27]. Detailed data are also directly available from the first author on request or can be found in the table “Data” in the Supplementary Materials.
Acknowledgments
The authors wish to thank J. Randall for his assistance in the 1989 cruise.
Conflicts of Interest
The authors had no conflict of interest.
References
- Faunce, C.; Serafy, J. Mangroves as fish habitat: 50 years of field studies. Mar. Ecol. Prog. Ser. 2006, 318, 1–18. [Google Scholar] [CrossRef] [Green Version]
- Adams, A.J.; Dahlgren, C.P.; Kellison, G.T.; Kendall, M.S.; Layman, C.A.; Ley, J.A.; Nagelkerken, I.; Serafy, J.E. Nursery function of tropical back-reef systems. Mar. Ecol. Prog. Ser. 2006, 318, 287–301. [Google Scholar] [CrossRef]
- Blaber, S.J.M. Mangroves and fishes: Issues of diversity, dependence, and dogma. Bull. Mar. Sci. 2007, 80, 457–472. [Google Scholar]
- Nagelkerken, I. Are non-estuarine mangroves connected to coral reefs through fish migration? Bull. Mar. Sci. 2007, 80, 595–607. [Google Scholar]
- Nagelkerken, I.; Blaber, S.J.M.; Bouillon, S.; Green, P.; Haywood, M.; Kirton, L.G.; Meynecke, J.-O.; Pawlik, J.; Penrose, H.M.; Sasekumar, A.; et al. The habitat function of mangroves for terrestrial and marine fauna: A review. Aquat. Bot. 2008, 89, 155–185. [Google Scholar] [CrossRef] [Green Version]
- Barnes, L.; Bellwood, D.R.; Sheaves, M.; Tanner, J.K. The use of clear-water non-estuarine mangroves by reef fishes on the Great Barrier Reef. Mar. Biol. 2012, 159, 211–220. [Google Scholar] [CrossRef]
- Du, J.; Xie, M.; Wang, Y.; Chen, Z.; Liu, W.; Liao, J.; Chen, B. Connectivity of fish assemblages along the mangrove-seagrass-coral reef continuum in Wenchang, China. Acta Oceanol. Sin. 2020, 39, 43–52. [Google Scholar] [CrossRef]
- Sambrook, K. Beyond the Reef: The Influence of Seascape Structure on the Composition and Function of Tropical Fish Communities. Ph.D. Thesis, James Cook University, Townsville, Australia, 2021; 230p. [Google Scholar]
- Hemingson, C.R.; Bellwood, D.R. Greater multihabitat use in Caribbean fishes when compared to their Great Barrier Reef counterparts. Estuar. Coast. Shelf Sci. 2020, 239, 106748. [Google Scholar] [CrossRef]
- Igulu, M.M.; Nagelkerken, I.; Dorenbosch, M.; Grol, M.G.G.; Harborne, A.; Kimirei, I.; Mumby, P.; Olds, A.; Mgaya, Y. Mangrove Habitat Use by Juvenile Reef Fish: Meta-Analysis Reveals that Tidal Regime Matters More than Biogeographic Region. PLoS ONE 2014, 9, e114715. [Google Scholar] [CrossRef] [Green Version]
- Kulbicki, M.; Parravicini, V.; Bellwood, D.R.; Arias-González, J.E.; Chabanet, P.; Floeter, S.; Friedlander, A.; McPherson, J.; Myers, R.E.; Vigliola, L.; et al. Global Biogeography of Reef Fishes: A Hierarchical Quantitative Delineation of Regions. PLoS ONE 2013, 8, e81847. [Google Scholar] [CrossRef]
- Fricke, R.; Kulbicki, M.; Wantiez, L. Checklist of the fishes of New Caledonia. Stuttg. Beitr. Naturkd. A 2011, 4, 341–463. [Google Scholar]
- Kulbicki, M. Biogeography of reef fishes of the French territories in the South Pacific. Cybium 2007, 31, 275–288. [Google Scholar]
- Payri, C.; de Forges, R. Compendium of Marine Species from New Caledonia; The Research Institute for Development: Marseille, France, 2006. [Google Scholar]
- Thollot, P. Les Poissons de Mangrove du Lagon Sud-Ouest de Nouvelle-Calédonie. Ecologie des Peuplements. Relations avec les Communautés Ichtyologiques Côtières. Ph.D. Thesis, University Aix-Marseille II, Marseille, France, 1992; 406p. [Google Scholar]
- Thollot, P. Importance of mangroves for Pacific reef fish species, myth or reality? In Proceedings of the Seventh International Coral Reef Symposium, Guam, Micronesia, 22–27 June 1992; University of Guam Press: Mangilao, GU, USA, 1992; Volume 2, pp. 934–941. [Google Scholar]
- Wantiez, L. Les Poissons des Fonds Meubles du Lagon Nord et de la Baie de St Vincent de Nouvelle Calédonie. Description des Peuplements. Structure et Fonctionnement des Communautés. Ph.D. Thesis, Université Aix-Marseille, Marseille, France, 1992; 444p. [Google Scholar]
- Kulbicki, M. Ecologie des Poissons Lagonaires de Nouvelle Calédonie. Ph.D. Thesis, Université de Perpignan, Perpignan, France, 2006; 194p. [Google Scholar]
- Laroche, J.; Baran, E.; Rasoanandrasana, N.B. Temporal patterns in a fish assemblage of a semiarid mangrove zone in Mada-gascar. J. Fish Biol. 1997, 51, 3–20. [Google Scholar] [CrossRef] [PubMed]
- Acosta, A. Use of Multi-mesh Gillnets and Trammel Nets to Estimate Fish Species Composition in Coral Reef and Mangroves in the Southwest Coast of Puerto Rico. Caribb. J. Sci. 1997, 33, 45–57. [Google Scholar]
- Lugendo, B.R.; Nagelkerken, I.; Kruitwagen, G.; van der Velde, G.; Mgaya, Y.D. Relative importance of mangroves as feeding habitats for fishes: A comparison between mangrove habitats with different settings. Bull. Mar. Sci. 2007, 80, 497–512. [Google Scholar]
- Bellwood, D.R.; Streit, R.P.; Brandl, S.J.; Tebbett, S.B. The meaning of the term ‘function’ in ecology: A coral reef perspective. Funct. Ecol. 2019, 33, 948–961. [Google Scholar] [CrossRef] [Green Version]
- Guillemot, N.; Kulbicki, M.; Chabanet, P.; Vigliola, L. Functional Redundancy Patterns Reveal Non-Random Assembly Rules in a Species-Rich Marine Assemblage. PLoS ONE 2011, 6, e26735. [Google Scholar] [CrossRef] [Green Version]
- Mouillot, D.; Villéger, S.; Parravicini, V.; Kulbicki, M.; Arias-González, J.E.; Bender, M.; Chabanet, P.; Floeter, S.R.; Fried-lander, A.; Vigliola, L.; et al. Functional over-redundancy and high functional vulnerability in global fish faunas on tropical reefs. Proc. Natl. Acad. Sci. USA 2014, 111, 13757–13762. [Google Scholar] [CrossRef] [Green Version]
- Tillman, D. The ecological consequences of changes in biodiversity: A search for general principles. Ecology 1999, 80, 1455–1474. [Google Scholar] [CrossRef]
- McCann, K.S. The stability-diversity debate. Nature 2000, 405, 228–233. [Google Scholar] [CrossRef]
- Parravicini, V.; Villéger, S.; McClanahan, T.R.; Arias-González, J.E.; Bellwood, D.R.; Belmaker, J.; Chabanet, P.; Floeter, S.R.; Friedlander, A.M.; Guilhaumon, F.; et al. The vulnerability framework indicates alternative global protection priorities for coral reef fishes. Ecol. Lett. 2014, 17, 1101–1110. [Google Scholar] [CrossRef] [PubMed]
- Andréfouët, S.; Torres-Pulliza, D. Atlas des Récifs Coralliens de Nouvelle-Calédonie; IFRECOR: Noumea, Nouvelle-Calédonie, 2004; 26p. [Google Scholar]
- Dugas, F.; Debenay, J.P. Carte Sédimentologique et Carte Annexe du Lagon de Nouvelle Calédonie au 1/50000: Feuille La Tontouta; ORSTOM: Paris, France, 1980; 52p. [Google Scholar]
- Virly, S. Atlas des Mangroves de Nouvelle Calédonie; ZONECO: Noumea, New Caledonia, 2008; 208p. [Google Scholar]
- Kulbicki, M.; Bozec, Y.M.; Labrosse, P.; Letourneur, Y.; Mou-Tham, G.; Wantiez, L. Diet composition of carnivorous fishes from coral reef lagoons of New Caledonia. Aquat. Living Resour. 2005, 18, 231–250. [Google Scholar] [CrossRef] [Green Version]
- Rivaton, J.; Bourret, P. Otoliths of the Indo-Pacific Fishes; IRD Technical Reports, Special Issue; Research Institute for Development: Noumea, New Caledonia, 1999; 379p. [Google Scholar]
- Labrosse, P.; Kulbicki, M.; Ferraris, J. Underwater Visual Fish Census Surveys. Proper Use and Implementation; Reef Resource As-sessment Tools: Noumea, New Caledonia, 2002; 54p. [Google Scholar]
- Robertson, D.; Smith-Vaniz, W. Rotenone: An essential but demonized tool for assessing marine fish diversity. Bioscience 2008, 58, 165–170. [Google Scholar] [CrossRef] [Green Version]
- Mora, C.; Tittensor, D.; Myers, A. The completeness of taxonomic inventories for describing the global diversity and distri-bution of marine fishes. Proc. R. Soc. B Biol. Sci. 2008, 275, 149–155. [Google Scholar] [CrossRef] [PubMed] [Green Version]
- Mallet, D.; Pelletier, D. Underwater video techniques for observing coastal marine biodiversity: A review of sixty years of publications (1952–2012). Fish. Res. 2014, 154, 44–62. [Google Scholar] [CrossRef]
- Marques, T.A.; Thomas, L.; Martin, S.W.; Mellinger, D.K.; Ward, J.A.; Moretti, D.J.; Harris, D.; Tyack, P.L. Estimating animal population density using passive acoustics. Biol. Rev. 2013, 88, 287–309. [Google Scholar] [CrossRef] [PubMed] [Green Version]
- Stat, M.; John, J.; DiBattista, J.D.; Newman, S.; Bunce, M.; Harvey, E.S. Combined use of eDNA metabarcoding and video surveillance for the assessment of fish biodiversity. Conserv. Biol. 2019, 33, 196–205. [Google Scholar] [CrossRef] [Green Version]
- Boussarie, G.; Bakker, J.; Wangensteen, O.S.; Mariani, S.; Bonnin, L.; Juhel, J.-B.; Kiszka, J.J.; Kulbicki, M.; Manel, S.; Robbins, W.D.; et al. Environmental DNA illuminates the dark diversity of sharks. Sci. Adv. 2018, 4, eaap9661. [Google Scholar] [CrossRef] [Green Version]
- Nédélec, C.; Prado, J. Definition and Classification of Fishing Gear Categories; FAO Fisheries Technical Paper 222, Revision 1; Food and Agriculture Organization: Rome, Italy, 1990; 92p. [Google Scholar]
- Kulbicki, M.; MouTham, G.; Vigliola, L.; Wantiez, L.; Manaldo, E.; Labrosse, P.; Letourneur, Y. Major Coral Reef Fish Species of the South Pacific with Basic Information on Their Biology and Ecology; CRISP-IRD: Noumea, New Caledonia, 2011; 107p. [Google Scholar]
- Quimbayo, J.P.; Mendes, T.C.; Barneche, D.R.; Dias, M.S.; Grutter, A.S.; Furtado, M.; Leprieur, F.; Pellissier, L.; Mazzei, R.; Narvaez, P.; et al. Patterns of taxonomic and functional diversity in the global cleaner reef fish fauna. J. Biogeogr. 2021, 48, 2469–2485. [Google Scholar] [CrossRef]
- Luiz, O.J.; Allena, A.P.; Robertson, D.R.; Floeter, S.R.; Kulbicki, M.; Vigliola, L.; Becheler, R.; Madin, J.S. Adult and larval traits as determinants of geographic range size among tropical reef fishes. Proc. Natl. Acad. Sci. USA 2013, 110, 16498–16502. [Google Scholar] [CrossRef] [Green Version]
- Kulbicki, M. Increase in pelagic larval duration and geographical range in reef fish along an oceanic gradient. Vie Milieu 2015, 65, 1–9. [Google Scholar]
- Thomson, G.G.; Whithers, P.C.; Pianka, E.R.; Thompson, S.A. Assessing biodiversity with species accumulation curves; inven-tories of small reptiles by pit-trapping in Western Australia. Austral Ecol. 2003, 28, 361–383. [Google Scholar] [CrossRef]
- Soberon, M.J.; Llorente, B.J. The Use of Species Accumulation Functions for the Prediction of Species Richness. Conserv. Biol. 1993, 7, 480–488. [Google Scholar] [CrossRef] [Green Version]
- Blaber, S.; Brewer, D.; Salini, J. Species composition and biomasses of fishes in different habitats of a tropical Northern Australian estuary: Their occurrence in the adjoining sea and estuarine dependence. Estuar. Coast. Shelf Sci. 1989, 29, 509–531. [Google Scholar] [CrossRef]
- Krishnamurthy, K.; Jeyaseelan, M.J. Early Life History of Fishes from Pichavaram Mangrove Ecosystem of India; Rapports et Procés Verbaux des Réunions; Conseil Permanent International pour l’Exploitation de la Mer: Copenhagen, Denmark, 1981; Volume 178, pp. 416–423. [Google Scholar]
- Larsen, H. Report to Parks Australia North, on the Estuarine Fish Inventory of Kakdy National Park, Northern Territory; Research Report No. 5; Museums and Art Galleries of the Northern Territory: Darwin, Australia, 1999; 52p. [Google Scholar]
- Pittman, S.; McAlpine, C.; Pittman, K. Linking fish and prawns to their environment: A hierarchical landscape approach. Mar. Ecol. Prog. Ser. 2004, 283, 233–254. [Google Scholar] [CrossRef]
- Mallet, D.; Olivry, M.; Ighiouer, S.; Kulbicki, M.; Wantiez, L. Nondestructive Monitoring of Soft Bottom Fish and Habitats Using a Standardized, Remote and Unbaited 360° Video Sampling Method. Fishes 2021, 6, 50. [Google Scholar] [CrossRef]
- Harvey, E.S.; McLean, D.L.; Goetze, J.S.; Saunders, B.J.; Langlois, T.J.; Monk, J.; Barrett, N.; Wilson, S.; Holmes, T.; Ierodiaconu, D. The BRUVs workshop—An Australia-wide synthesis of baited remote underwater video data to answer broad-scale ecological questions about fish, sharks and rays. Mar. Policy 2021, 127, 104430. [Google Scholar] [CrossRef]
- Blaber, S.J.M.; Brewer, D.T.; Salini, J.P.; Kerr, J. Biomasses, catch rates and abundances of demersal fishes, particularly predators of prawns, in a tropical bay in the Gulf of Carpentaria, Australia. Mar. Biol. 1990, 107, 397–408. [Google Scholar] [CrossRef]
- Allen, G. Les Poissons Coralliens. Evaluation Rapide du Contexte Biologique, Ecologique et Humain de la Zone Marine du Dia-Hot-Balabio (Province Nord de Nouvelle Calédonie); The World Wide Fund for Nature: Paris, France, 2006; pp. 47–59. [Google Scholar]
- Kulbicki, M.; Williams, J.T. Preliminary checklist of the reef fishes from the Ouvea Atoll, New Caledonia. Atoll Res. Bull. 1997, 444, 26. [Google Scholar] [CrossRef]
- Hemingson, C.R.; Bellwood, D.R. Biogeographic patterns in major marine realms: Function not taxonomy unites fish assem-blages in reef, seagrass and mangrove systems. Ecography 2018, 41, 174–182. [Google Scholar] [CrossRef] [Green Version]
- Berkström, C.; Gullström, M.; Lindborg, R.; Mwandya, A.W.; Yahya, S.A.S.; Kautsky, N.; Nyström, M. Exploring ‘knowns’ and ‘unknowns’ in tropical seascape connectivity with insights from East African coral reefs. Estuar. Coast. Shelf Sci. 2012, 107, 1–21. [Google Scholar] [CrossRef]
- Sambrook, K.; Bonin, M.C.; Bradley, M.; Cumming, G.; Duce, S.; Andréfouët, S.; Hoey, A.S. Broadening our horizons: Sea-scape use by coral reef-associated fishes in Kavieng, Papua New Guinea, is common and diverse. Coral Reefs 2020, 39, 1187–1197. [Google Scholar] [CrossRef]
- Honda, K.; Nakamura, Y.; Nakaoka, M.; Uy, W.H.; Fortes, M.D. Habitat Use by Fishes in Coral Reefs, Seagrass Beds and Mangrove Habitats in the Philippines. PLoS ONE 2013, 8, e65735. [Google Scholar] [CrossRef] [PubMed] [Green Version]
- Brandl, S.J.; Goatley, C.H.R.; Bellwood, D.R.; Tornabene, L. The hidden half: Ecology and evolution of cryptobenthic fishes on coral reefs. Biol. Rev. 2018, 93, 1846–1873. [Google Scholar] [CrossRef] [PubMed]
- Brandl, S.J.; Tornabene, L.; Goatley, C.H.R.; Casey, J.M.; Morais, R.A.; Côté, I.M.; Baldwin, C.C.; Parravicini, V.; Schiettekatte, N.M.D.; Bellwood, D.R. Demographic dynamics of the smallest marine vertebrates fuel coral reef ecosystem functioning. Science 2019, 364, 1189–1192. [Google Scholar] [CrossRef] [PubMed]
- Depczynski, M.; Fulton, C.J.; Marnane, M.J.; Bellwood, D.R. Life history patterns shape energy allocation among fishes on coral reefs. Oecologia 2007, 153, 111–120. [Google Scholar] [CrossRef]
- Unsworth, R.K.; De Leon, P.S.; Garrard, S.L.; Smith, D.J.; Bell, J.J. Habitat Usage of the Thumbprint Emporer Lethrinus harak (Forsskal, 1775) in an Indo-Pacific Coastal Seascape. Open Mar. Biol. J. 2008, 3, 16–20. [Google Scholar] [CrossRef] [Green Version]
- Fulton, C.J.; Abesamis, R.A.; Berkström, C.; Depczynski, M.; Graham, N.A.J.; Holmes, T.H.; Kulbicki, M.; Noble, M.M.; Radford, B.T.; Tano, S.; et al. Form and function of tropical macroalgal reefs in the Anthropocene. Funct. Ecol. 2019, 33, 989–999. [Google Scholar] [CrossRef]
- Munday, P.L. Habitat loss, resource specialization, and extinction on coral reefs. Glob. Chang. Biol. 2004, 10, 1642–1647. [Google Scholar] [CrossRef]
- Herler, J.; Munday, P.L.; Hernaman, V. Gobies on coral reefs. In The Biology of Gobies; Science Publishers: Jersey City, NJ, USA, 2011; pp. 493–529. [Google Scholar]
- Komyakova, V.; Munday, P.L.; Jones, G.P. Relative importance of coral cover, habitat complexity and diversity in determining the structure of reef fish comunities. PLoS ONE 2013, 8, e83178. [Google Scholar]
- Wantiez, L. Trophic networks of the soft bottom fish community in the lagoon of New Caledonia. C. R. Acad. Sci. Ser. 3 Sci. Vie 1994, 317, 847–856. [Google Scholar]
- Clavier, J.; Chardy, P.; Chevillon, C. Sedimentation of particulate matter in the south-west lagoon of New Caledonia: Spatial and temporal patterns. Estuar. Coast. Shelf Sci. 1995, 40, 281–294. [Google Scholar] [CrossRef]
- Conand, F. Biologie et Ecologie des Poissons Pélagiques du Lagon de Nouvelle-Calédonie Utilisables Comme Appât Thonier. Ph.D. Thesis, Université de Bretagne Occidentale, Brest, France, 1988; 239p. [Google Scholar]
- Champalbert, G. Plankton inhabiting the surface layer of the southern and southwestern lagoon of New Caledonia. Mar. Biol. 1993, 115, 223–228. [Google Scholar] [CrossRef]
Figure 1.
Map of the sampling area. Reef: zones with 100% hard bottom, mainly constructed coral reef. Mangroves comprise several types of mangroves (see Supplementary Materials Table S1). Soft-bottoms include seagrass and macroalgal beds.
Figure 1.
Map of the sampling area. Reef: zones with 100% hard bottom, mainly constructed coral reef. Mangroves comprise several types of mangroves (see Supplementary Materials Table S1). Soft-bottoms include seagrass and macroalgal beds.

Figure 2.
Modelled cumulated number of species with sampling effort (in the equations X = number of stations) for reefs (174 stations), soft-bottoms (342 stations), and mangroves (249 stations). 100% (A–C) corresponds to the total sampling effort of the study. 200% (D–F) indicates a doubling of the sampling effort. All 3 relationships have r² = 0.98.
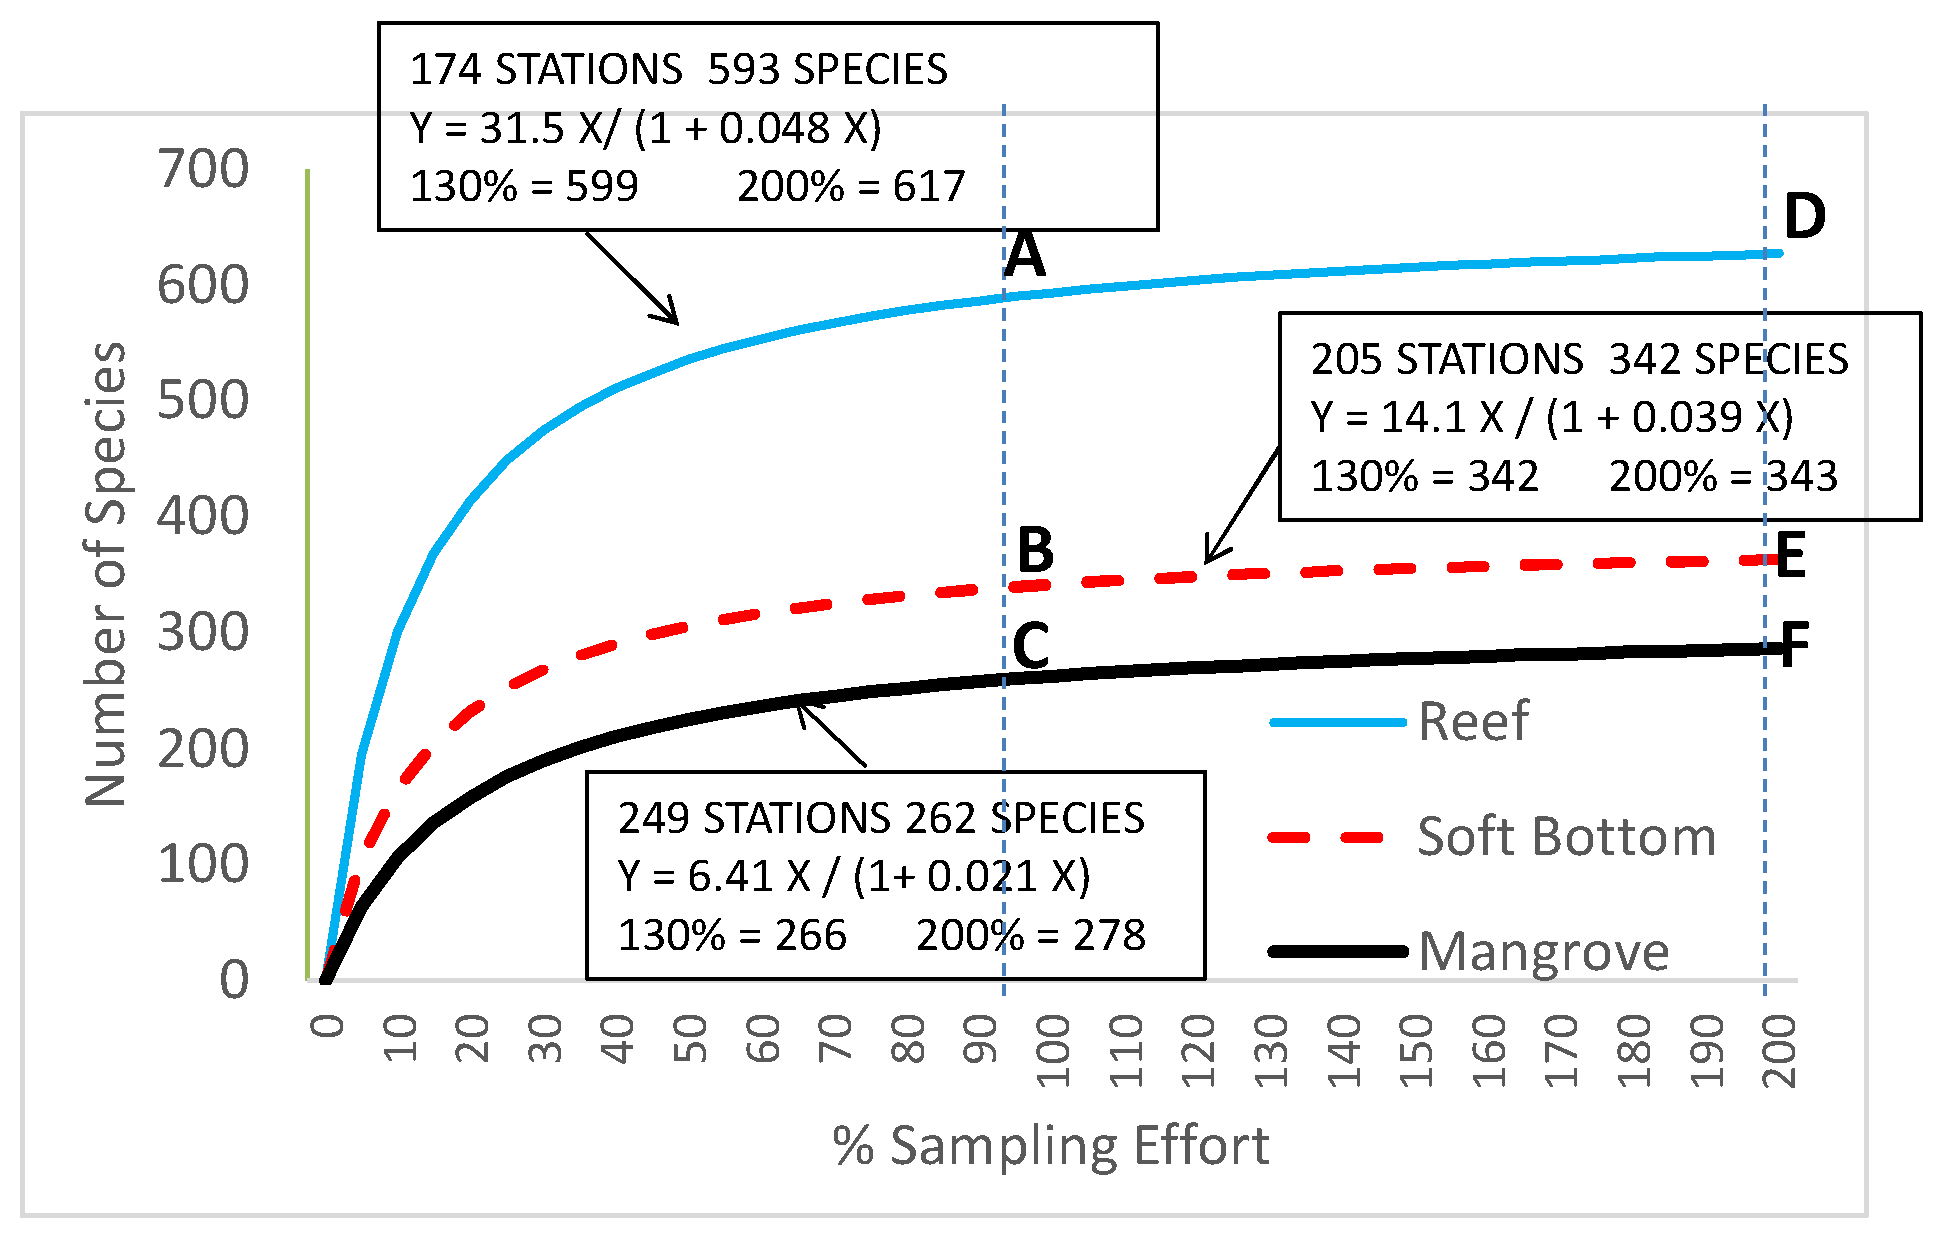
Figure 3.
Venn diagrams indicating the overlap between the three assemblages (reefs, soft-bottoms, and mangroves) at four organization levels (species, genera, families, and functional entities). Proportions, totals, and statistical tests are given in Supplementary Materials Table S4. Colored underlined numbers correspond to exclusivity.
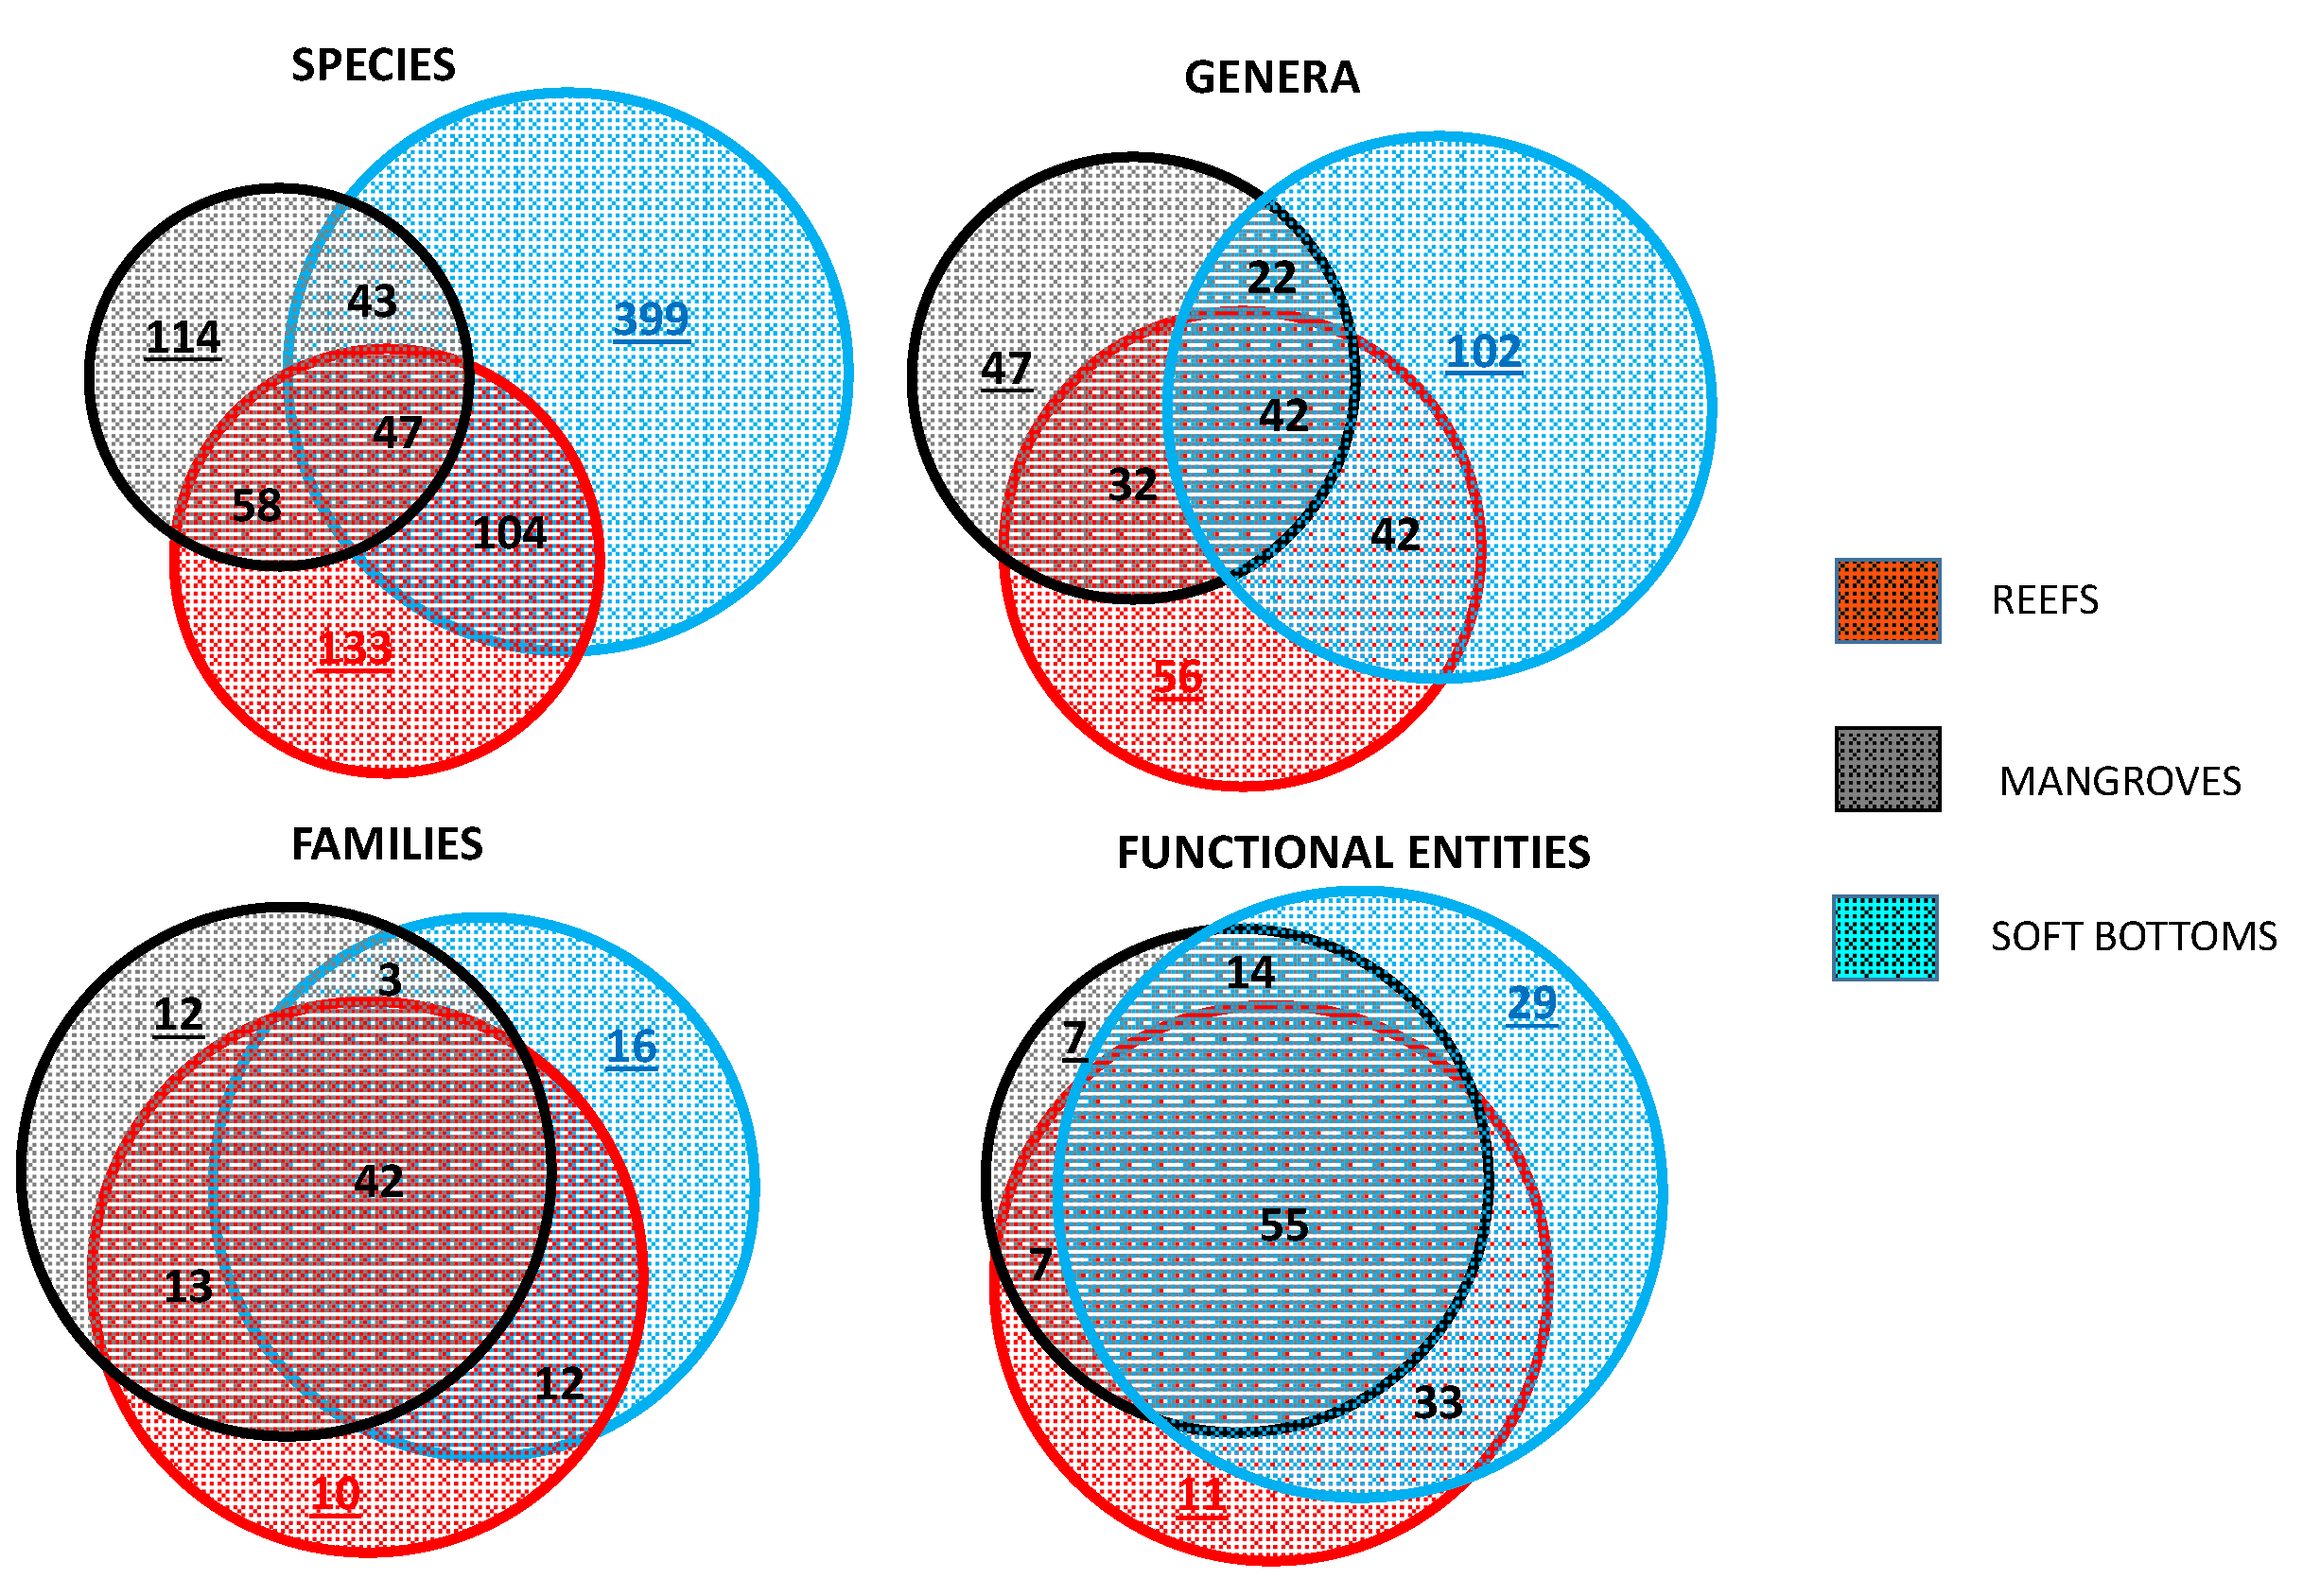
Figure 4.
Cumulated frequencies of species per families according to habitat. Families were ranked according to their number of species, from the most to the least speciose. SB: soft-bottoms.
Figure 4.
Cumulated frequencies of species per families according to habitat. Families were ranked according to their number of species, from the most to the least speciose. SB: soft-bottoms.
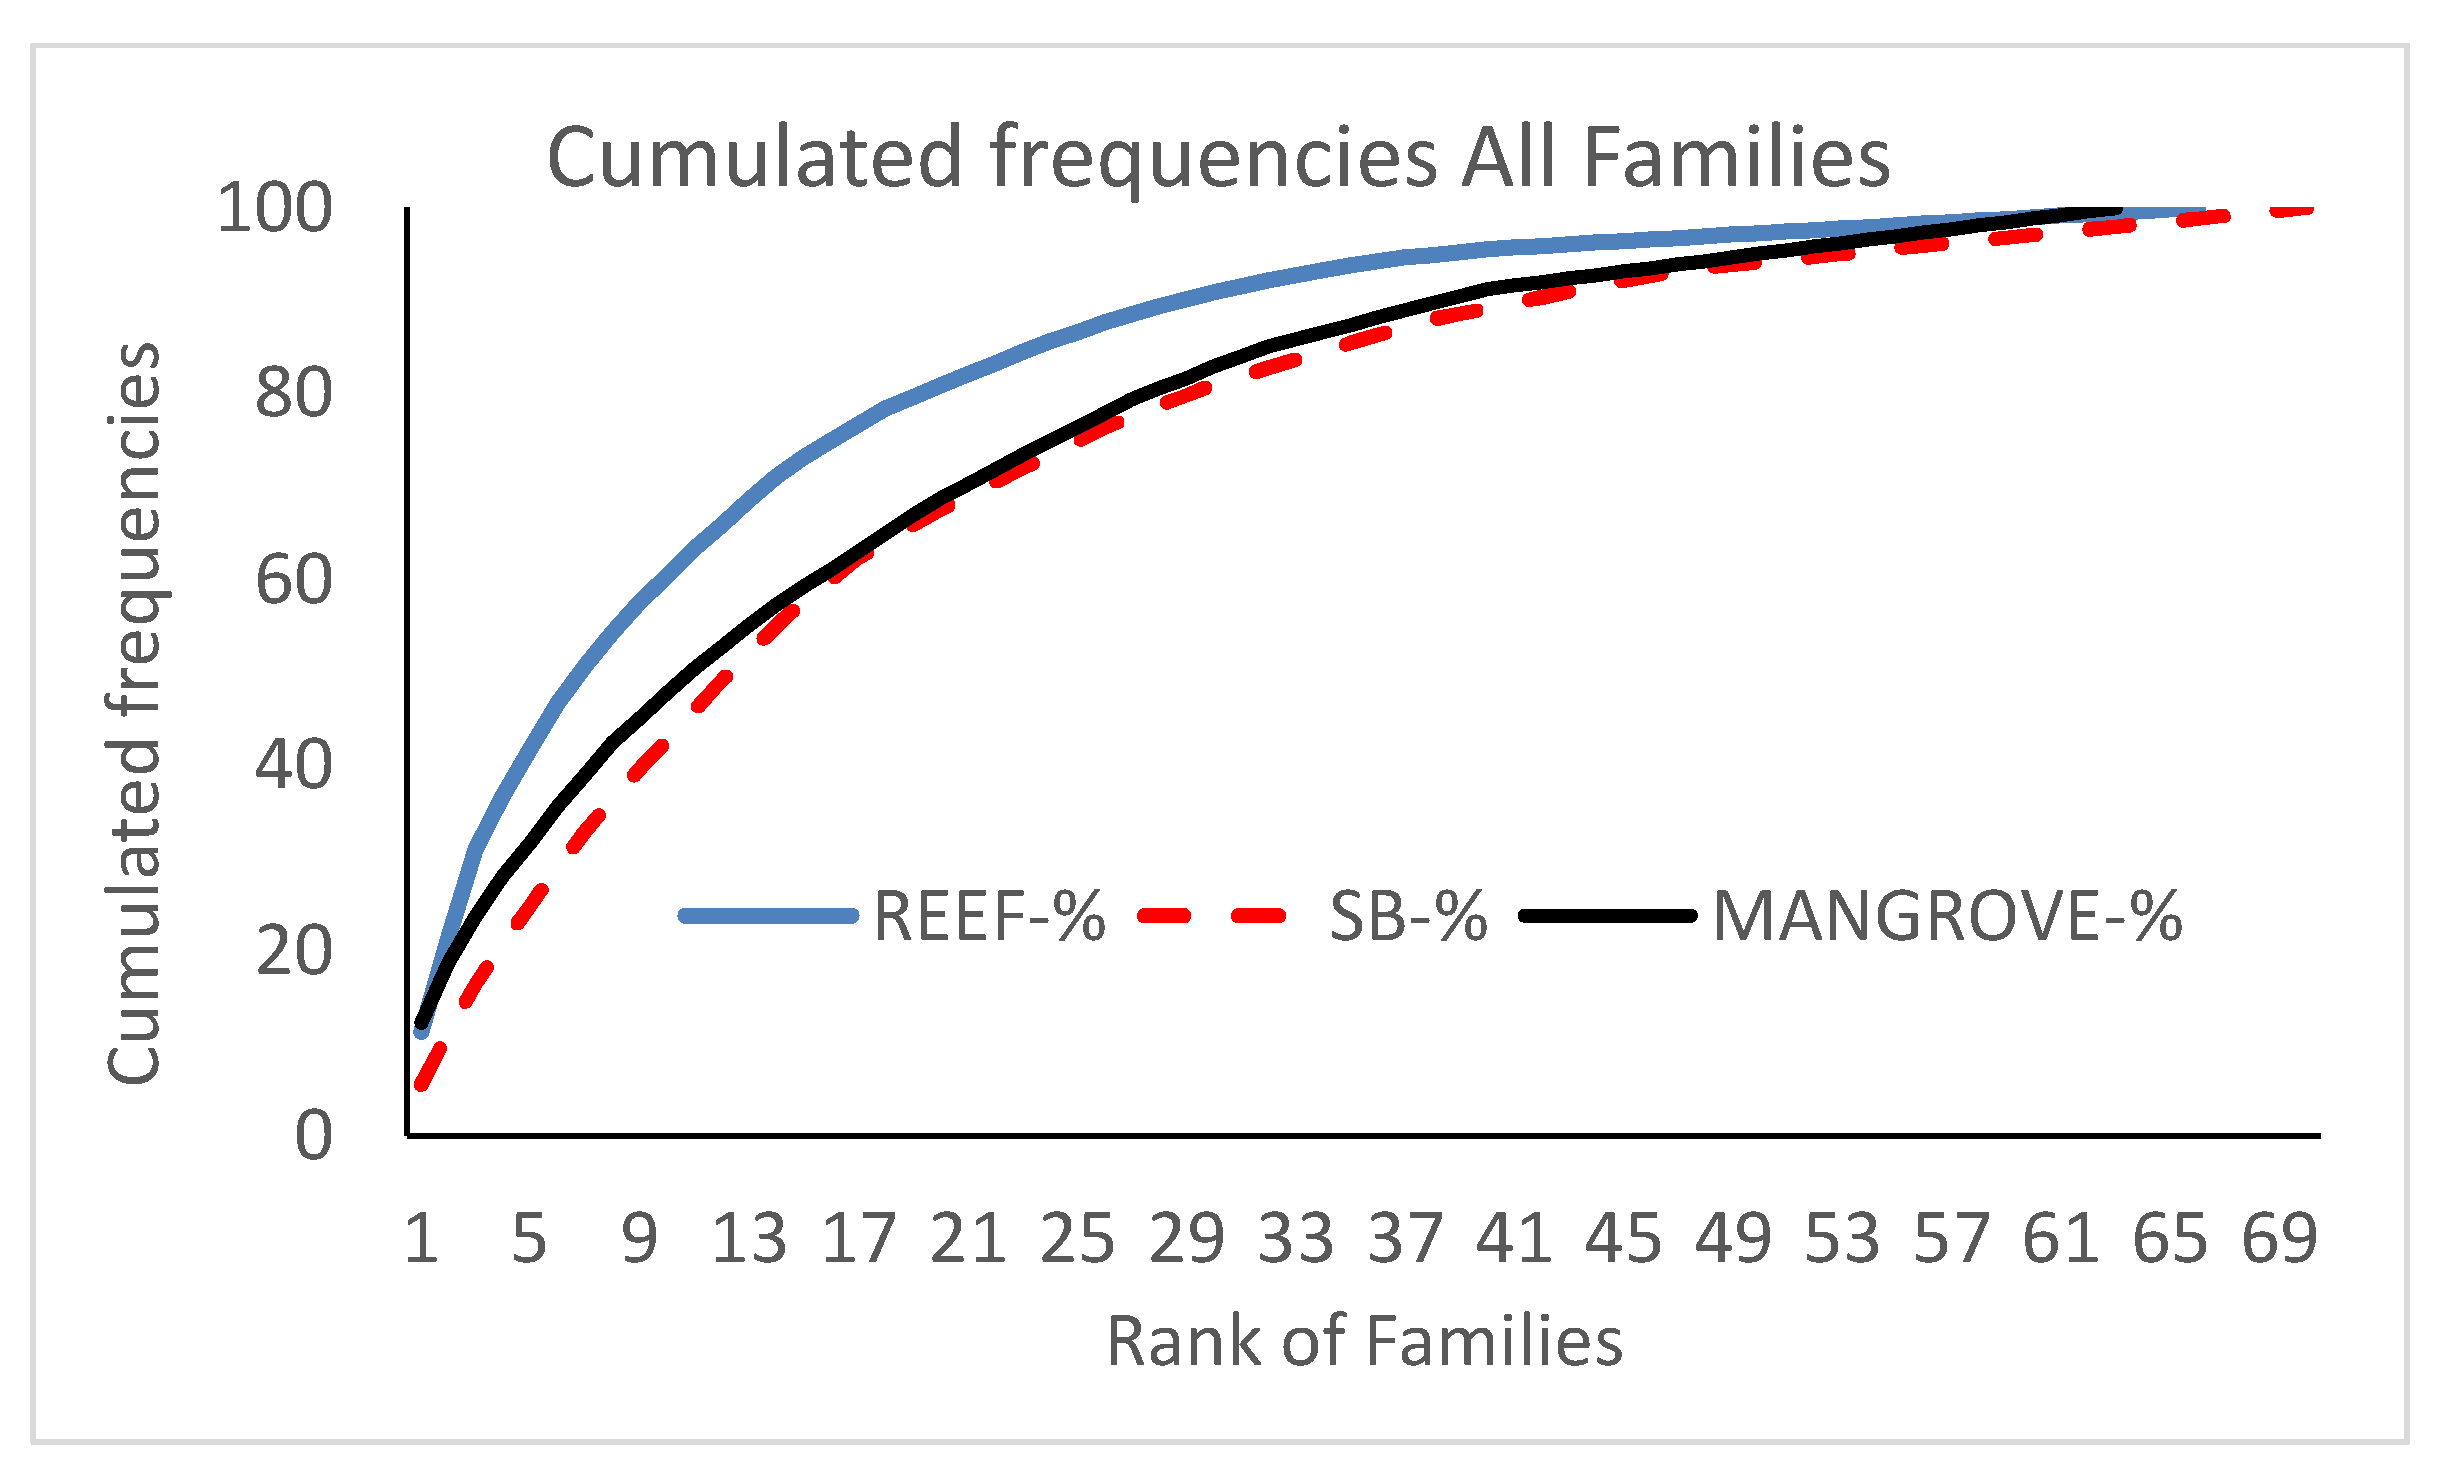
Figure 5.
Trophic level spectra for the three habitats based on averages per diet class (see Section 2.2).
Figure 5.
Trophic level spectra for the three habitats based on averages per diet class (see Section 2.2).
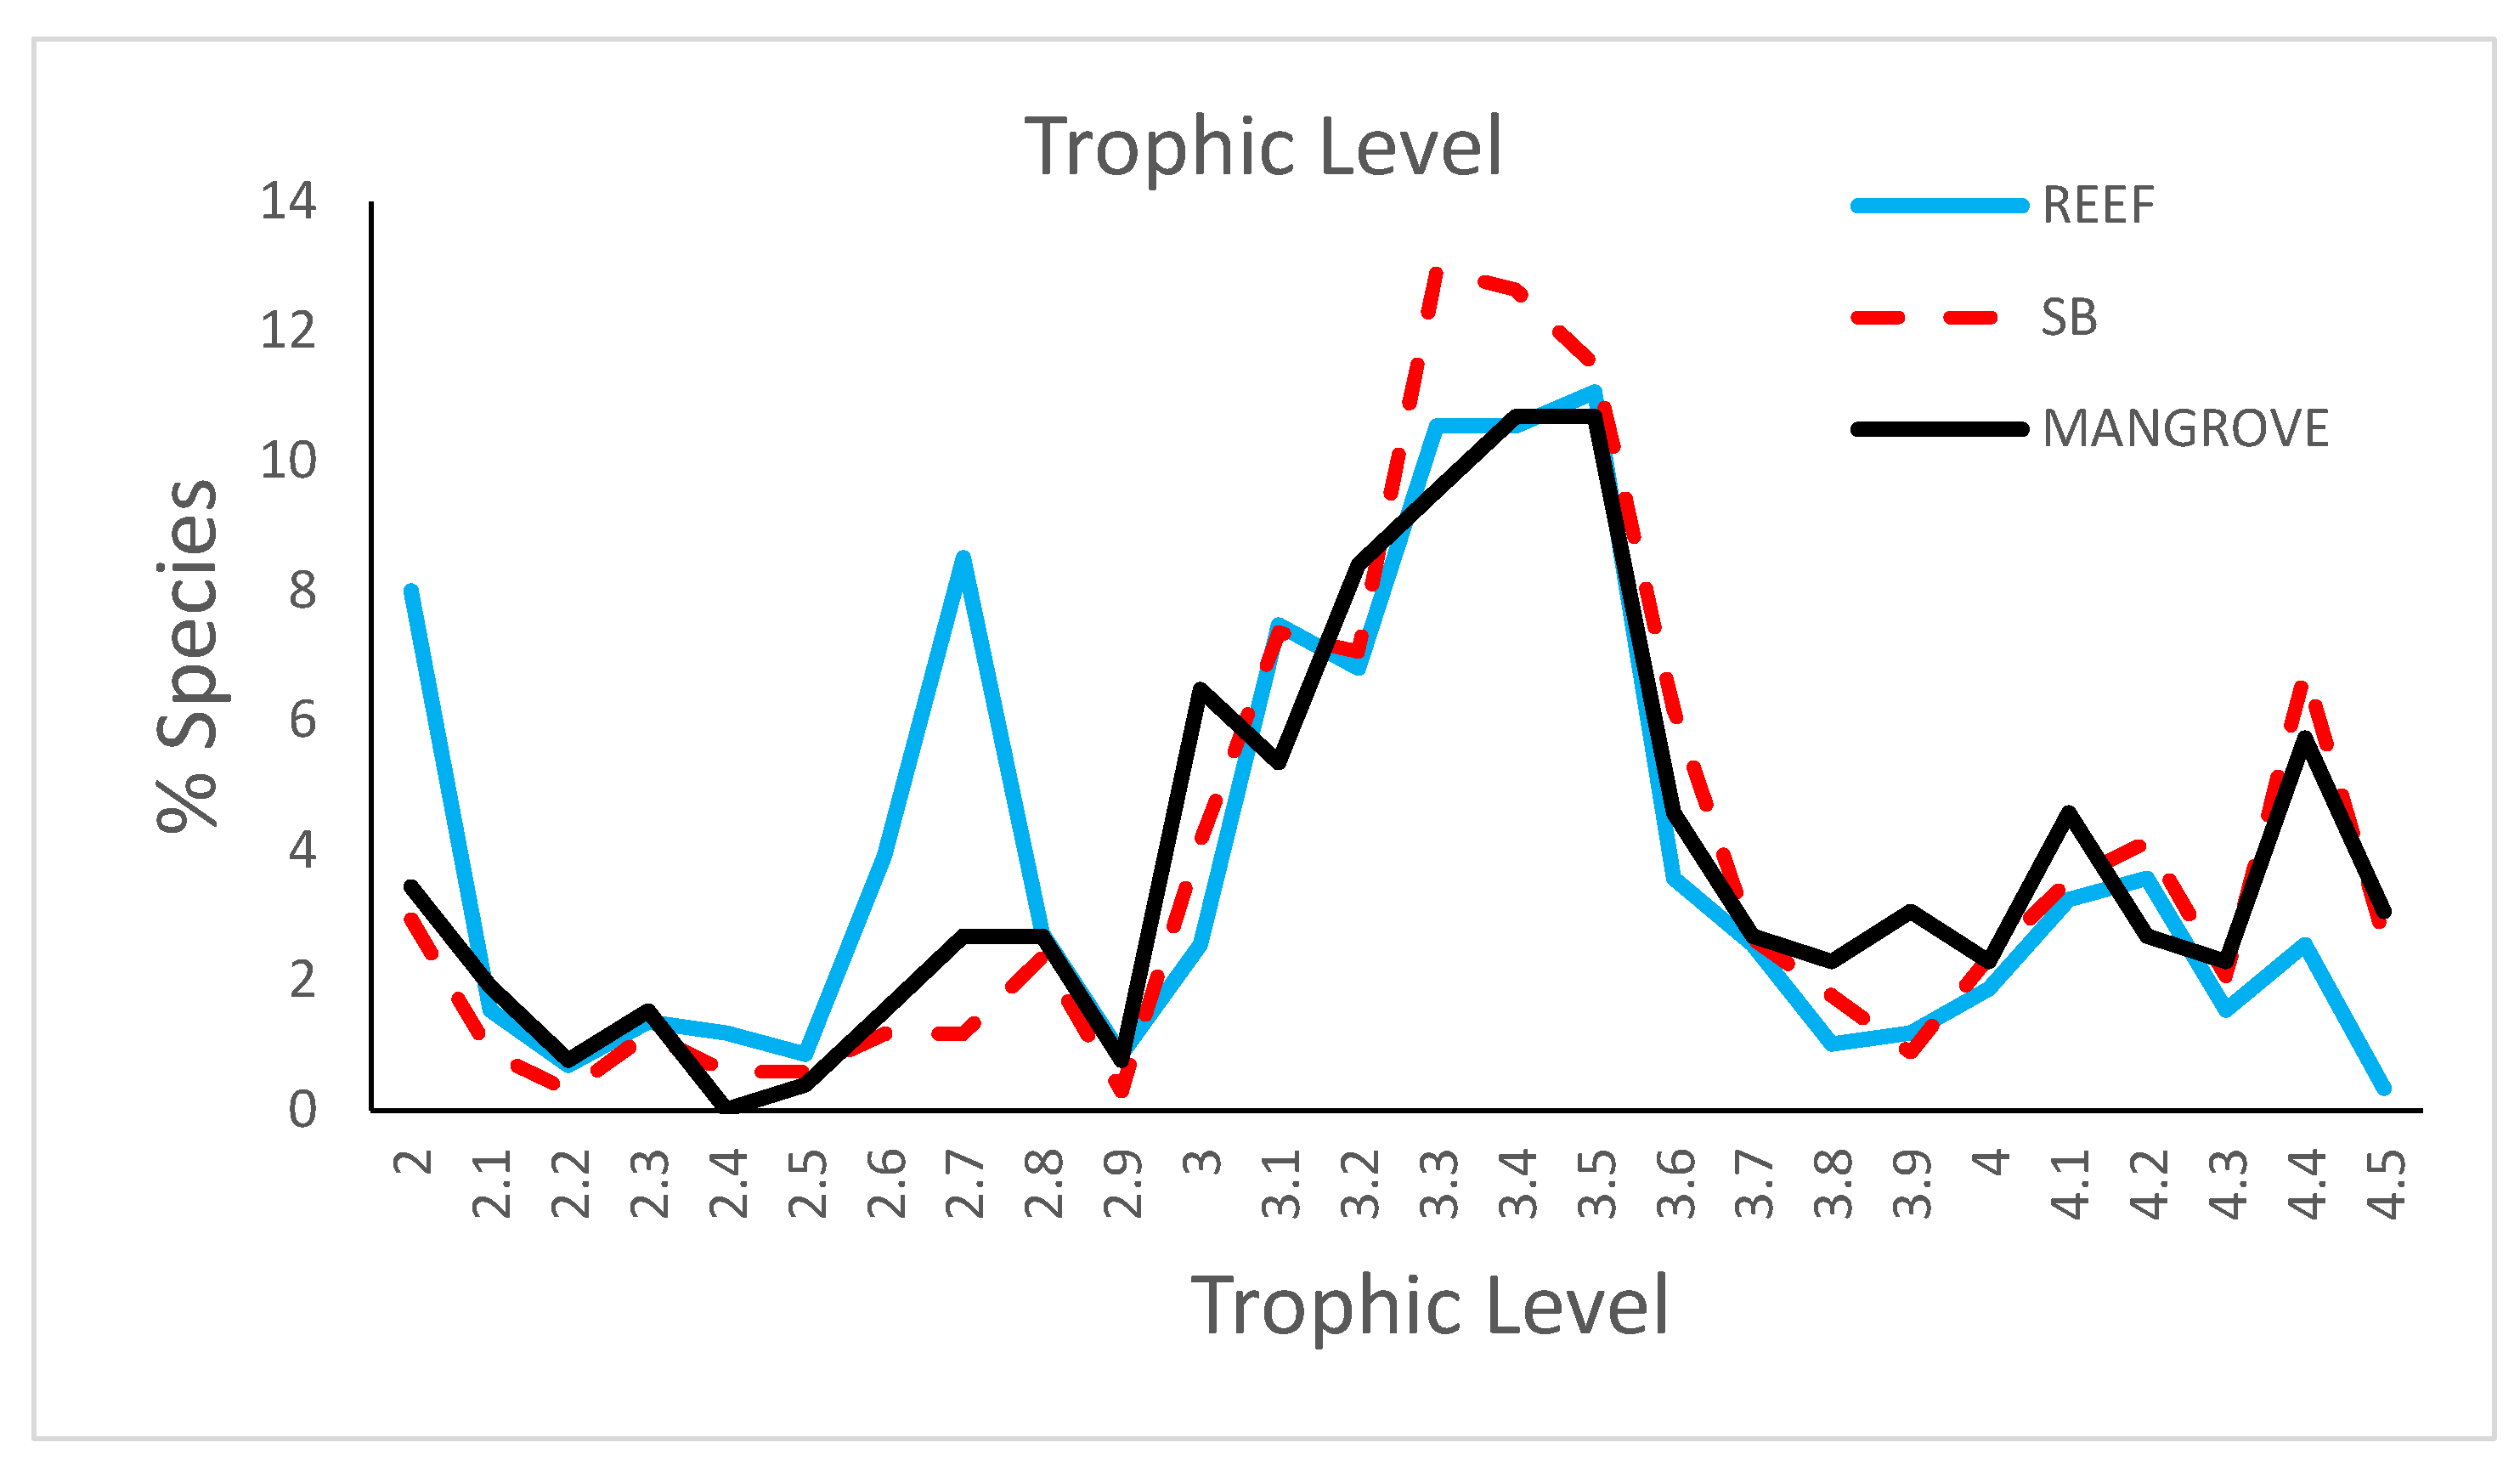
Figure 6.
Distribution of the geographical index according to habitat. SB: soft-bottom.
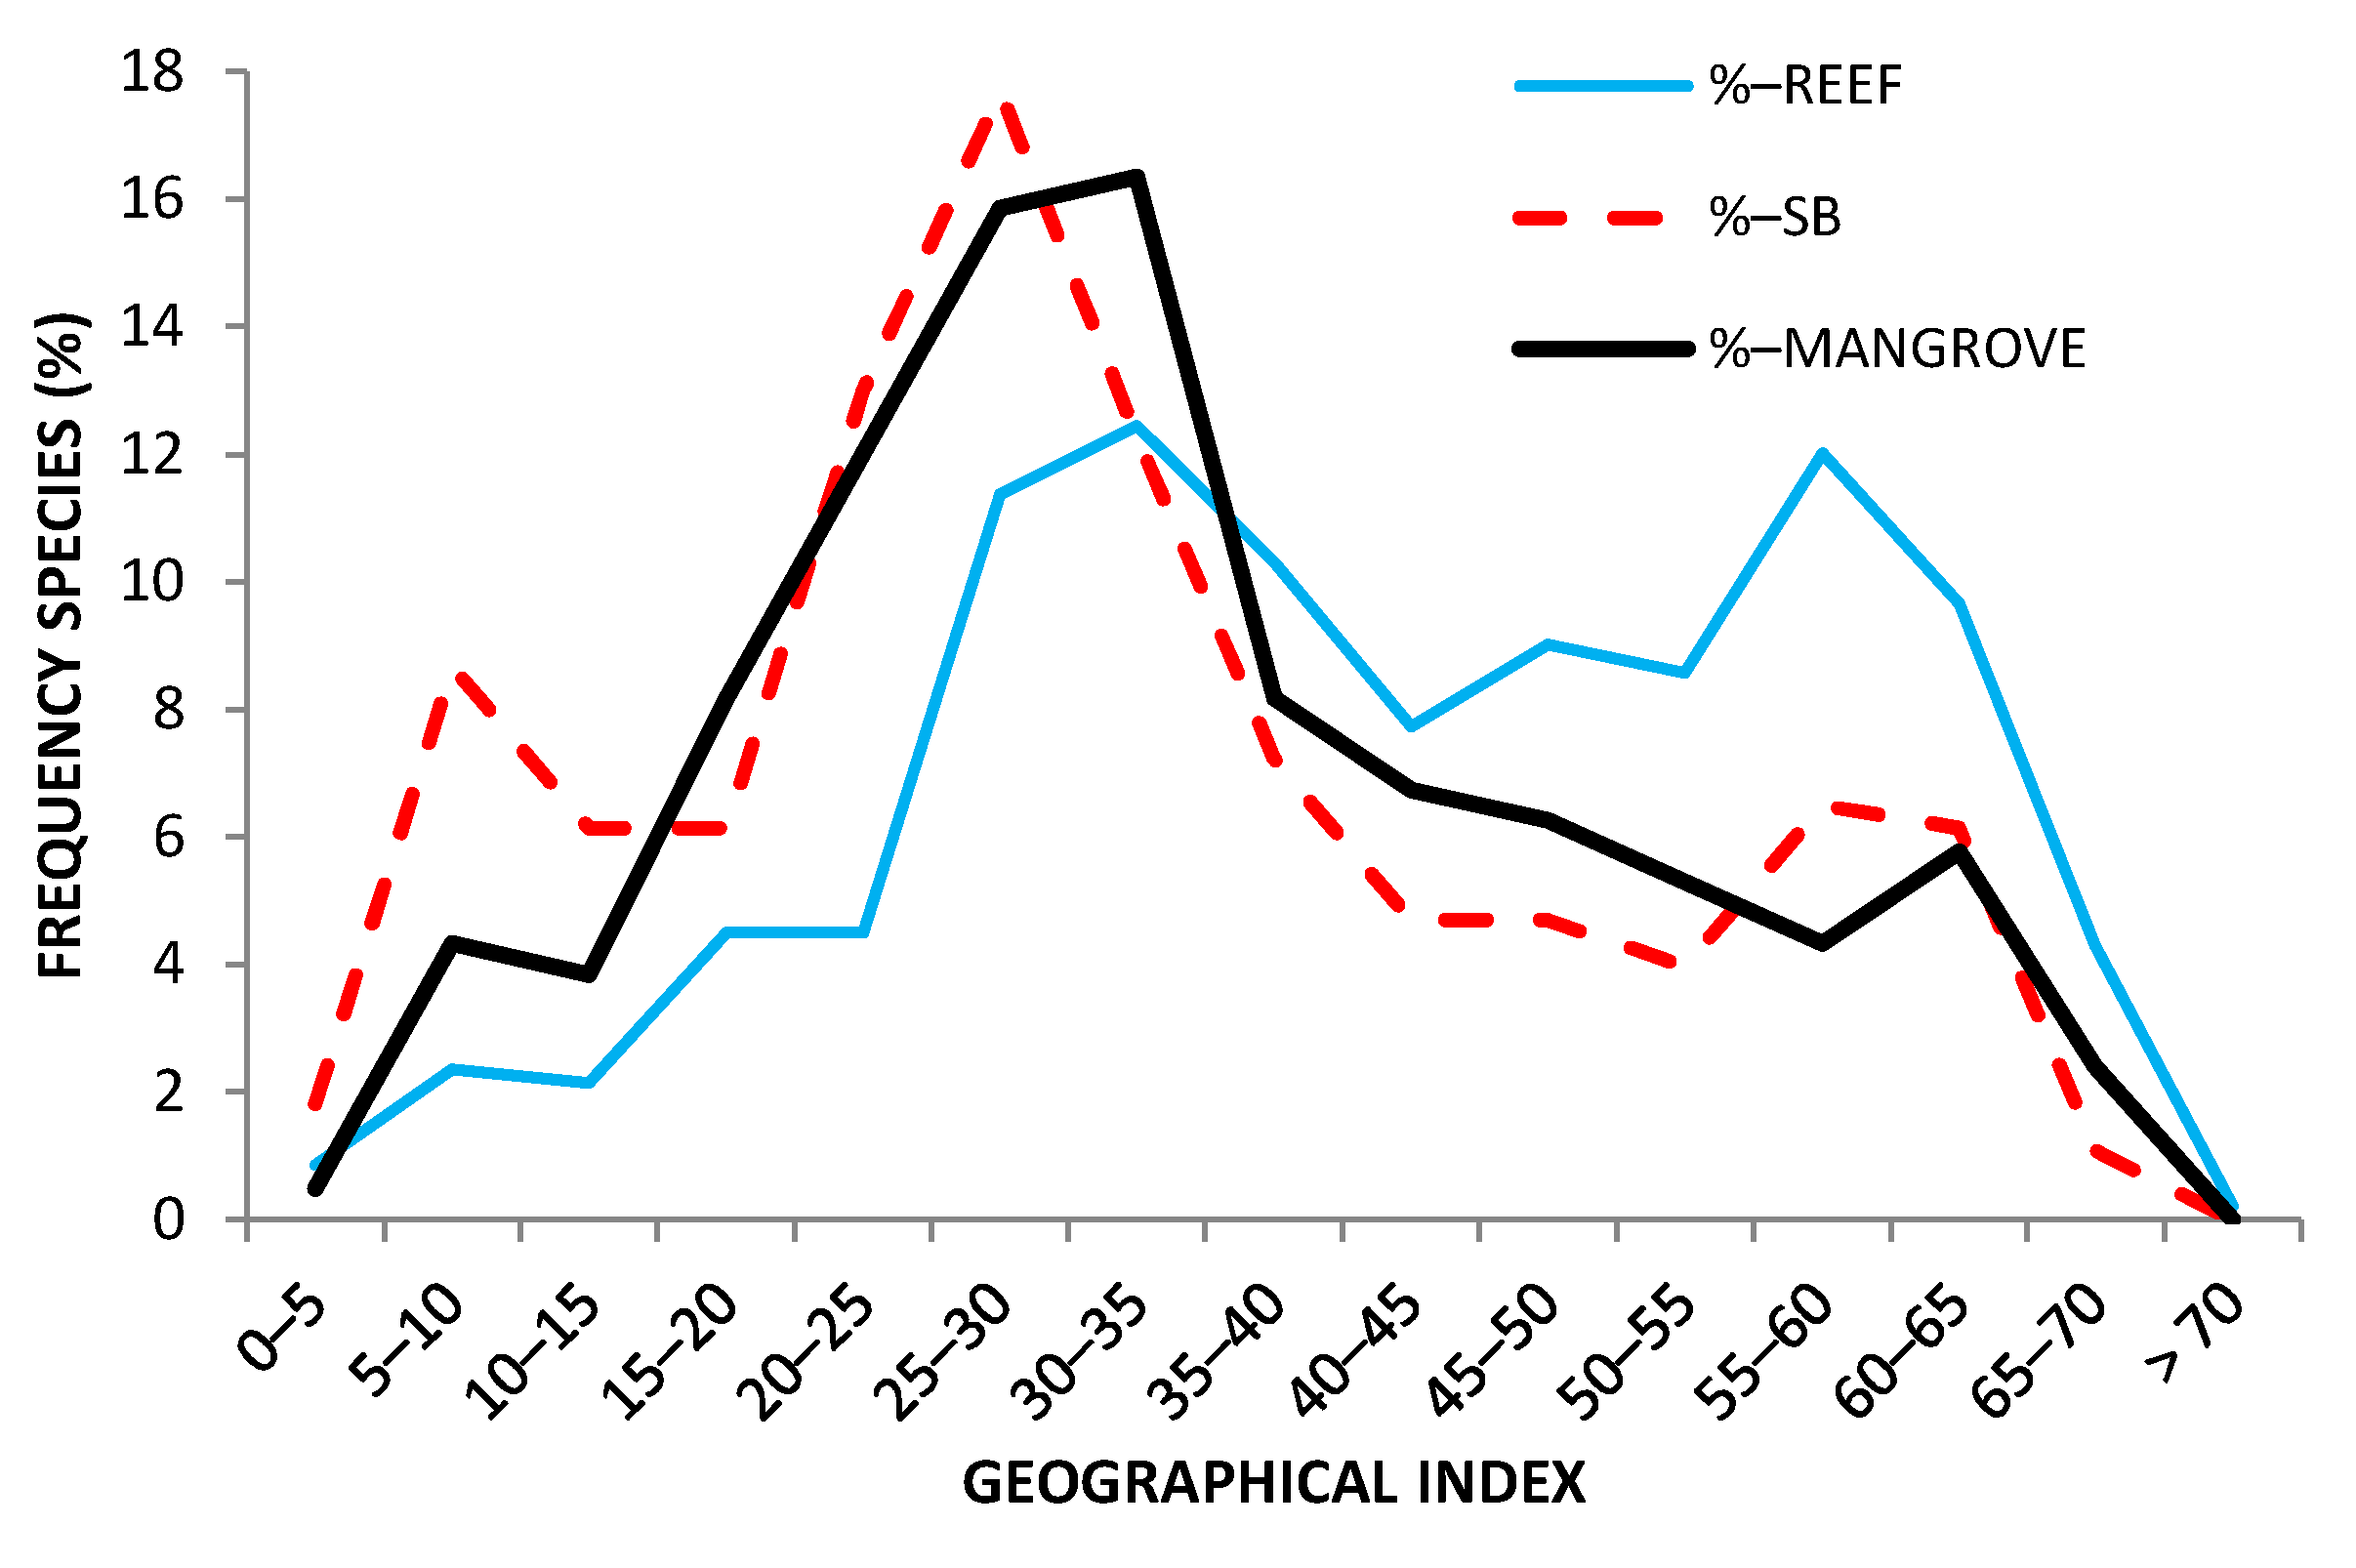
Figure 7.
Redundancy within functional groups according to habitat and functional group type.

Table 1.
Ranks of the 10 most diverse functional groups within each habitat. The functional groups are ordered according to the total number of species they represent. Each functional group is coded as follows.
Table 1.
Ranks of the 10 most diverse functional groups within each habitat. The functional groups are ordered according to the total number of species they represent. Each functional group is coded as follows.
| Functional Entities | C121 | C221 | C321 | C111 | C231 | C431 | Z223 | Z224 | C421 | Z245 | P331 | P643 | C333 | C343 | P321 | P631 | C641 | Z345 | C433 | C443 | P641 |
|---|---|---|---|---|---|---|---|---|---|---|---|---|---|---|---|---|---|---|---|---|---|
| REEF | 1 | 2 | 3 | 4 | 20 | 6 | 5 | 7 | 8 | 80 | 11 | 81 | 9 | 60 | 10 | 39 | 82 | 31 | 24 | 42 | 83 |
| SOFT-BOTTOM | 37 | 2 | 3 | 156 | 1 | 4 | 17 | 18 | 22 | 5 | 6 | 7 | 12 | 8 | 24 | 38 | 9 | 10 | 14 | 16 | 27 |
| MANGROVE | 4 | 1 | 15 | 7 | 16 | 33 | 34 | 35 | 84 | 2 | 36 | 5 | 12 | 6 | 49 | 3 | 22 | 52 | 8 | 9 | 10 |
C: carnivore, P: piscivore, Z: plankton feeder; 1st number: size; 1: <8cm; 2: 8–15 cm; 3: 16–30 cm; 4: 31–50 cm; 5: 50–80 cm 6: >80 cm; 2nd number: home range; 1: territorial; 2; sedentary; 3: mobile; 4: very mobile; Last number: schooling; 1: solitary; 3: small schools; 4: medium size schools; 5: large schools.
Table 2.
Distribution of the diversity of overlapping species amongst functional entities (FE). *: the numbers in the cells represent the number of FE with, respectively, 1 species up to 5 species in common among the habitats. e.g., there are 5 Functional Groups with 3 species in common to both reefs and soft-bottoms. R: Reef; SB: Soft-bottom; M: mangrove—RxSBxM indicates species found in all 3 habitats. It should be noted that here only taxa identified to the species level are considered.
| R × SB × M | R × SB | R × M | SB × M | |
|---|---|---|---|---|
| 1 Species * | 26 | 35 | 20 | 23 |
| 2 Species * | 4 | 7 | 6 | 8 |
| 3 Species * | 3 | 5 | 3 | 2 |
| 4 Species * | 2 | 1 | ||
| 5 Species * | 2 | 1 | ||
| [1] Nb overlapping Species (in habitat combination) | 43 | 82 | 41 | 54 |
| [2] Nb Species (in habitat combination) | 781 | 742 | 556 | 352 |
| [3] Nb overlapping FE | 33 | 51 | 29 | 35 |
| [4] Nb FE | 156 | 149 | 146 | 128 |
| Redundancy (species/FE) ([2]/[4]) | 5.0 | 5.0 | 3.8 | 2.8 |
| Redundancy of overlapping species ([1]/[3]) | 1.3 | 1.6 | 1.4 | 1.5 |
| % of overlapping FE (100 × [3]/[[4]) | 21 (High) | 11 (Low) | 7 (Low) | 15 (High) |
| % of overlapping Species (100 × [1]/[2]) | 6 (Low) | 11 (High) | 7 (Low) | 15 (High) |
Publisher’s Note: MDPI stays neutral with regard to jurisdictional claims in published maps and institutional affiliations. |
© 2022 by the authors. Licensee MDPI, Basel, Switzerland. This article is an open access article distributed under the terms and conditions of the Creative Commons Attribution (CC BY) license (https://creativecommons.org/licenses/by/4.0/).
Share and Cite
MDPI and ACS Style
Kulbicki, M.; Wantiez, L.; Thollot, P.; Tham, G.M. Functional and Taxonomic Overlap in Shore Fish Assemblages in a Tropical Seascape. Diversity 2022, 14, 310. https://doi.org/10.3390/d14050310
AMA Style
Kulbicki M, Wantiez L, Thollot P, Tham GM. Functional and Taxonomic Overlap in Shore Fish Assemblages in a Tropical Seascape. Diversity. 2022; 14(5):310. https://doi.org/10.3390/d14050310
Chicago/Turabian StyleKulbicki, Michel, Laurent Wantiez, Pierre Thollot, and Gérard Mou Tham. 2022. "Functional and Taxonomic Overlap in Shore Fish Assemblages in a Tropical Seascape" Diversity 14, no. 5: 310. https://doi.org/10.3390/d14050310
Note that from the first issue of 2016, this journal uses article numbers instead of page numbers. See further details here.