
Gamete Recognition Gene Divergence Yields a Robust Eutherian Phylogeny across Taxonomic Levels
by
 , , and
Emma K. Roberts
1,*,
Emily A. Wright
2,
Asha E. Worsham
3,
Daniel M. Hardy
3 and
Robert D. Bradley
4 1
Climate Center, and Department of Biological Sciences, Texas Tech University, Lubbock, TX 79409, USA
2
Department of Biological Sciences, Texas Tech University, Lubbock, TX 79409, USA
3
Department of Cell Biology & Biochemistry, Texas Tech University Health Sciences Center, Lubbock, TX 79430, USA
4
Department of Biological Sciences, and Natural Science Research Laboratory, Museum at Texas Tech University, Texas Tech University, Lubbock, TX 79409, USA
*
Author to whom correspondence should be addressed.
Diversity 2023, 15(11), 1145; https://doi.org/10.3390/d15111145
Submission received: 4 October 2023
/
Revised: 10 November 2023
/
Accepted: 13 November 2023
/
Published: 16 November 2023
(This article belongs to the Section Phylogeny and Evolution)
Abstract
:The extraordinary morphological diversity among extant mammals poses a challenge for studies of speciation, adaptation, molecular evolution, and reproductive isolation. Despite the recent wealth of molecular studies on mammalian phylogenetics, uncertainties remain surrounding both ancestral and more recent divergence events that have proven difficult to resolve. Multi-gene datasets, especially including genes that are highly divergent, often provide increased support for higher-level affinities within Mammalia; however, such analyses require vast amounts of genomic sequence data and at times, intensive, high-performance computational effort. Furthermore, despite the large-scale efforts dedicated to comprehensive, multi-gene phylogenetic analyses using a combination of mitochondrial, nuclear, and other sequences (e.g., tRNA, ultra-conserved elements, and transposable elements), many relationships across Mammalia remain highly controversial. To offer another approach and provide a phylogenetic solution to this longstanding issue, here we present a phylogenetic tool based on a single reproductive molecular marker, zonadhesin (gene: Zan), one of two known mammalian speciation genes, which encodes the rapidly evolving sperm protein zonadhesin that mediates species-specific adhesion to the egg and thereby promotes reproductive isolation among placental mammals (Eutheria). Topological comparison of Zan Maximum Likelihood phylogenies to a nearly complete mammalian supertree confirmed Zan’s striking phylogenetic utility and resolution at both deeper and more terminal nodes in the placental mammalian phylogeny. This single gene marker yielded an equivalent and/or superiorly supported topology in comparison to a supertree generated using DNA sequences from a supermatrix of 31 genes from 5911 species (extinct and extant). Resolution achieved with this new phylogenetic approach provides unique insights into the divergence of both early and recent mammalian radiations. Finally, and perhaps most importantly, the utility of zonadhesin as a singular molecular marker was especially useful in clades where sufficient taxon sampling is impossible to achieve, and where only a subset of members of the mammalian species tree is available. The eutherian relationships presented here provide a foundation for future studies in the reconstruction of mammalian classifications, including reproductive isolation, hybridization, and biodiversification of species.
1. Introduction
One of the greatest uncertainties in mammalian evolution and phylogenetics concerns the 38 major lineages among the 19 extant orders of eutherian mammals [1,2,3,4,5,6]. Since Simpson’s preeminent classification [7], systematists historically placed placental mammals in 4–5 major clusters all arranged as a polytomy (more or less), often shown radiating from a single node [8,9,10,11,12,13]. By the late 20th century, the view of eutherian phylogenetic relationships had changed radically as molecular studies supported the large-scale resolution of the phylogenetic tree with some level of certainty [1,2,14,15]. Indeed, molecular support for a more stable tree has emerged from analyses of increasingly robust molecular data [14,15,16,17,18,19,20,21,22,23,24] and from supertree studies [25,26,27,28], with a general consensus recognizing four major clades of placental mammals (Afrotheria, Xenarthra, Euarchontoglires, and Laurasiatheria) and resolving the divergence of the ancestral placental group. Nevertheless, at all taxonomic levels, variation among phylogenies constructed by comparing diverse characters revealed that phylogenetic relationships are complex and in need of further revision [29], especially among mammalian groups that have received relatively little systematic attention or are morphologically or behaviorally cryptic (e.g., insectivores or fossorial mammals, respectively). Consequently, several polytomies remain contentious in the tree, both at basal and terminal nodes. For example, many taxon groups remain unresolved at the species level, especially within the earliest (placental root) and most rapidly evolving mammalian lineages (speciose orders such as Chiroptera and Rodentia; [29,30,31]).
The difficulty in resolving the eutherian phylogenetic tree has evoked debates over methodological issues, such as discrepancies between morphologic and molecular data, taxon sampling, fossil calibrations, long branch attraction, incomplete lineage sorting, introgression, low phylogenetic signal, and discordance between and among many nuclear and mitochondrial genes [1,4,15,32,33]. Current approaches, especially combinatorial methods (total evidence) that include larger datasets and increasingly complex computational models, are thought to strengthen and clarify phylogenetic relationships particularly among the deeper nodes of the species tree and between closely related taxa [34,35]. Supertrees, phylogenetic datasets consisting of many characters, e.g., multiple genes, morphological datapoints, and fossil calibrations, have shown their potential to depict an overall consensus of the “true” species tree, with minimal discordance. These datasets have largely overcome variation due to incomplete taxon sampling and incomplete input data, and yet for some, topological discordance is still observed at a large fraction of loci [36].
In 2007, Bininda-Emonds et al. published the first 99% complete species-level supertree of mammals. This landmark study included 4510 of the 4554 extant mammalian species (based on the most recent estimation at the time of publication in 2007). Despite the abundance of characters and representative species included, this supertree still contained many unresolved polytomies (>2500 polytomies [27,37]). Taking the supertree approach a step further, in 2019, Upham et al. published another pivotal study based on a 31-gene supermatrix incorporating 5911 species, both extant and extinct (data based on most recent species accounts as of 2019). The ~39 kb alignment included 31 genes (twenty-two transcribed nuclear, four mitochondrial, and five non-coding genes), yet still yielded >50% unresolved nodes [28]. Although the Upham supertree is the most comprehensive species tree to date, it is still widely considered ‘fragmentary’ and is missing considerable amounts of data.
Studies of different morphological [4,11] and molecular characters [1,2,14,15,32,38,39,40,41,42,43,44] tend to yield disparate mammalian phylogenies, forcing decades-long disagreement regarding the reliability of single-character phylogenetic studies [26,27,45]. Typically, characters that are lineage-dependent or subject to positive selection (e.g., body size, pelage color, mating behaviors, and adaptive traits involved in species divergence) are thought to lack reliable phylogenetic signals because they reflect, at least in part, the functional evolution of the character itself, not of the organism as a whole. Accordingly, molecular phylogenetic studies routinely omit genes evolving under selective pressures that may differ between lineages because their divergence necessarily reflects both passage of time as well as the evolution of their products’ functions, with negative selection on products that must function the same and positive selection on products that bestow beneficial new traits in the evolving organisms [46,47,48,49,50,51,52,53,54]. Rather, loci that do not evolve under positive selection and instead evolve under neutrality are thought to provide the most accurate insights into phylogenetic histories, as they often tend to serve simply as a clock to measure time passed following a speciation event [55,56]. This approach is most useful for resolving more closely related species owing, in part, to mutation saturation and/or alignment difficulty caused by structural variation between more distantly related species [57].
Notwithstanding the conventional wisdom that phylogenetic studies are best conducted by comparing diverse characters, including large numbers of neutrally evolving genes, it is also possible that reliable phylogenetic information could be generated by comparing a single character that directly tracks the speciation process itself throughout a group, regardless of the nature of selection on that character. Accordingly, the divergence of a “speciation gene” may accurately represent species phylogeny because its evolution does not simply serve as a clock, but instead reflects the gene’s direct contribution to speciation [58,59,60]. We previously found that Zan is a speciation gene in placental mammals, and its divergence tracks the evolutionary history of Eutheria [61]. Zan encodes the sperm protein zonadhesin, which mediates species-specific recognition of the egg, and rapid Zan evolution by intense positive selection promotes prezygotic reproductive isolation [62,63,64,65,66]. Despite being a single character evolving under positive selection, the Zan tree was generally congruent to a eutherian supertree [28,61] but did exhibit significant incongruencies in part, and presumably, because it was more highly resolved [61].
To investigate these incongruencies further, here we report detailed comparisons of the Zan gene and mammalian supertree phylogenies at all taxonomic levels. The findings support the view that Zan DNA sequences accurately reflect species divergence events compared to datasets provided from a comprehensive supertree. Thus, contrary to current assumption, a single character evolving under selection can yield remarkable phylogenetic utility if evolution of the character directly reflects speciation.
2. Materials and Methods
2.1. Phylogenetic Analysis of Zan
The phylogenetic comparisons generated herein were based on an analysis of a Zan DNA sequence alignment (6 kb) obtained from 170 eutherian mammals and the ZanL gene [61] from two prototherian mammals (Ornithorhynchus and Tachyglossus, with the former species as an outgroup) using both the Bayesian and Maximum Likelihood (ML) inference models. The nucleotide substitution models and corresponding likelihood values used in the analyses are found in Table S1. See Roberts et al. (2022), ref. [61], for the specific methods and parameters used to construct the updated species tree. To assemble a family-level Zan tree, we manually pruned the species-level tree by coalescing the terminal species-level branches into a single family-level branch. Similarly, we manually transformed the Zan species-level tree into individual ordinal, family, and species-level tanglegram comparisons using standard graphics software (Microsoft PowerPoint, version 16.78.3). In addition, a zonadhesin protein sequence alignment and pairwise sequence identities from orthologous segments spanning the vWD0-vWD3TIL+E domains were generated on MegAlign Pro (DNASTAR Lasergene 17) for 17 species representing 17 of 19 placental orders.
2.2. Testing the Phylogenetic Utility of Zan
To compare relationships of positive selection to phylogenetic support more broadly across Zan and other molecular markers, we constructed individual Bayesian phylogenies and performed corresponding PAML selection analyses for all reliable sequences of all eutherian genes (n = 40) previously shown to have evolved by positive selection (as of June 2022; [47,51,67,68,69,70,71,72,73,74,75,76,77,78,79,80,81,82,83]). Annotated gene functions ranged from reproduction (n = 23) to sensory perception (n = 7), immunity (n = 5), metabolism (n = 3), the nervous system (n = 1), and the cell cycle (n = 1), and the genes’ compared sequence lengths ranged from 394 nt (for S100a2) to 8016 (for Cr2) nt (Table 1), collectively encompassing >104,000 nt of gene coding sequence. We next assessed each gene’s relative ability to resolve nodes throughout the placental phylogeny by calculating the difference between percent support at ≥family deep nodes and percent support overall, then plotting the differences vs. an aggregate measure of positive selection (intensity × frequency = ω × f; Ref. [61]). This analysis included the rapidly evolving but negatively selected (ω × f = 0) Cytb as a reference.
To compare Zan’s phylogenetic utility as a single character marker not only to other rapidly evolving genes, as described above, but also across multi-loci, concatenated datasets, including supertrees and supermatrices, we first assessed the comparative suitability of previous analyses that have been assessed as mammalian phylogeny hypotheses over the past 25 years [14,15,25,26,27,28]. Specifically, we examined multiple factors, including species representation, nodal support, and whether the analysis used outdated methodologies to identify analyses with maximal compatibility for topological comparison via maximum likelihood methodologies to the Zan tree. Candidate analyses included those reported by Madsen et al. (Ref. [14], six genes and twenty-six taxa); Murphy et al. (Ref. [15], 18 genes and 66 taxa); Liu et al. (Ref. [25], 430 source phylogenies published between 1969 and 1999, all with varying species representation); Beck et al. (Ref. [26], 222 source phylogenies more stringently selected from Liu et al. [25]), Bininda-Emonds et al. (Ref. [27], 66 genes and 4510 species); Campbell and Lapointe (Ref. [84], full mitogenomes which included 12 genes and 102 species); and Upham et al. (Ref. [28], 31 genes and 5911 species). Among these published phylogenies, the Upham et al. supertree (ST) provided the analysis with the most recent and comprehensive methodology, most nodal support, and most appropriate taxon representation (more species included) for inclusion in this study and for comparisons with the Zan phylogeny, all described below.
2.3. Tanglegram Comparisons
The Zan phylogeny was compared to the Upham ST [28] described above using both tanglegram and topological analyses. To establish maximum compatibility between studies, the ST was pruned to only those species represented in each of the Zan superordinal-, ordinal-, family-, and species-level trees generated in Roberts et al. (2022). Figure 1 summarizes the taxonomic relationships above Parvorder, and corresponding molecular composition, nodal support, and branch lengths of the tree previously reported by Roberts et al. (2022). Tanglegrams of phylogenies from both datasets (Zan and ST) were manually drawn using the NN-tanglegram method [85]. Superorder-level trees (n = 1), ordinal-level trees (n = 2), family-level trees (n = 5) and species-level trees (n = 5) were visually compared using the tanglegram method at all taxonomic levels (n is equal to the number of trees per taxonomic rank). Tanglegrams (mirrored phylogenies with straight lines connecting matching taxa) have been shown to be a useful method to view similarities and differences between rooted phylogenetic trees and have proven valuable for studies of co-evolutionary analysis under parasitic and symbiotic systems, horizontal gene transfer in prokaryotic evolution, and phylogenetic associations between different datasets in varying taxon groups [86]. Unfortunately, owing to limited taxon representation, i.e., less than ten species represented, we could not conduct meaningful tanglegrams comparisons for Orders Cingulata (n = 1), Macroscelidea (n = 0), Eulipotyphla (n = 6), Perissodactyla (n = 5), Pholidota (n = 1), Scandentia (n = 1), Dermoptera (n = 1), and Lagomorpha (n = 2).
2.4. Topological Statistical Comparisons
To determine whether the gene trees recapitulated mammalian evolutionary relationships, we compared their topologies to the ST phylogeny [28] using both global and intra-ordinal Shimodaira–Hasegawa (SH) and Shimodaira Approximately Unbiased (AU) tests [87]. The supertree [28] was constructed from extensive gene sequences and is well-represented taxonomically, so we first pruned it in Phylomatic v.3 [88] to only those species represented in the Zan phylogeny. We ran one-tailed SH and AU tests using automated model selection, 10,000 RELL (Resampling Estimated Log Likelihoods) bootstrap generations, and Bonferroni correction using the unconstrained gene tree and corresponding pruned, constrained supertree files as input files in PAUP v4.0a166 [89]. We considered trees significantly different at p < 0.05. All SH and AU parameters can be found in Tables S3 and S4.
2.5. Divergence/Selection Comparisons
To assess DNA sequence divergence for relative contribution of selection (negative, positive, or neutral evolution), we used the CODEML program in the PAMLX PAML4.9j supercomputer package depending on dataset size [90]. dN/dS ratios (ω, omega) were first calculated from the codon alignments with two comparisons, M0 vs. M7 (tested for neutrality) and M7 vs. M8 (tested for selection). In addition, M8 used a Bayes Empirical Bayes approach to calculate posterior probabilities for sites under selective pressures [91]. Which model, M7 or M8, was then determined to be most appropriate with likelihood ratio tests, using a chi-squared distribution, degrees of freedom equaling two, and statistical significance of p < 0.05. All selection test parameters can be found in Table S5.
3. Results
To conduct a comprehensive assessment of Zan’s utility as a single speciation gene phylogenetic marker, we first produced an updated alignment (170 spp representing 17 of 19 placental orders) that included all the authentic Zan sequences released since our previous study (112 spp, Ref. [61]). Bayesian and ML analyses of Zan divergence, from comparison of a 6 kb portion encoding the region of zonadhesin that mediates species-specific egg recognition, produced a phylogenetic tree (Figure S1) that resolved all species into monophyletic groups corresponding to recognized orders and suborders, with <5.0% unsupported nodes (Zan = Bayes posterior probability ≤ 0.95 and ML bootstrap value ≤ 75; ST = ML bootstrap value ≤ 75). Of the 169 placental nodes in the Zan phylogeny, only two family-level nodes, one within Chiroptera and one within Rodentia, and five genus-level nodes lacked nodal support, one within Cetartiodactyla, two within Carnivora, and two within Primates. Zonadhesin amino acid sequences also diverge rapidly, consistent with
species phylogeny in placental mammals (Ref. [61] and Figure S2);
pairwise identities averaged 65.7%, with a maximal genetic distance
between sloth and shrew (identity 52.8%) and a minimum between elephant
and manatee (identity 93.0%) determined by alignment of orthologous
segments spanning the zonadhesin vWD0-vWD3TIL+E domains (avg. 1280 amino
acids) from species representing 17 of the 19 placental orders
(armadillo, sloth, tenrec, aardvark, manatee, treeshrew, colugo, human,
elephant, shrew, little brown bat, horse, dog, pangolin, house mouse,
rabbit, and cow; platypus ZanL as outgroup).
The updated Zan phylogeny exhibited strikingly high levels of nodal support at all taxonomic levels (Figure 1 and Figure S1) in contrast to the overall support observed for 38 of 39 other positively selected genes, including both non-reproductive and reproductive genes (Figure 2 and Table 1). Total Bayesian nodal support ranged from 48.53% for S100a2 (cell cycle gene) to 95.90% for Zan (Figure 2). All but three genes (Tnp2, Tex14, and Zan) returned lower Bayesian support at ≥family-deep nodes in comparison to support overall, with deep node support ranging from 31.03% for S100a2 to 96.9% for Zan. To examine the ‘erosion’ of deep node support among these genes, we compared differences between total and deep nodal support, which varied widely from −25% for Prdm9 (reproduction gene, and the only other speciation gene identified in mammals) to +1% for Zan (Figure 2). Ranking the genes’ deep node support differences, according to an aggregate measure of positive selection (ω × f), identified neither a general correlation between retention of deep node support and overall selection intensity nor a general difference between the deep node utility of reproductive and non-reproductive genes. Notably, however, the two genes evolving under the highest aggregate positive selection (Tex14 and Zan) also returned higher support at deep nodes than overall. Of these two genes, only Zan has been identified as a speciation gene (owing to its function in species-specific gamete recognition), and our preliminary analyses (Roberts et al., unpublished) revealed little (if any) added phylogenetic utility from combining Tex14 and Zan sequences. We therefore proceeded with detailed topological analysis of the Zan species phylogeny.
Not only did the single gene Zan yield higher nodal resolution in comparison to the other rapidly evolving genes examined, but the Zan tree’s topology also closely recapitulated the Upham et al. ST constructed from a 39 kb alignment obtained from 31 genes [28]. Despite its high species representation, the ST contains many unresolved polytomies at 1418 of the 5912 nodes (24.0% unsupported), whereas the Zan phylogeny exhibited much stronger support, with Bayesian posterior values ≥ 0.95 at 162 of 169 nodes (95.9% supported overall; Figure 1 and Figure S1). The Bayesian analyses generated a phylogenetic tree with more resolution; therefore, the ML phylogenetic tree and sequence alignments for all analyses generated can be found at https://doi.org/10.1186/s13059-022-02721-y. Topological comparison of the Zan tree and the ST identified incongruities at 39 of the 421 total nodes (9.26% unsupported) across all taxonomic levels, including 1.59% at the inter-ordinal, 1.05% at the inter-familial, 4.50% at the inter-generic, and 2.12% at the inter-species levels. Our previous study with a 112 species alignment noted Zan’s phylogenetic utility not only at terminal branches, as expected for a rapidly evolving gene, but also at deeper nodes, observed as minimal decreases in resolution at the family- and ordinal-level nodes [61]. In this updated alignment with 170 placental species, deep node support actually increased to 96.9% (63 of 65 family-level nodes supported in Figure 2), presumably reflecting Zan’s function as a speciation gene throughout the evolution of Eutheria.
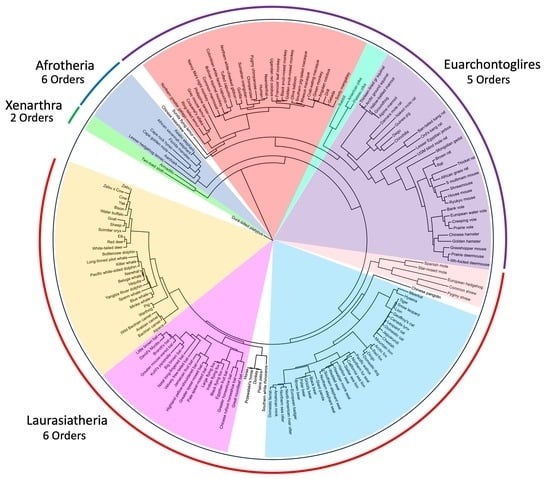
Figure 1.
The Zan gene tree with corresponding taxonomic descriptions. Shown is a consolidated family-level Zan phylogenetic tree corresponding to the species-level tree previously reported by Roberts et al. [61] along with taxonomic descriptions. The nodes lacking statistical support are marked with a red dot (2/69 nodes unsupported; 98.8% supported). The numbers in parentheses denote the number of species compared in each family. Note the statistically supported monophyletic grouping of all families into their respective infraorders, suborders, and orders, and of all orders into their respective superorders. Asterisks denote traditional clades per Refs. [19,21,24,31,92,93,94,95,96,97,98,99,100,101].

Figure 2.
Differences in Bayesian support at deep nodes compared to overall for genes evolving under positive selection in Eutheria. Shown are differences in support calculated as percent support at ≥family-deep nodes minus percent support overall (all taxonomic levels), ranked in order of increasing aggregate selection intensity calculated as the product of selection magnitude (dN/dS = ω) and pervasiveness (frequency = f), as determined using Model M8 [61]. Black bars are reproductive genes (N = 23) and gray bars are genes involved in metabolism (N = 3), sensory perception (N = 7), immunity (N = 5), and the cell cycle (N = 1). Not included are the metabolism gene Mgam1, owing to its negligible intensity of positive selection, and the reproductive gene Prm2, owing to its low taxonomic representation. The numbers shown in parentheses are the calculated ω × f values for the six genes evolving with the highest aggregate intensity of positive selection. Note Zan’s high utility for resolving deep nodes and extraordinarily high aggregate intensity of positive selection (ω × f = 191). Note also the designation of Slc6a5 as a reproductive gene based on the robust expression of its gene product (a sodium-coupled glycine symporter) not only in neurons but also in spermatids.

Below, the Zan topology is assessed in detail at all taxonomic levels relative to the Upham ST (Ref. [28]). Taxonomic and classification arrangements depicted herein followed those presented by McKenna and Bell (Ref. [102]), Bininda-Emonds et al. (Ref. [27]), Foley et al. (Ref. [44]), Burgin et al. (Ref. [103]), and Upham et al. (Ref. [28]).
3.1. Tanglegram Comparisons
3.1.1. Magnordinal- and Superordinal-Levels
The Zan gene tree and Upham et al. supertree (ST) both placed Magnorders Atlantogenata (Superorders Afrotheria and Xenarthra) and Boreoeutheria (Superorders Laurasiatheria and Euarchontoglires) into monophyletic groups (Figure 1 and Figure 3). In addition, Atlantogenata and Boreoeutheria grouped as sister taxa in both the Zan and ST topologies.
Figure 3, Figure 4, Figure 5, Figure 6, Figure 7, Figure 8, Figure 9, Figure 10, Figure 11, Figure 12, Figure 13 and Figure 14 depict tanglegram comparisons of the Zan tree and ST. Shown are topology comparisons between the Zan gene tree (left) and ST (right) at hierarchical taxonomic levels. Tangles (n = 39) denote incongruities between trees. For incongruities that did not produce a tangle, letters (e.g., A, B) denote the incongruous node(s). Black circles indicate nodes without statistical support (Zan = Bayes posterior probability < 0.95 and ML bootstrap value < 75; ST = ML bootstrap value < 75). Information regarding topologies and statistical support for the Zan tree and the reference ST can be found in the studies published by Roberts et al. (2022; Ref. [61]) and Upham et al. (2019; Ref. [28]), respectively. Figure 3 and Figure 4 depict the superorder and ordinal trees. Figure 5, Figure 6, Figure 7, Figure 8, Figure 9 and Figure 10 depict the Laurasiatheria family and species trees. Figure 11, Figure 12, Figure 13 and Figure 14 depict the Euarchontoglires family and species trees.
3.1.2. Ordinal-Level
The Zan and ST topologies (Figure 1 and Figure 3) both divided Order Afrosoricida into two different clades (the tenrecs and the golden moles); however, two tangles formed with the placement of Tubulidentata, either as basal to Afrosoricida in part (golden mole clade) and Orders Hyracoidea, Sirenia, and Proboscidea (Zan tree topology), or as a sister taxon to Afrosoricida in part (golden moles clade). The remaining tangle formed as an incongruity between members of the traditional clade Paenungulata (whether Sirenia and Proboscidea group as sister taxa (Zan) or Hyracoidea and Proboscidea group as sister taxa (ST)).
One tangle formed between the Zan tree topology and ST (Figure 1 and Figure 4), with one incongruity centered on the placement of Order Chiroptera as sister to Order Perissodactyla (Zan tree) or alternatively basal to the clade containing Orders Certartiodactyla, Perissodactyla, Pholidota, and Carnivora (ST). Interestingly, the association of the traditional clade Ferae (Carnivora grouping with Pholidota) was recovered in both the Zan and ST topologies. Within the Euarchontoglires in the Zan tree (Figure 1 and Figure 4), Order Dermoptera was placed as the basal-most taxon, followed by Order Scandentia, then Order Primates (all three constitute the traditional clade Euarchonta), and the sister clade containing Orders Lagomorpha and Rodentia (traditional clade: Glires). For Euarchontoglires, there were no topological tangles between the Zan and ST topologies.
3.1.3. Intra-Ordinal Level
For orders with limited taxon representation (Cingulata: n = 1, Macroscelidea: n = 0, Tubulidentata: n = 1, Hyracoidea: n = 1, Sirenia: n = 1, Proboscidea: n = 2, Pholidota: n = 1, Dermoptera: n = 1, Scandentia: n = 1, and Lagomorpha: n = 2), there were no multiple species comparisons and therefore no tanglegrams. See Table S1 for a list of these species and taxonomic designations. Phylogenetic relationships within all other eutherian orders are compared below:
Order Chiroptera—a tangle was formed between the Zan tree and ST (Figure 1, Figure 5 and Figure 6) within the genus Myotis, with the Zan topology depicting M. myotis basal to a clade of M. brandtii, M. lucifugus, and M. davidii, with the latter two forming a sister relationship. However, the ST topology depicted M. myotis and M. davidii sharing a sister relationship, as well as M. brandtii and M. lucifugus.
Order Cetartiodactyla—no tangles were formed between the ordinal Zan tree and ST at the ordinal level (Figure 1 and Figure 7). However, at the species level, the ST was identical to the Zan tree (Figure 1 and Figure 8) with the exception of two discrepancies, one of which centered on the Camelus spp. and several tangles within members of the Delphinidae clade.
Order Carnivora—one tangle formed between the ordinal Zan and ST topologies (Figure 1 and Figure 9), centered on the divergence leading to the Arctoidea (bears, otters and weasels (mustelids), and seals and walruses (pinnipeds)). In the Zan topology, Ursidae grouped with Mustelidae in the Zan tree but instead was placed as basal to the entire clade containing the Arctoidea in the ST. The ST was identical to the carnivore species Zan tree (Figure 1 and Figure 10) with the exception between the families Mustelidae (Clade A) and Ursidae (Clade B) and within two families, Ursidae and Felidae. In Ursidae, U. americanus grouped with U. maritimus in a sister relationship in the Zan topology, but instead as basal to the entire Ursus clade in the ST. In Felidae, multiple incongruities were depicted between the following spp.: Leopardus, Lynx, Puma, Acinonyx, Herpailurus, Felis, and Prionailurus.
Order Primates—the ST was identical to the ordinal Zan tree for all primate family relationships. The primate species Zan tree and ST differed (Figure 1 and Figure 12) in two incongruencies, one within the Hominidae and the other within the Cercopithecidae. The first incongruity involved the placement of Gorilla as sister with Nomascus in the Catarrhini in the Zan tree; however, in the ST, Nomascus was placed as basal to Pongo and also to Gorilla. The second incongruity, found in the Cercopithecidae, involved several tangles between the Macaca spp. clade containing M. fascicularis, M. mulatta, and M. nemestrina, and within the clade containing Papio, Mandrillus, Theropithecus, Chlorocebus, and Cebus.
Order Rodentia—the ordinal Zan tree and ST (Figure 1 and Figure 13) were identical, with the exception between the families Gerbillidae and Cricetidae. In general, the topologies of the rodent species Zan tree and ST (Figure 1 and Figure 14) were identical except for tangles within the Rodentia topology centered on the placement of Meriones (basal to Cricetidae and to Muridae—Zan, or basal to Muridae—ST) and the relationship of three clades: Clade A—Mesocricetus and Cricetulus; Clade B—Onychomys, P. leucopus, and P. maniculatus; and Clade C—Myodes, Arvicola, M. ochrogaster, and M. oregoni.
3.2. Topology Statistical Comparisons
To determine if Zan gene phylogeny accurately reflected eutherian species phylogeny, we compared the Zan topology to that of a ST constructed from extensive gene sequence data that nevertheless contains many polytomies [28]. Parsimony analysis (PAUP* v4.0a166; Ref. [89]) yielded 55 candidate Zan trees, including one best tree (highest log likelihood) and 54 others, each of which was about equally less likely (Table S3). The Shimodaira–Hasegawa and Approximately Unbiased (AU) tests, with α values adjusted accordingly using the Bonferroni correction method, revealed that the global topology of the Zan tree differed (p = 0.0001, both tests) from a single best candidate tree constrained to the topology of the ST, presumably because the Zan tree is more fully resolved (Table S3). Parsimony analysis yielded single-best Zan topologies for the superorder Afrotheria and the seven orders with four or more species represented (Eulipotyphla, Carnivora, Cetartiodactyla, Chiroptera, Perissodactyla, Primates, and Rodentia; Table S4). The ordinal Zan topologies did not differ (AU test) from their respective ST topologies for orders in which the ST was well resolved (Eulipotyphla, p = 0.5; Cetartiodactyla, p = 0.5; Perissodactyla, p = 0.5; Primates, p = 0.21; and Rodentia, p = 0.38), but did differ for the superorder Afrotheria (p = 0.0026), as well as for orders with polytomies in the ST (Carnivora, p = 0.0005; Chiroptera, p < 0.0001; and Primates, p < 0.0001), consistent with the higher resolution of the Zan tree.
3.3. Divergence/Selection Comparisons
We globally evaluated the 170 species RNA sequence alignment for relative contributions of neutral evolution, negative selection, and positive selection (PAML test, Ref. [91]). The analysis detected intense (ω8 (dN/dS) = 8.49, f = 0.200) positive selection (PAML model M8; Table S5) and statistically supported positive selection at 205 of 1936 sites (10.6%) in the Zan coding region, with a Bayes Empirical Bayes posterior probability ≥0.95.
4. Discussion
We conclude that Zan sequences are remarkably informative and robust for a single character phylogenetic marker. A comprehensive comparison between the topologies at all taxonomic levels generated from Zan sequences and a supertree (ST) analysis revealed that the trees were strikingly congruent for most non-controversial and literature-supported mammalian relationships. Notably, Zan’s utility for resolving deep nodes in the eutherian phylogeny differed markedly from the generally poor deep node support observed for the other rapidly evolving genes examined, likely reflecting Zan’s unique contribution to speciation throughout the divergence of placental mammals. Indeed, where the Zan tree and ST were incongruous at both basal (ancient placental ordinal divergence) and terminal nodes (speciose taxon groups) in the mammalian tree, the Zan tree provided plausible and robust relationships, supported by other molecular studies. Many of these relationships are described below.
4.1. Tanglegram Comparisons
With only 9.26% incongruities between the Zan tree and ST across all taxonomic levels, the Zan tree is strikingly effective for a single character’s phylogeny. The phylogeny obtained from the analysis of 6 kb of Zan DNA sequences yielded stronger support across all levels of the topology with 95% of the nodes; in contrast, ST, constructed from an alignment with a five-fold more sequence data from 31 genes, contained fewer supported nodes and many unresolved polytomies [28].
Our results revealed that the Zan tree proved to be superior to prior studies in affirming not only previously proposed and supported mammalian relationships, but also many outstanding phylogenetic controversies across all taxonomic levels of the eutherian tree that have been traditionally difficult to resolve. In instances where Zan yielded better resolution or a plausible alternative hypothesis than did other contemporary studies (e.g., Ref. [28] and many others), those potential resolutions are discussed briefly below. Owing to limited taxon representation for orders Cingulata (n = 1), Pholidota (n = 1), Scandentia (n = 1), Dermoptera (n = 1), and Lagomorpha (n = 2), no comments were made regarding resolution below the taxonomic order.
4.1.1. Inter-Ordinal
Zan provided a near-complete resolution of higher-level phylogenetic relationships including the ancestral placental divergence, resolving relationships between and within mammalian superorders. The Zan tree resolved the placental ancestor group between Atlantogenata and Boreoeutheria [104], with both Afrotheria and Xenarthra (called Atlantogenata), and Laurasiatheria and Euarchontoglires (called Boreoeutheria) placed as sister taxa, a result consistent with that observed in many morphological and molecular studies [14,22,23,105,106,107,108,109,110] over the past 25 years.
Within Atlantogenata, the inter-ordinal relationships within the superorder Afrotheria have long been a controversial topic; however, afrotherian relationships were supported in the Zan tree, with members of Afrosoricida (tenrec group) placed as basal to a clade containing Tubulidentata (aardvarks), which was basal to two distinct sister clades, one containing members of Afrosoricida (golden mole group) and Hyracoidea (hyraxes) and the other containing Sirenia (manatees) and Proboscidea (elephants). A representative of Macroscelidea (elephant shrews) was not available, so we cannot comment on placement of that group. The Zan topology largely agreed with other studies in the literature, with the exception of the family Tenrecidae as basal to the afrotherian clade and the lack of support for the clade Paenungulata (Sirenia, Hyracoidea, and Proboscidea). Other molecular studies have instead found the families Tenrecidae and Chrysochloridae placed as a monophyletic group, along with the family Macroscelididae (within Macroscelidea). Unfortunately, no morphological dataset has substantiated the grouping of the afrotherian taxa as a monophyly, presumably due to the overwhelming biodiversity among this group; however, some chromosome and molecular datasets have shown support to validate the relationships within such a diverse group of ancient mammals [110,111,112]. For example, when representatives of Macroscelidea (elephant shrews) are absent from molecular analyses, as is the case for this Zan analysis, Afrosoricida and Tubulidentata are supported as sister taxa [14,15,38,113,114], along with a supported grouping of the entire clade Paenungulata [14,15,20,38,44,115]. In contrast, an alternative sister relationship has been supported between Tubulidentata and Macroscelidea to the exclusion of Afrosoricida, based on a milestone, albeit controversial, phylogenomic study [116]. Owing to consistent discrepancies and a lack of resolution within the afrotherian group and even support for the dissolvement of the entire group [1,4,93,98], more studies are required, especially ones whose aim is to delve into these incongruencies with better species representation or alternatively including a broader application of other data, including divergence data, fossils, etc. For the sister superorder of Afrotheria, Xenarthra, only one species was available (Dasypus novemcinctus) in our Zan topology; therefore, we did not comment on the inter-ordinal relationships within Xenarthra. However, further studies would require more species representation of this group for complete resolution of the superorder as a member of Atlantogenata and as a monophyletic group.
In contrast, Boreoeutheria represents a well-supported monophyletic group containing the sister superorders Laurasiatheria and Euarchontoglires using both morphologic and molecular data [103,117,118,119]. However, relationships within Laurasiatheria and Euarchontoglires have been historically difficult to resolve, primarily because no single character or combination of characters succinctly unites each group [19]. The Zan topology yielded Laurasiatheria as a supported monophyletic group with Eulipotyphla as the basal-most clade, followed by two clades, one containing the Chiroptera along with the ungulate groups, Perissodactyla, and Cetartiodactyla, and the other clade containing the Ferae (Pholidota and Carnivora). The Zan topology yielded Euarchontoglires as a supported monophyletic group with Dermoptera as the basal-most order, followed by Scandentia, and then followed by Primates as a sister Order to the Glires (Lagomorpha and Rodentia). Studies using whole mitochondrial genome sequencing, a combination of nuclear and mitochondrial genes, and genomic sequences have resolved various relationships between each superorder [26,32,96,103,118,119,120], largely except for the placement of Chiroptera relative to Carnivora and the ungulate groups, the position of Scandentia relative to Dermoptera and Primates, and the position of Glires relative to Scandentia, Dermoptera, and Primates [121,122,123].
Though better resolved as a distinct clade when compared to its sister superorder Laurasiatheria, Euarchontoglires still yields few phylogenetic markers to corroborate delineation of the group [17,124,125,126]. Euarchonta, a clade encompassing the Scandentia, Dermoptera, and Primates, has exhibited strong support as a monophyletic group with many molecular studies, including ultra-conserved and transposable elements [15,99,127,128]. A few alternative hypotheses have instead included Scandentia as a sister to the Glires, which contains the Lagomorpha and Rodentia [1,129]. As a general consensus, a sister relationship is evident between Primates and both Dermoptera and Scandentia, with the latter placed as the basal-most taxon in most studies thus far, consistent with Zan sequences [15,93,127,128,130]. Many studies have not discussed the position of Dermoptera relative to Scandentia, and the latter has traditionally been placed as a sister taxon to Glires (Lagomorpha and Rodentia, Ref. [44], our study), a sister to Primatomorpha (Dermoptera and Primates, Ref. [129]), a sister to Dermoptera [130], or as basal to the entire superorder [1]. In addition, despite many molecular studies centered on the Primates–Dermoptera–Lagomorpha–Rodentia clade, presumably due to our anthropomorphic interest in Primates phylogenetic relationships, discrepancies remain regarding the precise relationship between Primates, Dermoptera, and Rodentia [124,131] and between Rodentia and Lagomorpha (Glires—Refs. [100,101,132]).
Within Laurasiatheria, the basal-most order, Eulipotyphla, has been suggested as such by many morphologic and molecular studies. Once characterized as a controversial (now invalid) and polyphyletic order, Lipotyphla, comprising the “Insectivora” clade, Eulipotyphla now includes the family Talpidae and groups basal to a clade of sister families Erinaceidae and Soricidae, as shown in the Zan phylogeny and other molecular studies, including fossil calibration data [133,134].
Rapid diversification within Chiroptera or partial taxon representation in most molecular and morphological studies have presumably caused the lack of deeper resolution for the placement of Chiroptera relative to other boreoeutherian orders [135,136,137,138]. Our results affirm the monophyly of Chiroptera within Laurasiatheria [42,139], and the position of Chiroptera as a sister to the Perissodactyla (with Cetartiodactyla as the basal taxon). The relationship between Chiroptera and Perissodactyla has been debated, with morphological data [8] supporting the clade Ungulata, which includes the Cetartiodactyla, Tubulidentata, Proboscidea, Sirenia, and Hyracoidea. Subsequent molecular studies divided the Ungulata clade into Afrotheria and Laurasiatheria [14,15,38], which has been upheld; however, the position of Perissodactyla within Laurasiatheria remains ambiguous with all four orders (Carnivora, Pholidota, Perissodactyla, and Cetartiodactyla) forming the clade Fereuungulata, to the exclusion of Chiroptera. The placement of the chiropteran order itself has also been controversial, with morphological studies placing Chiroptera within the previously long standing clade Archonta, which encompasses Primates, Dermoptera, Scandentia, and Chiroptera [8,11,26,96]. Molecular studies reject the placing of Chiroptera within Archonta and instead place it within Laurasiathera, either as closely related to Fereuungulata [140] or as representatives within the now monophyletic Eulipotyphla group [141,142].
4.1.2. Intra-Ordinal
Chiroptera—relationships recovered by Zan topology revealed a basal split between the Yangochiroptera Old World bats and the Yinpterochiroptera New World bats, each supported as monophyletic groups, consistent with current molecular evidence [136,143,144,145]. Each of the family-level and species-level relationships were nearly all supported by Zan with the exception of the relationship between the Minopteridae and Vespertilionidae and also at the species-level between the Myotis spp. included in the Zan study. Most likely, the inclusion of more taxa from these representative chiropteran families would provide increased resolution in future studies.
Cetartiodactyla—relationships, including the clades Cetacea (aquatic whales and dolphins) and Artiodactyla (terrestrial even-toed ungulates), have historically been moderately controversial, primarily at the species level [2,3,4,26,28,102,146]. The Zan phylogeny recovered a distinct delineation and supported monophyletic grouping between the historical clades Cetacea and Artiodactyla. Within the supported Artiodactyla families, Camelidae is the basal-most taxon, followed by Suidae, and a clade containing the sister taxa Cervidae and Bovidae. Within the also supported Cetacea families, Balaenopteridae is the basal-most taxon, followed by Physeteridae, Lipotidae, Delphinidae, and a clade containing the sister taxa Phocoenidae and Monodontidae. All of the relationships within both Cetacea and Artiodactyla, as indicated in the Zan topology, have been recovered with many other molecular studies. Consistent with the trend in other studies, relationships within Cetartiodactyla families, such as in Camelidae, Bovidae, and Delphinidae, have been difficult to resolve with the presence of many polytomies and contradictory information; it may be that inclusion of more taxa within these families and within genera is required for greater resolution. Related to that, it is also highly likely that many of the species within these families are very closely related, e.g., Camelus spp. and Bos spp., and therefore more time since divergence is required for greater resolution.
Carnivora—all family-level relationships were supported in the Zan topology, with a new and plausible basal carnivore phylogenetic hypothesis. The Carnivora Zan tree initially split with the family Canidae as the basal-most taxon, followed by a divergence event between the remaining Canoidea (canid-like forms) and Feloidea (felid-like forms). Within the Canoidea, two distinct clades diverged, one including the sister families Mustelidae and Ursideae and the other including Phocidae as the basal-most family followed by a sister clade of the families Odobenidae and Otariidae. Finally, the Feloidea consisted of the Felidae family as the basal-most taxon followed by a clade of the sister families Hyaenidae and Herpestidae. The initial basal split of the Canidae family from the remaining members of the Carnivore order is an exciting finding new to science, and even though the Canidae family is the typical basal-most family of the Canoidea group, the absence of a sister relationship with the Feloidea group remains a phylogenetic relationship that needs to be further studied [27,28,147,148]. The remaining family-level relationships within Carnivora provided by the Zan topology were consistent with other morphologic and molecular studies, despite the moderately controversial issues regarding the grouping of the clade Pinnepedia (families Phocidae, Odobenidae, and Otariidae) with the Arctoidea clade (families Mustelidae and Ursidae), the placement of the Odobenidae family as either a sister to Otariidae or Phocidae, and the grouping of the families Procyonidae, Herpestidae, and Mephitidae as a monophyletic clade [1,28,105,147,149,150,151,152]. Zan sequences were not available for representatives of the families Procyonidae and Mephitidae; therefore, we cannot comment on these mammalian groups. Resolution within Carnivora, both at the family- and species-level, has proven to be a systematically challenged clade for decades to the present day [147,153,154,155], presumably due in large part to the felids’ rapid diversification. In addition, large gaps remain in the carnivore tree, especially in the families Herpestidae, Mephitidae, Procyonidae, and various others [114,156]. Due to the intense and quick radiation and diversification within the carnivore group, an increased taxon sampling scheme (i.e., including representative species belonging to all families and genera) is required for more complete resolution.
Primates—the Zan topology revealed complete resolution of the Primates family-level tree, with an initial basal split between the Catarrhini Old World primates and the Platyrrhini New World primates. Within the Catarrhini families, Galagidae was the basal-most taxon, followed by the Indriidae, and a clade containing the sister families Lemuridae and Cheirogalagidae. Within the Platyrrhini families, Tarsiidae was the basal-most taxon followed by another split generating two clades, one containing Callitrichidae as basal to Aotidae and Cebidae, and another clade containing Cercopithecidae as basal to Hylobatidae and Hominidae. Similar to the other mammalian orders mentioned above, each of these familial-level relationships recovered is consistent with other morphologic and molecular studies. At the species-level, Zan revealed disagreeing relationships primarily within the families Hylobatidae and Hominidae, presumably because Zan sequences were only available for one species representative (of Hylobatidae), and Cercopithecidae. The spurious grouping of Nomascus with Gorilla probably reflects the availability of Zan sequences from only one member of the family Hylobatidae, and Gorilla was the most closely related taxon available. In fact, the level of Zan sequence divergence between many of these primate species equals <1.00% (Roberts et al. unpublished data), among other hybridizing species included in this study. Coincident with this finding, Primates phylogenetic relationships have long been hampered due to the rapid diversification of species, especially within highly speciose families like Cercopithecidae, and because of rampant historical and contemporary hybridization between various species of primates [157,158,159].
Rodentia—a near-complete resolution of the family-level relationships was recovered in the Zan topology with the exception of the placement of Sciuromorpha relative to Hystricomorpha and the remaining superorders. This finding may be due to only 170 Zan sequences being available for use in our study. The initial basal split in Rodentia recovered one clade of Sciuromorpha and Hystricomorpha as sister taxa and the other clade containing Castorimorpha and Myomorpha. No Zan sequences were available for the suborder Anomaluromorpha, so we cannot comment on the placement of that group within Rodentia. Within Hystricomorpha, the families Caviidae, Chinchillidae, and Octodontidae formed a monophyletic group with Caviidae as the most-basal group, and the families Heterocephalidae and Bathyergidae formed a sister relationship. Though considerable support exists for the relationships within Hystricomorpha, there is longstanding and continual controversy centered on this suborder. In fact, several studies have even postulated that members of the Hystricomorpha group, namely the family Caviidae (guinea pig), are not even rodents, based on morphologic and several molecular datasets [160,161,162,163]. Many morphologic and molecular studies also disagree on the basal-most group of rodents, either Hystricomorpha or Sciuromorpha [4,26,30,163]. Phylogenetic relationships within the remaining suborders Castorimorpha and Myomorpha were recovered in the Zan phylogeny, with only one Castorimorpha family, Heteromyidae, placed as basal to the Myomorpha families Dipodidae, Spalacidae, Gerbillidae, Cricetidae, and Muridae. Within the suborder Myomorpha, the family Dipodidae was placed as the basal-most taxon, followed by Spalacidae, followed by a clade of Gerbillidae as basal to a sister group of Cricetidae and Muridae, consistent with various other comprehensive studies [30,164,165,166]. At both the family- and species-levels, the relationship and position of gerbils relative to the families Cricetidae and Muridae has long been discordant based on morphologic and molecular characters [167,168] and continues to be a controversy among the rodents. However, the Zan sequences provided herein support the hypothesis that gerbils should be recognized as a separate family, within Myomorpha and basal to the families Cricetidae and Muridae. Impressively, based on Zan sequences, all species-level relationships within Rodentia were supported and consistent with other studies (listed above).
4.1.3. Resolving Controversial Relationships
Of the 39 tangles present between the Zan and ST topologies, at least 9 of them reflected incongruities among closely related taxa and, more interestingly, 11 involved species known to hybridize (Myotis, Camelus, and Macaca). For example, the genus Myotis contains species that have consistently been shown to have rather undifferentiated morphologies, and species often share many of the same characters (morphologically and genetically). More species, and perhaps more individuals of those representative species (much more than the four Myotis species included herein), are required to delineate relationships among this group [169]. Another example of tangles that may represent a “tangle in speciation” is found within the primates. Natural hybridization has been revealed to be common among African cercopithecines (species within Papio, Macaca, and Theropithecus) based on a plethora of morphological and genetic studies and anecdotal field reports of hybrid monkeys and documented cases of persistent hybrid zones [170]. Further, camels traditionally have held a substantial cultural, economic, and biological importance for humans, and therefore ambiguities exist in relationships among Camelus spp. primarily due to the longstanding breeding, trading, and translocation practices of individuals for thousands of years [171,172,173]. Camel species commonly interbreed, and subsequent hybrid individuals and their offspring are fertile [174]. Similar to Camelus spp., closely related species in the Bovidae family can freely interbreed and are known to be at varying stages of speciation due to anthropogenic-driven factors, such as intense artificial selection (Bison bison, Bos taurus, Bos indicus, Bos mutus, Bos grunniens, etc.; [175]). Typically, Bos spp. are distinguished based solely on morphological characters; however, recently, both nuclear and mitochondrial DNA have been used to delineate between species, with varying results [176,177]. Although these characters may have driven the initial divergence of Bos spp., eventually Zan divergence will render the process of speciation irreversible.
In addition, more than half of the 39 tangles between the Zan topology and ST reflected taxa that typically are not well represented or are controversial in most gene, multi-gene, and ST analyses. Our Zan analysis provided more robust support for monophylies within most speciose and, accordingly, some of the most controversial phylogenetic groups, including Chiroptera, Carnivora, Primates, and Rodentia, which is otherwise a considerable challenge for any single character genetic analysis. Other studies, including large combinatorial datasets, have instead wrestled with disparate phylogenies and often large polytomies [1,27,28,178].
4.1.4. Zan as a Speciation Gene Phylogenetic Marker
Characters involved in adaptative evolution tend to be misleading phylogenetic markers, as they are often lineage- or site-specific and only informative in certain taxa, e.g., characters involved in herbivore metabolism or bat echolocation [36,179,180,181]. Phylogenies generated from these types of datasets often only answer taxon- and system-dependent questions and can be affected by incongruent generation times (new mutations’ rate depends on the number of generations past rather than the time elapsed; Ref. [182]) and population size (drift and other evolutionary processes are stronger within smaller populations; Ref. [183]). Further, species-specific differences are inherently taxon-dependent and can obscure taxonomic relationships and phylogenetic relationships among groups of organisms. For example, these processes can involve sexual selection, modifications in metabolism and reproduction, selection pervasiveness, intensity changes along a lineage, and modifications in protein structure, function, and evolution.
Considering that evolution of a gene product is likely to reflect the selection-driven divergence of a particular function (such as retinoid-binding genes (the retina visual cycle); cytochrome gene metabolism; rRNA genes (RNA translation at the ribosome)) rather than overall species divergence, Supertree phylogenies typically omit genes subjected to selection, and instead include large numbers of neutrally evolving genes [184,185]. Further, similar to single character comparisons, single gene comparisons are phylogenetically unreliable, as an individual gene’s divergence necessarily reflects the potentially lineage-specific function of the gene product. Consequently, such “incomplete lineage sorting” can confound single gene phylogenies. Nevertheless, hypothetically, the divergence of a gene that disproportionately contributes to species divergence, and thus necessarily tracks speciation events, could serve as a valid phylogenetic marker. Accordingly, as a speciation gene [61], Zan has the potential to be a more informative and valid single gene marker of mammalian phylogeny than other neutrally evolving genes that only serve as molecular clocks. Indeed, as the function of Zan is to promote reproductive isolation regardless of whether speciation occurs sympatrically, peripatrically, allopatrically, etc., its divergence should necessarily reflect speciation independent of other selective pressures that also drive species divergence. For example, a widely dispersed ancestral population would, owing to rapid Zan evolution, likely harbor an uneven distribution of Zan alleles consistent with an ongoing contribution of Zan evolution to incipient speciation events. When geographic isolation (e.g., from a glacial event) splits the ancestral population, the pre-existing Zan alleles would sort randomly into the newly separated populations, with different allelic frequencies. Then, within these geographically isolated populations, Zan would continue to evolve as a speciation gene concordant with the further divergence of the populations into new species. Thus, by continually driving prezygotic reproductive isolation, Zan sequence divergence would reflect the onset and progression of speciation irrespective of other contributing factors, and thus would be expected to sort true to lineage.
Speciation events do not always generate complete reproductive isolation. Little is known regarding the transition from partial to strong reproductive isolation and the completion of speciation. Moreover, in mammals, many genera exhibit inter-specific hybridization and introgression (e.g., species of Papio, Macaca, Theropithecus, Camelus, and Bos, as mentioned above), which suggests these speciation events do not cause a directional divergence in reproduction-driven speciation genes such as Zan.
Zan produced a notably more resolved and strongly supported phylogeny than that produced by the supertree obtained from many genes [28]. What should the criteria be for accepting a single gene phylogeny over a widely established supertree? Three observations bear on this question. First, previous studies [61] constraining the Zan topology to a supertree topology [27] revealed that the Zan phylogeny is significantly different, presumably because the Zan tree is more fully resolved and the supertree contains many polytomies particularly at the more terminal nodes [37]. Second, in situations where the supertree was unable to resolve polytomies at both the basal and terminal nodes, the Zan phylogeny recovered a plausible and supported topological hypothesis, consistent with a majority of other molecular studies. Third, there currently is substantial evidence that Zan is a speciation gene and therefore successfully tracks species divergence events across taxonomic levels [61,62,63]. Therefore, it may be that DNA sequences from the Zan gene can ultimately serve as a means for the resolution and refinement of the genetic mammalian species tree, especially when researching clades that are at varying divergence levels and with varying degrees of taxon sampling.
5. Conclusions
We conclude that Zan, a rapidly evolving speciation gene encoding a gamete recognition molecule, is a remarkably informative genetic marker capable of resolving controversial relationships spanning all taxonomic levels of the eutherian tree of life. This study represents a contemporary and necessary addition to the field of mammalian phylogenetics, offering a unique and robust phylogenetic perspective with the use of a gamete recognition gene. Analysis of the Zan gene not only reaffirmed established taxonomic relationships throughout placental mammals, but also introduces new and valuable insights, particularly concerning taxa in various mammalian orders, which have posed historical challenges in phylogenetic studies.
The outcomes of this study bear significance for mammalian taxonomy and systematics, providing a robust foundation for future research. What will be required to further assess the utility and possible limitations of Zan as a molecular marker, and describe species divergence events across all taxonomic levels? At a minimum, such studies must: (1) include all mammalian orders and a more extensive assortment and number of species, (2) test the recovery of lower taxonomic-level delineations by incorporating several pairs of sister taxa in the most speciose genera (i.e., Mus, Peromyscus, Myotis, and Rhinolophus; Ref. [103]), and (3) bolster Zan’s phylogenetic utility by incorporating various types of phylogenetically informative data (fossils, divergence dating, other genes, etc.). Ultimately, Zan may prove to be the preeminent molecular marker that defines genetic species.
Supplementary Materials
The following supporting information can be downloaded at: https://www.mdpi.com/article/10.3390/d15111145/s1, Figure S1: Phylogenetic analysis of Zan DNA sequence divergence; Figure S2: Comparison of protein zonadhesin sequences and pairwise sequence identities from 17 species representing 17 of the 19 placental Orders; Table S1: Global and ordinal nucleotide substitution models for Zan; Table S2: Orders with limited taxon representation and therefore no tanglegrams, and taxonomic designations of included species, listed Xenarthra > Afrotheria > Laurasiatheria > Euarchontoglires; Table S3: Global phylogenetic comparisons by Shimodaira–Hasegawa (SH) and adjusted unbiased (AU) tests for Zan. Table S4: Ordinal phylogenetic comparisons via Shimodaira–Hasegawa (SH) and Approximately Unbiased (AU) tests for Zan; Table S5: PAML summary results for Zan; Detailed Results.
Author Contributions
Conceptualization, E.K.R., E.A.W., D.M.H. and R.D.B.; Data curation, E.K.R., E.A.W., A.E.W., D.M.H. and R.D.B.; Formal analysis, E.K.R., E.A.W., D.M.H. and R.D.B.; Funding acquisition, D.M.H. and R.D.B.; Investigation, E.K.R., E.A.W., D.M.H. and R.D.B.; Methodology, E.K.R., E.A.W., D.M.H. and R.D.B.; Project administration, E.K.R., D.M.H. and R.D.B.; Resources, D.M.H. and R.D.B.; Software, D.M.H. and R.D.B.; Supervision, D.M.H. and R.D.B.; Validation, E.K.R., E.A.W., D.M.H. and R.D.B.; Visualization, E.K.R., E.A.W., A.E.W., D.M.H. and R.D.B.; Writing—original draft, E.K.R., E.A.W., D.M.H. and R.D.B.; Writing—review and editing, E.K.R., E.A.W., A.E.W., D.M.H. and R.D.B. All authors have read and agreed to the published version of the manuscript.
Funding
This research received no external funding.
Institutional Review Board Statement
Not applicable.
Data Availability Statement
The datasets generated and analyzed for this study can be found in the Dryad Database, https://doi.org/10.5061/dryad.k3j9kd5ch (accessed on 21 March 2023).
Acknowledgments
We would like to thank the Texas Tech University High Performance Computing Center, especially Misha Ahmadian, for providing bioinformatics support. We would also like to thank R.L. Honeycutt, J.J. Bull, D.J. Schmidly, C.D. Phillips, M.R. Mauldin, M.S. Keith, Nicté Ordoñez-Garza, C.D. Dunn, R.N. Platt II, T.J. Soniat, L.L. Lindsey, and J.Q. Francis for their research assistance and conceptualization throughout various aspects of the project.
Conflicts of Interest
The authors declare no conflict of interest.
References
- Meredith, R.W.; Janecka, J.E.; Gatesy, J.; Ryder, O.A.; Fisher, C.A.; Teeling, E.C.; Goodbla, A.; Eizirik, E.; Simão, T.L.L.; Stadler, T.; et al. Impacts of the Cretaceous Terrestrial Revolution and KPg extinction on mammal diversification. Science 2011, 334, 521–524. [Google Scholar] [CrossRef]
- dos Reis, M.; Inoue, J.; Hasegawa, M.; Asher, R.J.; Donoghue, P.C.; Yang, Z. Phylogenomic datasets provide both precision and accuracy in estimating the timescale of placental mammal phylogeny. Proc. R. Soc. B 2012, 279, 3491–3500. [Google Scholar] [CrossRef]
- Song, S.; Liu, L.; Edwards, S.V.; Wu, S. Resolving conflict in eutherian mammal phylogeny using phylogenomics and the multispecies coalescent model. Proc. Natl. Acad. Sci. USA 2012, 109, 14942–14947. [Google Scholar] [CrossRef]
- O’Leary, M.A.; Bloch, J.I.; Flynn, J.J.; Gaudin, T.J.; Giallombardo, A.; Giannini, N.P.; Goldberg, S.L.; Kraatz, B.P.; Luo, Z.; Meng, J.; et al. The placental mammal ancestor and the post-KPg radiation of placentals. Science 2013, 339, 662–667. [Google Scholar] [CrossRef] [PubMed]
- Springer, M.S.; Meredith, R.W.; Teeling, E.C.; Murphy, W.J. Technical comment on ‘The placental mammal ancestor and the post-KPg radiation of placentals’. Science 2013, 341, 613. [Google Scholar] [CrossRef] [PubMed]
- Springer, M.S.; Gatesy, J. The gene tree delusion. Mol. Phy. Evol. 2016, 94, 1–33. [Google Scholar] [CrossRef] [PubMed]
- Simpson, G.G. The Principles of Classification and a Classification of Mammals; American Museum of Natural History: New York, NY, USA, 1945; Volume 85. [Google Scholar]
- Shoshani, J.; McKenna, M.C. Higher Taxonomic Relationships among Extant Mammals Based on Morphology, with Selected Comparisons of Results from Molecular Data. Mol. Phy. Evol. 1998, 9, 572–584. [Google Scholar] [CrossRef]
- Novacek, M.J.; Wyss, A.R.; McKenna, M.C. The major groups of Eutherian mammals. In The Phylogeny and Classification of the Tetrapods; Benton, M.J., Ed.; Clarendon Press: Oxford, UK, 1988; Volume 2, pp. 31–71. [Google Scholar]
- Novacek, M.J. Higher mammal phylogeny: The morphological-molecular synthesis. In The Hierarchy of Life; Fernholm, B., Bremer, K., Jornvall, H., Eds.; Elsevier: Amsterdam, The Netherlands, 1989; pp. 421–435. [Google Scholar]
- Novacek, M.J. Mammalian phylogeny: Shaking the tree. Nature 1992, 356, 121–125. [Google Scholar] [CrossRef]
- MacPhee, R.D.E.; Novacek, M.J. Definition and relationships of Lipotyphla. In Mammal Phylogeny: Placentals; Szalay, F.S., Novacek, M.J., McKenna, M.C., Eds.; Springer: New York, NY, USA, 1993; pp. 13–31. [Google Scholar]
- Gaudin, T.J.; Wible, J.R.; Hopson, J.A.; Turnbull, W.D. Reexamination of the morphological evidence for the cohort Epitheria (Mammalia, Eutheria). J. Mamm. Evol. 1996, 3, 31–79. [Google Scholar] [CrossRef]
- Madsen, O.; Scally, M.; Douady, C.J.; Kao, D.J.; DeBry, R.W.; Adkins, R.; Amrine, H.M.; Stanhope, M.J.; de Jong, W.W.; Springer, M.S. Parallel adaptive radiations in two major clades of placental mammals. Nature 2001, 409, 610–614. [Google Scholar] [CrossRef]
- Murphy, W.J.; Eizirik, E.; Johnson, W.E.; Zhang, Y.P.; Ryder, O.A.; O’Brien, S.J. Molecular phylogenetics and the origins of placental mammals. Nature 2001, 409, 614–618. [Google Scholar] [CrossRef]
- Springer, M.S.; Cleven, G.C.; Madsen, O.; de Jong, W.W.; Waddell, V.G.; Amrine, H.M.; Stanhope, M.J. Endemic African mammals shake the phylogenetic tree. Nature 1997, 388, 61–64. [Google Scholar] [CrossRef] [PubMed]
- De Jong, W.W.; van Dijk, M.A.M.; Poux, C.; Kappé, G.; van Rheede, T.; Madsen, O. Indels in protein-coding sequences of Euarchontoglires constrain the rooting of the eutherian tree. Mol. Phy. Evol. 2003, 28, 328–340. [Google Scholar] [CrossRef] [PubMed]
- Stanhope, M.J.; Waddell, V.G.; Madsen, O.; de Jong, W.W.; Hedges, S.B.; Cleven, G.C.; Kao, D.; Springer, M.S. Molecular evidence for multiple origins of Insectivora and for a new order of endemic African insectivore mammals. Proc. Natl. Acad. Sci. USA 1998, 95, 9967–9972. [Google Scholar] [CrossRef] [PubMed]
- Waddell, P.J.; Okada, N.; Hasegawa, M. Towards resolving the interordinal relationships of placental mammals. Syst. Biol. 1999, 48, 1–5. [Google Scholar] [CrossRef] [PubMed]
- Amrine-Madsen, H.; Koepfli, K.P.; Wayne, R.K.; Springer, M.S. A new phylogenetic marker, apoliprotein B, provides compelling evidence for eutherian relationships. Mol. Phylogenet. Evol. 2003, 28, 225–240. [Google Scholar] [CrossRef]
- Nishihara, H.; Hasegawa, M.; Okada, N. Pegasoferae, an unexpected mammalian clade revealed by tracking ancient retroposon insertions. Proc. Natl. Acad. Sci. USA 2006, 103, 9929–9934. [Google Scholar] [CrossRef]
- Hallstrom, B.; Kullberg, M.; Nilsson, M.A.; Janke, A. Phylogenomic data analyses provide evidence that Xenarthra and Afrotheria are sister groups. Mol. Biol. Evol. 2007, 24, 2059–2068. [Google Scholar] [CrossRef]
- Wildman, D.E.; Uddin, M.; Opazo, J.C.; Liu, G.; Lefort, V.; Guindon, S.; Gascuel, O.; Grossman, L.I.; Romero, R.; Goodman, M. Genomics, biogeography, and the diversification of placental mammals. Proc. Natl. Acad. Sci. USA 2007, 104, 14395–14400. [Google Scholar] [CrossRef]
- Asher, R.J.; Bennett, N.; Lehmann, T. The new framework for understanding placental mammal evolution. Bioessays 2009, 31, 853–864. [Google Scholar] [CrossRef]
- Liu, F.G.R.; Miyamoto, M.M.; Freire, N.P.; Ong, P.Q.; Tennant, M.R.; Young, T.S.; Gugel, K.F. Molecular and morphological supertrees for eutherian (placental) mammals. Science 2001, 291, 1786–1789. [Google Scholar] [CrossRef]
- Beck, R.M.D.; Bininda-Emonds, O.R.P.; Cardillo, M.; Liu, F.; Purvis, A. A higher-level MRP supertree of placental mammals. BMC Evol. Biol. 2006, 6, 93. [Google Scholar] [CrossRef]
- Bininda-Emonds, O.R.P.; Cardillo, M.; Jones, K.E.; MacPhee, R.D.E.; Beck, R.M.D.; Grenyer, R.; Price, S.A.; Vos, R.A.; Gittleman, J.L.; Purvis, A. The delayed rise of present-day mammals. Nature 2007, 446, 507–512. [Google Scholar] [CrossRef]
- Upham, N.S.; Esselstyn, J.A.; Jetz, W. Inferring the mammal tree: Species-level sets of phylogenies for questions in ecology, evolution, and conservation. PLoS Biol. 2019, 17, e3000494. [Google Scholar] [CrossRef] [PubMed]
- Murphy, W.J.; Pevzner, P.A.; O’Brien, S.J. Mammalian phylogenomics comes of age. Tren. Genet. 2004, 20, 631–639. [Google Scholar] [CrossRef] [PubMed]
- Fabre, P.; Hautier, L.; Dimitrov, D.; Douzery, E.J.P. A glimpse on the pattern of rodent diversification a phylogenetic approach. BMC Evol. Biol. 2012, 12, 88. [Google Scholar] [CrossRef] [PubMed]
- Halliday, T.J.D.; Upchurch, P.; Goswami, A. Resolving the relationships of Paleocene placental mammals. Biol. Rev. 2015, 92, 521–550. [Google Scholar] [CrossRef] [PubMed]
- Springer, M.S.; Stanhope, M.J.; Madsen, O.; de Jong, W.W. Molecules consolidate the placental mammal tree. Tren. Ecol. Evol. 2004, 19, 430–438. [Google Scholar] [CrossRef]
- Springer, M.S.; Murphy, W.J.; Eizirik, E.; Madsen, O.; Scally, M.; Douady, C.J.; Teeling, E.C.; Stanhope, M.J.; de Jong, W.W.; O’Brien, S.J. A molecular classification for the living orders of placental mammals and the phylogenetic placement of primates. In Primate Origins: Adaptations and Evolution; Springer: Boston, MA, USA, 2007; pp. 1–28. [Google Scholar]
- Huelsenbeck, J.P.; Bull, J.J.; Cunningham, C.W. Combining data in phylogenetic analysis. Tren. Ecol. Evol. 1996, 11, 152–158. [Google Scholar] [CrossRef]
- Paradis, E. Analysis of diversification: Combining phylogenetic and taxonomic data. Proc. R. Soc. Lond. B 2003, 270, 2499–2505. [Google Scholar] [CrossRef]
- Hahn, M.W.; Nakhleh, L. Irrational exuberance for resolved species trees. Evolution 2015, 70, 7–17. [Google Scholar] [CrossRef]
- Stadler, T.; Bokma, F. Estimating speciation and extinction rates for phylogenies of higher taxa. Syst. Biol. 2013, 62, 220–230. [Google Scholar] [CrossRef] [PubMed]
- Murphy, W.J.; Eizirik, E.; O’Brian, S.J.; Madsen, O.; Scally, M.; Douady, C.J.; Teeling, E.; Ryder, O.A.; Stanhope, M.J.; de Jong, W.E.; et al. Resolution of the Early Placental Mammalian Radiation Using Bayesian Phylogenetics. Science 2001, 294, 2348–2351. [Google Scholar] [CrossRef] [PubMed]
- Scally, M.; Madsen, O.; Douady, C.J.; de Jong, W.W.; Stanhope, M.J.; Springer, M.S. Molecular evidence for the major clades of placental mammals. J. Mamm. Evol. 2001, 8, 239–277. [Google Scholar] [CrossRef]
- Delsuc, F.; Scally, M.; Madsen, O.; Stanhope, M.J.; de Jong, W.W.; Catzeflis, F.M.; Springer, M.S.; Douzery, E.J.P. Molecular phylogeny of living Xenarthrans and the impact of character and taxon sampling on the placental tree rooting. Mol. Biol. Evol. 2002, 19, 1656–1671. [Google Scholar] [CrossRef]
- Springer, M.S.; Murphy, W.J.; Eizirik, E.; O’Brien, S.J. Placental mammal diversification and the Cretaceous-Tertiary boundary. Proc. Natl. Acad. Sci. USA 2003, 100, 1056–1061. [Google Scholar] [CrossRef]
- Springer, M.S.; DeBry, R.W.; Amrine, H.M.; Madsen, O.; de Jong, W.W.; Stanhope, M.J. Mitochondrial versus nuclear gene sequences in deep-level mammalian phylogeny reconstruction. Mol. Biol. Evol. 2001, 18, 132–143. [Google Scholar] [CrossRef]
- Tarver, J.E.; dos Reis, M.; Mirarab, S.; Moran, R.J.; Parker, S.; O’Reilly, J.E.; King, B.L.; O’Connell, M.J.; Asher, R.J.; Warnow, T.; et al. The interrelationships of placental mammals and the limits of phylogenetic inference. Gen. Biol. Evol. 2016, 8, 330–344. [Google Scholar] [CrossRef]
- Foley, N.M.; Springer, M.S.; Teeling, E.C. Mammal madness: Is the mammal tree of life not yet resolved? Phil. Trans. R. Soc. B 2016, 371, 20150140. [Google Scholar] [CrossRef]
- Novacek, M.J. Fossils, topologies, missing data, and the higher level phylogeny of Eutherian mammals. Syst. Biol. 1992, 41, 58–73. [Google Scholar] [CrossRef]
- Swanson, W.J.; Yang, Z.; Wolfner, M.F.; Aquadro, C.F. Positive Darwinian selection drives the evolution of several female reproductive proteins in mammals. Proc. Natl. Acad. Sci. USA 2001, 98, 2509–2514. [Google Scholar] [CrossRef]
- Torgerson, D.G.; Kulathinal, R.J.; Singh, R.S. Mammalian Sperm Proteins Are Rapidly Evolving: Evidence of Positive Selection in Functionally Diverse Genes. Mol. Biol. Evol. 2002, 19, 1973–1980. [Google Scholar] [CrossRef] [PubMed]
- Sabeti, P.C.; Schaffner, S.F.; Fry, B.; Lohmueller, J.; Varilly, P.; Shamovsky, O.; Palma, A.; Mikkelsen, T.S.; Altshuler, D.; Lander, E.S. Positive natural selection in the human lineage. Science 2006, 312, 1614–1620. [Google Scholar] [CrossRef]
- Resch, A.M.; Carmel, L.; Mariño-Ramírez, L.; Ogurtsoc, A.Y.; Shabalina, S.A.; Rogozin, I.B. Widespread Positive Selection in Synonymous Sites of Mammalian Genes. Mol. Biol. Evol. 2007, 24, 1821–1831. [Google Scholar] [CrossRef] [PubMed]
- Massey, S.E.; Churbanov, A.; Tastogi, S.; Liberles, D.A. Characterizing positive and negative selection and their phylogenetic effects. Gene 2008, 418, 22–26. [Google Scholar] [CrossRef] [PubMed]
- Koisol, C.; Vinař, T.; da Fonseca, R.R.; Hubisz, M.J.; Bustamante, C.D.; Nielsen, R.; Siepel, A. Patterns of Positive Selection in Six Mammalian Genomes. PLoS Genet. 2008, 4, e1000144. [Google Scholar] [CrossRef]
- Pollard, K.S.; Hubisz, M.J.; Rosembloom, K.R.; Siepel, A. Detection of nonneutral substitution rates on mammalian phylogenies. Gen. Res. 2010, 20, 110–121. [Google Scholar] [CrossRef]
- McCandlish, D.M.; Stoltzfus, A.; Dykhuizen, D.E. Modeling Evolution Using the Probability of Fixation: History and Implications. Quart. Rev. Biol. 2014, 89, 225–252. [Google Scholar] [CrossRef]
- Young, A.D.; Gillung, J.P. Phylogenomics—Principles, opportunities, and pitfalls of big-data phylogenetics. Syst. Entom. 2019, 45, 225–247. [Google Scholar] [CrossRef]
- Molloy, E.K.; Warnow, T. To Include or Not to Include: The Impact of Gene Filtering on Species Tree Estimation Methods. Syst. Biol. 2017, 67, 285–303. [Google Scholar] [CrossRef]
- Latrille, T.; Rodrigue, N.; Lartillot, N. Genes and sites under adaptation at the phylogenetic scale also exhibit adaptation at the population-genetic scale. Proc. Natl. Acad. Sci. USA 2023, 120, e2214977120. [Google Scholar] [CrossRef] [PubMed]
- Yi, S. Neutrality and Molecular Clocks. Nat. Educ. Knowl. 2013, 4, 3. [Google Scholar]
- Ting, C.T.; Takahashi, A.; Wu, C.I. Incipient speciation by sexual isolation in Drosophila: Concurrent evolution at multiple loci. Proc. Natl. Acad. Sci. USA 2001, 98, 6709–6713. [Google Scholar] [CrossRef]
- Wolf, J.B.W.; Lindell, J.; Backstrom, N. Speciation genetics: Current status and evolving approaches. Phil. Trans. R. Soc. Lond. B Biol. Sci. 2010, 365, 1717–1733. [Google Scholar] [CrossRef] [PubMed]
- Phifer-Rixley, M. Searching for the genes that separate species. eLife 2014, 3, e05377. [Google Scholar] [CrossRef] [PubMed]
- Roberts, E.K.; Tardif, S.; Wright, E.A.; Platt II, R.N.; Bradley, R.D.; Hardy, D.M. Rapid divergence of a gamete recognition gene promoted macroevolution of Eutheria. Gen. Biol. 2022, 23, 155. [Google Scholar] [CrossRef]
- Hardy, D.M.; Garbers, D.L. Species-specific binding of sperm proteins to the extracellular matrix (zona pellucida) of the egg. J. Biol. Chem. 1994, 269, 19000–19004. [Google Scholar] [CrossRef]
- Hardy, D.M.; Garbers, D.L. A sperm membrane protein that binds in a species-specific manner to the egg extracellular matrix is homologous to von Willebrand factor. J. Biol. Chem. 1995, 270, 26025–26028. [Google Scholar] [CrossRef]
- Gao, Z.; Garbers, D.L. Species diversity in the structure of zonadhesin, a sperm-specific membrane protein containing multiple cell adhesion molecule-like domains. J. Biol. Chem. 1998, 273, 3415–3421. [Google Scholar] [CrossRef]
- Herlyn, H.; Zischler, H. Tandem repetitive D domains of the sperm ligand zonadhesin evolve faster in the paralogue than in the orthologue comparison. J. Mol. Evol. 2006, 63, 602–611. [Google Scholar] [CrossRef]
- Tardif, S.; Wilson, M.D.; Wagner, R.; Hunt, P.; Gertsenstein, M.; Nagy, A.; Lobe, C.; Koop, B.F.; Hardy, D.M. Zonadhesin is essential for species specificity of sperm adhesion to the egg zona pellucida. J. Biol. Chem. 2010, 285, 24863–24870. [Google Scholar] [CrossRef]
- Legan, P.K.; Rau, A.; Kee, J.N.; Richardson, G.P. The mouse tectorins modular matrix proteins of the inner ear homologous to components of the sperm-egg adhesion system. J. Biol. Chem. 1997, 272, 8791–8801. [Google Scholar] [CrossRef] [PubMed]
- Wyckoff, G.J.; Wang, W.; Wu, C.-I. Rapid evolution of male reproductive genes in the descent of man. Nature 2000, 403, 304–309. [Google Scholar] [CrossRef]
- Swanson, W.J.; Vacquier, V.D. The rapid evolution of reproductive proteins. Nat. Rev. Genet. 2002, 3, 137–144. [Google Scholar] [CrossRef]
- Swanson, W.J.; Nielsen, R.; Yang, Q. Pervasive adaptive evolution in mammalian fertilization proteins. Mol. Biol. Evol. 2003, 20, 18–20. [Google Scholar] [CrossRef] [PubMed]
- Dufourny, L.; Levasseur, A.; Martine, M.; Callebaut, I.; Pontarotti, P.; Malpaux, B.; Monget, P. GPR50 is the mammalian ortholog of Mel1c: Evidence of rapid evolution in mammals. BMC Evol. Biol. 2008, 8, 105. [Google Scholar] [CrossRef]
- Raterman, D.; Springer, M.S. The molecular evolution of acrosin in placental mammals. Mol. Reprod. Dev. 2008, 75, 1196–1207. [Google Scholar] [CrossRef]
- Turner, L.M.; Chuong, E.B.; Hoekstra, H.E. Comparative analysis of testis protein evolution in rodents. Genetics 2008, 179, 2075–2089. [Google Scholar] [CrossRef]
- Waddell, L.A.; Lefevre, L.; Bush, S.J.; Raper, A.; Young, R.; Lisowski, Z.M.; McCulloch, M.E.B.; Muriuki, C.; Sauter, K.A.; Clark, E.L.; et al. ADGRE1 (EMR1, F4/80) is a rapidly-evolving gene expressed in mammalian monocyte-macrophages. Front. Immunol. 2008, 9, 2246. [Google Scholar] [CrossRef]
- Oliver, P.L.; Goodstadt, L.; Bayes, J.J.; Birtle, Z.; Roach, K.C.; Phadnis, N.; Beatson, S.A.; Lunter, G.; Malik, H.S.; Ponting, C.P. Accelerated evolution of the Prdm9 speciation gene across diverse metazoan taxa. PLoS Genet. 2009, 5, e1000753. [Google Scholar] [CrossRef] [PubMed]
- Finn, S.; Civetta, A. Sexual selection and the molecular evolution of ADAM proteins. J. Mol. Evol. 2010, 71, 231–240. [Google Scholar] [CrossRef] [PubMed]
- Grayson, P.; Civetta, A. Positive selection in the adhesion domain of Mus sperm Adam genes through gene duplications and function-driven gene complex formations. BMC Evol. Biol. 2013, 13, 217. [Google Scholar] [CrossRef] [PubMed]
- Grayson, P. Izumo1 and Juno: The evolutionary origins and coevolution of essential sperm-egg binding partners. R. Soc. Open Sci. 2015, 2, 150296. [Google Scholar] [CrossRef]
- Zhang, Y.; Li, H.Q.; Yao, Y.F.; Liu, W.; Ni, Q.Y.; Zhang, M.W.; Xu, H.L. Uneven evolutionary rate of the melatonin-related receptor gene (GPR50) in primates. Genet. Mol. Res. 2015, 14, 680–690. [Google Scholar] [CrossRef]
- Goodwin, Z.A.; de Guzman, S.C. Recent positive selection in genes of the mammalian epidermal differentiation complex locus. Front. Genet. 2017, 7, 227. [Google Scholar] [CrossRef] [PubMed]
- Zhao, Z.; Campbell, M.C.; Li, N.; Lee, D.S.W.; Zhang, Z.; Townsend, J.P. Detection of regional variation in selection intensity within protein-coding genes using DNA sequence polymorphism and divergence. Mol. Biol. Evol. 2017, 34, 3006–3022. [Google Scholar] [CrossRef] [PubMed]
- Cantsilieris, S.; Nelson, B.J.; Huddleston, J.; Baker, C.; Harshman, L.; Penewit, K.; Munson, K.M.; Sorenson, M.; Welch, A.E.; Dang, V.; et al. Recurrent structural variation, clustered sites of selection, and disease risk for the complement factor H (CFH) gene family. Proc. Natl. Acad. Sci. USA 2018, 115, E4433–E4442. [Google Scholar] [CrossRef]
- Moros-Nicolás, C.; Fouchécourt, S.; Goudet, G.; Monget, P. Genes encoding mammalian oviductal proteins involved in fertilization are subjected to gene death and positive selection. J. Mol. Evol. 2018, 86, 655–667. [Google Scholar] [CrossRef]
- Campbell, V.; Lapointe, F. An application of supertree methods to Mammalian mitogenomic sequences. Evol. Bioinform. Online 2010, 6, 57–71. [Google Scholar] [CrossRef]
- Scornavacca, C.; Zickmann, F.; Huson, D.H. Tanglegrams for rooted phylogenetic trees and networks. Bioinformatics 2011, 27, i248–i256. [Google Scholar] [CrossRef]
- Venkatachalam, B.; Gusfield, D. Generalizing Tanglegrams. 2018. Available online: https://scholarship.org/uc/item/0bg5p8ch (accessed on 3 October 2023).
- Shimodaira, H. An Approximately Unbiased Test of Phylogenetic Tree Selection. Syst. Biol. 2002, 51, 492–508. [Google Scholar] [CrossRef]
- Webb, C.O.; Donoghue, M.J. Phylomatic: Tree assembly for applied phylogenetics. Mol. Ecol. Notes 2005, 5, 181–183. [Google Scholar] [CrossRef]
- Swofford, D.L. PAUP*: Phylogenetic Analysis Using Parsimony, Version 4.0 b10. 2003. Available online: http://phylosolutions.com/paup-test/ (accessed on 11 October 2023).
- Xu, B.; Yang, Z. PAMLX: A graphical user interface for PAML. Mol. Biol. Evol. 2013, 30, 2723–2724. [Google Scholar] [CrossRef]
- Yang, Z. PAML 4: Phylogenetic Analysis by Maximum Likelihood. Mol. Biol. Evol. 2007, 24, 1586–1591. [Google Scholar] [CrossRef]
- Rose, K.D.; Archibald, J.D. The Rise of Placental Mammals: Origins and Relationships of the Major Extant Clades; JHU Press: Baltimore, MD, USA, 2005; p. 65. [Google Scholar]
- Seiffert, E.; Guillon, J.M. A new estimate of afrotherian phylogeny based on simultaneous analysis of genomic, morphological, and fossil evidence. BMC Evol. Biol. 2007, 7, 13. [Google Scholar] [CrossRef] [PubMed]
- Rose, K.D. The Beginning of the Age of Mammals; JHU Press: Baltimore, MD, USA, 2006; pp. 242–243. [Google Scholar]
- Cooper, L.N.; Seiffert, E.R.; Clementz, M.; Madar, S.I.; Bajpai, S.; Hussain, S.T.; Thewissen, J.G.M. Anthracobunids from the Middle Eocene of India and Pakistan Are Stem Perissodactyls. PLoS ONE 2014, 9, e109232. [Google Scholar] [CrossRef]
- Zhou, X.; Xu, S.; Xu, J.; Chen, B.; Zhou, K.; Yang, G. Phylogenomic analysis resolves the interordinal relationships and rapid diversification of the Laurasiatherian mammals. Syst. Biol. 2012, 61, 150–164. [Google Scholar] [CrossRef]
- Ursing, B.M.; Arnason, U. Analyses of mitochondrial genomes strongly support a hippopotamus-whale clade. Proc. R. Soc. B 1998, 265, 2251–2255. [Google Scholar] [CrossRef] [PubMed]
- Asher, R.J.; Helgen, K.M. Nomenclature and placental mammal phylogeny. BMC Evol. Biol. 2010, 6, 93. [Google Scholar] [CrossRef] [PubMed]
- Kriegs, J.O.; Churakov, G.; Jurka, J.; Brosius, J.; Schmitz, J. Evolutionary history of 7SL RNA-derived SINEs in Supraprimates. Tren. Genet. 2007, 23, 158–161. [Google Scholar] [CrossRef]
- Meng, J. The osteology of Rhombomylus (Mammalia, Glires): Implications for phylogeny and evolution of Glires. Bull. Am. Mus. Nat. Hist. 2003, 275, 1–247. [Google Scholar] [CrossRef]
- Meng, J.; Wyss, A.R. The morphology of Tribosphenomys (Rodentiaformes, Mammalia): Phylogenetic Implications for Basal Glires. J. Mam. Evol. 2001, 8, 1–71. [Google Scholar] [CrossRef]
- McKenna, M.C.; Bell, S.K. Classification of Mammals: Above the Species Level; Columbia University Press: New York, NY, USA, 1997. [Google Scholar]
- Burgin, C.J.; Colella, J.P.; Kahn, P.L.; Upham, N.S. How many mammal species are there? J. Mamm. 2019, 99, 1–14. [Google Scholar] [CrossRef]
- Teeling, E.C.; Hedges, S.B. Making the impossible possible: Rooting the tree of placental mammals. Mol. Biol. Evol. 2013, 30, 1999–2000. [Google Scholar] [CrossRef]
- Van Dijk, M.A.M.; Paradis, E.; Catzeflis, F.; de Jong, W.W. The Virtues of Gaps: Xenarthran (Edentate) Monophyly Supported by a Unique Deletion in αA-Crystallin. Syst. Biol. 1999, 48, 94–106. [Google Scholar] [CrossRef]
- Waddell, P.J.; Cao, Y.; Hauf, J.; Hasegawa, M. Using novel phylogenetic methods to evaluate mammalian mtDNA, including amino acid-invariant sites-LogDet plus site stripping, to detect internal conflicts in the data, with special reference to the positions of hedgehog, armadillo, and elephant. Syst. Biol. 1999, 48, 31–53. [Google Scholar] [CrossRef]
- Madsen, O.; Deen, P.M.; Pesole, G.; Saccone, C.; de Jong, W.W. Molecular evolution of mammalian aquaporin-2: Further evidence that elephant shrew and aardvark join the paenungulate clade. Mol. Biol. Evol. 1997, 14, 363–371. [Google Scholar] [CrossRef]
- Nikaido, M.; Nishihara, H.; Hukumoto, Y.; Okada, N. Ancient SINEs from African Endemic Mammals. Mol. Biol. Evol. 2003, 20, 522–527. Erratum in Mol. Biol. Evol. 2003, 20, 1181. https://doi.org/10.1093/molbev/msg161. [CrossRef]
- Murphy, W.J.; O’Brien, S. Designing and optimizing comparative anchor primers for comparative gene mapping and phylogenetic inference. Nat. Protoc. 2007, 2, 3022–3030. [Google Scholar] [CrossRef]
- Yang, F.; Alkalaeva, E.Z.; Perelman, P.L.; Pardini, A.T.; Harrison, W.R.; O’Brien, P.M.C.; Fu, B.; Graphodatsky, A.S.; Ferguson-Smith, M.A.; Robinson, T.J. Reciprocal chromosome painting among human, aardvark, and elephant (superorder Afrotheria) reveals the likely eutherian ancestral karyotype. Proc. Natl. Acad. Sci. USA 2003, 100, 1062–1066. [Google Scholar] [CrossRef] [PubMed]
- Fröenicke, L.; Wienberg, J.; Stone, G.; Adams, L.; Stanyon, R. Towards the delineation of the ancestral eutherian genome organization: Comparative genome maps of human and the African elephant (Loxodonta africana) generated by chromosome painting. Proc. R. Soc. Lond. B 2003, 207, 1331–1340. [Google Scholar] [CrossRef] [PubMed]
- Douady, C.J.; Chatelier, P.I.; Madsen, O.; de Jong, W.W.; Catzeflis, F.; Springer, M.S.; Stanhope, M.J. Molecular phylogenetic evidence confirming the Eulipotyphla concept and in support of hedgehogs as the sister group to shrews. Mol. Phylogenet. Evol. 2002, 25, 200–209. [Google Scholar] [CrossRef] [PubMed]
- Puttick, M.N.; Thomas, G.H. Fossils and living taxa agree on patterns of body mass evolution: A case study with Afrotheria. Proc. R. Soc. Lond. B 2015, 282, 20152023. [Google Scholar] [CrossRef]
- Eizirik, E.; Murphy, W.J.; Koepfli, K.; Johnson, W.E.; Dragoo, J.W.; Wayne, R.K.; O’Brien, S.J. Pattern and timing of diversification of the mammalian order Carnivora inferred from multiple nuclear gene sequences. Mol. Phylogenet. Evol. 2010, 56, 49–63. [Google Scholar] [CrossRef] [PubMed]
- Nash, W.G.; Menninger, J.C.; Wienberg, J.; Padilla-Nash, H.M.; O’Brien, S.J. The pattern of phylogenomic evolution of the Canidae. Cytogenet. Cell Genet. 2001, 95, 210–224. [Google Scholar] [CrossRef]
- Van Rheede, T.; Bastiaans, T.; Boone, D.N.; Hedges, S.B.; de Jong, W.W.; Madsen, O. The Platypus Is in Its Place: Nuclear Genes and Indels Confirm the Sister Group Relation of Monotremes and Therians. Mol. Biol. Evol. 2006, 23, 587–597. [Google Scholar] [CrossRef]
- Murphy, W.J.; Pringle, T.H.; Crider, T.A.; Springer, M.S.; Miller, W. Using genomic data to unravel the root of the placental mammal phylogeny. Genom. Res. 2007, 17, 413–421. [Google Scholar] [CrossRef]
- Waters, P.D.; Dobigny, G.; Waddell, P.J.; Robinson, T.J. Evolutionary History of LINE-1 in the Major Clades of Placental Mammals. PLoS ONE. 2007, 2, e158. [Google Scholar] [CrossRef]
- Cao, Y.; Fujiwara, M.; Nikaido, M.; Okada, N.; Hasegawa, M. Interordinal relationships and timescale of Eutherian evolution as inferred from mitochondrial genome data. Gene 2000, 259, 149–158. [Google Scholar] [CrossRef]
- Easteal, S. The pattern of mammalian evolution and the relative rate of molecular evolution. Genetics 1990, 124, 165–173. [Google Scholar] [CrossRef]
- Kullberg, M.; Nilsson, M.A.; Arnason, U.; Harley, E.H.; Janke, A. Housekeeping Genes for Phylogenetic Analysis of Eutherian Relationships. Mol. Biol. Evol. 2006, 23, 1493–1503. [Google Scholar] [CrossRef] [PubMed]
- Huttley, G.A.; Wakefield, M.J.; Easteal, S. Rates of Genome Evolution and Branching Order from Whole Genome Analysis. Mol. Biol. Evol. 2007, 24, 1722–1730. [Google Scholar] [CrossRef]
- Poux, C.; van Rheede, T.; Madsen, O.; de Jong, W.W. Sequence Gaps Join Mice and Men: Phylogenetic Evidence from Deletions in Two Proteins. Mol. Biol. Evol. 2002, 19, 2035–2037. [Google Scholar] [CrossRef] [PubMed]
- Thomas, J.W.; Touchman, J.W.; Blakesley, R.W.; Bouffard, G.G.; Beckstrom-Sternberg, S.M.; Margulies, E.H.; Blanchette, M.; Siepel, A.C.; Thomas, P.J.; McDowell, J.C.; et al. Comparative analyses of multi-species sequences from targeted genomic regions. Nature 2003, 424, 788–793. [Google Scholar] [CrossRef] [PubMed]
- Kirkness, E.F.; Bafna, V.; Halpern, A.L.; Levy, S.; Remington, K.; Rusch, D.B. The Dog Genome: Survey Sequencing and Comparative Analysis. Science 2003, 301, 1898–1903. [Google Scholar] [CrossRef]
- Esselstyn, J.A.; Oliveros, C.H.; Swanson, M.T.; Faircloth, B.C. Investigating Difficult Nodes in the Placental Mammal Tree with Expanded Taxon Sampling and Thousands of Ultraconserved Elements. Gen. Biol. Evol. 2017, 9, 2308–2321. [Google Scholar] [CrossRef]
- Zhang, L.; Dong, X.; Tian, X.; Lee, M.; Ablaeva, J.; Firsanov, D.; Lee, S.; Maslov, A.Y.; Gladyshev, V.N.; Seluanov, A.; et al. Maintenance of genome sequence integrity in long- and short-lived rodent species. Sci. Adv. 2021, 7, eabj3284. [Google Scholar] [CrossRef]
- Zhou, X.; Sun, F.; Xu, S.; Yang, G.; Li, M. The position of tree shrews in the mammalian tree: Comparing multi-tree analyses with phylogenomic results leaves monophyly of Euarchonta doubtful. Integr. Zool. 2015, 10, 186–198. [Google Scholar] [CrossRef]
- Kumar, V.; Hallstrom, B.M.; Janke, A. Coalescent-based genome analyses resolve the early branches of the Euarchontoglires. PLoS ONE 2013, 8, e60019. [Google Scholar] [CrossRef]
- Misawa, K.; Nei, M. Reanalysis of Murphy et al.’s Data Gives Various Mammalian Phylogenies and Suggests Overcredibility of Bayesian Trees. J. Mol. Evol. 2003, 57, S290–S296. [Google Scholar] [CrossRef]
- Misawa, K.; Nei, A. Revisiting the Glires concept—Phylogenetic analysis of nuclear sequences. Mol. Phy. Evol. 2003, 28, 320–327. [Google Scholar] [CrossRef]
- Roca, A.L.; Bar-Gal, G.K.; Eizirik, E.; Helgen, K.M.; Maria, R.; Springer, M.S.; O’Brien, S.J.; Murphy, W.J. Mesozoic origin for West Indian insectivores. Nature 2004, 429, 649–651. [Google Scholar] [CrossRef]
- Brace, S.; Thomas, J.A.; Dalén, L.; Burger, J.; MacPhee, R.D.E.; Barnes, I.; Turvey, S.T. Evolutionary History of the Nesophontidae, the Last Unplaced Recent Mammal Family. Mol. Biol. Evol. 2016, 33, 3095–3103. [Google Scholar] [CrossRef]
- Springer, M.S.; Teeling, E.C.; Madsen, O.; de Jong, W.W. Integrated fossil and molecular data reconstruct bat echolocation. Proc. Natl. Acad. Sci. USA 2001, 98, 6241–6246. [Google Scholar] [CrossRef] [PubMed]
- Jones, K.E.; Purvis, A.; MacLarnon, A.; Bininda-Emonds, O.R.P.; Simmons, N.B. A phylogenetic supertree of the bats (Mammalia: Chiroptera). Biol. Rev. 2002, 77, 223–259. [Google Scholar] [CrossRef] [PubMed]
- Teeling, E.C.; Springer, M.S.; Madsen, O.; Bates, P.; O’Brien, S.J.; Murphy, W.J. A molecular phylogeny for bats illuminates biogeography and the fossil record. Science 2005, 307, 580–584. [Google Scholar] [CrossRef] [PubMed]
- Tsagkogeorga, G.; Parker, J.; Stupka, E.; Cotton, J.A.; Rossiter, S.J. Phylogenomic analyses elucidate the evolutionary relationships of bats. Curr. Biol. 2013, 23, 2262–2267. [Google Scholar] [CrossRef]
- Simmons, N.B.; Seymour, K.L.; Habersetzer, J.; Gunnell, G.F. Primitive Early Eocene bat from Wyoming and the evolution of flight and echolocation. Nature 2008, 451, 818–821. [Google Scholar] [CrossRef]
- Pumo, D.E.; Finamore, P.S.; Franek, W.R.; Phillips, C.J.; Tarzami, S.; Balzarano, D. Complete mitochondrial genome of a neotropical fruit bat, Artibeus jamaicensis, and a new hypothesis of the relationships of bats to other eutherian mammals. J. Mol. Evol. 1998, 47, 709–717. [Google Scholar] [CrossRef] [PubMed]
- Mouchaty, S.K.; Gullberg, A.; Janke, A.; Arnason, U. The phylogenetic position of the Talpidae within Eutheria based on analysis of complete mitochondrial sequences. Mol. Biol. Evol. 2000, 17, 60–67. [Google Scholar] [CrossRef]
- Nikaido, M.; Kawai, K.; Cao, Y.; Harado, M.; Tomita, S.; Tomita, S.; Okada, N.; Hasegawa, M. Maximum Likelihood Analysis of the Complete Genomes of Eutherians and a Reevaluation of the Phylogeny of Bats and Insectivores. J. Mol. Evol. 2001, 53, 508–516. [Google Scholar] [CrossRef]
- Lapointe, F.J.; Kirsch, J.A.W.; Hutcheon, J.M. Total evidence, consensus, and bat phylogeny: A distance-based approach. Mol. Phylogenet. Evol. 1999, 11, 55–66. [Google Scholar] [CrossRef] [PubMed]
- Van den Bussche, R.A.; Hoofer, S.R. Phylogenetic relationships among recent chiropteran families and the importance of choosing appropriate out-group taxa. J. Mamm. 2004, 85, 321–330. [Google Scholar] [CrossRef]
- Agnarsson, I.; Zanrana-Torrelio, C.M.; Flores-Saldana, N.P.; May-Collado, L.J. A time-calibrated species-level phylogeny of bats (Chiroptera, Mammalia). PLoS Curr. 2011, 3, RRN1212. [Google Scholar] [CrossRef] [PubMed]
- Price, S.A.; Bininda-Emonds, O.R.P.; Gittleman, J.L. A complete phylogeny of the whales, dolphins and even-toed hoofed mammals (Cetartiodactyla). Biol. Rev. 2005, 80, 445–473. [Google Scholar] [CrossRef]
- Bininda-Emonds, O.R.P.; Gittleman, J.L.; Purvis, A. Building large trees by combining phylogenetic information: A complete phylogeny of the extant Carnivora (Mammalia). Biol. Rev. Camb. Philos. Soc. 1999, 74, 143–175. [Google Scholar] [CrossRef]
- Finarelli, J.A.; Goswami, A. The evolution of orbit orientation and encephalization in the Carnivora (Mammalia). J. Anat. 2009, 214, 671–678. [Google Scholar] [CrossRef]
- Flynn, J.J.; Finarelli, J.A.; Zehr, S.; Hsu, J.; Nedbal, M.A. Molecular phylogeny of the Carnivora (Mammalia): Assessing the impact of increased sampling on resolving enigmatic relationships. Syst. Biol. 2005, 54, 317–337. [Google Scholar] [CrossRef]
- Arnason, U.; Gullberg, A.; Janke, A.; Kullberg, M. Mitogenomic analyses of caniform relationships. Mol. Phylogenet. Evol. 2007, 45, 863–874. [Google Scholar] [CrossRef]
- Barycka, E. Evolution and systematics of the feliform Carnivora. Mamm. Biol. 2007, 72, 257–282. [Google Scholar] [CrossRef]
- Werdelin, L.; Yamaguchi, N.; Johnson, W.E.; O’Brien, S.J. Phylogeny and evolution of cats (Felidae). In Biology and Conservation of Wild Felids; MacDonald, D.W., Loveridge, A.J., Eds.; Oxford University Press: Oxford, UK, 2010; pp. 59–82. [Google Scholar]
- Wozencraft, W.C. Order Carnivora. In Mammal Species of the World: A Taxonomic and Geographic Reference, 3rd ed.; Wilson, D.E., Reeder, D.M., Eds.; Johns Hopkins University Press: Baltimore, MD, USA, 2005; pp. 548–559. [Google Scholar]
- Mattern, M.Y.; McLennan, D.A. Phylogeny and Speciation of Felids. Cladistics 2000, 16, 232–253. [Google Scholar] [CrossRef] [PubMed]
- Li, G.; Davis, B.W.; Eizirik, E.; Murphy, W.J. Phylogenomic evidence for ancient hybridization in the genomics of living cats (Felidae). Genome Res. 2016, 26, 1–11. [Google Scholar] [CrossRef] [PubMed]
- Nyakatura, K.; Bininda-Emonds, O.R.P. Updating the evolutionary history of Carnivora (Mammalia): A new species-level supertree complete with divergence time estimates. BMC Biol. 2012, 10, 12. [Google Scholar] [CrossRef]
- Zinner, D.; Arnold, M.L.; Roos, C. The strange blood: Natural hybridization in primates. Evol. Anthropol. 2011, 20, 96–103. [Google Scholar] [CrossRef] [PubMed]
- Finstermeier, K.; Zinner, D.; Brameier, M.; Meyer, M.; Kreuz, E.; Hofreiter, M. A Mitogenomic Phylogeny of Living Primates. PLoS ONE 2013, 8, e69504. [Google Scholar] [CrossRef]
- Pozzi, L.; Hodgson, J.A.; Burrell, A.S.; Sterner, K.N.; Raaum, R.L.; Disotell, T.R. Primate phylogenetic relationships and divergence dates inferred from complete mitochondrial genomes. Mol. Phylogenet. Evol. 2014, 75, 165–183. [Google Scholar] [CrossRef]
- Cao, Y.; Adachi, J.; Yano, T.; Hasegawa, M. Phylogenetic place of guinea pigs: No support of the rodent-polyphyly hypothesis from maximum-likelihood analyses of multiple protein sequences. Mol. Biol. Evol. 1994, 11, 593–604. [Google Scholar] [CrossRef]
- D’Erchia, A.; Gissi, C.; Pesole, G.; Saccone, C.; Arnason, U. The guinea-pig is not a rodent. Nature 1996, 381, 597–600. [Google Scholar] [CrossRef]
- Graur, D.; Hide, W.; Li, W. Is the guinea-pig a rodent? Nature 1991, 351, 649–652. [Google Scholar] [CrossRef]
- Huchon, D.; Catzeflis, F.M.; Douzery, E.J.P. Variance of molecular datings, evolution of rodents and the phylogenetic affinities between Ctenodactylidae and Hystricognathi. Proc. R. Soc. Lond. B 2000, 267, 393–402. [Google Scholar] [CrossRef]
- Montgelard, C.; Forty, E.; Arnal, V.; Matthee, C.A. Suprafamilial relationships among Rodentia and the phylogenetic effect of removing fast-evolving nucleotides in mitochondrial, exon and intron fragments. BMC Evol. Biol. 2008, 8, 321. [Google Scholar] [CrossRef] [PubMed]
- Honeycutt, R.L.; Frabotta, L.J.; Rowe, D.L. Rodent evolution, phylogenetics, and biogeography. In Rodent Societies: An Ecological and Evolutionary Perspective; University of Chicago Press: Chicago, IL, USA, 2007; pp. 8–23. [Google Scholar]
- Honeycutt, R.L. Rodents (Rodentia). In The Timetree of Life; OUP: Oxford, UK, 2009; pp. 490–494. [Google Scholar]
- Alhajeri, B.H.; Hunt, P.J.; Steppan, S.J. Molecular systematics of gerbils and deomyines (Rodentia: Gerbillinae, Deomyinae) and a test of desert adaptation in the tympanic bulla. J. Zoolog. Syst. Evol. Res. 2015, 53, 312–330. [Google Scholar] [CrossRef]
- Li, C.L.; Du, X.Y.; Gao, J.; Wang, C.; Guo, H.G.; Dai, F.W.; Sa, X.Y.; An, W.; Chen, Z.W. Phylogenetic analysis of the Mongolian gerbil (Meriones unguiculatus) from China based on mitochondrial genome. Genet. Mol. Res. 2016, 15, gmr.15037703. [Google Scholar] [CrossRef] [PubMed]
- Ruedi, M.; Mayer, F. Molecular Systematics of Bats of the Genus Myotis (Vespertilionidae) Suggests Deterministic Ecomorphological Convergences. Mol. Phylogenet. Evol. 2001, 21, 436–448. [Google Scholar] [CrossRef]
- Arnold, M.L.; Meyer, A. Natural hybridization in primates: One evolutionary mechanism. Zoology 2006, 109, 261–276. [Google Scholar] [CrossRef]
- Ji, R.; Cui, P.; Ding, F.; Geng, J.; Gao, H.; Zhang, H.; Yu, J.; Hu, S.; Meng, H. Monophyletic origin of domestic Bactrian camel (Camelus bactrianus) and its evolutionary relationship with the extant wild camel (Camelus bactrianus ferus). Anim. Genet. 2009, 40, 377–382. [Google Scholar] [CrossRef]
- Mohandesan, E.; Fitak, R.R.; Corander, J.; Yadamsuren, A.; Chuluunbat, B.; Abdelhadi, O.; Raziq, A.; Nagy, P.; Stalder, G.; Walzer, C.; et al. Mitogenome Sequencing in the Genus Camelus Reveals Evidence for Purifying Selection and Long-term Divergence between Wild and Domestic Bactrian Camels. Sci. Rep. 2017, 7, 9970. [Google Scholar] [CrossRef]
- Legesse, Y.W.; Dunn, C.D.; Mauldin, M.R.; Ordoñez-Garza, N.; Rowden, G.R.; Mekasha Gebre, Y.; Kurtu, M.Y.; Ali, S.M.; Whibesilassie, W.D.; Ballou, M.; et al. Morphometric and genetic variation in 8 breeds of Ethiopian camels (Camelus dromedarius). J. Anim. Sci. 2018, 96, 4925–4934. [Google Scholar] [CrossRef]
- Burger, P.A.; Ciani, E.; Faye, B. Old World camels in a modern world—A balancing act between conservation and genetic improvement. Anim. Genet. 2019, 50, 598–612. [Google Scholar] [CrossRef]
- Zeller, U.; Göttert, T. The relations between evolution and domestication reconsidered—Implications for systematics, ecology, and nature conservation. Glob. Ecol. Cons. 2019, 20, e00756. [Google Scholar] [CrossRef]
- Groves, C.P. Systematic relationships in the Bovini (Artiodactyla, Bovidae). J. Zool. Syst. Evol. Res. 1981, 19, 264–278. [Google Scholar] [CrossRef]
- Zhang, Y.; Hu, Y.; Wang, X.; Jiang, Q.; Zhao, H.; Wang, J.; Ju, Z.; Yang, L.; Gao, Y.; Wei, X.; et al. Population Structure and Selection Signatures Underlying High-Altitude Adaptation Inferred From Genome-Wide Copy Number Variations in Chinese Indigenous Cattle. Front. Genet. 2019, 10, 1404. [Google Scholar] [CrossRef] [PubMed]
- D’Elia, G.; Fabre, P.; Lessa, E.P. Rodent systematics in an age of discovery: Recent advances and prospects. J. Mamm. 2019, 100, 852–871. [Google Scholar] [CrossRef]
- Shen, Y.; Liang, L.; Zhu, Z.; Zhou, E.; Irwin, D.M.; Zhang, Y. Adaptive evolution of energy metabolism genes and the origin of flight in bats. Proc. Natl. Acad. Sci. USA 2010, 11, 8666–8671. [Google Scholar] [CrossRef] [PubMed]
- Hecker, N.; Sharma, V.; Hiller, M. Convergent gene losses illuminate metabolic and physiological changes in herbivores and carnivores. Proc. Natl. Acad. Sci. USA 2019, 116, 3036–3041. [Google Scholar] [CrossRef] [PubMed]
- Wu, Y. Diet evolution of carnivorous and herbivorous mammals in Laurasiatheria. BMC Ecol. Evol. 2022, 22, 82. [Google Scholar] [CrossRef]
- Fu, Y. Estimating Mutation Rate and Generation Time from Longitudinal Samples of DNA Sequences. Mol. Biol. Evol. 2001, 18, 620–626. [Google Scholar] [CrossRef]
- Okazaki, A.; Yamazaki, S.; Inoue, I.; Ott, J. Population genetics: Past, present, and future. Hum. Genet. 2021, 140, 231–240. [Google Scholar] [CrossRef]
- Springer, M.S.; Burk, A.; Kavanagh, J.R.; Waddell, V.G.; Stanhope, M.J. The interphotoreceptor retinoid binding protein gene in therian mammals: Implications for higher level relationships and evidence for loss of function in the marsupial mole. Proc. Natl. Acad. Sci. USA 1997, 9, 13754–13759. [Google Scholar] [CrossRef]
- Bradley, R.D.; Baker, R.J. A Test of the Genetic Species Concept: Cytochrome-b Sequences and Mammals. J. Mamm. 2001, 82, 960–973. [Google Scholar] [CrossRef]
- Chan, A.H.; Chaisiri, K.; Saralamba, S.; Morand, S.; Thaenkham, U. Assessing the suitability of mitochondrial and nuclear DNA genetic markers for molecular systematics and species identification. Parasites Vectors 2021, 14, 233. [Google Scholar] [CrossRef] [PubMed]
Figure 3.
Superordinal and ordinal-level trees. (A) Superordinal-level tree. Note the absence of tangles among ancient placental superorders. (B) Ordinal-level Afrotheria tree. Note the tangle from the grouping of Afrosoricida-golden moles with Hyracoidea in the Zan tree, but instead with Tubulidentata in the supertree. Abbreviation: ST = Upham et al. supertree; g.moles = golden moles.

Figure 4.
Ordinal-level tree for Laurasiatheria and Euarchontoglires. Within Laurasiatheria, note in the Zan tree the divergence of Cetartiodactyla as basal to the clade of Chiroptera and Perissodactyla. In contrast, note in ST the divergence of Chiroptera as the basal order followed by the divergence of Cetartiodactyla and Perissodactyla, and then a clade comprising both Pholidota and Carnivora.

Figure 5.
Family-level tree for Chiroptera. Note the lack of tangles among chiropteran families.

Figure 6.
Species-level tree for Chiroptera. Note the absence of tangles between all chiropteran species, with the exception of members of the genus Myotis: brandtii, lucifugus, and davidii. Abbreviations are as follows: Rhinolophus f.: Rhinolophus ferrumequinum, Rhinolophus s.: Rhinolophus sinicus, Pteropus a.: Pteropus alecto, Pteropus v.: Pteropus vampyrus, Pteropus g.: Pteropus giganteus, Phyllostomus h.: Phyllostomus hastatus and Phyllostomus discolor, Myotis m.: Myotis myotis, Myotis d.: Myotis davidii, and Myotis b.: Myotis brandtii, Myotis l., and Myotis lucifugus.
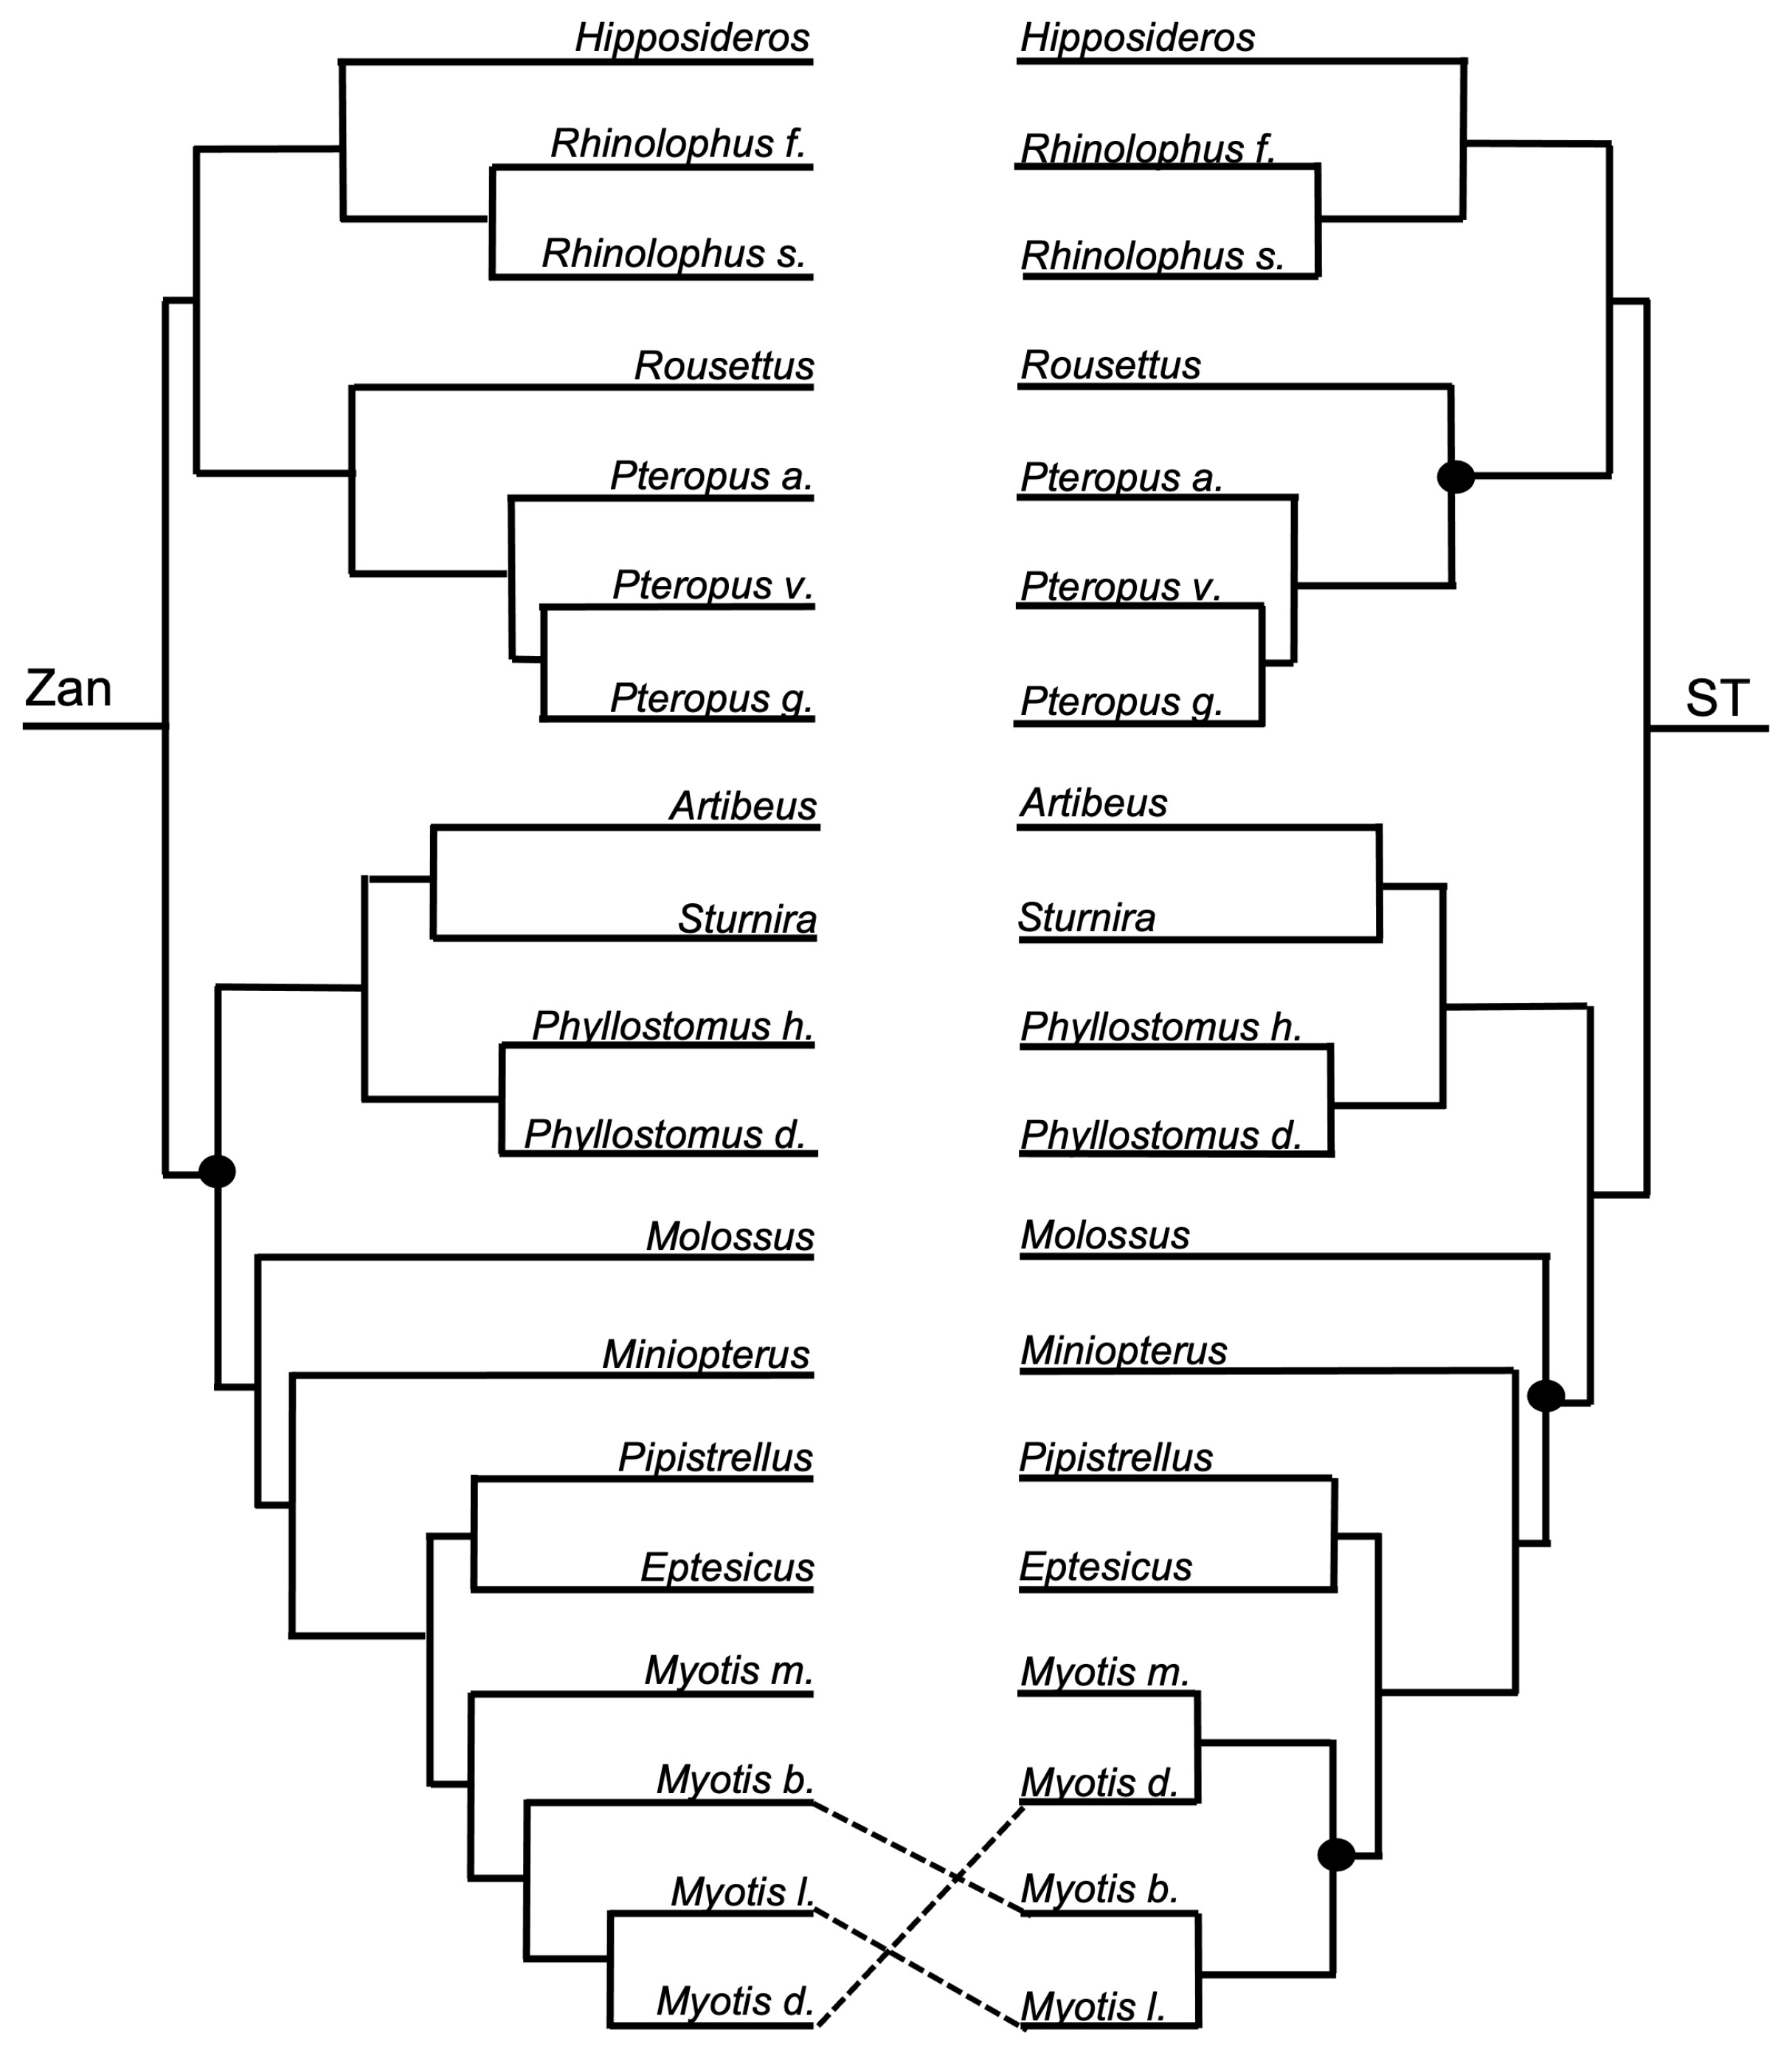
Figure 7.
Family-level tree for Cetartiodactyla. Note the absence of tangles among even-toed ungulate families.
Figure 7.
Family-level tree for Cetartiodactyla. Note the absence of tangles among even-toed ungulate families.
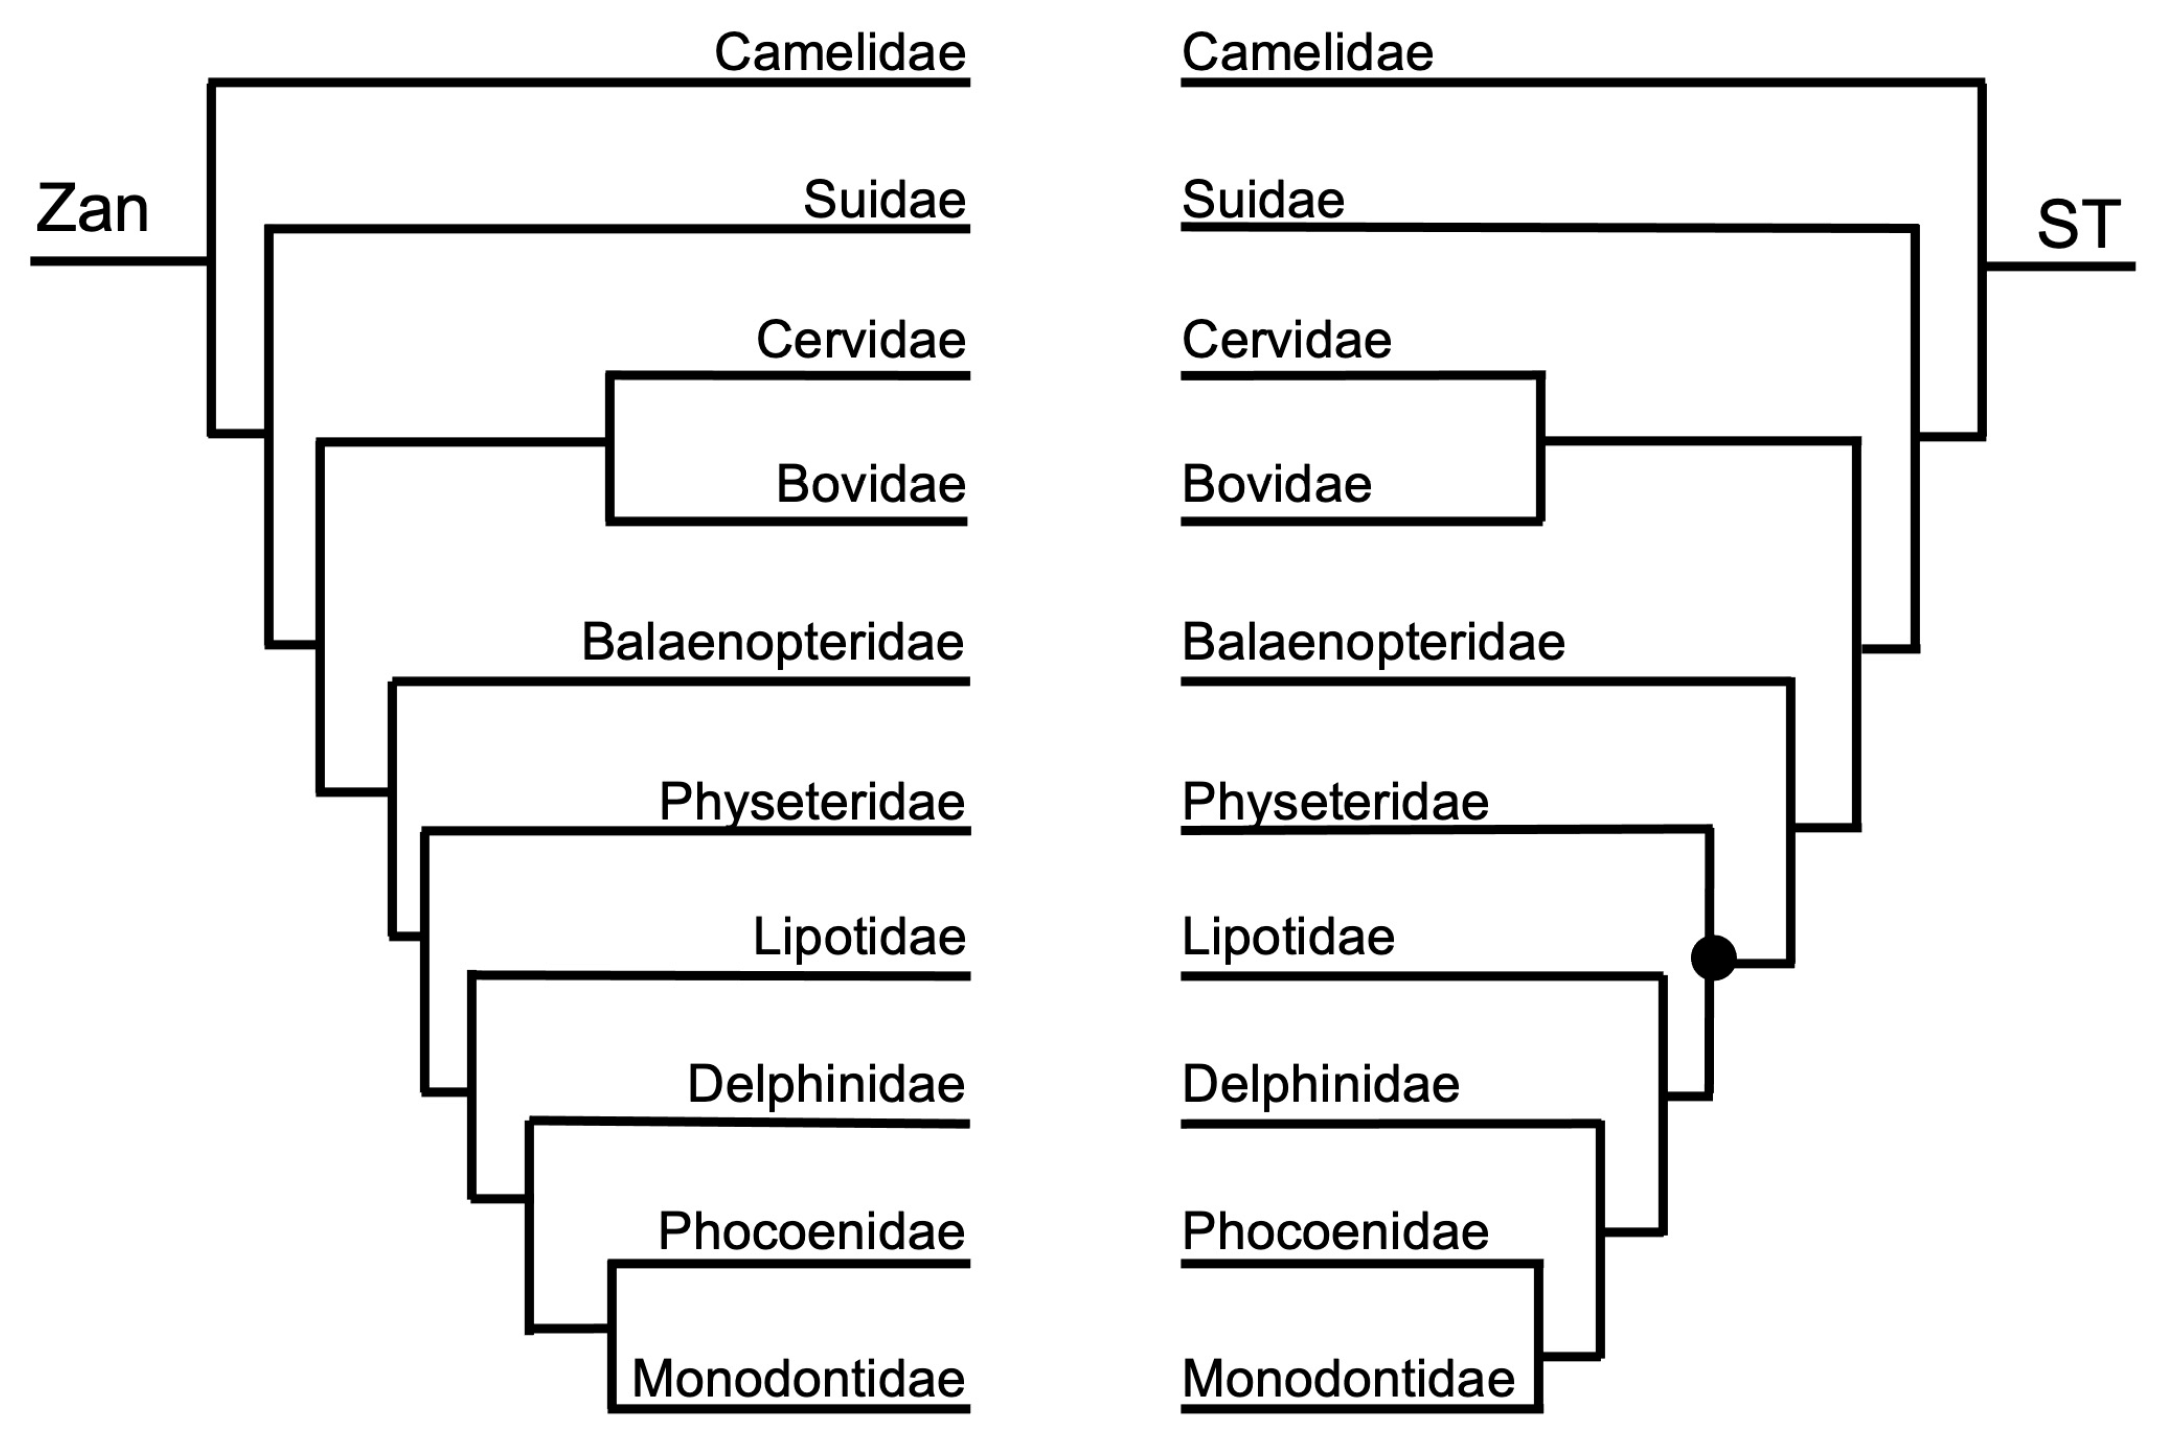
Figure 8.
Species-level tree for Cetartiodactyla. Note the tangles within both the Camelidae and the Phocoenidae families. Abbreviations are as follows: Camelus f.: Camelus ferus, Camelus b.: Camelus bactrianus, Camelus d.: Camelus dromedarius, Cervus e.: Cervus elaphus, Cervus c.: Cervus canadensis, Cervus n.: Cervus nippon, Bos g.: Bos grunniens, Bos t.: Bos taurus, Bos i., Bos indicus, Bos hybrid: Bos indicus × taurus, Bos j.: Bos javanicus, Balaenoptera m.: Balaenoptera musculus, and Balaenoptera a.: Balaenoptera acutorostrata.
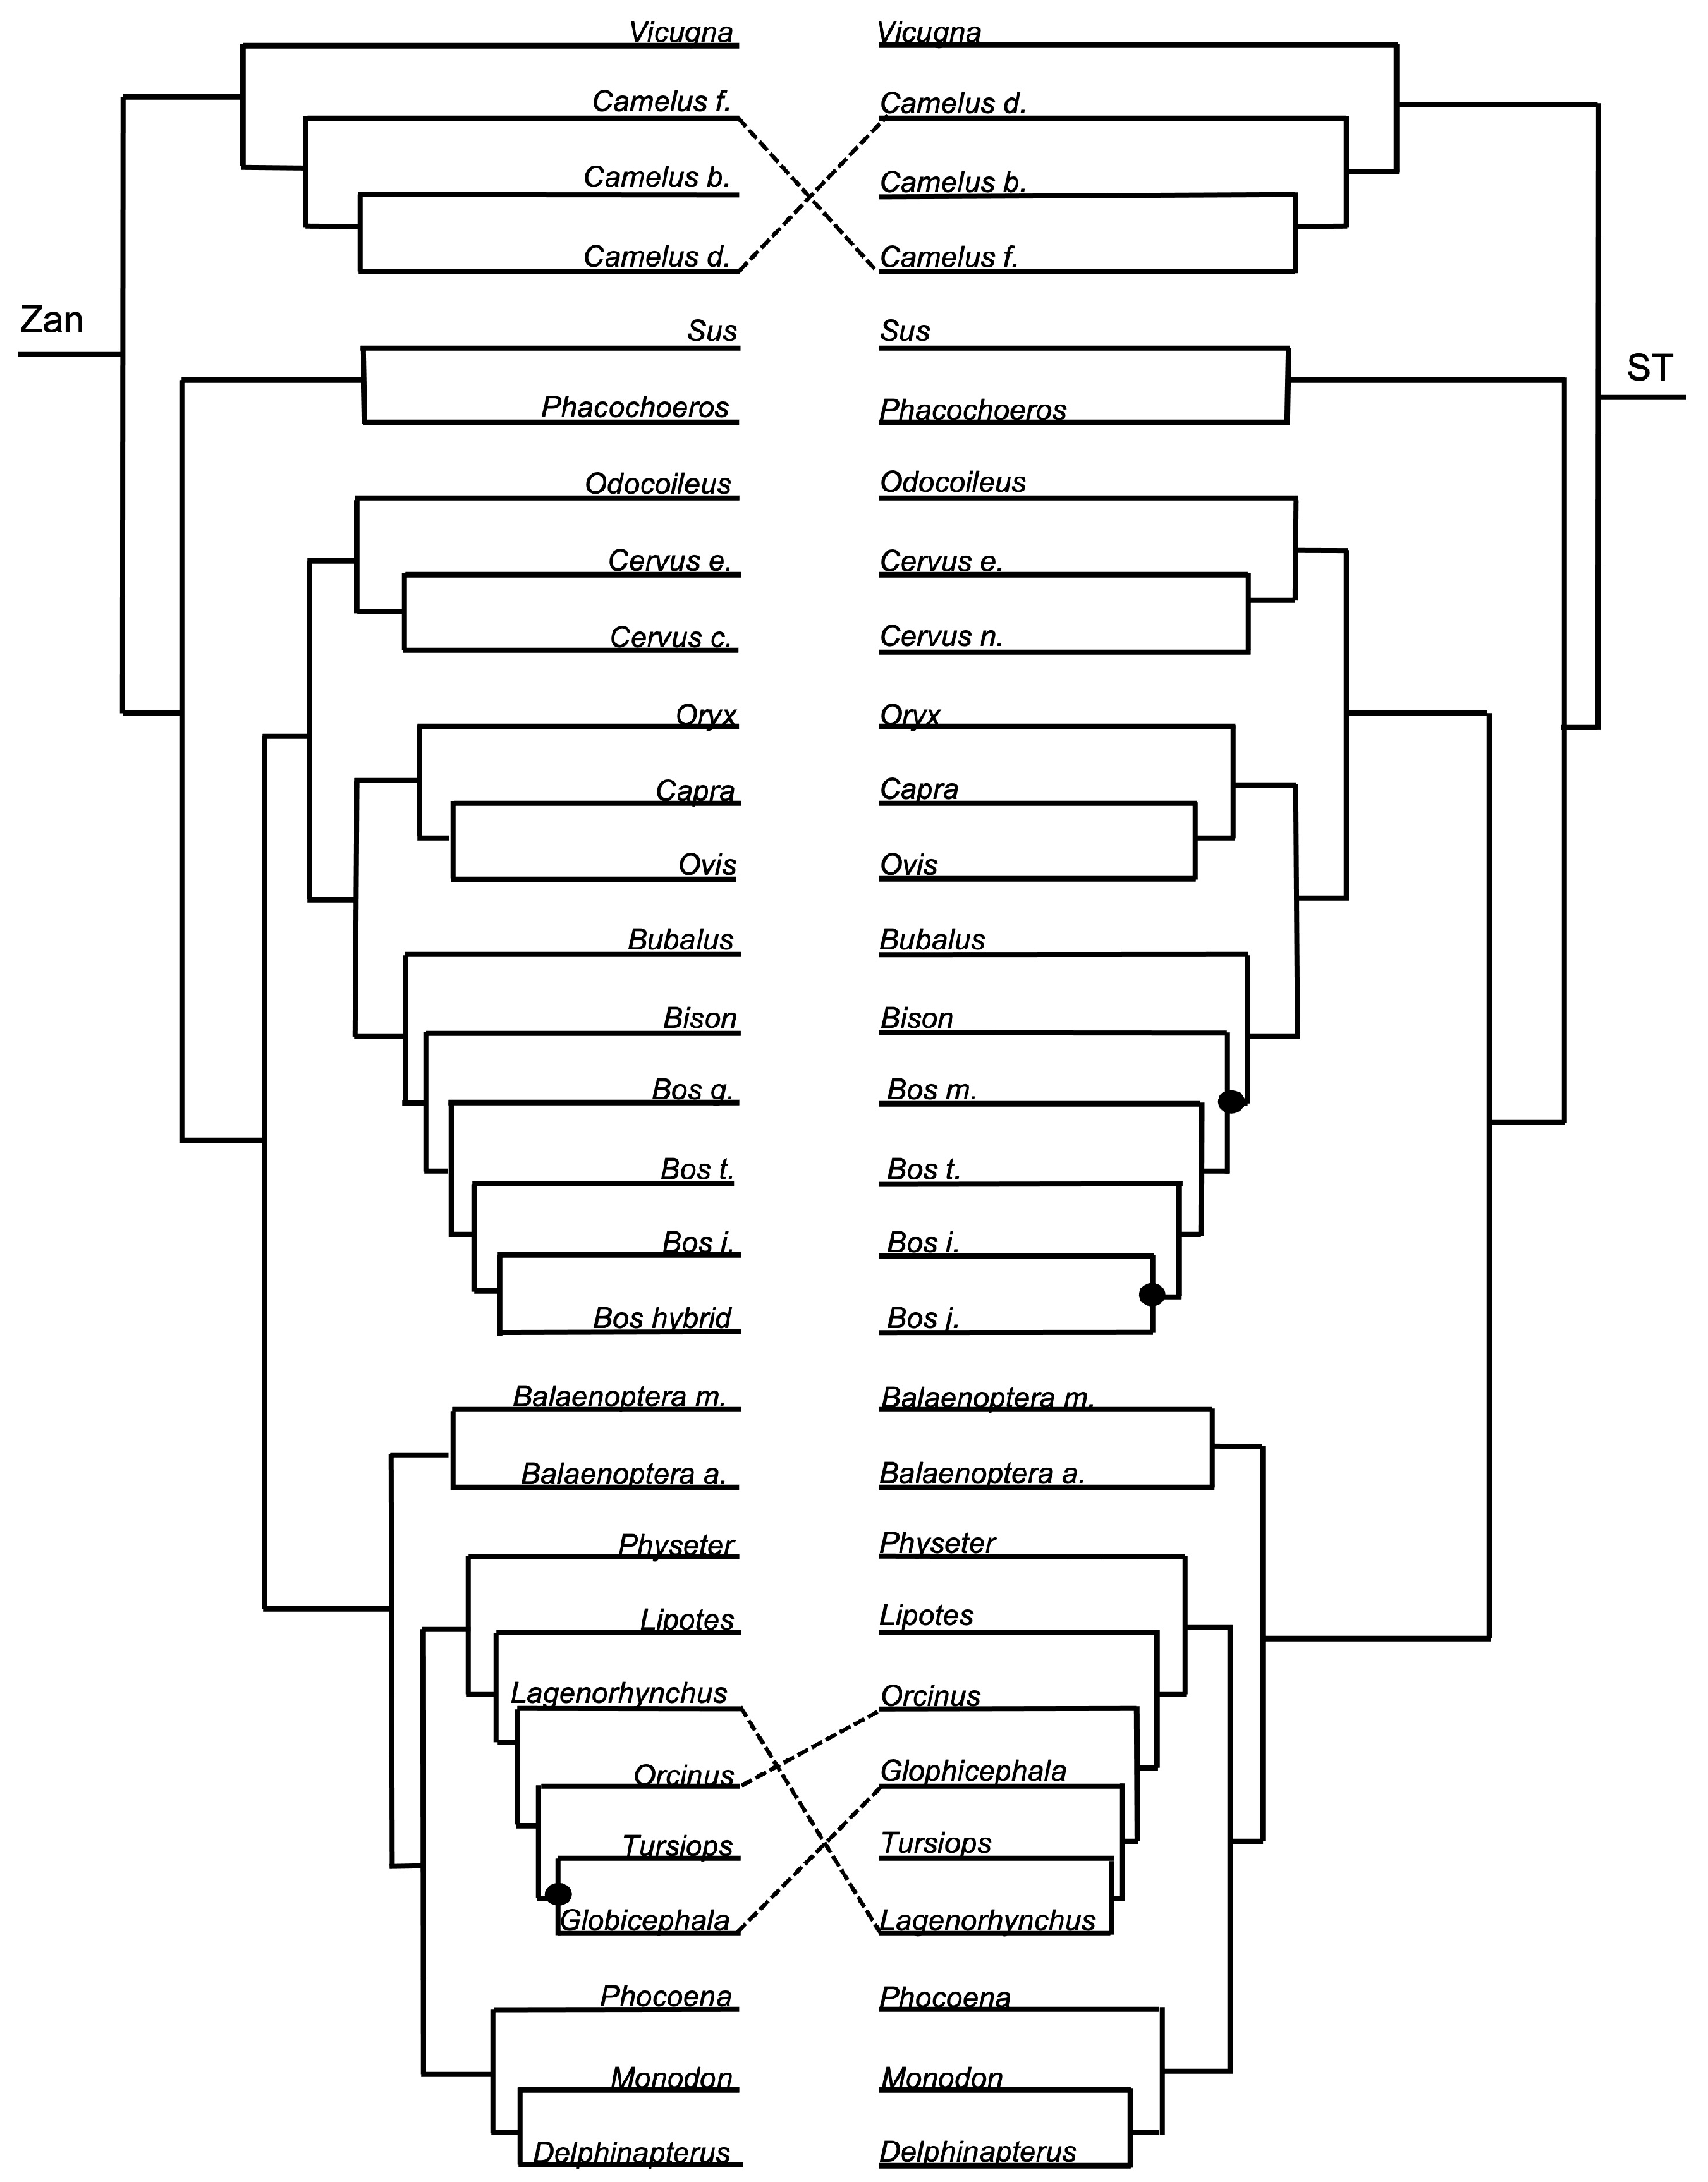
Figure 9.
Family-level tree for Carnivora. Note in the Zan tree the grouping of Ursidae and Mustelidae as sisters with a clade comprising Phocidae, Otariidae, and Odobenidae, but in ST as single-family divergences following the split of Canidae as basal.
Figure 9.
Family-level tree for Carnivora. Note in the Zan tree the grouping of Ursidae and Mustelidae as sisters with a clade comprising Phocidae, Otariidae, and Odobenidae, but in ST as single-family divergences following the split of Canidae as basal.

Figure 10.
Species-level tree for Carnivora. Note the tangle within Felidae, with Leopardus basal to Lynx, Puma, and two sister clades, one comprising Acinonyx and Herpailurus and the other comprising Felis and Prionailurus, in the Zan tree. In contrast, note in ST the Felidae split into two sister clades, one containing Lynx, Acinonyx, Puma, and Herpailurus, and the other clade containing Felis, Leopardus, and Prionailurus. Clade A contains members of the family Mustelidae, and Clade B contains members of the family Ursidae. Abbreviations are as follows: Canis f.: Canis familiaris, Canis f.d.: Canis familiaris dingo, Canis la.: Canis latrans, Canis lu.: Canis lupus, Vulpes v.: Vulpes vulpes, Vulpes l.: Vulpes lagopus, Ursus am.: Ursus americanus, Ursus m.: Ursus maritimus, Ursus ar. h.: Ursus arctos horribilis, Ursus ar.: Ursus arctos, Mirounga a.: Mirounga angustirostris, Mirounga l.: Mirounga leonina, Panthera t.: Panthera tigris, Panthera l.: Panthera leo, Panthera u.: Panthera uncia, and Panthera o.: Panthera onca.

Figure 11.
Family-level tree for Primates. Note the absence of tangles among the primate Families.

Figure 12.
Species-level tree for Primates. Note the tangles within the families Hominidae with Gorilla and Nomascus grouping in the Zan tree as sister taxa basal to the entire Hominidae and Cercopithecidae clade, but in ST as single-species divergences. In Cercopithecidae, many tangles exist between members of the Macaca genus and the following species: Papio, Mandrillus, Theropithecus, Chlorocebus, and Cercocebus. Abbreviations are as follows: Homo n.: Homo neanderthalensis, Homo s.: Homo sapiens, Pan t.: Pan troglodytes, Pan p.: Pan paniscus, Rhinopithecus r.: Rhinopithecus roxellana, Rhinopithecus b.: Rhinopithecus bieti, Macaca n.: Macaca nemestrina, Macaca f.: Macaca fascicularis, and Macaca m.: Macaca mulatta.
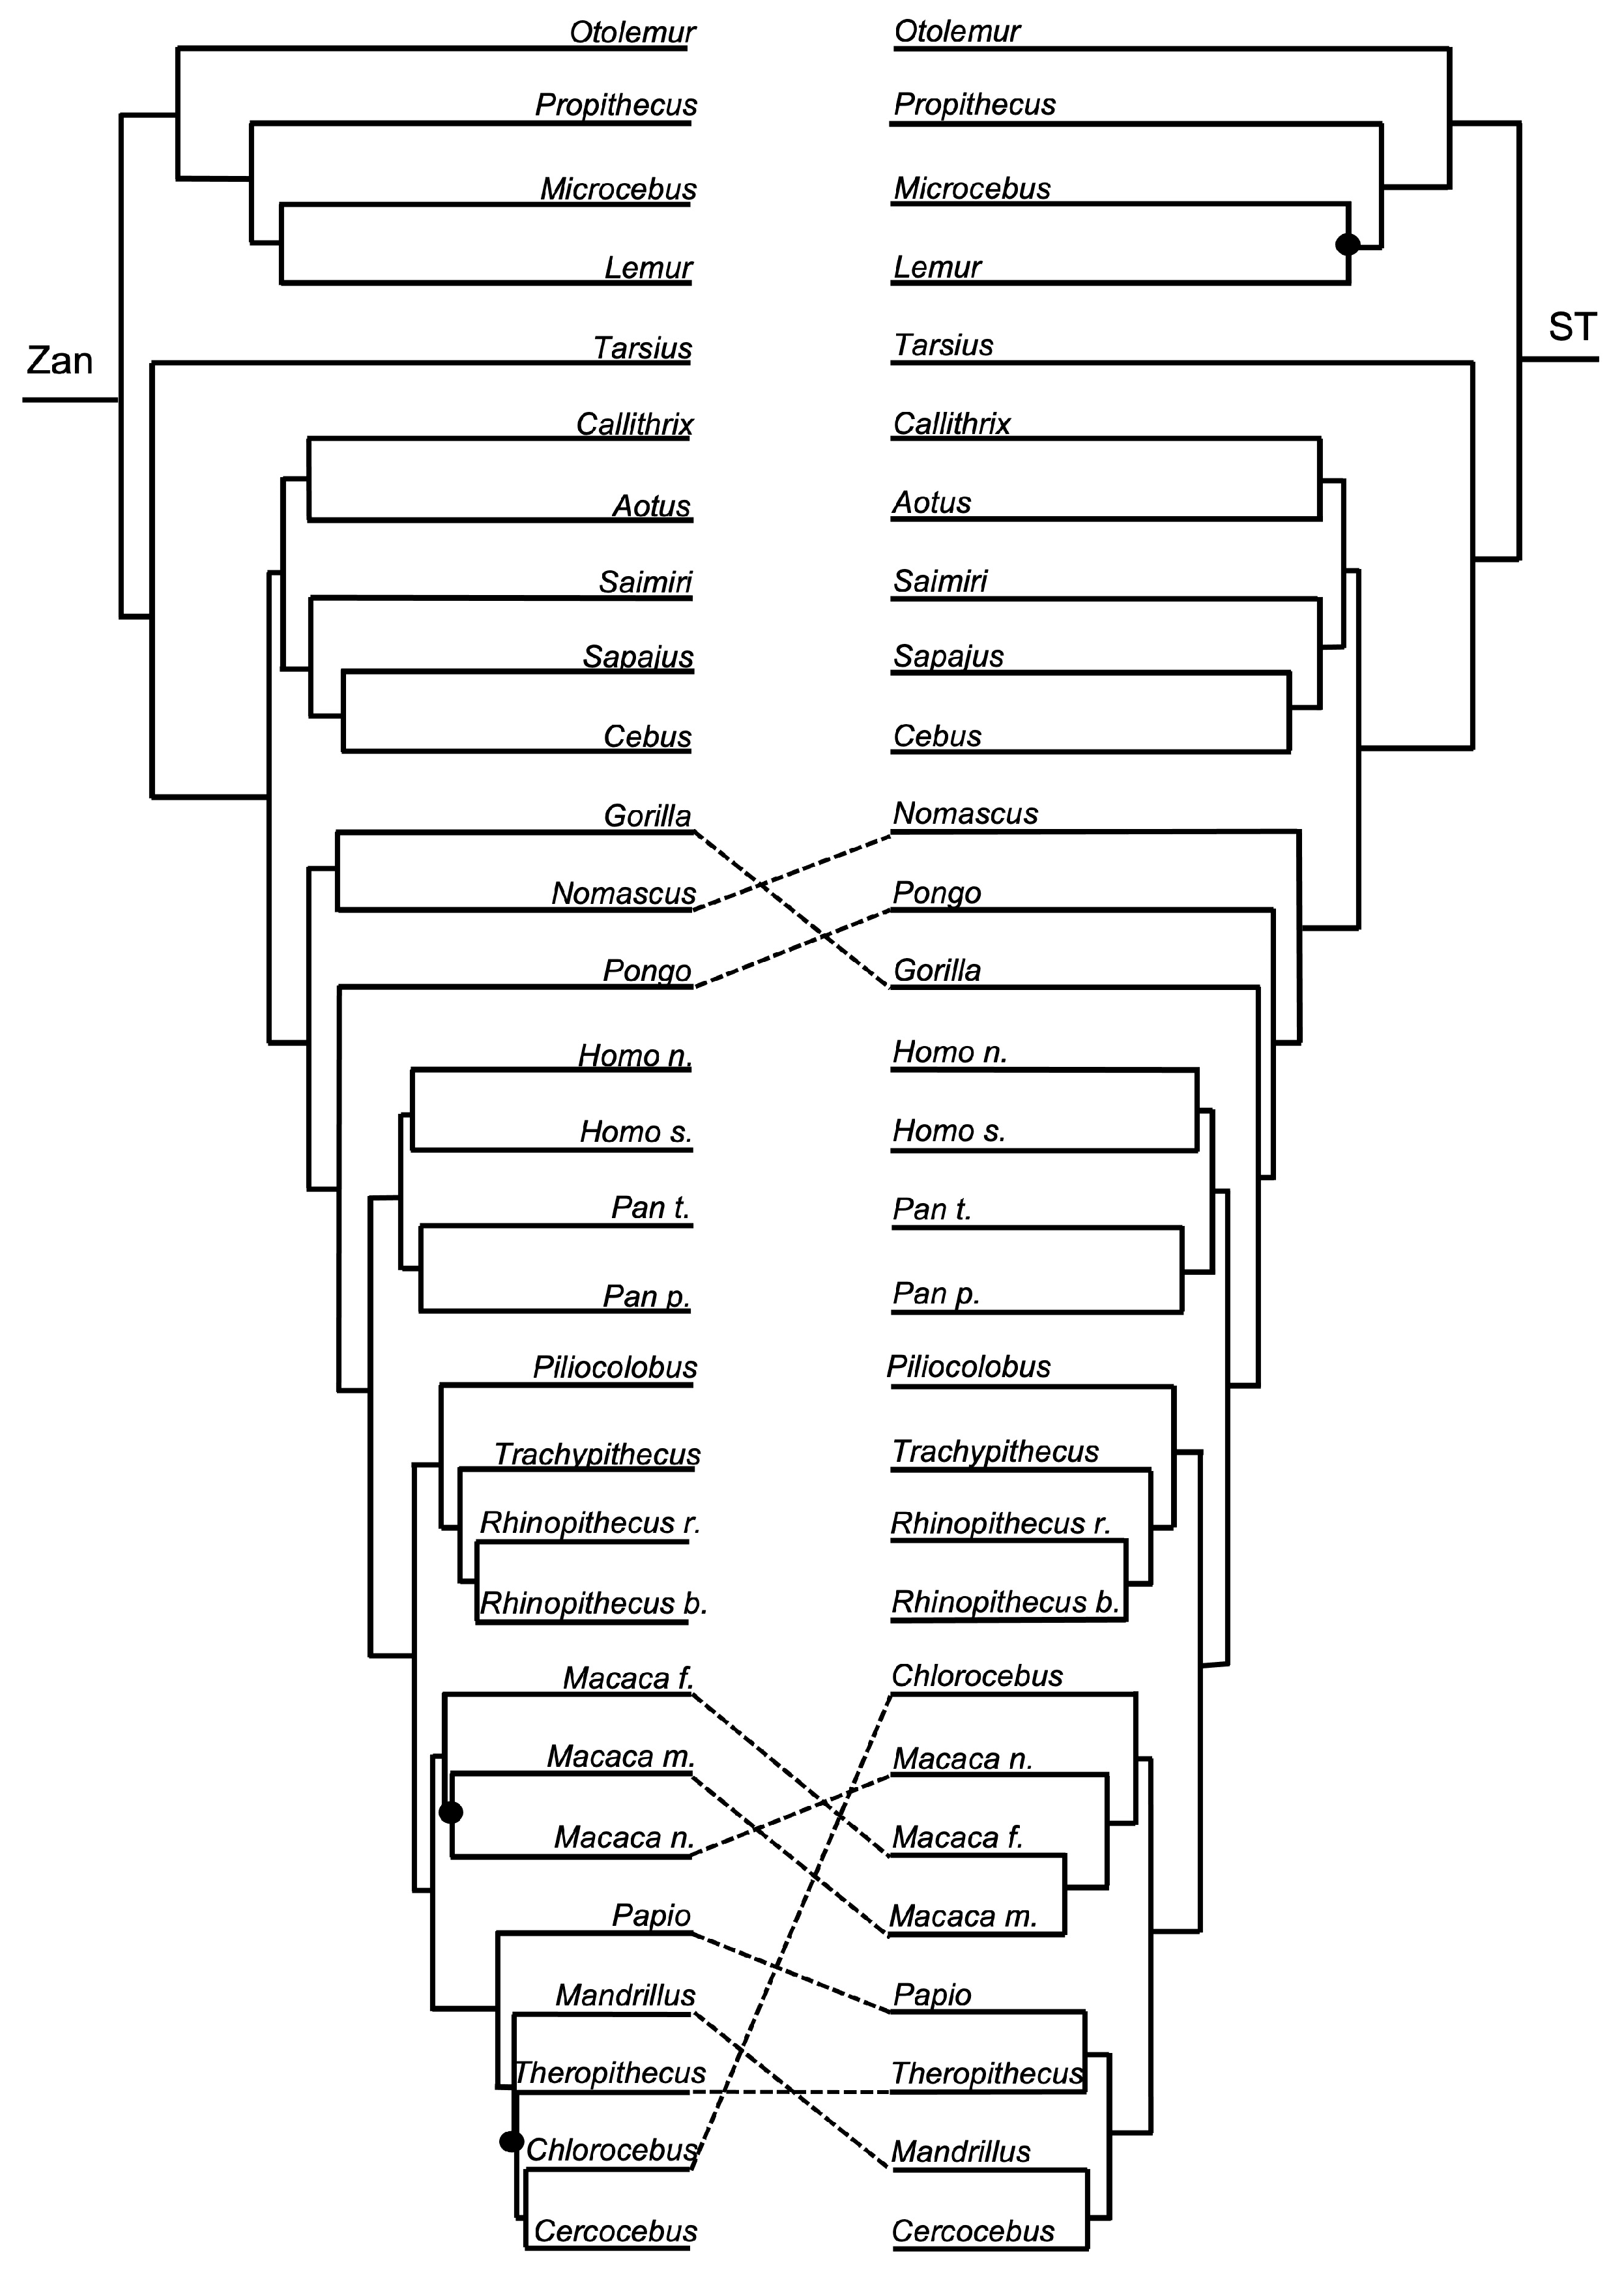
Figure 13.
Family-level tree for Rodentia. Note the single tangle between the Gerbillidae and Cricetidae rodent families.
Figure 13.
Family-level tree for Rodentia. Note the single tangle between the Gerbillidae and Cricetidae rodent families.

Figure 14.
Species-level tree for Rodentia. Note that the one tangle arising from the disparate grouping of Meriones produced a change in topology of Groups A, B, and C, but added no additional tangles. Note also the inclusion of Perognathus in the ST (Dipodomys ordii absent from Upham et al.) as representative of Dipodomys ordii because it serves as the closest relative to Dipodomys within the family Heteromyidae. Group A included Mesocricetus and Cricetulus; Group B included Onychomys, Peromyscus l., and Peromyscus m.; Group C included Myodes, Arvicola, Microtus orc., and Microtus ore. Abbreviations are as follows: Marmota mo.: Marmota monax, Marmota ma.: Marmota marmota, Marmota f.: Marmota flaviventris, Dipodomys o.: Dipodomys ordii, Dipodomys s.: Dipodomys spectabilis, Perognathus: Perognathus longimembris, Peromyscus l.: Peromyscus leucopus, Peromyscus m.: Peromyscus maniculatus, Microtus orc.: Microtus orchrogaster, Microtus ore.: Microtus oregoni, Rattus r.: Rattus rattus, Rattus n.: Rattus norvegicus, Mus p.: Mus pahari, Mus c.: Mus caroli, and Mus m.: Mus musculus.
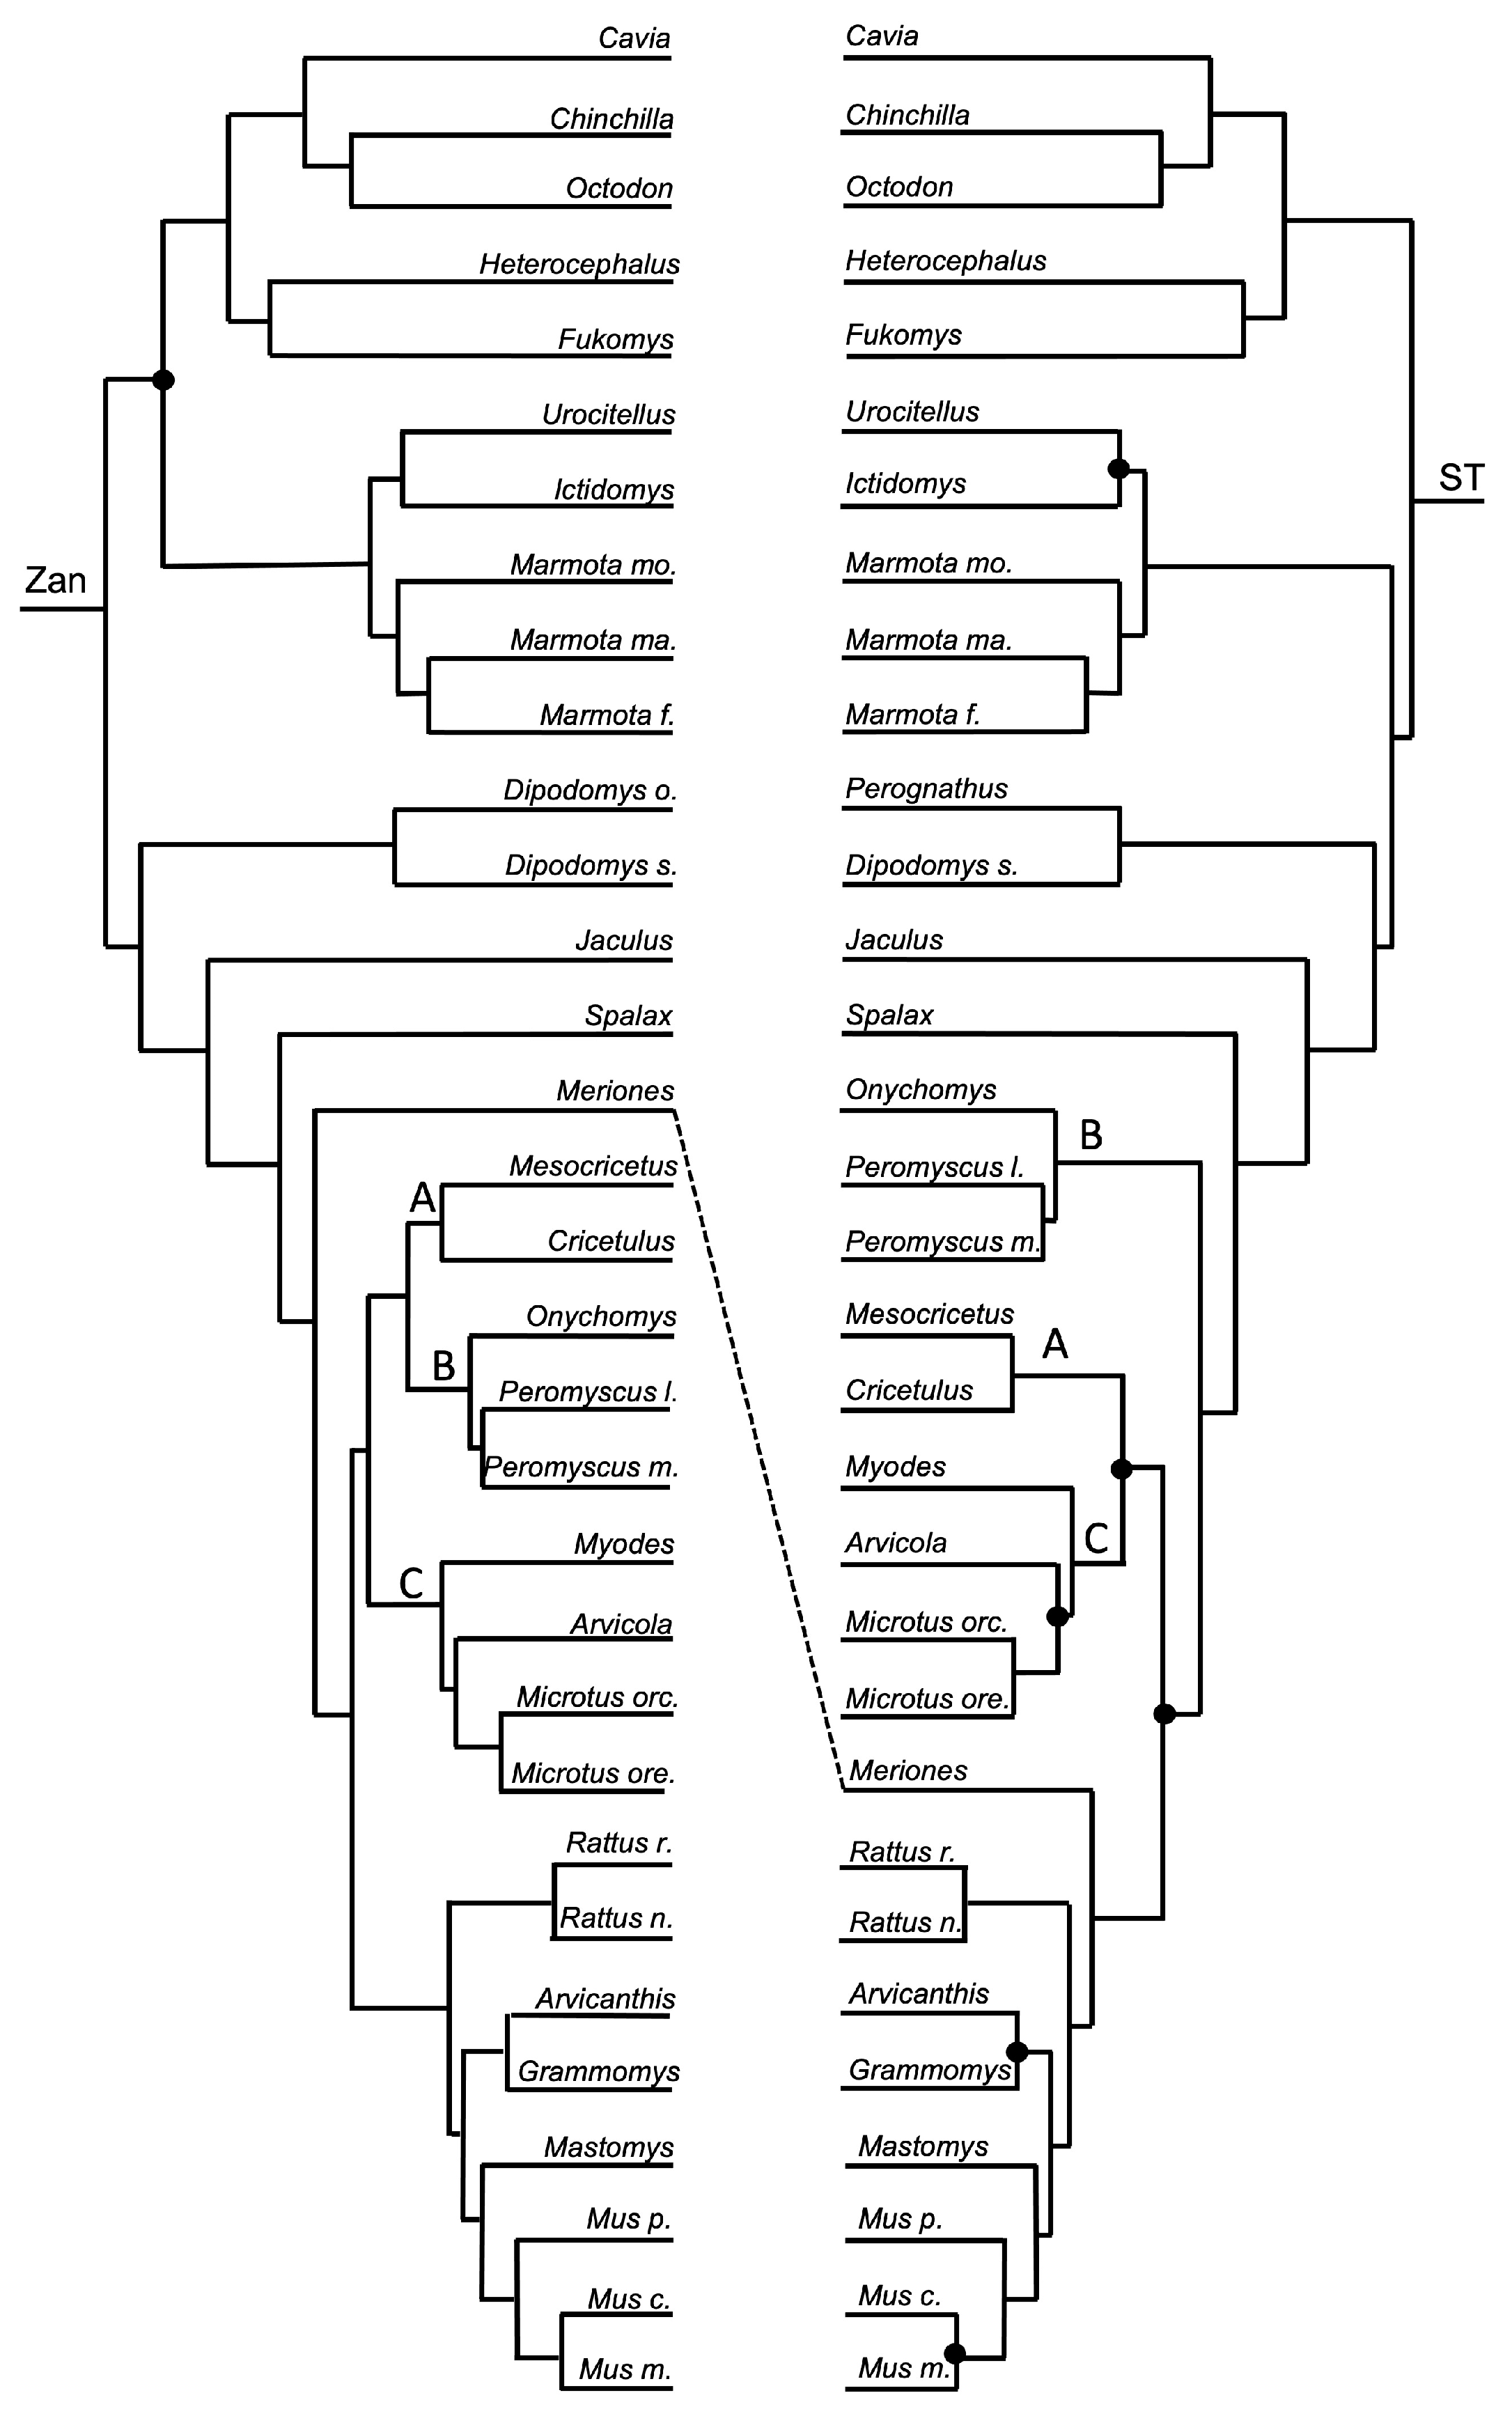

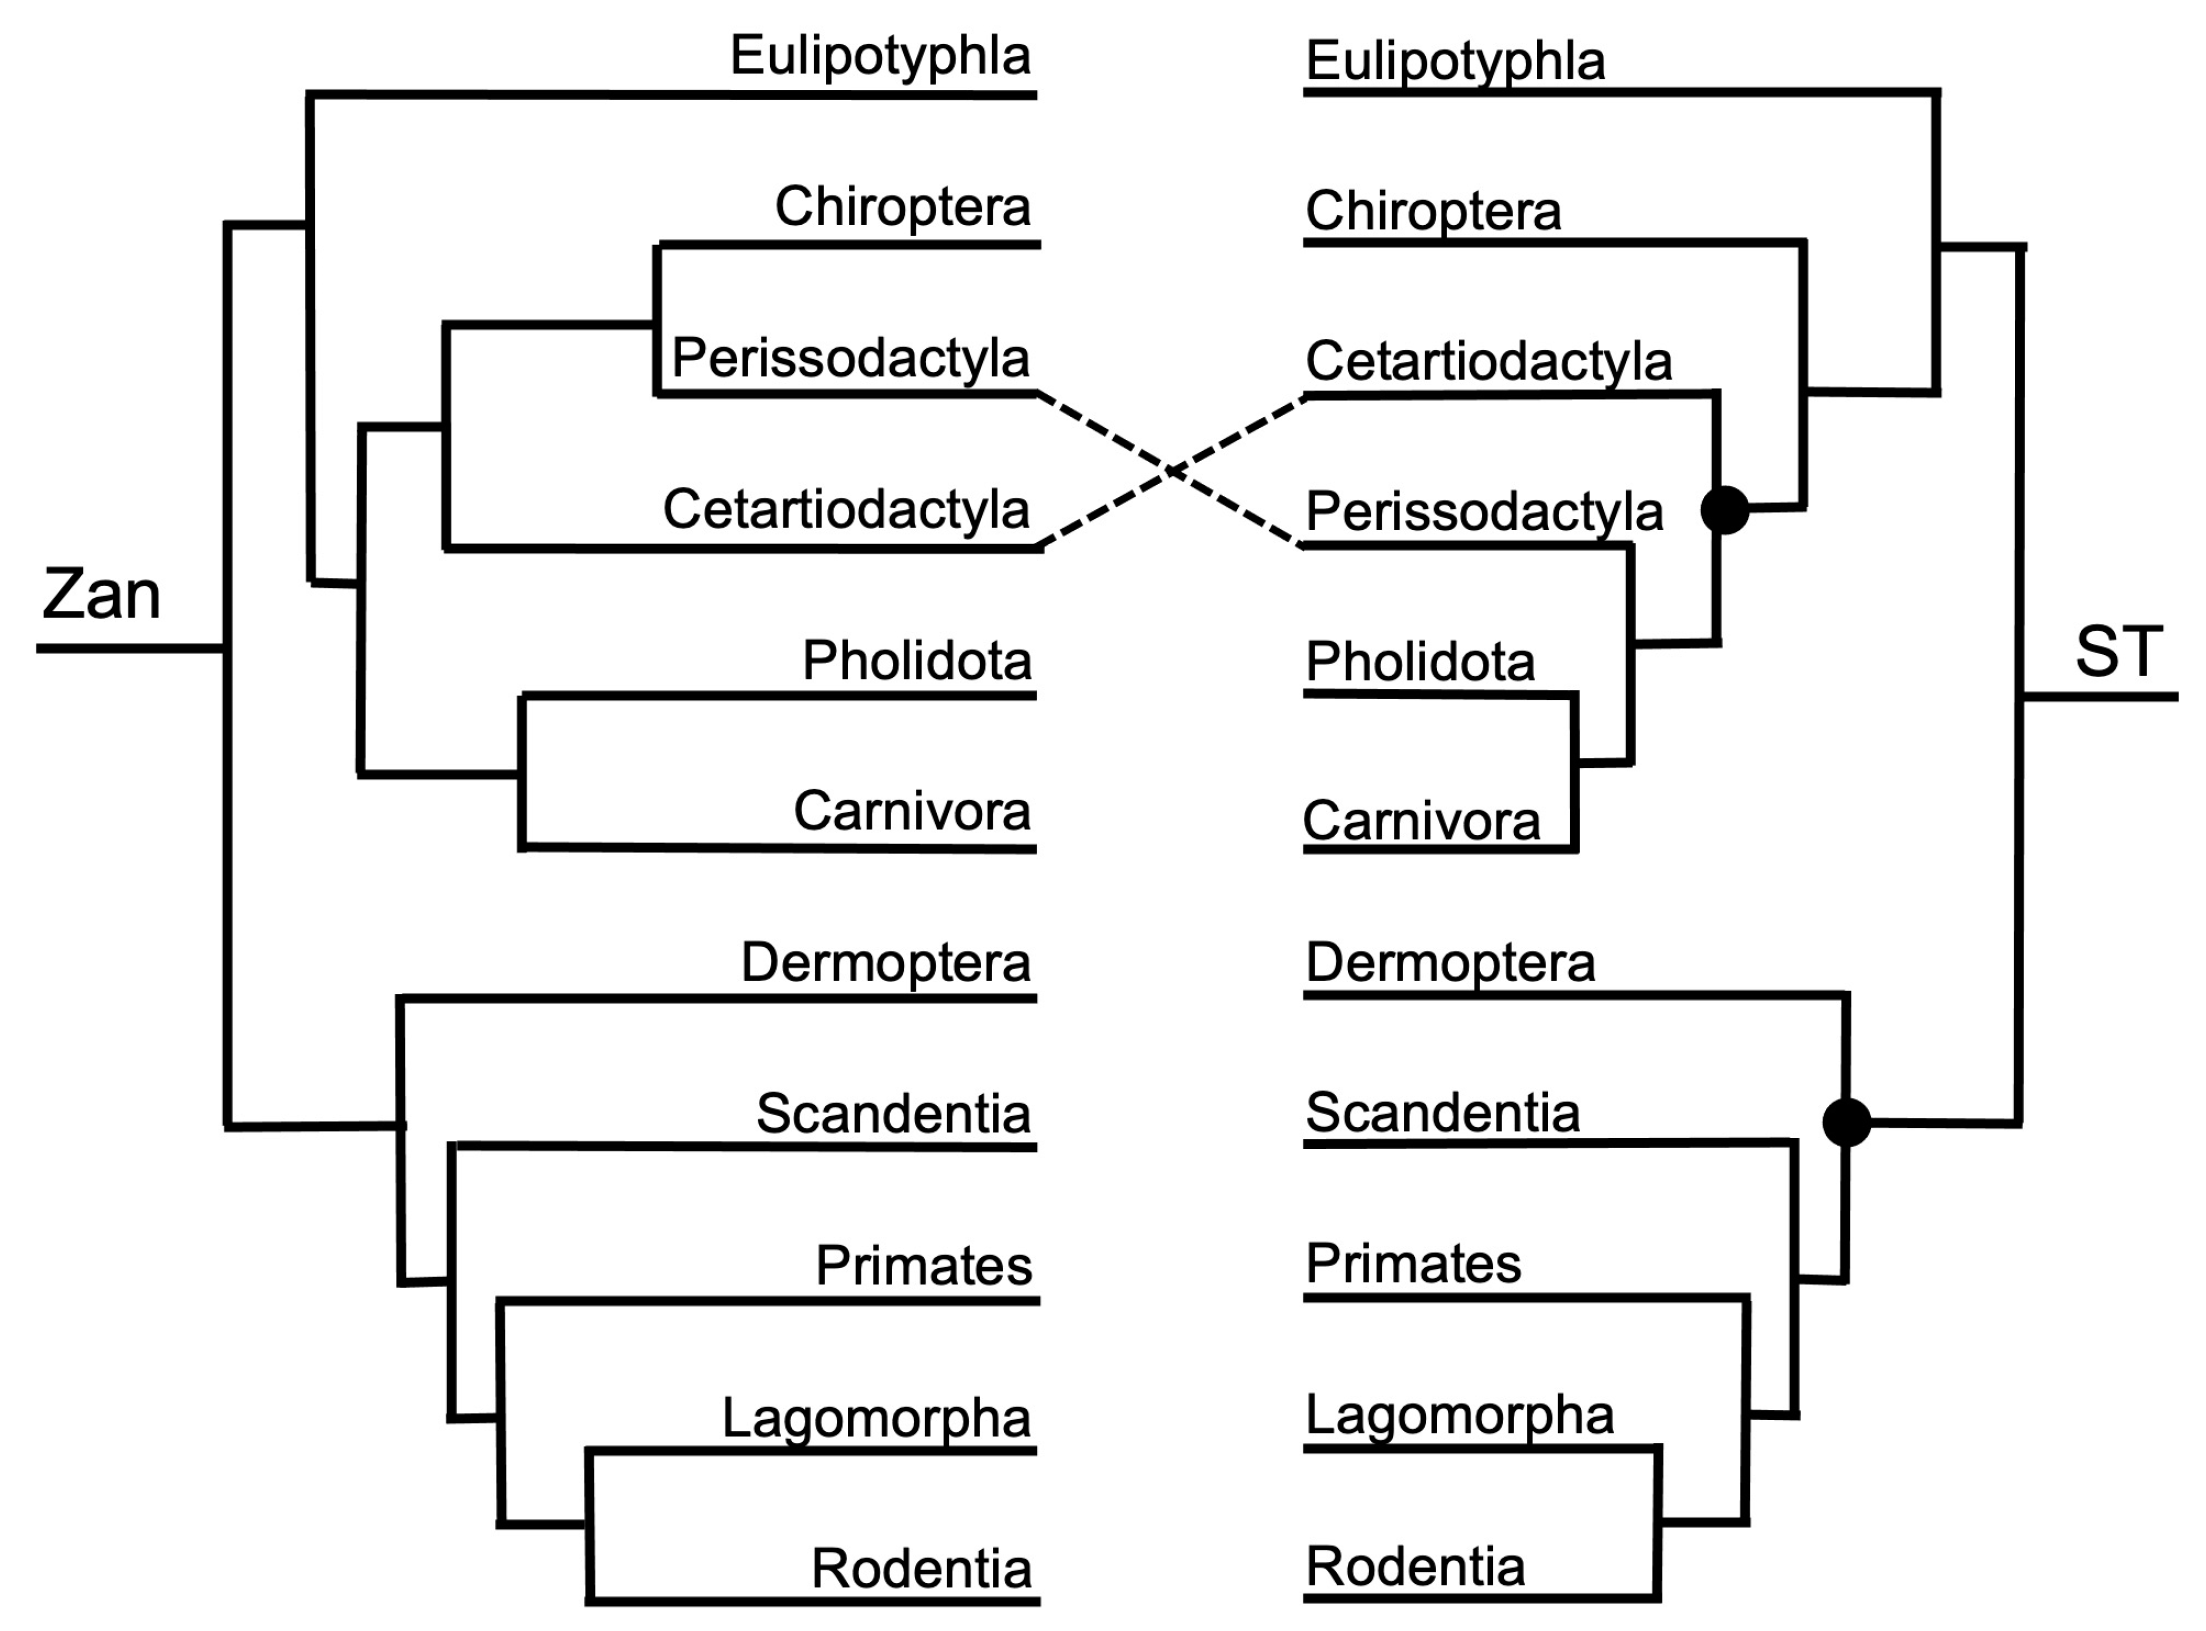
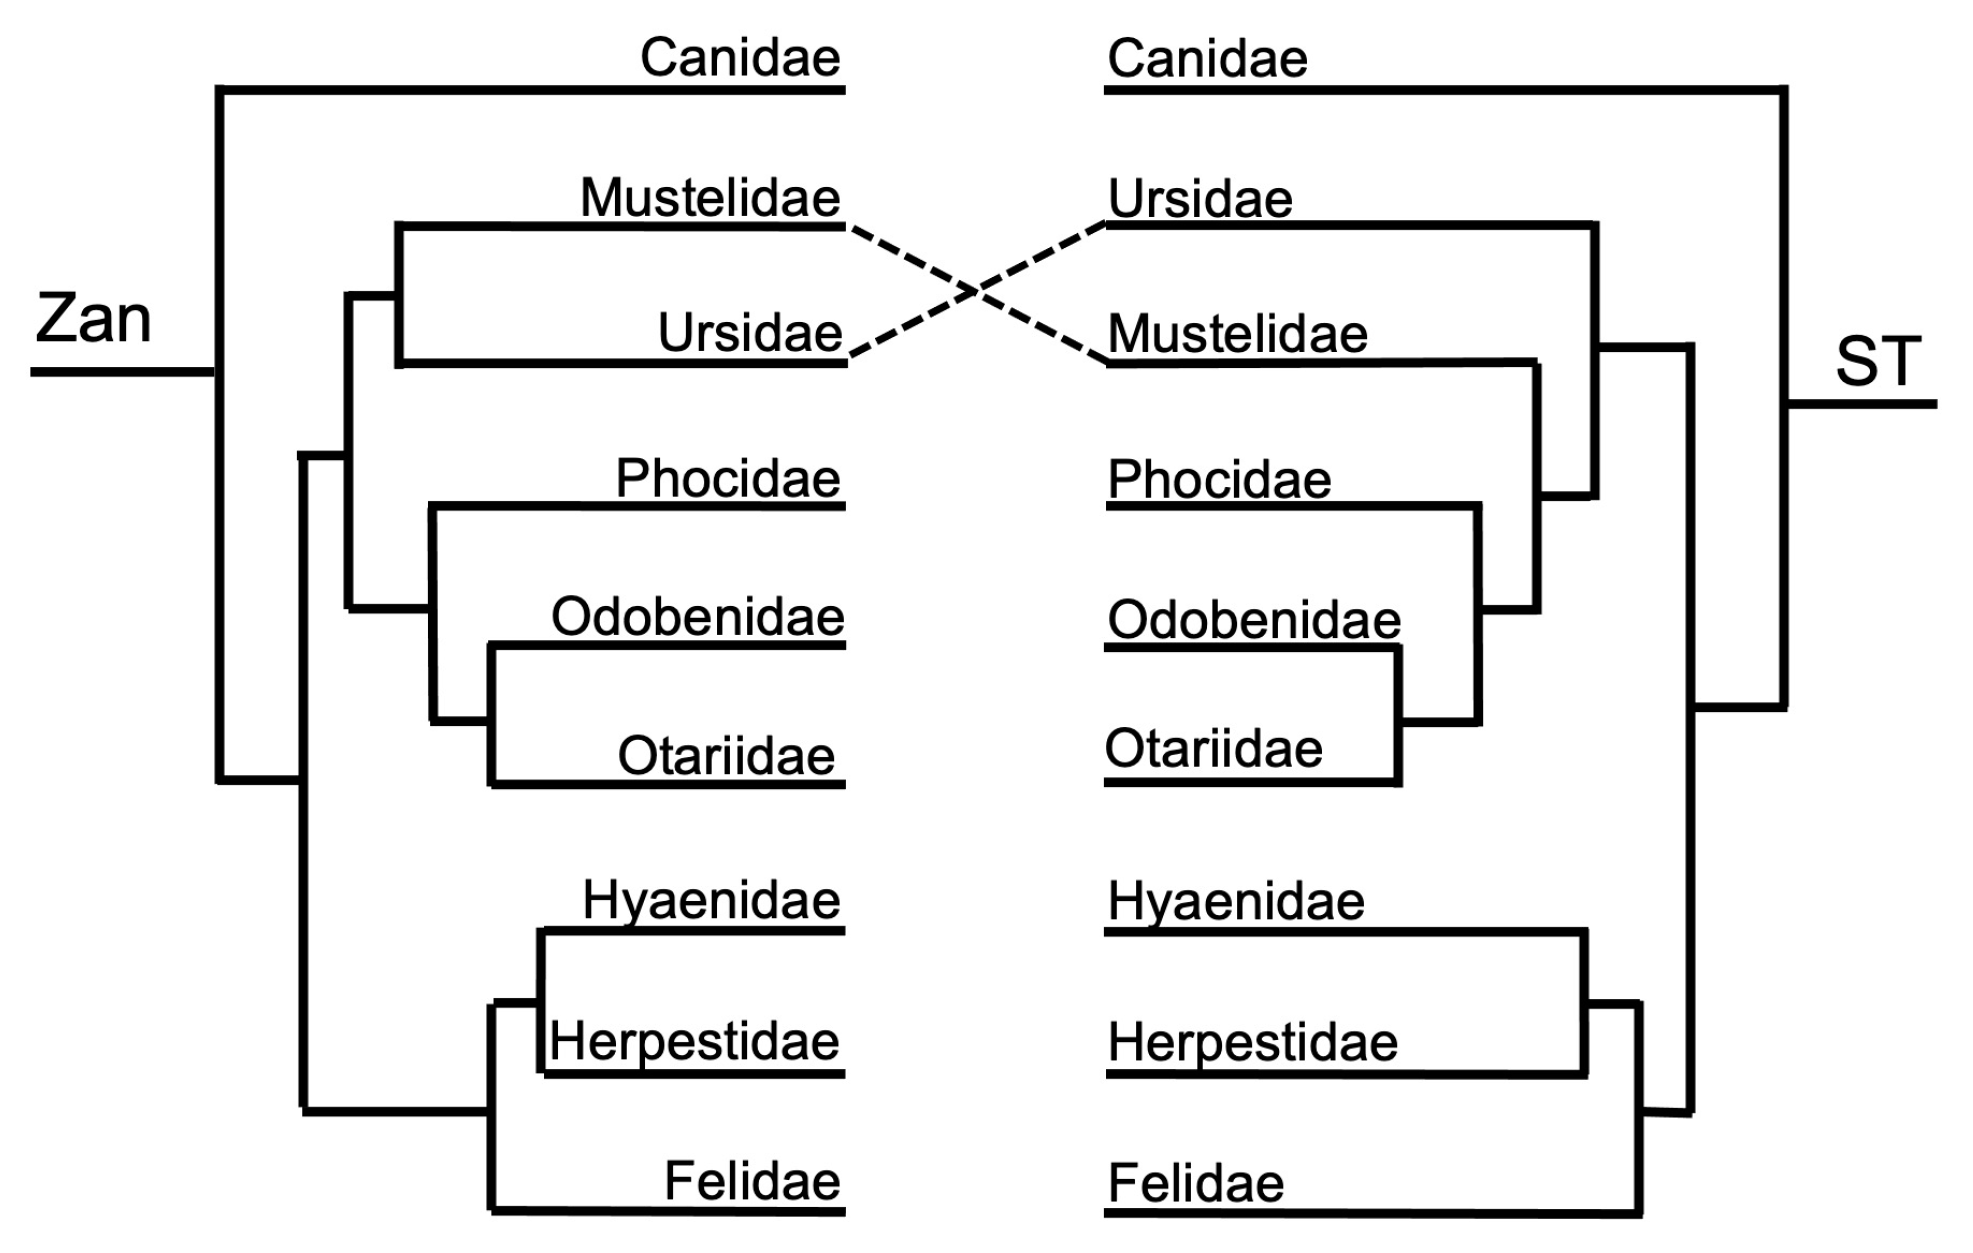
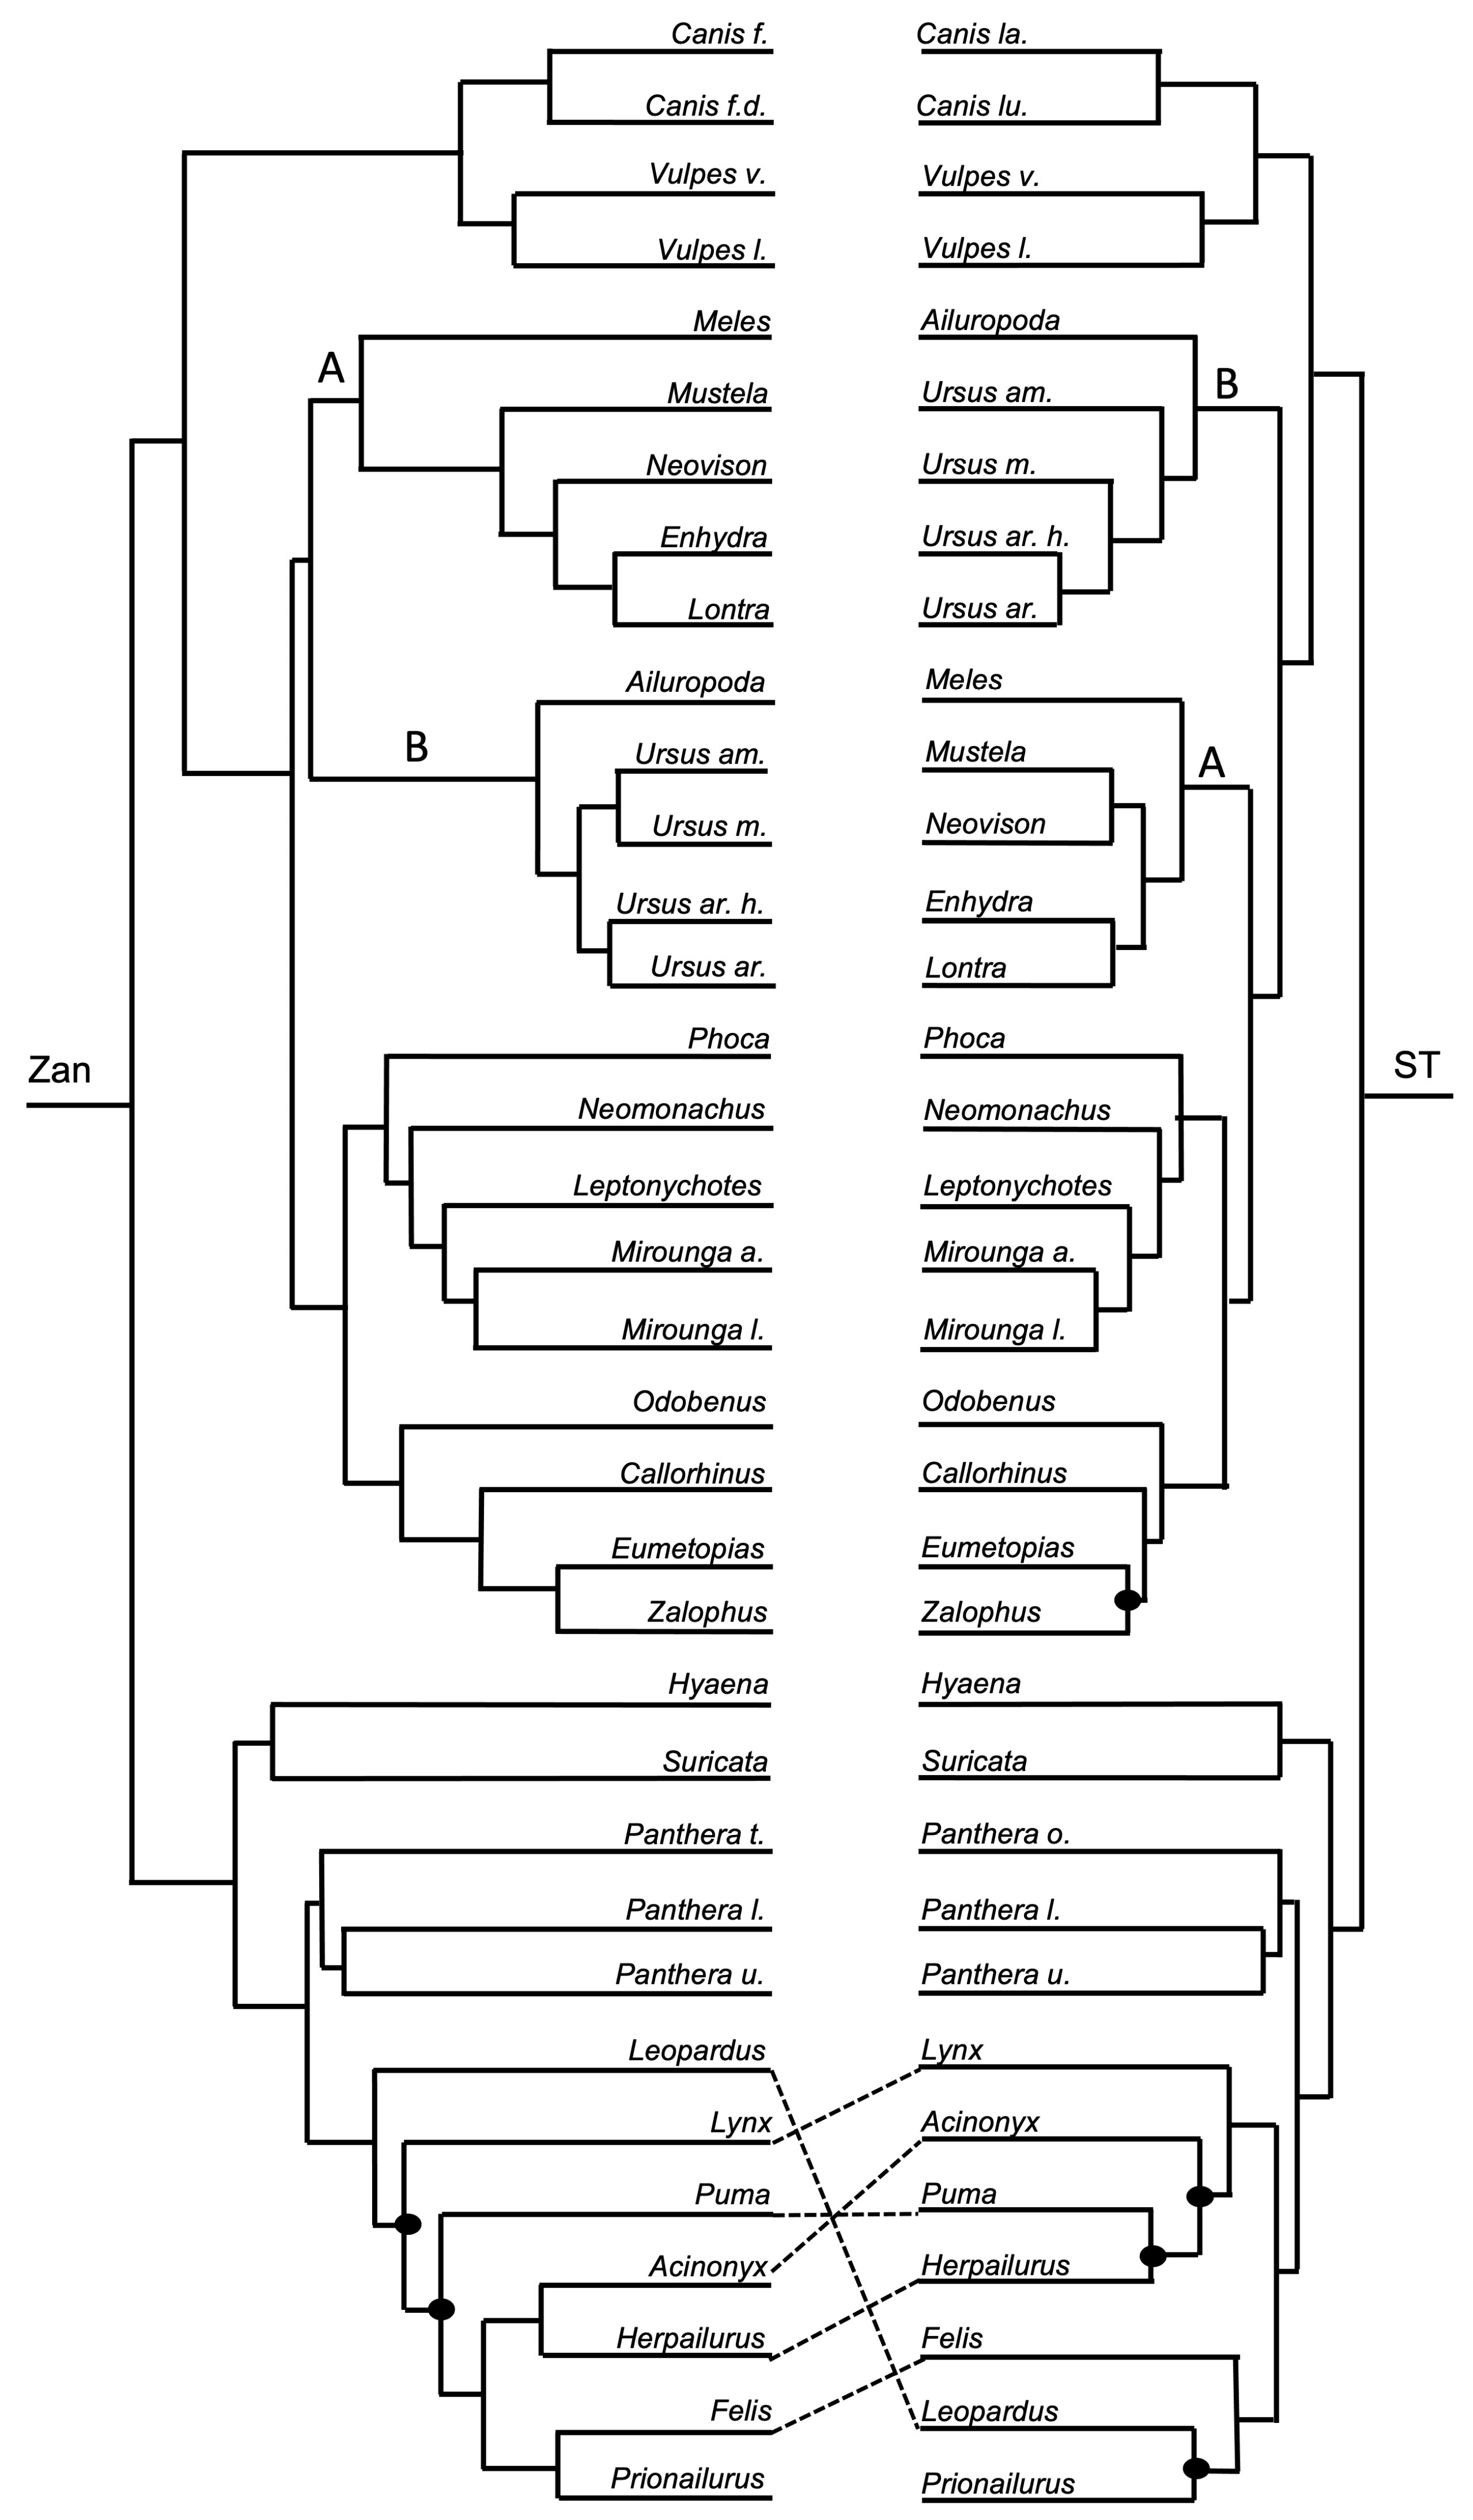
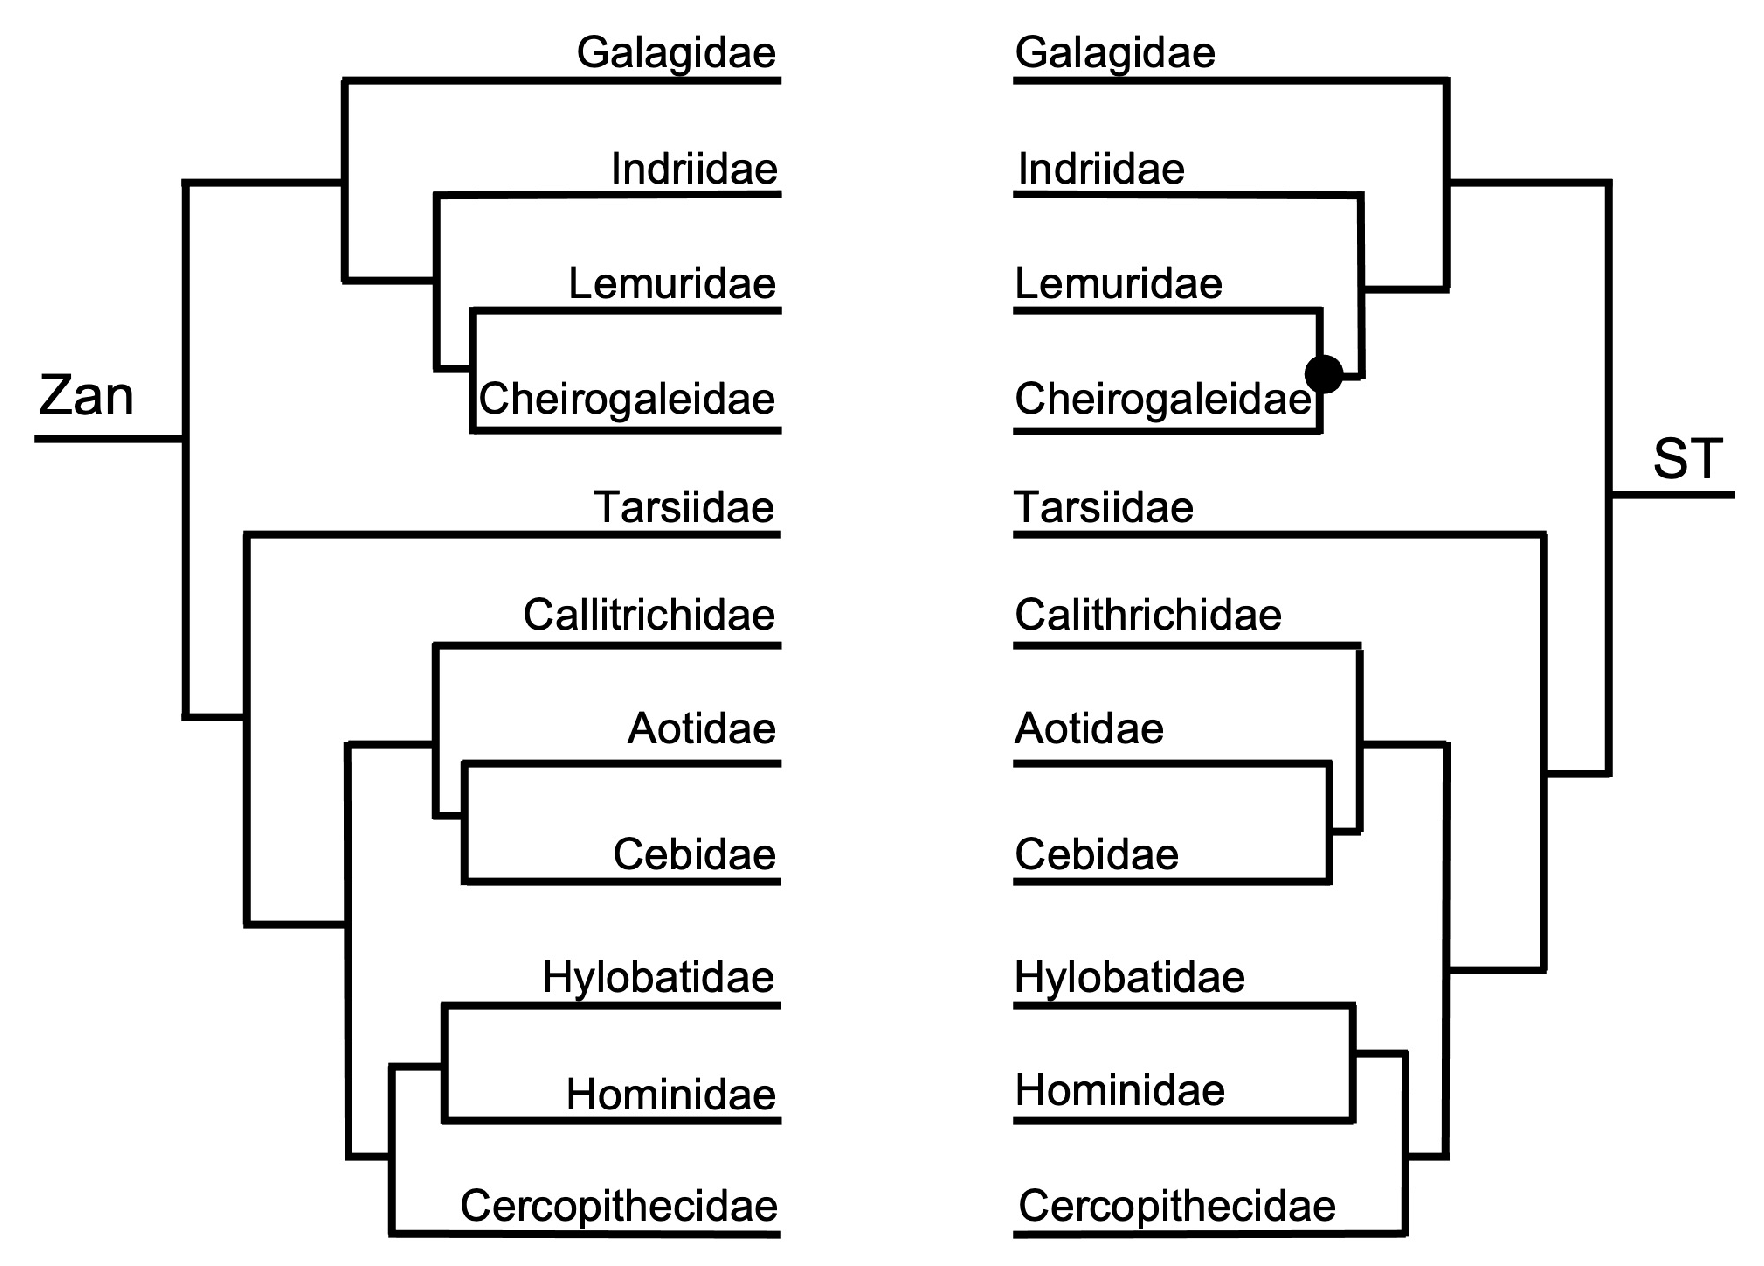
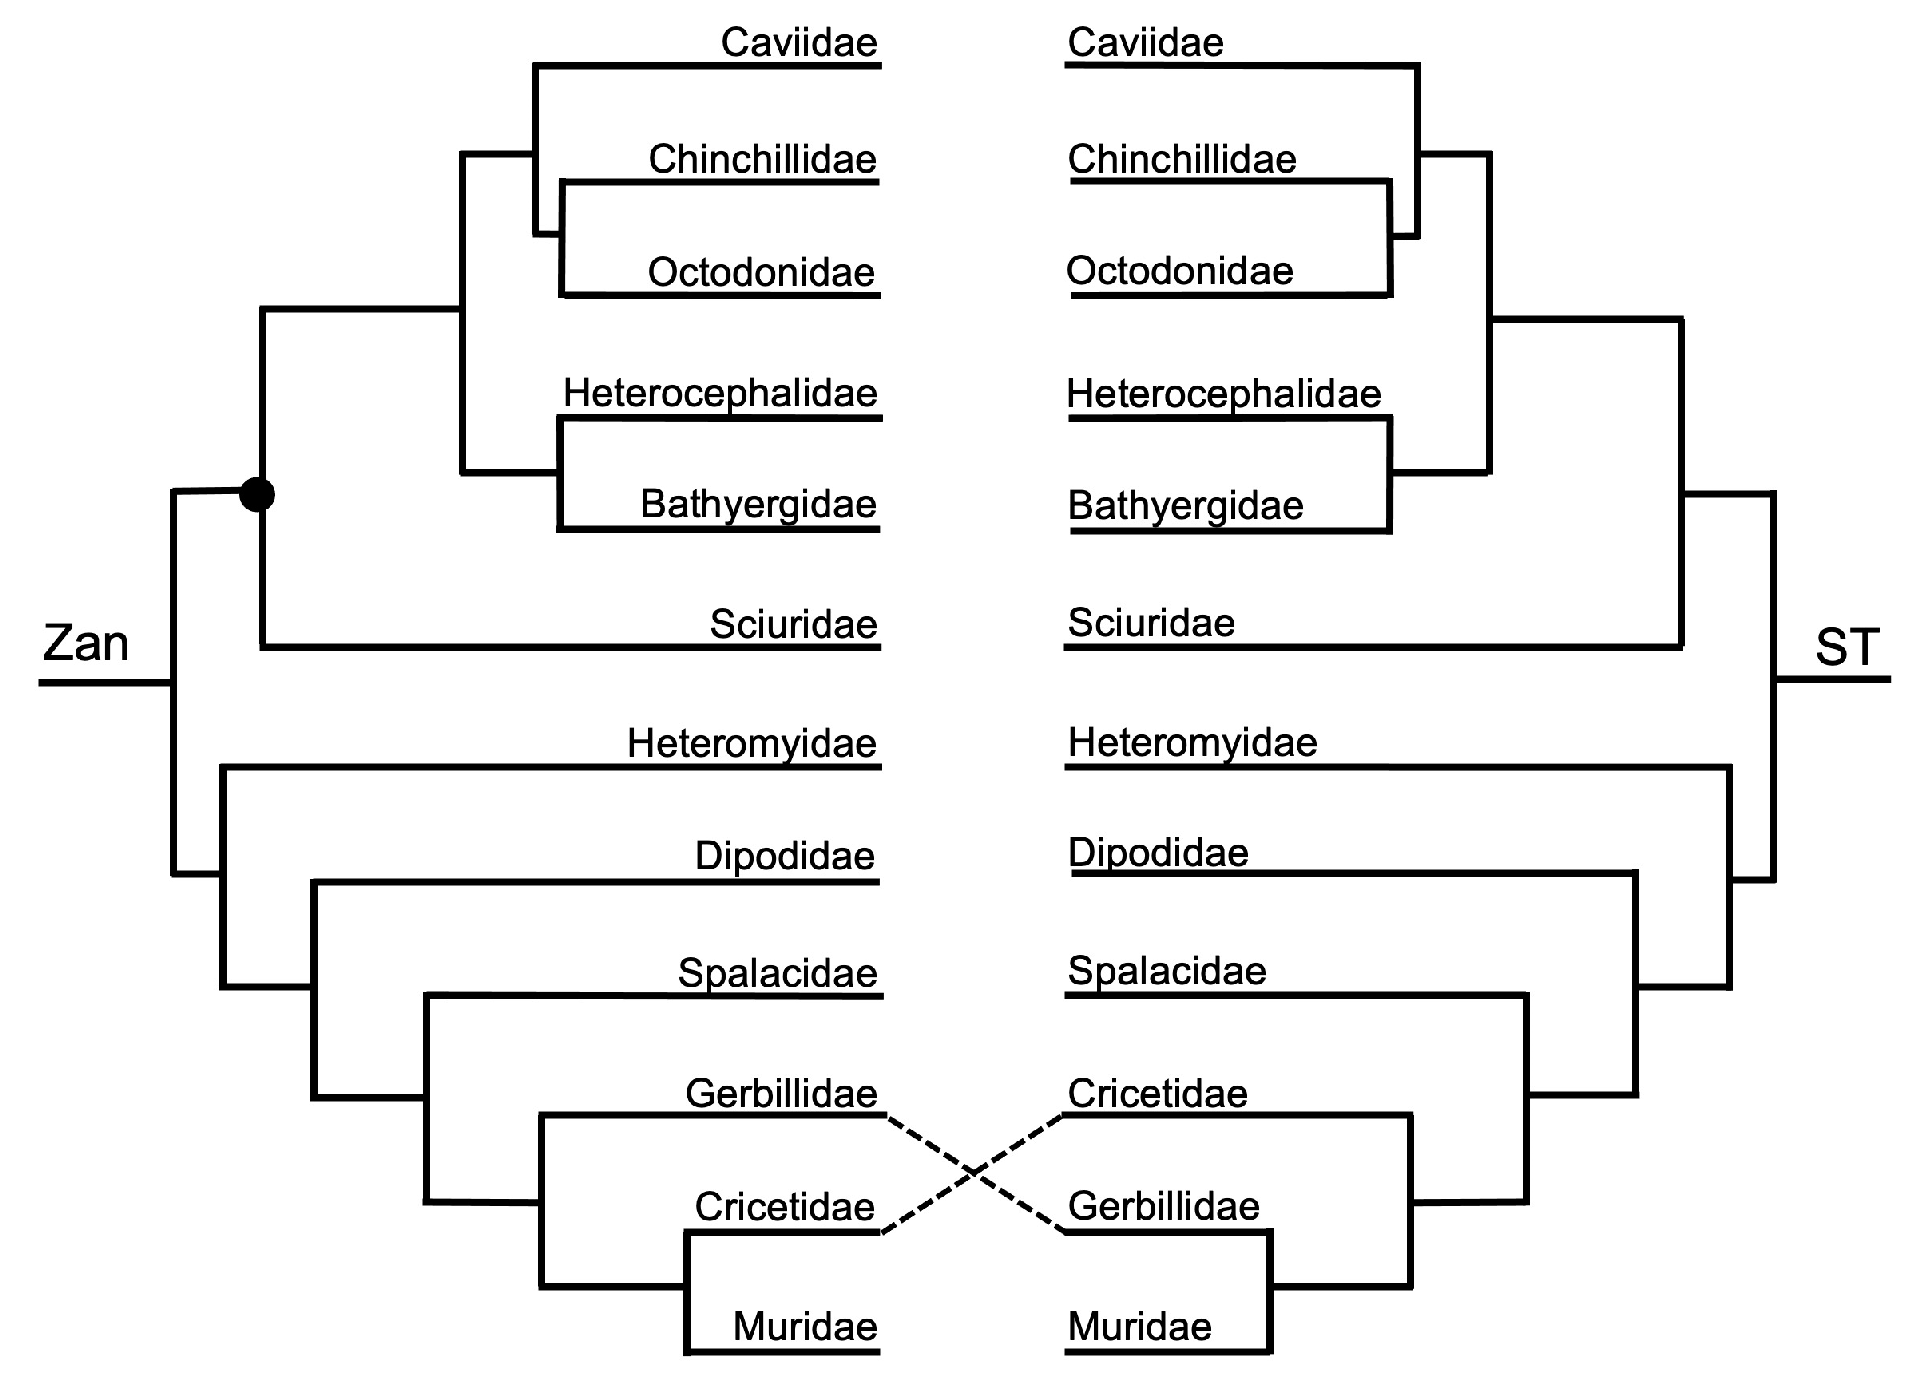
Table 1.
Taxonomic representation and compared sequence lengths of positively selected genes (shown in bold italics and listed in alphabetical order) evaluated for phylogenetic utility.
Table 1.
Taxonomic representation and compared sequence lengths of positively selected genes (shown in bold italics and listed in alphabetical order) evaluated for phylogenetic utility.
| Gene | Species | Families | Length (nt) | Gene | Species | Families | Length (nt) |
|---|---|---|---|---|---|---|---|
| Acr | 145 | 60 | 2133 | Spaca6 | 133 | 51 | 2787 |
| Adam2 | 105 | 51 | 2413 | Spam1 | 120 | 50 | 2288 |
| Adam18 | 82 | 41 | 2939 | Spink2 | 147 | 55 | 646 |
| Adam32 | 106 | 47 | 3378 | Sprr4 | 119 | 50 | 414 |
| Adgre1 | 147 | 57 | 6871 | Tas1r2 | 85 | 42 | 2370 |
| C5ar1 | 146 | 59 | 1812 | Tchhl1 | 137 | 54 | 3294 |
| Ccdc54 | 155 | 62 | 1749 | Tcn1 | 132 | 60 | 1833 |
| Ccl1 | 140 | 55 | 465 | Tcte1 | 162 | 65 | 1972 |
| Cfh | 95 | 45 | 4884 | Tecta | 110 | 61 | 4317 |
| Cr2 | 118 | 46 | 8016 | Tectb | 166 | 63 | 1102 |
| Cytb | 114 | 62 | 1095 | Tpx1 | 87 | 38 | 846 |
| Gpr50 | 155 | 62 | 2798 | Tex11 | 130 | 53 | 4760 |
| Izumo1 | 144 | 60 | 2150 | Tex14 | 166 | 67 | 4518 |
| Izumo1R | 159 | 59 | 1605 | Tnp2 | 124 | 49 | 1213 |
| Lelp1 | 131 | 55 | 549 | Usp26 | 139 | 58 | 3389 |
| Man2b1 | 103 | 48 | 4368 | Wbp2nl | 155 | 60 | 1916 |
| Prdm9 | 57 | 27 | 2872 | Zan | 170 | 66 | 6873 |
| Prm1 | 66 | 34 | 890 | Zp2 | 125 | 59 | 3639 |
| Prm2 | 77 | 28 | 609 | Zp3 | 159 | 64 | 1667 |
| S100a2 | 137 | 59 | 394 | ||||
| Slc6a5 | 103 | 57 | 3128 | Total: | 104,962 |
Disclaimer/Publisher’s Note: The statements, opinions and data contained in all publications are solely those of the individual author(s) and contributor(s) and not of MDPI and/or the editor(s). MDPI and/or the editor(s) disclaim responsibility for any injury to people or property resulting from any ideas, methods, instructions or products referred to in the content. |
© 2023 by the authors. Licensee MDPI, Basel, Switzerland. This article is an open access article distributed under the terms and conditions of the Creative Commons Attribution (CC BY) license (https://creativecommons.org/licenses/by/4.0/).
Share and Cite
MDPI and ACS Style
Roberts, E.K.; Wright, E.A.; Worsham, A.E.; Hardy, D.M.; Bradley, R.D. Gamete Recognition Gene Divergence Yields a Robust Eutherian Phylogeny across Taxonomic Levels. Diversity 2023, 15, 1145. https://doi.org/10.3390/d15111145
AMA Style
Roberts EK, Wright EA, Worsham AE, Hardy DM, Bradley RD. Gamete Recognition Gene Divergence Yields a Robust Eutherian Phylogeny across Taxonomic Levels. Diversity. 2023; 15(11):1145. https://doi.org/10.3390/d15111145
Chicago/Turabian StyleRoberts, Emma K., Emily A. Wright, Asha E. Worsham, Daniel M. Hardy, and Robert D. Bradley. 2023. "Gamete Recognition Gene Divergence Yields a Robust Eutherian Phylogeny across Taxonomic Levels" Diversity 15, no. 11: 1145. https://doi.org/10.3390/d15111145
Note that from the first issue of 2016, this journal uses article numbers instead of page numbers. See further details here.