Article

Assessing Genetic Diversity and Population Differentiation in Wild Hop (Humulus lupulus) from the Region of Central Greece via SNP-NGS Genotyping

by
Konstantinos Tegopoulos
1,†,
Dimitrios V. Fountas
1,†,
Elisavet-Maria Andronidou
2,
Pantelis G. Bagos
2,
Petros Kolovos
1,
George Skavdis
1,
Panagiotis Pergantas
3,
Georgia G. Braliou
2,
Aristotelis C. Papageorgiou
1,* and
Maria E. Grigoriou
1,*
1
Department of Molecular Biology & Genetics, Democritus University of Thrace, 68100 Alexandroupolis, Greece
2
Department of Computer Science and Biomedical Informatics, University of Thessaly, 35100 Lamia, Greece
3
Bioapplications O.E., 32100 Livadia, Greece
*
Authors to whom correspondence should be addressed.
These authors contributed equally to this work.
Diversity 2023, 15(12), 1171; https://doi.org/10.3390/d15121171
Submission received: 2 November 2023 / Revised: 22 November 2023 / Accepted: 23 November 2023 / Published: 24 November 2023
(This article belongs to the Section Plant Diversity)

Abstract

:
A growing need for the development of novel hop (Humulus lupulus) varieties has emerged as a result of the increasing demand for beers with distinct organoleptic characteristics and the expected impact of climate change on hop cultivars. As the genetic variation in the existing hop cultivars is low, wild hop germplasm can be used as a source for the development of novel cultivars. In this work, we analyzed, for the first time, the genetic diversity of H. lupulus var. lupulus wild germplasm in Greece. A SNP-NGS genotyping approach using a set of nine specific genetic markers, was employed in order to determine individual genotypes and to perform population structure analyses of wild hops from a region with complex topography, namely the Region of Central Greece. Our results revealed low differentiation among populations, with the spatial genetic patterns observed relating mainly to topographical elements rather than geographic distance. Interestingly, within wild hop populations, high genetic diversity was observed, showing that in the region of Central Greece, wild H. lupulus germplasm has significant potential that can be exploited in breeding programs towards the development of local, well adapted and potentially superior hop varieties.

1. Introduction

Hop (Humulus lupulus L.) is a dioecious, wind pollinated, diploid (2n = 18 + XX/XY) plant of economic importance that belongs to the Cannabaceae family [1]. Hop most likely originated in China; however, it thrives throughout the northern hemisphere [2,3,4]. Based on both morphological characteristics and geographical distribution, wild hop has been classified into five varieties: H. lupulus var. lupulus in Asia and Europe; H. lupulus var. cordifolius in eastern Asia, as well as in Japan; and H. lupulus var. neomexicanus, H. lupulus var. pubescens, and H. lupulus var. lupuloides in North America [4,5]. H. lupulus var. fengxianensis has been described in Asia; however, it is not yet clear if this is a different variety [6].
The economic importance of hop is primarily due to the crucial role it has in beer production and, to a lesser extent, to its pharmaceutical properties [7,8,9,10]. The mature unfertilized hop cones from female plants (hops) contain a large number of secondary metabolites; among these three major classes, namely prenylflavonoids, essential oils and bitter acids (α-and β-acids) largely accumulated in lupulin, the resinous substance synthesized within the glandular hairs of the cones, have a crucial role in shaping the organoleptic characteristics of the beer-bitter taste and aroma [10,11,12]. In addition, several studies have shown that the compounds present in hops extracts can be used as antimicrobial or anti-inflammatory agents as well as for the management of a number of diseases such as insomnia, depression and anxiety [13,14].
A number of studies using gene markers (RAPD, RFLPs, nuclear rDNA, chloroplast DNA regions, SSR) have been used so far to assess wild hop genetic heterogeneity, as well as to validate commercial cultivars [3,15,16,17,18,19]. The use of SNPs (Single-Nucleotide Polymorphisms), a robust molecular identification approach, was applied in hop relatively late, and SNPs characterization was only described in 2013 by Matthews et al. in a comprehensive study that identified and validated a set of 17,128 SNPs in the 2.8 Gb hop genome [20,21]. Next-Generation Sequencing (NGS) is most suitable for SNP-based molecular identification; this, along with the continuing cost reduction, has led to a significant increase in the use of this method for the molecular identification and/or classification of plant species and cultivars [22]. A prerequisite, however, for quick, efficient, and accurate NGS-SNP-based molecular identification is the availability of optimal SNP panels—small sets of SNPs capable of discriminating between varieties. In this vein, Jiang et al. selected 12 markers out of 2000 SNPs and used them to successfully identify 16 hop varieties, while Henning et al. managed to successfully distinguish 116 hop varieties using a panel consisting of just 7 SNPs [23,24].
Hop cultivars derive from breeding programs that aim to develop plants with desirable traits (for instance, high yield or high bitter acids content); interestingly, many of the commercial varieties used today are of European origin (var. lupulus) originally developed in North European countries that are major beer producers (UK, Germany, Czech Republic, etc.); as a result, the genetic diversity among hop cultivars is limited and this is, to a large extend, reflected in their chemical profiles and, eventually, in the organoleptic characteristics of the beer [4,8]. For this reason, breweries worldwide seek new hop varieties that can increase the added valued of their products by providing unique taste and aromas [25].
Climate change is expected to have a major impact on commercial hop varieties, as a decline in both yield and acids content is predicted; therefore, new varieties that are better adapted to the new conditions will be needed [26]. Notably, the comparison of the average annual yield of European aroma hops between 1971–1994 and 1995–2018 revealed a significant decrease in the yield as well as in the alpha acids content [27]. Based on the data from 1971–2018, models predict a climate-induced decline in both the yield and in the bitter acids that give the beer its characteristic aroma.
Addressing both the market demand, as well as the climate change challenges, in recent years, a trend has emerged involving the crossbreeding of established hop varieties with wild hop plants, since the latter can support, as a source of high genetic diversity and local adaptation, the generation of new cultivars [25,28,29,30,31,32,33].
In Greece, there is no hop cultivation tradition. Notably, systematic hop cultivation of commercial varieties started in the past decade, following an increase in the number of regional microbreweries; only one company is growing commercial varieties in the Region of Peloponnese, the southernmost part of the Greek peninsula. Wild hop populations have not been mapped or studied yet, despite the frequent occurrence of hop plants in the Regions of Epirus, Macedonia, Thrace, Peloponnese, and Central Greece, which has been observed since the ancient times [34]. In particular, the Region of Central Greece, with its complex geomorphological landscape which includes a multitude of streams and rivers, harbors a large number of potential hop habitats.
In this study, we have mapped the sites of wild hop populations in the Region of Central Greece and used an NGS-SNP based genotyping approach to uncover the genetic makeup of these wild populations, as well as their spatial genetic patterns. By doing so, we aim to provide useful data for the design and implementation of future hop breeding programs towards the development of local, well-adapted and potentially superior hop varieties, thereby providing breweries with a competitive advantage in producing distinctive and high-quality beverages.

2. Materials and Methods

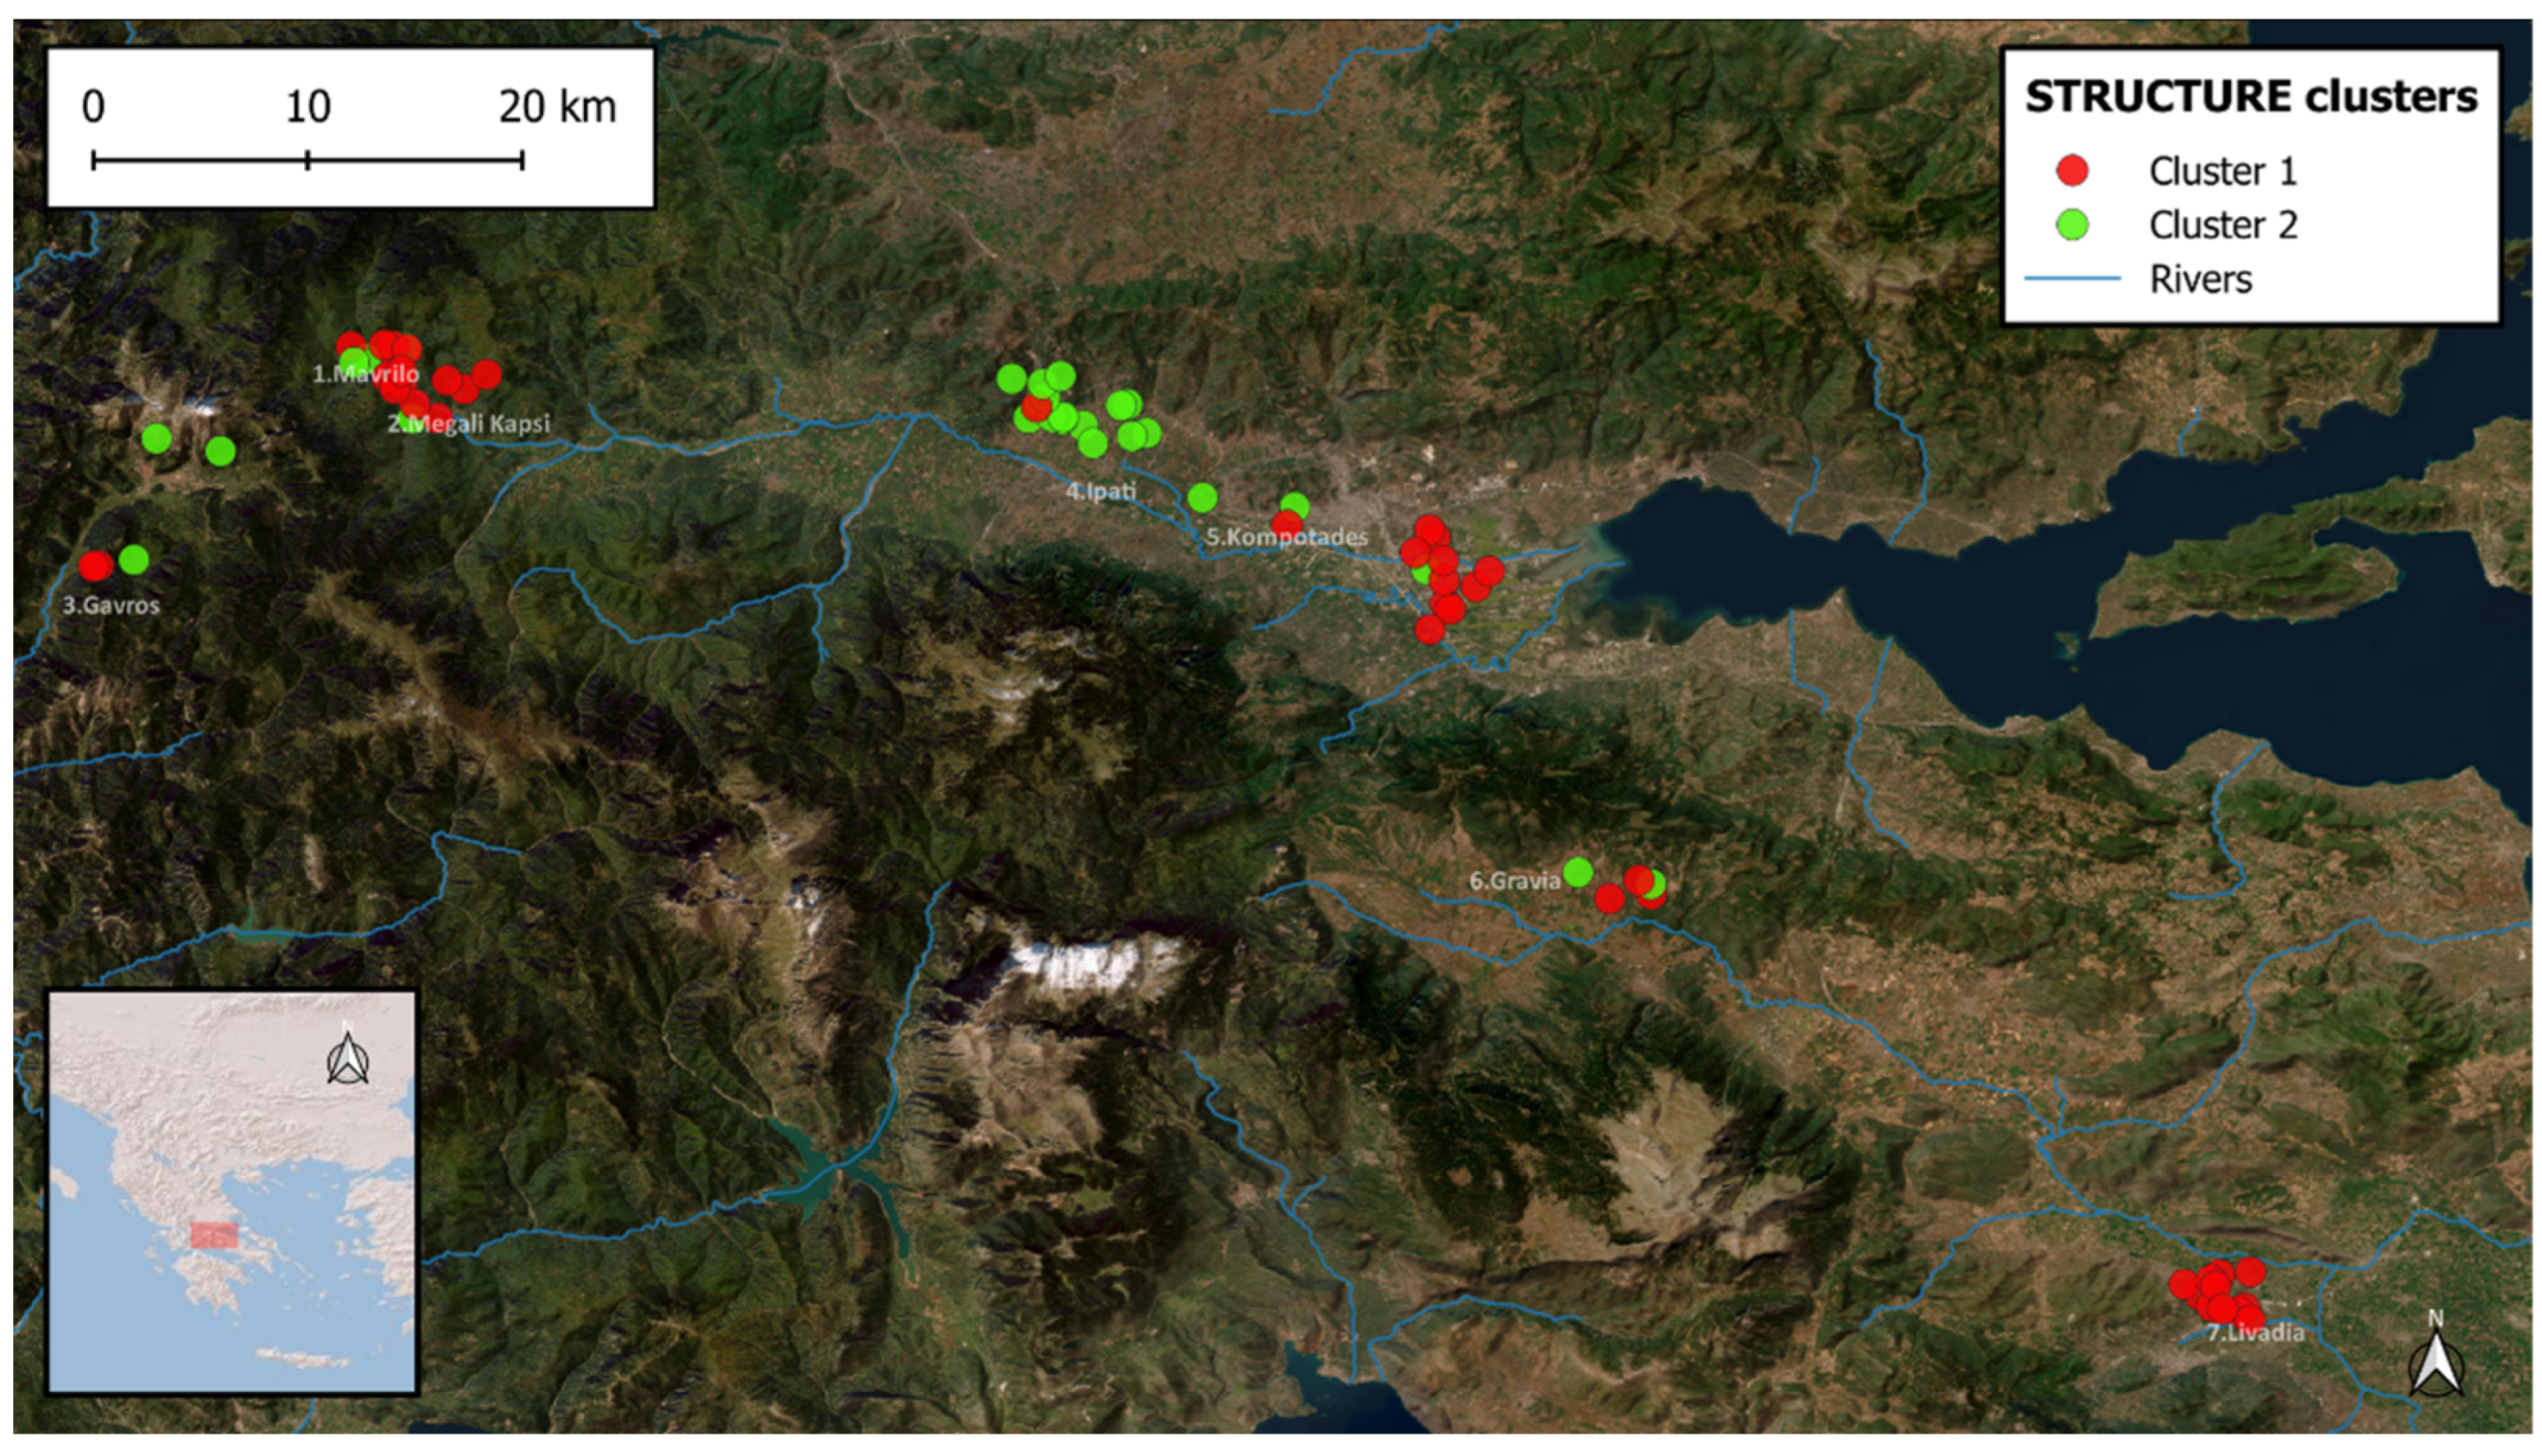
2.1. Plant Material and Sample Collection

The broader area of Fthiotida, Viotia, Evrytania, Fokida, and Evia in the Region of Central Greece was initially swept in order to locate naturally occurring hop assemblages. Leaves from 69 different female hop plants were collected from natural ground by riversides, high-humidity mountain slopes, and cottage afences in the study area. For each sample, GPS coordinates and altitude (20 to 1000 m) were recorded (Table S1). Samples were frozen in plastic bags under a vacuum and stored at −20 °C until further use. Alongside the naturally occurring hop plants, material (pellets) from four commercial varieties (Saaz, Fuggle, Brewer’s Gold and Comet) was purchased and was included in the analysis.

2.2. DNA Extraction

DNA extraction was performed using the NucleoSpin Plant II Mini Kit (Macherey Nagel, Düren, Germany) according to the manufacturer’s protocol. Plant tissue was homogenized with Minilys® personal homogenizer (Bertin Instruments, Montigny-le-Bretonneux, France) using the following settings: 3 cycles of 20 s at 5000 rpm, with 20 s of incubation on ice between the pulses. DNA concentration and purity were assessed using a NanoDrop Spectrophotometer (Thermo Fisher Scientific, Waltham, MA, USA); samples with ratios A260/A280 1.9-2 and A260/A230 1.8-2, were further analyzed. Genomic DNA integrity was assessed via electrophoresis in a 0.8% w/v agarose (UltraPure Agarose, Invitrogen, Carlsbad, CA, USA) gel prestained with GelRed Nucleic Acid Gel Stain (Biotium, Fremont, CA, USA).

2.3. PCR Amplification

Based on Henning et al. [24] 5 sets of primers were designed to amplify 5 amplicons, each containing one SNP. The sixth amplicon, part of the VPS gene, encompasses 4 SNPs [35]. The sequences of the primers are shown in Table 1. Three Multiplex PCR (M1, M2 and M3) reactions were performed for each sample, as shown in Table 1. Amplification was carried out in a VeritiPro Thermal Cycler (Thermo Fisher Scientific, Waltham, MA, USA). Each reaction was carried out in 20 uL, using 10 uL KAPA SYBR FAST qPCR Master Mix (2X) (Sigma-Aldrich, St. Louis, MO, USA), 0.1 μΜ of each primer, and 50 ng of genomic DNA as a template. For M1 PCR, an initial denaturation step at 95 °C for 5 min was followed by 30 cycles of denaturation at 95 °C for 30 s, annealing at 59 °C for 30 s, extension at 72 °C for 30 s, and a final extension at 72 °C for 5 min (Table S2). For M2 PCR, an initial denaturation step at 95 °C for 5 min was performed, followed by 30 cycles of denaturation at 95 °C for 30 s, annealing at 65 °C for 15 s, extension at 65 °C for 15 s, with a final extension at 65 °C for 5 min (Table S2). Finally, in the case of M3 PCR, an initial denaturation at 95 °C for 5 min was followed by 30 cycles of denaturation at 95 °C for 30 s, annealing at 60 °C for 30 s, extension at 72 °C for 30 s, and a final extension at 72 °C for 5 min (Table S2). Electrophoresis in 4% w/v agarose gels prestained with GelRed Nucleic Acid Gel Stain (Biotium, Fremont, CA, USA) was used to assess successful amplification.

2.4. Next-Generation Sequencing (NGS) of Amplicon

The products of each multiplex PCR reaction were initially purified using NucleoMag NGS Clean-up and Size Select magnetic beads (Macherey Nagel, Düren, Germany), with a DNA to beads volume ratio of 1/1.8. The concentration of the purified PCR products was determined with a Qubit 4 Fluorometer (Thermo Fisher Scientific, Waltham, MA, USA) using the Qubit dsDNA HS Assay Kit, according to the manufacturer’s instructions.
Next, 33 ng of the products of each multiplex PCR reaction were combined and used for barcoded library preparation with the Ion Plus Fragment Library Kit (Thermo Fisher Scientific, Waltham, MA, USA) according to the manufacturer’s instructions. Then, the DNA of each library was purified using NucleoMag NGS Clean-up and Size Select magnetic beads (Macherey Nagel, Düren, Germany) with a DNA to beads volume ratio of 1/1.4 and the DNA concentration of the library was determined via Real-Time PCR with the Ion Universal Library Quantitation Kit (Thermo Fisher Scientific, Waltham, MA, USA). For template preparation, 60 pM of library DNA were used in the Ion Chef System (Thermo Fisher Scientific, Waltham, MA, USA) and subsequently sequenced with Ion Torrent GeneStudio S5 (Thermo Fisher Scientific, Waltham, MA, USA) according to the manufacturer’s instructions.

2.5. Data Analysis

2.5.1. Genotyping Protocol

For genotype analysis, the UBAM files containing the raw sequence data were initially transformed into FASTA format using Samtools (version 1.17) [36]; Mothur (version 1.48.0) [37] was employed for quality filtering and removal of fragments with non-desired length. To ensure precise mapping, the processed sequences were then aligned to the reference genome of H. lupulus (GCA_023660075.1) using Bowtie2 (version 2.4.5) [38]. The alignment of the sequences was visualized with the Integrative Genomics Viewer (IGV) (version 2.11.2) [39] and SNP alleles within each amplicon were identified.

2.5.2. Genetic and Statistical Analyses

The genotyping data were appropriately transformed to be used as input file in GenAlEx v.6.50 [40] for the calculation of the number of alleles (Na), effective number of alleles (Ne), expected heterozygosity (He), observed (Ho) heterozygosity, and the inbreeding coefficient (F). Using the same software, putative clones based on repeated multilocus genotypes were identified and the geographical distance between the plants identified as ramets of the same putative clone was estimated in order to locate the most probable cases of clonality.
For the grouping of the plants based on their genotypes, a Principal Component Analysis (PCA) and a Discriminant Analysis of Principal Components (DAPC) using R v.4.2.2, as well as the spatial Principal Component Analysis (sPCA) and the adegenet package (version 2.0.0) [41], were performed. The genetic structure within the dataset was determined using STRUCTURE v.2.3.4 [42]. Subsequently, Structure Harvester, which uses the deltaK method [43,44], was employed to determine the number of clusters (K) that most accurately describe our data. The lengths of the burn-in period Monte Carlo Markov chain (MCMC) were 100,000, with 100,000 reps after Burnin, conducted in 10 runs for the possible number of clusters (K) ranging from 1 to 10. The samples were assigned into populations based on their geographical location, followed by genetic variability and diversity assessment within these populations with the Analysis of Molecular Variance (AMOVA) using GenAlEx v.6.50 [40]. The map presented in this work was created using QGIS (v.3.30.1).

3. Results

On the six amplicons used, nine polymorphic SNPs were identified. Their location on the hop genome and relevant details are depicted in Table 2. The diversity appeared to be highest in SNPs 1 and 3, while SNP 5 was, for the Greek samples, nearly monomorphic (Table S1 and Table 3). The four SNPs (6–9) that reside on the same amplicon are linked, and for this reason, they demonstrate the same diversity metrics. The mean number of alleles/SNP was 1.937, the mean effective number of alleles 1.502, and the mean expected heterozygosity was 0.297, while the mean observed heterozygosity was 0.318, leading to a negative inbreeding index.
Genetic diversity within populations was generally high (Table 4). Population 4 (Ipati) demonstrated the highest mean effective number of alleles (Ne) and expected heterozygosity, which was also the one represented by the largest sample in the study with 17 individuals. However, sample size does not seem to explain the diversity patterns observed, since population 3 (Gavros) showed almost equally high diversity levels with only five individuals. Besides these two, all other populations were almost equally diverse. The AMOVA attributed most of diversity within populations (93%), while differentiation among populations was relatively low (7%).
The comparison of the multilocus genotypes showed that 33 plants had a unique genotype, while 36 more could be grouped in 14 possible clones (clones A–N) (Table S3). Due to the restricted SNPs number, the identification of actual clones and their ramets is inconclusive. Indeed, out of the plants suggested as possible ramets, 21 were too far away from others with the same genotype and 15 cases of multilocus genotypes could be putative ramets of six clones (clones B, E, I, K, M, N) (Table S3).
A specific differentiation pattern occurred in the outcome of STRUCTURE (Figure 1), where the 69 genotypes studied were divided into two genetic clusters, as suggested by Structure Harvester. Most individuals belonged to cluster 1 (red color), while individuals belonging to cluster 2 (green color) were mainly found in population 4 (Ipati). Population 3 (Gavros) contained both clusters in almost equal proportions. Cluster 1 was dominant on the eastern part of the study area and the mountainous terrain in the west (Figure 2), while cluster 2 was found mainly in two groups; the north-central (4: Ipati) and the western part (3: Gavros).
A similar pattern to the one described by STRUCTURE was also observed following PCA analysis. The first two axes of the PCA analysis explained 48.4% of total genetic diversity and produced a plot in which two main clusters of genotypes can be separated. The first group includes populations 3 (Gavros) and 4 (Ipati), while populations 5 (Kompotades), 7 (Livadia), 1 (Mavrilo), 2 (Megali Kapsi), and 6 (Gravia) form a second, more compact genetic cluster. None of the genotypes of the commercial varieties was identical to any of the natural occurring plants in the study area. Varieties Fuggle (UK), Brewer’s Gold (Germany) and Comet (USA) cluster within the second group and variety Saaz (Czech Republic) was placed closer to the first group (Figure 3).
The DAPC plot (Figure 4) is based on the two axes with the highest eigenvalues and clearly separates plants that belong to population 4 (Ipati) from the rest. Populations 5 (Kompotades) and 7 (Livadia) seem to cluster closely together, while populations 1 (Mavrilo), 2 (Megali Kapsi), and 6 (Gravia) form a tight group as well. Individual plants that belong to population 3 (Gavros) are shared between groups.
The sPCA revealed one positive axis with significant eigenvalue, while no negative axis stood out (Figure 5). This indicates that there is a global spatial component in our results represented by the first sPCA axis and no local one. The sPCA colorplot depicts the scores of the first global axis with reference to the study area and the geographical coordinates of the individual plants (Figure 6). A similar spatial genetic pattern with the STRUCTURE analysis appears in this plot as well; Population 4 (Ipati) forms a genetically distinct group and three other populations on the eastern part of the study area form another (5—Kompotades, 6—Gravia and 7—Livadia). Population 3 (Gavros) seems to be between the two groups, and populations 1 (Mavrilo) and 2 (Megali Kapsi) have mostly individuals that belong to the larger eastern genetic group but show an admixture with the neighboring population 3 (Gavros).

4. Discussion

In the past 15 years, the industry’s increasing demand for beer with a distinctive taste and aroma, along with the impact that climate change is expected to have on hop cultivars, is fueling the development of novel varieties; to this end, genetic resources are required for use in selective breeding programs. A number of studies, however, point to the fact that the genetic variation in the existing hop cultivars is low, reflecting the fact that most of them descended from a limited number of parent plants of the European variety H. lupulus var. lupulus [15,24,45,46]. However, hop cultivars can be crossed with wild hop varieties, which will provide increased germplasm diversity. In this vein, we studied the genetic makeup of endemic Greek hop populations from the Region of Central Greece. To this end, we mapped natural occurring hop assemblages, collected plant samples from these locations, and used a rigorous genotyping protocol which involves targeted DNA amplification and sequencing of a set of nine specific genetic markers—SNPs—within the H. lupulus var. lupulus genome, followed by a bioinformatics pipeline to determine individual genotypes and to perform population structure analyses.
Hop populations in the Region of Central Greece demonstrated high genetic diversity within populations and relatively low differentiation among them, as was suggested by all genetic and spatial genetic tests. Thus, hop plants growing in close proximity to each other may exhibit genotypic differences. This may be the result of the dioecious mating system and possibly the restricted levels of vegetative propagation in the natural populations of our study. Clonality has being described among hop accessions in other studies [29], but these were growing in yards and fields and not in the wild.
Despite the overall genetic diversity being attributed mainly within populations, a constant differentiation pattern among the hop populations existed in the results of all genetic tests, involving the existence of two main genetic clusters in the Region of Central Greece. Their geographic expansion is not continuous, since topographic elements, such as streams or mountains, may have acted as barriers to gene flow, especially considering that hop grows close to streams and seeds are spread by water flow. This is evident in the case of populations connected by rivers and streams on the eastern side of the study area demonstrating genetic similarities (e.g., Livadia, Gravia) and the mountainous populations Mavrilo and M. Kapsi in the west, which are isolated by the mountainous terrain and have high genetic differentiation from other populations growing nearby.
This study employed a number of SNPs which were selected and used for the identification of commercial cultivars; however, with this set of markers, it was possible to describe specific spatial genetic patterns. Despite the limitations related to the small number of SNPs, the patterns we observed remained consistent in all our results.
Our data point to a high diversity within wild hop populations and a low differentiation among populations. Most genetic studies dealing with wild hop populations were conducted using SSR markers and not the NGS-derived SNPs that were used in our study. Despite the different attributes of these markers, certain common trends can be discussed, especially since both are codominant. Our results are in accordance with the data from similar studies in Croatia and Calabria in Italy [31,47]. In these studies, low differentiation existed between populations; it was, however, enough to form distinct genetic clusters. Notably these clusters did not correlate with geo-graphical distribution patterns, as was observed in other studies of wild hop populations [48,49]. Similarly, in our study, the spatial genetic patterns observed were not connected with geographic distance, but rather with topographical elements, such as rivers and mountains. It seems therefore, that in South European regions, where hop grows in areas with complex topography, natural populations tend to maintain high levels of diversity while also being genetically characteristic of their region.
None of the four commercial hop varieties included in this study were genetically identical to any natural occurring hop plant in our analysis. Considering that the SNPs employed have been used for the identification of commercial hop genotypes, it seems that hop populations in the Region of Central Greece have novel genotypes, which are not yet utilized in hop breeding. In addition, the high genetic diversity of autochthonous hop adds to the potential of wild hop populations from this region to be exploited in breeding programs; further studies using samples from other regions of the Greek peninsula will provide a better insight into the genetic variability of hop. Additionally, chemical analysis and comparison with the cultivars that are used will point to genotypes with interesting characteristics for the beer industry; for instance, alpha acids content. This distinct character was demonstrated in studies comparing wild hop populations with commercial hop cultivars in Italy and Portugal [25,30]; wild hop populations were distinct from cultivars in all markers used. Interestingly, as modern hop varieties have been derived from areas with a much colder climate than Greece, Greek hop germplasm may provide a valuable source for the development of cultivars that will be better adapted to higher temperatures, one of the major characteristics of climate change.

Supplementary Materials

The following supporting information can be downloaded at: https://www.mdpi.com/article/10.3390/d15121171/s1, Table S1: Genotypes of the wild hop samples with the place of collection points (name, coordinates) in the Region of Central Greece along with the genotypes of the four commercial varieties which are included in the analysis, Table S2: Amplification conditions for the 3 multiplex PCR reactions, Table S3: Matrices presenting the distances (in meters) of the plants that share common multilocus genotype patterns (clones). Colors correspond to populations.

Author Contributions

Conceptualization, G.G.B., P.P., G.S. and M.E.G.; methodology K.T., G.G.B., P.G.B., G.S., P.K., A.C.P. and M.E.G.; formal analysis, K.T., D.V.F., A.C.P., G.G.B., P.G.B., G.S., P.K., P.P. and M.E.G.; investigation, K.T., D.V.F. and E.-M.A.; resources, P.P., P.G.B., G.G.B. and M.E.G.; data curation, K.T.; writing—original draft preparation, K.T., D.V.F.; writing—review and editing, K.T., D.V.F., E.-M.A., A.C.P., G.G.B., P.G.B., G.S., P.K., P.P. and M.E.G.; project administration, P.P., P.G.B., G.G.B. and M.E.G.; funding P.P., G.G.B. and M.E.G. All authors have read and agreed to the published version of the manuscript.

Funding

This research was funded by the project “Molecular identification and utilization of indigenous hop varieties for the production of high added value beers” (MIS 5056124), which is financed by the “Action Support for Research, Technological Development and Innovation Projects in areas of RIS3 in the Region of Central Greece” under the Operational Programme “STEREA ELLADA 2014–2020” co-financed by Greece and the European Union (European Regional Development Fund).

Institutional Review Board Statement

Not applicable.

Data Availability Statement

The data presented in this study are available in Table S1.

Acknowledgments

The authors thank Anastasia Voumvouraki, Eleni Nousia, Margaritis Tsifintaris and Chris Stekas for their valuable help in the laboratory.

Conflicts of Interest

The authors declare no conflict of interest. Panagiotis Pergantas is employed by Bioapplications O.E., 32100 Livadia, Greece, which was part of the consortium of the project described under “Funding”.

References

  1. Zhou, Z.K.; Bartholomew, B. Cannabaceae. In Flora of China; Wu, Z.Y., Raven, P.H., Hong, D.Y., Eds.; Science Press: Beijing, China; Missouri Botanical Garden Press: St. Louis, MO, USA, 2003. [Google Scholar]
  2. Neve, R.A. Botany. In Hops, 1st ed.; Springer: Dordrecht, The Netherlands, 1991. [Google Scholar]
  3. Murakami, A.; Darby, P.; Javornik, B.; Pais, M.S.S.; Seigner, E.; Lutz, A.; Svoboda, P. Molecular phylogeny of wild Hops, Humulus lupulus L. Heredity 2006, 97, 66–74. [Google Scholar] [CrossRef] [PubMed]
  4. Karabín, M.M.; Hudcová, T.; Jelínek, L.; Dostálek, P. Biologically Active Compounds from Hops and Prospects for Their Use. Compr. Rev. Food Sci. Food Saf. 2016, 15, 542–567. [Google Scholar] [CrossRef] [PubMed]
  5. Small, E. A Numerical and Nomenclatural Analysis of Morpho-Geographic Taxa of Humulus. Syst. Bot. 1978, 3, 37–76. Available online: http://www.jstor.org/stable/2418532 (accessed on 15 May 2016). [CrossRef]
  6. Fu, J.Q. Humulus lupulus var. fengxianensis. Acta Bot. Boreal Occid. Sin. 1992, 12, 70. [Google Scholar]
  7. Briggs, D.E.; Boulton, C.A.; Brookes, P.A.; Stevens, R. Hops. In Brewing: Science and Practice; Woodhead Publishing Limited: Sawston, UK; CRC Press LLC: Cambridge, UK, 2004. [Google Scholar]
  8. Stevens, J.F.; Page, J.E. Xanthohumol and related prenylflavonoids from hops and beer: To your good health! Phytochemistry 2004, 65, 1317–1330. [Google Scholar] [CrossRef]
  9. Stevens, J.F.; Miranda, C.L.; Buhler, D.R.; Deinzer, M.L. Chemistry and Biology of Hop Flavonoids. J. Am. Soc. Brew. Chem. 1998, 56, 136–145. [Google Scholar] [CrossRef]
  10. Van Cleemput, M.; Cattoor, K.; De Bosscher, K.; Haegeman, G.; De Keukeleire, D.; Heyerick, A. Hop (Humulus lupulus)-Derived Bitter Acids as Multipotent Bioactive Compounds Marjan. J. Nat. Prod. 2009, 72, 1220–1230. [Google Scholar] [CrossRef]
  11. De Keukeleire, J.; Ooms, G.; Heyerick, A.; Roldan-Ruiz, I.; Van Bockstaele, E.; De Keukeleire, D. Formation and accumulation of α-acids, β-acids, desmethylxanthohumol, and xanthohumol during flowering of hops (Humulus lupulus L.). J. Agric. Food Chem. 2003, 51, 4436–4441. [Google Scholar] [CrossRef] [PubMed]
  12. Kavalier, A.R.; Litt, A.; Ma, C.; Pitra, N.J.; Coles, M.C.; Kennelly, E.J.; Matthews, P.D. Phytochemical and morphological characterization of hop (Humulus lupulus L.) cones over five developmental stages using high performance liquid chromatography coupled to time-of-flight mass spectrometry, ultrahigh performance liquid chromatography photodiode array detection, and light microscopy techniques. J. Agric. Food Chem. 2011, 59, 4783–4793. [Google Scholar]
  13. Bolton, J.L.; Dunlap, T.L.; Hajirahimkhan, A.; Mbachu, O.; Chen, S.-N.; Chadwick, L.; Nikolic, D.; van Breemen, R.B.; Pauli, G.F.; Dietz, B.M. The Multiple Biological Targets of Hops and Bioactive Compounds. Chem. Res. Toxicol. 2019, 32, 222–233. [Google Scholar] [CrossRef]
  14. Kyrou, I.; Christou, A.; Panagiotakos, D.; Stefanaki, C.; Skenderi, K.; Katsana, K.; Tsigos, C. Effects of a hops (Humulus lupulus L.) dry extract supplement on self-reported depression, anxiety and stress levels in apparently healthy young adults: A randomized, placebo-controlled, double-blind, crossover pilot study. Hormones 2017, 16, 171–180. [Google Scholar]
  15. Šuštar-Vozlič, J.; Javornik, B. Genetic relationships in cultivars of hop, Humulus lupulus L., determined by RAPD analysis. Plant Breed. 1999, 118, 175–181. [Google Scholar] [CrossRef]
  16. Pillay, M.; Kenny, S.T. Structure and inheritance of ribosomal DNA variants in cultivated and wild hop, Humulus lupulus L. Theor. Appl. Genet. 1996, 93, 333–340. [Google Scholar] [CrossRef] [PubMed]
  17. Koelling, J.; Coles, M.C.; Matthews, P.D.; Schwekendiek, A. Development of new microsatellite markers (SSRs) for Humulus lupulus. Mol. Breed. 2012, 30, 479–484. [Google Scholar] [CrossRef]
  18. Patzak, J. Comparison of RAPD, STS, ISSR and AFLP molecular methods used for assessment of genetic diversity in hop (Humulus lupulus L.). Euphytica 2001, 121, 9–18. [Google Scholar] [CrossRef]
  19. Abbott, M.S.; Fedele, M.J. A DNA-based varietal identification procedure for hop leaf tissue. J. Inst. Brew. 1994, 100, 283–285. [Google Scholar] [CrossRef]
  20. Padgitt-Cobb, L.K.; Kingan, S.B.; Wells, J.; Elser, J.; Kronmiller, B.; Moore, D.; Concepcion, G.; Peluso, P.; Rank, D.; Jaiswal, P.; et al. A draft phased assembly of the diploid Cascade hop (Humulus lupulus) genome. Plant Genome 2021, 14, e20072. [Google Scholar] [CrossRef] [PubMed]
  21. Matthews, P.D.; Coles, M.C.; Pitra, N.J. Next Generation Sequencing for a Plant of Great Tradition: Application of NGS to SNP Detection and Validation in Hops (Humulus lupulus L.). Brew. Sci. 2013, 66, 185–191. [Google Scholar]
  22. Deschamps, S.; Llaca, V.; May, G.D. Genotyping-by-sequencing in plants. Biology 2012, 1, 460–483. [Google Scholar] [CrossRef] [PubMed]
  23. Jiang, P.; Song, T.; Jiang, W.; Wang, D.; Pu, B.; Luan, C. SNP-Based Kompetitive Allele Specific PCR (KASPTM) Method for the Qualification and Quantification of Hop Varieties. J. Am. Soc. Brew. Chem. 2018, 76, 185–189. [Google Scholar] [CrossRef]
  24. Henning, J.A.; Coggins, J.; Peterson, M. Simple SNP-based minimal marker genotyping for Humulus lupulus L. identification and variety validation. BMC Res. Notes 2015, 8, 542. [Google Scholar] [CrossRef] [PubMed]
  25. Machado, J.C.; Faria, M.A.; Barata, A.M.; da Silva, I.G.; Cerenak, A.; Ferreira, I.M. Portuguese wild hop diversity assessment by fast SNP genotyping using high-resolution melting. J. Appl. Genet. 2022, 63, 103–114. [Google Scholar] [CrossRef] [PubMed]
  26. Mozny, M.; Tolasz, R.; Nekovar, J.; Sparks, T.; Trnka, M.; Zalud, Z. The impact of climate change on the yield and quality of Saaz hops in the Czech Republic. Agric. For. Meteorol. 2009, 149, 913–919. [Google Scholar] [CrossRef]
  27. Mozny, M.; Trnka, M.; Vlach, V.; Zalud, Z.; Cejka, T.; Hajkova, L.; Potopova, V.; Semenov, M.A.; Semeradova, D. Climate-induced decline in the quality and quantity of European hops calls for immediate adaptation measures. Nat. Commun. 2023, 14, 6028. [Google Scholar] [CrossRef] [PubMed]
  28. Horreo, J.L.; Peredo, E.L.; Olmedo, J.L.; Valladares, J.E.; García, E.; Revilla, M.A. Genetic diversity inferred from microsatellites of wild hops in Galicia (Spain). Brew. Sci. 2014, 67, 132–136. [Google Scholar]
  29. Karlsson Strese, E.M.; Lundström, M.; Hagenblad, J.; Leino, M.W. Genetic Diversity in Remnant Swedish Hop (Humulus lupulus L.) Yards from the 15th to 18th Century. Econ. Bot. 2014, 68, 231–245. [Google Scholar] [CrossRef]
  30. Riccioni, C.; Belfiori, B.; Sileoni, V.; Marconi, O.; Perretti, G.; Bellucci, M.; Rubini, A. High genetic and chemical diversity of wild hop populations from Central Italy with signals of a genetic structure influenced by both sexual and asexual reproduction. Plant Sci. 2021, 304, 110794. [Google Scholar] [CrossRef]
  31. Calvi, A.; Aci, M.M.; Lupini, A.; Preiti, G. Morphological and Genetic Analysis of Wild Hop (Humulus lupulus L.) Germplasm from Calabria Region in South Italy. Agronomy 2023, 13, 252. [Google Scholar] [CrossRef]
  32. Patzak, J.; Nesvadba, V.; Henychová, A.; Krofta, K. Assessment of the genetic diversity of wild hops (Humulus lupulus L.) in Europe using chemical and molecular analyses. Biochem. Syst. Ecol. 2010, 38, 136–145. [Google Scholar] [CrossRef]
  33. Patzak, J.; Nesvadba, V.; Krofta, K.; Henychova, A.; Marzoev, A.I.; Richards, K. Evaluation of genetic variability of wild hops (Humulus lupulus L.) in Canada and the Caucasus region by chemical and molecular methods. Genome 2010, 53, 545–557. [Google Scholar] [CrossRef]
  34. Edwardson, J.R. Hops: Their Botany, History, Production and Utilization. Econ. Bot. 1952, 6, 804–811. [Google Scholar] [CrossRef]
  35. Castro, C.B.; Whittock, L.D.; Whittock, S.P.; Leggett, G.; Koutoulis, A. DNA sequence and expression variation of hop (Humulus lupulus) valerophenone synthase (VPS), a key gene in bitter acid biosynthesis. Ann. Bot. 2008, 102, 265–273. [Google Scholar] [CrossRef] [PubMed]
  36. Danecek, P.; Bonfield, J.K.; Liddle, J.; Marshall, J.; Ohan, V.; Pollard, M.O.; Whitwham, A.; Keane, T.; McCarthy, S.A.; Davies, R.M.; et al. Twelve years of SAMtools and BCFtools. Gigascience 2021, 10, giab008. [Google Scholar] [CrossRef] [PubMed]
  37. Patrick, D.; Westcott, S.L.; Ryabin, T.; Hall, J.R.; Hartmann, M.; Hollister, E.B.; Lesniewski, R.A.; Oakley, B.B.; Parks, D.H.; Robinson, C.J.; et al. Introducing mothur: Open-source, platform-independent, community-supported software for describing and comparing microbial communities. Appl. Environ. Microbiol. 2009, 75, 7537–7541. [Google Scholar]
  38. Langmead, B.; Salzberg, S.L. Fast gapped-read alignment with Bowtie 2. Nat. Methods 2012, 9, 357–359. [Google Scholar] [CrossRef] [PubMed]
  39. Thorvaldsdóttir, H.; Robinson, J.T.; Mesirov, J.P. Integrative Genomics Viewer (IGV): High-performance genomics data visualization and exploration. Brief. Bioinform. 2013, 14, 178–192. [Google Scholar] [CrossRef] [PubMed]
  40. Peakall, R.; Smouse, P.E. GenALEx 6.5: Genetic analysis in Excel. Population genetic software for teaching and research-an update. Bioinformatics 2012, 28, 2537–2539. [Google Scholar] [CrossRef] [PubMed]
  41. Jombart, T. Adegenet: A R package for the multivariate analysis of genetic markers. Bioinformatics 2008, 24, 1403–1405. [Google Scholar] [CrossRef]
  42. Pritchard, J.K.; Stephens, M.; Donnelly, P. Inference of population structure using multilocus genotype data. Genetics 2000, 155, 945–959. [Google Scholar] [CrossRef] [PubMed]
  43. Earl, D.A.; von Holdt, B.M. STRUCTURE HARVESTER: A website and program for visualizing STRUCTURE output and implementing the Evanno method. Conserv. Genet. Resour. 2012, 4, 359–361. [Google Scholar] [CrossRef]
  44. Evanno, G.; Regnaut, S.; Goudet, J. Detecting the number of clusters of individuals using the software STRUCTURE: A simulation study. Mol. Ecol. 2005, 14, 2611–2620. [Google Scholar] [CrossRef] [PubMed]
  45. Seefelder, S.; Ehrmaier, H.; Schweizer, G.; Seigner, E. Genetic diversity and phylogenetic relationships among accessions of hop, Humulus lupulus, as determined by amplified fragment length polymorphism fingerprinting compared with pedigree data. Plant Breed. 2000, 119, 257–263. [Google Scholar] [CrossRef]
  46. Henning, J.A.; Steiner, J.J.; Hummer, K.E. Genetic diversity among world hop accessions grown in the USA. Crop Sci. 2004, 44, 411–417. [Google Scholar] [CrossRef]
  47. Grdiša, M.; Šatović, Z.; Liber, Z.; Jakše, J.; Varga, F.; Erhatić, R.; Srečec, S. High Genetic Diversity and Low Population Differentiation in Wild Hop (Humulus lupulus L.) from Croatia. Appl. Sci. 2021, 11, 6484. [Google Scholar] [CrossRef]
  48. Mafakheri, M.; Kordrostami, M.; Rahimi, M.; Matthews, P.D. Evaluating genetic diversity and structure of a wild hop (Humulus lupulus L.) germplasm using morphological and molecular characteristics. Euphytica 2020, 216, 58. [Google Scholar] [CrossRef]
  49. Rodolfi, M.; Silvanini, A.; Chiancone, B.; Marieschi, M.; Fabbri, A.; Bruni, R.; Ganino, T. Identification and genetic structure of wild Italian Humulus lupulus L. and comparison with European and American hop cultivars using nuclear microsatellite markers. Genet. Resour. Crop Evol. 2018, 65, 1405–1422. [Google Scholar] [CrossRef]
Figure 1. Individual membership probability to the genetic clusters defined by STRUCTURE.
Diversity 15 01171 g001
Figure 2. Geographic distribution of the STRUCTURE genetic clusters in the study area (Map scale: 1:523,083).
Diversity 15 01171 g002
Figure 3. PCA analysis based on the genotypes of 69 wild hop plants and 4 commercial varieties.
Diversity 15 01171 g003
Figure 4. DAPC plot of individuals. Numbers correspond to populations of Table 4.
Diversity 15 01171 g004
Figure 5. Barplot of the sPCA eigenvalues; positive eigenvalues (left) correspond to global structures, while negative eigenvalues (right) indicate local patterns. The red color indicates the retained eigenvalues.
Diversity 15 01171 g005
Figure 6. sPCA color plot using the first global score, following the RGB color system. The coordinates show the geographic location of the individuals, while the colors indicate levels of genetic similarity, following the RGB color system: the three colors (Red, Green and Blue) represent three components of the genetic similarity score; each color on the plot corresponds to a unique combination of genetic similarity scores, providing a visual representation of our data.
Diversity 15 01171 g006
Table 1. Primers used for the amplification of the 6 SNP-containing amplicons.
Multiplex PCR ReactionForward (5′-3′)Reverse (5′-3′)Product Length
1
(Amplicons 1 and 6)
GCATGATCAGCAGCCTTACTCGATGACGATGATGGGAATTGTGGCAT98 bp
GGGCCCTCGGAGAAACATTTTTGGGAGATCAACCCTGGC238 bp
2
(Amplicons 2 and 3)
TGCAGCTTAAATGGATAAGGGGAAGTCCTCATCTGTTGCATTTTCCTTCC115 bp
CAATGAGTGCCTCCTTTGACCGTTCAGTGGGGTTCCTTCCTTTCCA80 bp
3
(Amplicons 4 and 5)
GACCCCCAATGTTGTTGCTATGGTGATGGTGCATGGGTGCCTAAAGT106 bp
TTCTTCTCTGGTCCATGCGCCTTAACGGAACAAACTGAGGGCGGT70 bp
Table 2. Position and description of the amplicons investigated and the SNPs identified.
SNPWGS Accession NumberAmplicon CoordinatesSNP PositionAlleles
1JALDWI010000197.1365,042 to 365,139365,109T/C
2JALDWI010000023.12,509,758 to 2,509,8722,509,809A/C
3JALDWI010003715.146,926 to 47,01146,965T/C
4JALDWI010000347.1413,416 to 413,522413,465A/G
5JALDWI010002821.193,676 to 93,74593,714G/C
6JALDWI010001295.1695,872 to 696,109695,964G/C
7JALDWI010001295.1695,872 to 696,109695,965G/T
8JALDWI010001295.1695,872 to 696,109696,029A/C
9JALDWI010001295.1695,872 to 696,109696,051T/C
Table 3. Genetic diversity of the nine SNPs used in this study.
SNPNaNeHoHeF
12.0001.9030.5710.473−0.213
22.0001.5480.3890.341−0.135
32.0001.9440.5260.485−0.089
42.0001.4310.2770.290−0.005
51.4291.0660.0400.0570.283
61.8571.4140.3080.260−0.102
71.8571.4140.3080.260−0.102
81.8571.4140.3080.260−0.102
91.8571.4140.3080.260−0.102
Mean1.8731.5060.3370.299−0.085
SE0.0420.0440.0300.0210.047
Table 4. Genetic diversity within populations.
PopulationLocationNNaNeHoHe
1Mavrilo132.0001.4010.2990.259
2Megali Kapsi51.8891.4160.2890.260
3Gavros52.0001.6900.4440.400
4Ipati171.8891.7580.4770.403
5Kompotades132.0001.4470.2390.283
6Gravia51.8891.4720.3780.291
7Livadia111.4441.3560.2320.193
Mean-9.8571.8731.5060.3370.299
SE-0.5740.0420.0440.0300.021
Disclaimer/Publisher’s Note: The statements, opinions and data contained in all publications are solely those of the individual author(s) and contributor(s) and not of MDPI and/or the editor(s). MDPI and/or the editor(s) disclaim responsibility for any injury to people or property resulting from any ideas, methods, instructions or products referred to in the content.

