
The Use of R and R Packages in Biodiversity Conservation Research


1
College of Ecology and Environment, Nanjing Forestry University, Nanjing 210037, China
2
Research Center of Quantitative Ecology, Nanjing Forestry University, Nanjing 210037, China
*
Author to whom correspondence should be addressed.
Diversity 2023, 15(12), 1202; https://doi.org/10.3390/d15121202
Submission received: 20 November 2023
/
Revised: 5 December 2023
/
Accepted: 5 December 2023
/
Published: 7 December 2023
(This article belongs to the Section Biodiversity Conservation)
Abstract
:R is one of the most powerful programming languages for conducting data analysis, modeling, and visualization. Although it is widely utilized in biodiversity conservation research, the comprehensive trends in R and R package usage and patterns in the field still remain unexplored. We conducted a comprehensive analysis of R and R package usage frequencies spanning fifteen years, from 2008 to 2022, encompassing over 24,100 research articles published in eight top biodiversity conservation journals. Within this extensive dataset, 10,220 articles (42.3% of the total) explicitly utilized R for data analysis. The use ratio of R demonstrated a consistent linear growth, escalating from 11.1% in 2008 to an impressive 70.6% in 2022. The ten top utilized R packages were vegan, lme4, MuMIn, nlme, mgcv, raster, MASS, ggplot2, car, and dismo. The frequency of R package utilization varied among journals, underscoring the distinct emphases each journal places on specific focuses of biodiversity conservation research. This analysis highlights the pivotal role of R, with its powerful statistical and data visualization capabilities, in empowering researchers to conduct in-depth analyses and gain comprehensive insights into various dimensions of biodiversity conservation science.
1. Introduction
Research on biodiversity conservation involves a wide range of scientific studies with the goal of comprehending and safeguarding Earth’s biodiversity [1]. Its scope encompasses the examination, control, and safeguarding of ecosystems, species, and genetic diversity to ensure the long-term sustainability and functioning of natural systems [2]. This field, which combines various scientific disciplines such as ecology, genetics, behavior, statistics, and environmental sciences, aims to collect and analyze information about the distribution, abundance, and trends of populations, communities, and ecosystems [3]. These data drive conservation planning and decision-making processes, enabling the implementation of effective strategies for biodiversity conservation [4].
Technological advancements have significantly expanded the horizons and capabilities of biodiversity conservation research. The utilization of geographic information systems (GIS), remote sensing, and DNA sequencing techniques has revolutionized data collection, analysis, and monitoring [5,6]. These technologies empower scientists to gather, analyze, and interpret vast datasets, enabling more accurate and comprehensive assessments of biodiversity and associated threats.
Moreover, the integration of statistical models and computational tools has markedly improved the precision and the efficacy of data analysis in biodiversity conservation research [4,7]. The application of these tools has paved the way for the development of sophisticated algorithms, facilitating species distribution modeling, population viability analysis, and spatial planning [8]. Through the utilization of these algorithms, researchers can forecast species’ habitat suitability, assess the likelihood of population persistence, and pinpoint critical areas for targeted conservation interventions. This information is crucial for guiding management and policy decisions as well as strategically allocating limited conservation resources [4].
R is a programming language and software environment specifically designed for statistical computing, data analysis, and graphical representation (https://www.r-project.org, accessed on 12 September 2022). It was initially developed by Ross Ihaka and Robert Gentleman at the University of Auckland, New Zealand in the early 1990s [9]. R is open-source software released under the GNU General Public License. This means that anyone can use, modify, and distribute R without any licensing costs. The availability of a free and open-source platform makes R accessible to scientists worldwide, including those with limited resources or in developing countries. R has a vast collection of user-contributed packages available on the Comprehensive R Archive Network (CRAN) and other repositories. Researchers can leverage these packages to access specialized functions and algorithms, expanding the capabilities of R for their specific scientific analyses. R enables researchers to conduct sophisticated analyses, produce compelling visualizations, and share their work transparently, making it a preferred language for scientific research and data analysis [10,11].
Academic journals are commonly used by scientists to disseminate their research findings within the academic community and to the wider public. To assess the overall usage of R in various scientific fields, the frequency of its use in published papers within this domain can serve as a useful indicator. Although extensively employed in biodiversity conservation research, the overarching trends in R and R packages use, and patterns within this realm, remain unexplored. While a previous study examined the use of R in ecology and highlighted its increasing popularity from 2008 to 2017 [12], there remains a significant gap in our understanding of its application in biodiversity conservation research despite some overlapping journals between the two fields. Assessing the extent of R’s usage within the discipline of biodiversity conservation holds a considerable number of potential benefits. It can offer valuable insights for both novice R users who may be contemplating its integration into their research methodologies and for researchers actively engaged in developing R packages for future use by their peers. By shedding light on the role of R in biodiversity conservation research, this exploration has the potential to facilitate more comprehensive and efficient data analysis within the discipline, ultimately driving further advancements in conservation efforts.
In this study, we meticulously analyzed a comprehensive dataset comprising over 24,100 research articles published in the top eight biodiversity conservation journals spanning the period from 2008 to 2022. Our primary objective is to evaluate the prevalence of R and its associated packages within these articles, aiming to discern notable trends and patterns in their adoption as well as the popularity of specific packages. Through this analysis, our aim is to enhance our understanding of the advantages of employing R in biodiversity conservation research. Ultimately, our findings hold the potential to guide researchers and practitioners in the field of biodiversity conservation, enabling them to make well-informed decisions about integrating R and its packages into their work.
2. Methods
To comprehensively assess the adoption of R and R packages in biodiversity conservation research, we specifically chose journals within the “Biodiversity conservation” category of the Web of Science (www.webofknowledge.com, accessed on 12 September 2022) that had impact factors exceeding 3.0 in 2022. To maintain the accuracy and prevalence of our dataset, we excluded journals released after 2008 or those with an average annual publication of fewer than 50 papers. Consequently, the following reputable journals were included: “Animal Conservation”, “Biodiversity and Conservation”, “Biological Conservation”, “Conservation Biology”, “Diversity and Distributions”, “Ecography”, “Global Change Biology”, and “Journal of Applied Ecology”.
We recognize that some articles may mention R or R packages solely in the “Methods” section without explicit citations in the “References” section, often due to inattention by the authors. To uphold the accuracy and comprehensiveness of our analysis, we conducted a meticulous manual review of the “Methods” section for each article in our dataset. This detailed review allowed us to identify and include articles that utilized R or R packages, even if they did not explicitly cite them in the “References” section. Throughout this process, we documented the total number of articles indicating the use of R or R packages, and when a specific R package was utilized, we recorded its name. Our commitment to methodological rigor ensured a thorough and precise evaluation of the utilization of R and R packages in the selected biodiversity conservation journals. This approach enables us to confidently assert that our findings offer an accurate reflection of the significance of R in biodiversity conservation research and its associated packages.
All calculations in this paper were executed using the R statistical language [13]. The data (R format) and the code for this paper are available in Supplementary Materials, providing readers with the means to effortlessly reproduce the figures.
3. Results
3.1. Trends in the Utilization of R
Through meticulous efforts, we curated a comprehensive dataset comprising 24,158 research articles sourced from eight selected biodiversity conservation journals covering a fifteen-year span from 2008 to 2022.
Among these articles, 10,220 papers, accounting for approximately 42.3% of the total, explicitly mentioned using R as statistical software for data analysis. This finding underscores the widespread adoption of R in biodiversity conservation research. Over the years, the percentage of articles reporting the utilization of R has steadily increased, starting at 11.1% in 2008 and soaring to a remarkable 70.6% in 2022 (Figure 1). Furthermore, a strong correlation between the percentage of R utilization and years was observed with a coefficient of r = 0.99 (p < 0.001).
It is noteworthy that, since 2016, over half of the research papers (ranging from 51.1% in 2016 to 70.6% in 2022) have incorporated R as their statistical analysis tool. These statistics emphasize the growing prevalence and the strong endorsement of R as a preferred and valuable piece of statistical software in the field of biodiversity conservation research. This trend not only highlights the adaptability of R but also its capacity to meet the evolving analytical needs of researchers in this field. Consequently, R has made significant contributions to advancements in biodiversity conservation efforts.
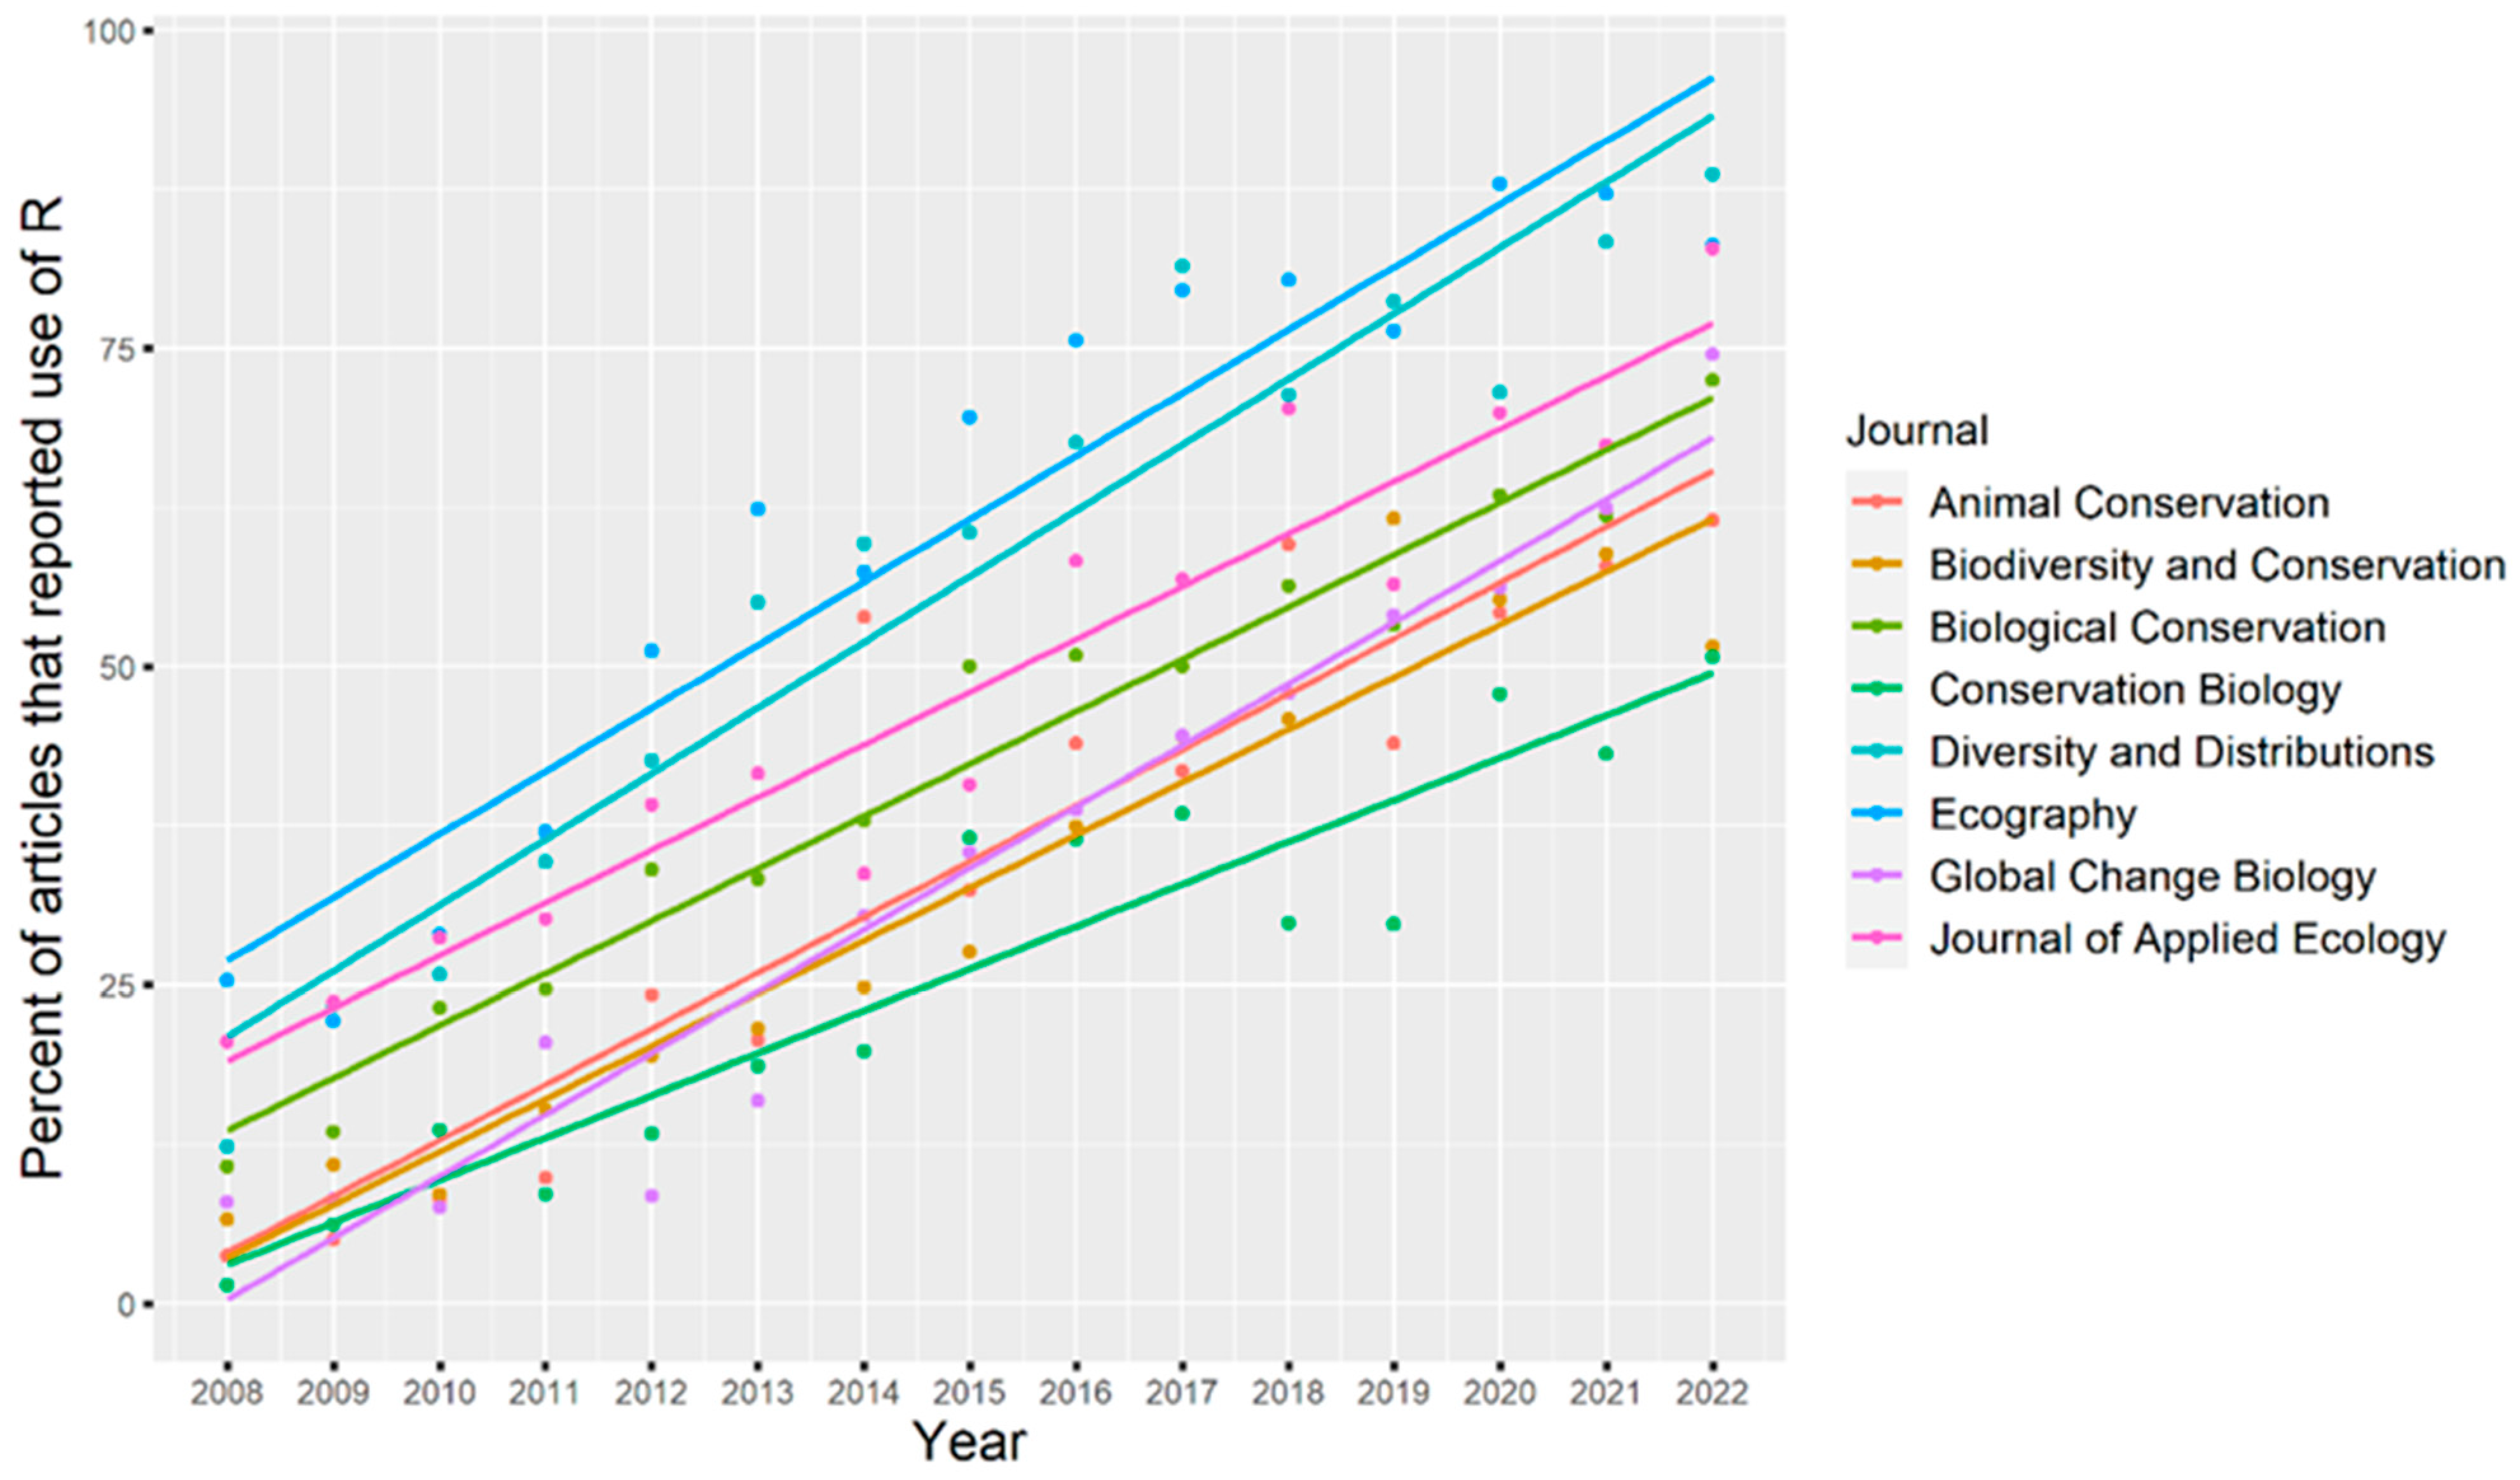
In our comprehensive analysis spanning from 2008 to 2022, a clear upward trend is evident in the percentage of articles utilizing R for data analysis in the selected journals, as illustrated in Figure 2. However, it is essential to emphasize that specific journals showed notable fluctuations, and the growth rate of R usage varied among them (Figure 2).
Notably, Ecography has distinguished itself for its exceptional commitment to utilizing R, achieving an impressive usage rate of 64.1% (1244 out of 1940) over a fifteen-year period. In 2008, Ecography already demonstrated a substantial R usage rate of 25.3%, experiencing average annual growth of 4.8%. By 2020, the R usage rate within Ecography had surged to an astonishing 87.8%. While there was a slight decline in both 2021 (87.1%) and 2022 (83%), this underscores that the use of the R language has reached its peak and stabilized, underscoring a consistent preference for R in this journal.
Diversity and Distributions closely tracked behind, sustaining an average R usage rate of 60.8% (1148 out of 1888). Remarkably, Diversity and Distributions showcased the most rapid growth trend in R usage among all journals with an average annual increase of 5.2%. It underwent a significant ascent from a 12.3% R usage rate in 2008 to an impressive 88.6% in 2022, marking the highest R usage among all journals in 2022. We believe it is likely to enter a stable phase moving forward.
Journal of Applied Ecology initiated the period with an R usage rate of 20.5% in 2008, demonstrating an average annual growth of 4.1%. By 2022, the R usage rate in Journal of Applied Ecology had risen to 82.8%. Consequently, Journal of Applied Ecology secured the third position in the overall 15-year average R usage ratio, standing at 50.6% (1502 out of 2917).
In contrast, Biodiversity Conservation, Global Change Biology, Animal Conservation, and Biodiversity and Conservation exhibited moderately positioned fifteen-year average R usage percentages at 42.5%, 38.9%, 37.3%, and 32.1%, respectively. These four journals started with relatively low R usage rates in 2008 with figures of 10.7%, 7.9%, 3.7%, and 6.6%, respectively. The final journal, Conservation Biology, displayed the lowest levels of R language use, boasting a 15-year average of only 23.5% and an initial point of merely 1.4% in 2008. It also reported the lowest annual growth rate at only 3.3%. Therefore, the overall lowest R usage rate in Conservation Biology is not surprising.
3.2. Patterns of R Package Utilization
In our comprehensive analysis of research articles, we recorded that researchers employed a diverse array of over 1450 R packages to facilitate their data analysis efforts. Notably, 26 packages emerged as prominent choices, featuring in more than 100 articles (Figure 3). Leading the list was the “vegan” package, recognized for its versatility and widespread use, particularly in multivariate analysis in community ecology [14]. Following closely in the second position was “lme4”, a versatile package well known for its extensive utility in fitting and dissecting linear mixed models [15]. The usage frequencies of the two packages significantly surpassed those of others (see Figure 3). In the third position was “MuMIn”, a valuable package that greatly simplifies information theoretic model selection and averaging based on information criteria [16]. Following closely in fourth place was “nlme”, a versatile package frequently used for modeling both linear and nonlinear mixed models [17]. Securing the fifth position was the “mgcv” package, renowned for its pivotal role in generalized additive models [18,19]. Rounding out the top ten were raster, MASS, ggplot2, car, and dismo. For detailed information of the 26 most frequently used packages, one can refer to Supplementary Materials.
The diverse focuses within various journals naturally led to the adoption of distinct sets of frequently used R packages (Figure 4). Among these, the “vegan” package prominently emerged as the top choice for Ecography, Biodiversity and Conservation, and Diversity and Distributions. Particularly in Biodiversity and Conservation, “vegan” maintained a substantial lead, with its usage exceeding that of the second-ranked “lme4” by more than double, establishing “vegan” as the preferred package across all journals, as highlighted in Figure 3. However, the “lme4” package, despite claiming the title of the most frequently utilized package in the remaining five journals, found itself in the second spot in the overall usage frequency rankings due to the relatively lower proportion of R usage in these journals. Meanwhile, the “MuMIn” package secured the second position in one journal (Animal Conservation), the third position in two journals (Biodiversity and Conservation and Biological Conservation), the fourth position in three journals (Conservation Biology, Ecography, and Journal of Applied Ecology), and the fifth position in two journals (Biodiversity and Distributions and Global Change Biology). This diverse placement underscores the extensive application of the “MuMIn” package in biodiversity conservation research, ultimately earning it third position in the overall rankings.
This diversity in package usage reflects the remarkable versatility of the R language, which can effectively cater to a vast array of research requirements. Furthermore, this diversity underscores the vital role played by specific packages in advancing various aspects of data analysis within the realm of biodiversity conservation research. Each package serves as a specialized tool contributing to the multifaceted needs of researchers in this field, and, collectively, they form a robust toolkit for addressing the complex challenges and questions that arise in the study of biodiversity and conservation. In essence, these package choices are a testament to the dynamic and ever-evolving nature of data analysis in this field, where researchers continually seek and apply the best-suited tools for their specific research goals.
4. Discussion
In recent years, advancements in data collection technologies have led to the accumulation of extensive datasets in biodiversity [20]. The processing and analysis of these big datasets have become routine tasks for contemporary biodiversity conservation researchers [21]. The handling of such abundant data relies heavily on statistical models and software [4]. With the continuous progress of computing technology, researchers now have access to a variety of statistical software options, each with its unique strengths and limitations [4]. A noteworthy trend is the substantial increase in the adoption of R as the primary statistical tool in research articles published in eight distinguished biodiversity conservation journals. This adoption rate has experienced remarkable growth, surging from a mere 11.1% in 2008 to a significant 70.6% in 2022. This impressive evolution serves as a clear indicator of the growing importance of the R language as a pivotal instrument for data analysis in contemporary biodiversity conservation research. These patterns are consistent with the discoveries of other bibliometric studies in related fields such as ecology [12] and photosynthesis [22]. The prominence of R in these studies can be attributed to its robust statistical capabilities, its advanced data visualization tools, its unwavering support from a dynamic and engaged community, its open-source nature, and its accessibility. Collectively, these qualities establish R as the compelling first choice for data analysis and research across diverse domains, including the realm of biodiversity conservation.
The popularity of the R language in Ecography and Diversity and Distributions can be attributed to the close alignment of these journals with the field of macroecology. Macroecology involves the comprehensive exploration of ecological patterns and processes on a grand scale—both spatially and temporally [2,23,24]. Consequently, macroecology typically entails the meticulous management of extensive datasets and the application of numerous models, which are primarily conducted on computers [3]. The expansive and inclusive nature of the R language renders it particularly well-suited for meeting the intricate data analysis needs inherent in macroecology [23,24]. Consequently, the two journals have gravitated towards adopting R as their primary statistical software. Conversely, the limited adoption of R in Conservation Biology can be linked to a stronger emphasis on biodiversity conservation theory and practices, exploring the social, ecological, and philosophical dimensions of the conservation of biological diversity. This field may not necessitate the extensive data-intensive analysis that R excels in, thus resulting in a lower R adoption rate.
Journal of Applied Ecology is a journal that focuses on the interface between ecological science and the management of biological resources. Therefore, it is also included in categories of both “Biodiversity Conservation” and “Ecology” on the Web of Science. The higher use of R in this journal stems primarily from the fact that the field of ecology represents a data-intensive area of study, often demanding advanced computational skills [25,26,27].
Although Biodiversity Conservation, Animal Conservation, and Biodiversity and Conservation are included in the category of biodiversity conservation in the Web of Science, many articles in these three journals involve data-driven research spanning the realms of both macroecology and conservation biology. Consequently, the utilization of R in these journals exists at a moderate level. Global Change Biology primarily focuses on publishing research related to the interface between biological systems and global environmental changes. Despite the initial low adoption rate of the R language in this journal during early stages, there has been a substantial and swift surge in its usage over time. This significant growth trend serves as a clear indicator of the mounting popularity and the widespread acceptance of the R language as an indispensable tool within the realm of global change research.
The substantial statistical capabilities of R receive significant augmentation from its extensive library of packages, a fundamental element contributing to the refinement of R’s analytical proficiency and adaptability. When scrutinizing the patterns of package utilization as observed in 30 ecology journals between 2008 to 2017 [12], the two most frequently employed packages, “lme4” and “vegan”, remain consistent with eight biodiversity conservation journals. However, disparities in their rankings underscore distinctions between the fields of ecology and biodiversity conservation. In 30 ecology journals, as expected, “lme4” claims the top position due to its specific design in addressing the prevalent issue of non-independence frequently encountered in ecological data [28,29,30,31]. Ecological data often involves intricate relationships, hierarchies, and repeated measurements [32], rendering “lme4” well-suited to handle these complex scenarios. Conversely, in the realm of biodiversity conservation, where the central focus is on biodiversity, the analytical emphasis leans more towards multivariate analysis. This makes “vegan” particularly well-suited to biodiversity conservation research. This observation underscores both shared and distinctive characteristics in statistical analysis between ecology and biodiversity conservation, reflecting the specialized needs and nuances of each discipline. In addition to the ten previously mentioned packages widely employed in biodiversity conservation research, there are specific R packages tailored for biodiversity research that deserve the attention of conservation ecologists. These include data download packages such as “rgbif” [33], “genesysr” [34], and “spocc” [35], while “taxize” [36] facilitates taxonomic naming. The “CoordinateCleaner” package [37] proves instrumental in addressing data cleaning and coordinat quality assurance. In the domain of species distribution modeling, crucial packages encompass “sdm” [38], “maxnet” [39], “wallace” [40], “BiodiversityR” [41], and “GapAnalysis” [42]. The inclusion of these packages significantly enriches the toolkit available to researchers actively involved in biodiversity conservation studies.
Reproducibility is imperative across diverse research domains within contemporary natural sciences [43]. The R language emerges as a crucial facilitator in enhancing research reproducibility by providing a transparent, standardized, and well-documented platform for data statistical analysis [44]. Its extensive adoption not only ensures uniformity but also enhances transparency, fostering an environment where research findings can undergo independent validation and verification by fellow scientists [45]. The R language’s popularity in prominent biodiversity conservation journals carries significant implications for advancing the field as an open science initiative. By collectively embracing R as a common tool, researchers in biodiversity conservation science pledge to uphold transparency, consistency, and collaborative efforts. This shared commitment not only fortifies the scientific rigor of biodiversity conservation research but also extends an invitation to a wider audience for the assessment, validation, and expansion of existing findings. Ultimately, the prevalence of the R language in biodiversity conservation journals cultivates an ethos of open science, propelling scientific progress and fostering innovation within the field.
Despite the numerous benefits that R offers to biodiversity conservation research, it is crucial to recognize that its comprehensive utilization encounters specific challenges. These challenges encompass computational demands, steep learning curves, and the intricacies associated with integrating diverse data sources [10]. Meeting the computational requirements of handling extensive biodiversity conservation datasets poses another significant challenge. Given the intricate, large-scale nature of data in biodiversity conservation research [46], optimizing R to efficiently manage big data becomes imperative.
The future of R use in biodiversity conservation research should focus on several key areas. Firstly, enhancing usability is paramount. This involves making R accessible to a broad spectrum of users through intuitive and user-friendly interfaces. By doing so, researchers with diverse backgrounds and technical expertise can effectively employ R in their biodiversity conservation studies. Secondly, reinforcing its capacity to handle big data efficiently is crucial. As datasets continue to grow in size and complexity, optimizing R’s capabilities to process and analyze large-scale data efficiently becomes critical. This can be achieved through the development of improved algorithms, efficient memory management, and leveraging parallel processing to expedite computations. By enhancing R’s performance in these areas, it can better address the data-intensive requirements of biodiversity conservation research. Finally, fostering interdisciplinary collaborations is of paramount importance. Biodiversity conservation research spans multiple fields and disciplinary perspectives [46]. Encouraging collaboration among researchers from different fields enables the further development and customization of R packages to meet the specific needs of biodiversity conservation science. This approach positions R as a more versatile and widely used tool in biodiversity conservation research that is better equipped to tackle the intricate and multifaceted challenges inherent to modern biodiversity conservation research. With these advancements, R can play a pivotal role in supporting biodiversity conservation research and facilitating scientific progress in this critical field.
As our literature survey was primarily dedicated to evaluating the prevalence of R usage, we faced a constraint in quantifying trends related to other computer programs in biodiversity conservation journals. It is crucial to recognize that this an inherent limitation in our present study. Future research endeavors should consider conducting a more comprehensive analysis that extends beyond R usage. This approach would permit a thorough exploration of the broader spectrum of computer programs utilized in biodiversity conservation research. Such an analysis would contribute to an enhanced understanding of the diverse tools employed in the field, providing a more holistic perspective on computational approaches within the domain of biodiversity conservation.
Supplementary Materials
The following supporting information can be downloaded at: https://www.mdpi.com/article/10.3390/d15121202/s1.
Author Contributions
Conceptualization, J.L. and L.M.; methodology, J.L.; software, J.L.; validation, J.L., L.M. and W.Z.; formal analysis, L.M.; investigation, D.C.; resources, D.C.; data curation, D.C.; writing—original draft preparation, L.M.; writing—review and editing, J.L.; visualization, J.L.; supervision, L.M.; project administration, L.M.; funding acquisition, L.M. All authors have read and agreed to the published version of the manuscript.
Funding
This work was supported by the National Natural Science Foundation of China (32271551), Jiangsu Social Development Project (BE2022792) and the Metasequoia fund of Nanjing Forestry University.
Data Availability Statement
Data available in a publicly accessible repository.
Acknowledgments
We sincerely thank the numerous graduate students who enthusiastically enrolled in the “R course” instructed by J.L. at the University of Chinese Academy of Sciences and Nanjing Forestry University. Their dedicated efforts in conducting comprehensive literature surveys have significantly contributed to establishing the empirical foundation for this research.
Conflicts of Interest
The authors declare that they have no conflict of interest.
References
- Farooqi, T.J.A.; Irfan, M.; Portela, R.; Zhou, X.; Shulin, P.; Ali, A. Global progress in climate change and biodiversity conservation research. Glob. Ecol. Conserv. 2022, 38, e02272. [Google Scholar] [CrossRef]
- McGill, B.J. The what, how and why of doing macroecology. Glob. Ecol. Biogeogr. 2019, 28, 6–17. [Google Scholar] [CrossRef]
- Wüest, R.O.; Zimmermann, N.E.; Zurell, D.; Exander, J.M.A.; Fritz, S.A.; Hof, C.; Kreft, H.; Normand, S.; Cabral, J.S.; Szekely, E.; et al. Macroecology in the age of Big Data—Where to go from here? J. Biogeogr. 2020, 47, 1–12. [Google Scholar] [CrossRef]
- Pollock, L.J.; O’Connor, L.M.J.; Mokany, K.; Rosauer, D.F.; Talluto, M.V.; Thuiller, W. Protecting Biodiversity (in All Its Complexity): New Models and Methods. Trends Ecol. Evol. 2020, 35, 1119–1128. [Google Scholar] [CrossRef]
- Cavender-Bares, J.; Schneider, F.D.; Santos, M.J.; Armstrong, A.; Carnaval, A.; Dahlin, K.M.; Fatoyinbo, L.; Hurtt, G.C.; Schimel, D.; Townsend, P.A.; et al. Integrating remote sensing with ecology and evolution to advance biodiversity conservation. Nat. Ecol. Evol. 2022, 6, 506–519. [Google Scholar] [CrossRef] [PubMed]
- Kress, W.J.; García-Robledo, C.; Uriarte, M.; Erickson, D.L. DNA barcodes for ecology, evolution, and conservation. Trends Ecol. Evol. 2015, 30, 25–35. [Google Scholar] [CrossRef]
- Smith, R.I.; Dick, J.M.; Scott, E.M. The role of statistics in the analysis of ecosystem services. Environmetrics 2011, 22, 608–617. [Google Scholar] [CrossRef]
- Tredennick, A.T.; Hooker, G.; Ellner, S.P.; Adler, P.B. A practical guide to selecting models for exploration, inference, and prediction in ecology. Ecology 2021, 102, e03336. [Google Scholar] [CrossRef]
- Ihaka, R.; Gentleman, R. R: A Language for Data Analysis and Graphics. J. Comput. Graph. Stat. 1996, 5, 299–314. [Google Scholar] [CrossRef]
- Lawlor, J.; Banville, F.; Forero-Munoz, N.R.; Hebert, K.; Martinez-Lanfranco, J.A.; Rogy, P.; MacDonald, A.A.M. Ten simple rules for teaching yourself R. PLoS Comput. Biol. 2022, 18, e1010372. [Google Scholar] [CrossRef]
- Bolker, B.M.; Gardner, B.; Maunder, M.; Berg, C.W.; Brooks, M.; Comita, L.; Crone, E.; Cubaynes, S.; Davies, T.; de Valpine, P.; et al. Strategies for fitting nonlinear ecological models in R, AD Model Builder, and BUGS. Methods Ecol. Evol. 2013, 4, 501–512. [Google Scholar] [CrossRef]
- Lai, J.S.; Lortie, C.J.; Muenchen, R.A.; Yang, J.; Ma, K.P. Evaluating the popularity of R in ecology. Ecosphere 2019, 10, e02567. [Google Scholar] [CrossRef]
- R Development Core Team. R: A Language and Environment for Statistical Computing; R Development Core Team: Vienna, Austria, 2022. [Google Scholar]
- Oksanen, J.; Blanchet, F.G.; Friendly, M.; Kindt, R.; Legendre, P.; McGlinn, D.; Minchin, P.R.; O’Hara, R.B.; Simpson, G.L.; Solymos, P.; et al. Vegan: Community Ecology Package; R Package 2.5-6; 2019; Available online: https://github.com/vegandevs/vegan (accessed on 20 August 2020).
- Bates, D.; Machler, M.; Bolker, B.M.; Walker, S.C. Fitting Linear Mixed-Effects Models Using lme4. J. Stat. Softw. 2015, 67, 1–48. [Google Scholar] [CrossRef]
- Bartoń, K. MuMIn: Multi-Model Inference. R Package Version 1.46.0. 2022. Available online: https://CRAN.R-project.org/package=MuMIn (accessed on 2 August 2022).
- Pinheiro, J.; Bates, D.; DebRoy, S.; Sarkar, D.; Team, R.C. nlme: Linear and Nonlinear Mixed Effects Models. R Package Version 3.1-149. 2020. Available online: https://CRAN.R-project.org/package=nlme (accessed on 24 August 2020).
- Wood, S.N.; Goude, Y.; Shaw, S. Generalized additive models for large data sets. J. R. Stat. Soc. Ser. C-Appl. Stat. 2015, 64, 139–155. [Google Scholar] [CrossRef]
- Wood, S.N.; Pya, N.; Saefken, B. Smoothing Parameter and Model Selection for General Smooth Models. J. Am. Stat. Assoc. 2016, 111, 1548–1563. [Google Scholar] [CrossRef]
- Hardisty, A.R.; Ellwood, E.R.; Nelson, G.; Zimkus, B.; Buschbom, J.; Addink, W.; Rabeler, R.K.; Bates, J.; Bentley, A.; Fortes, J.A.B.; et al. Digital Extended Specimens: Enabling an Extensible Network of Biodiversity Data Records as Integrated Digital Objects on the Internet. Bioscience 2022, 72, 978–987. [Google Scholar] [CrossRef] [PubMed]
- Correia, R.A.; Ladle, R.; Jaric, I.; Malhado, A.C.M.; Mittermeier, J.C.; Roll, U.; Soriano-Redondo, A.; Veríssimo, D.; Fink, C.; Hausmann, A.; et al. Digital data sources and methods for conservation culturomics. Conserv. Biol. 2021, 35, 398–411. [Google Scholar] [CrossRef]
- Liu, Y.; Wang, X.; Fan, D.; Lai, J. The use of R in photosynthesis research. Funct. Plant Biol. 2022, 49, 565–572. [Google Scholar] [CrossRef]
- Rapacciuolo, G. Strengthening the contribution of macroecological models to conservation practice. Glob. Ecol. Biogeogr. 2019, 28, 54–60. [Google Scholar] [CrossRef]
- Rapacciuolo, G.; Blois, J.L. Understanding ecological change across large spatial, temporal and taxonomic scales: Integrating data and methods in light of theory. Ecography 2019, 42, 1247–1266. [Google Scholar] [CrossRef]
- Carey, C.C.; Ward, N.K.; Farrell, K.J.; Lofton, M.E.; Krinos, A.I.; McClure, R.P.; Subratie, K.C.; Figueiredo, R.J.; Doubek, J.P.; Hanson, P.C.; et al. Enhancing collaboration between ecologists and computer scientists: Lessons learned and recommendations forward. Ecosphere 2019, 10, e02753. [Google Scholar] [CrossRef]
- Davis, A.J.; Kay, S. Writing statistical methods for ecologists. Ecosphere 2023, 14, e4539. [Google Scholar] [CrossRef]
- Lortie, C.J.; Braun, J.; Filazzola, A.; Miguel, F. A checklist for choosing between R packages in ecology and evolution. Ecol. Evol. 2020, 10, 1098–1105. [Google Scholar] [CrossRef] [PubMed]
- Harrison, X.A. Using observation-level random effects to model overdispersion in count data in ecology and evolution. PeerJ 2014, 2, e616. [Google Scholar] [CrossRef] [PubMed]
- Harrison, X.A.; Donaldson, L.; Correa-Cano, M.E.; Evans, J.; Fisher, D.N.; Goodwin, C.E.; Robinson, B.S.; Hodgson, D.J.; Inger, R. A brief introduction to mixed effects modelling and multi-model inference in ecology. PeerJ 2018, 6, e4794. [Google Scholar] [CrossRef]
- Lai, J.; Zou, Y.; Zhang, S.; Zhang, X.; Mao, L. glmm.hp: An R package for computing individual effect of predictors in generalized linear mixed models. J. Plant Ecol. 2022, 15, 1302–1307. [Google Scholar] [CrossRef]
- Schielzeth, H.; Nakagawa, S. Nested by design: Model fitting and interpretation in a mixed model era. Methods Ecol. Evol. 2013, 4, 14–24. [Google Scholar] [CrossRef]
- Bolker, B.M.; Brooks, M.E.; Clark, C.J.; Geange, S.W.; Poulsen, J.R.; Stevens, M.H.H.; White, J.-S.S. Generalized linear mixed models: A practical guide for ecology and evolution. Trends Ecol. Evol. 2009, 24, 127–135. [Google Scholar] [CrossRef] [PubMed]
- Chamberlain, S.; Barve, V.; Mcglinn, D.; Oldoni, D.; Desmet, P.; Geffert, L.; Ram, K. rgbif: Interface to the Global Biodiversity Information Facility API. 2023. Available online: https://CRAN.R-project.org/package=rgbif (accessed on 24 June 2023).
- Obreza, M. genesysr: Genesys PGR Client. R Package Version 2.0.0. 2023. Available online: https://cran.r-project.org/web/packages/genesysr/index.html (accessed on 19 July 2023).
- Chamberlain, S. spocc: Interface to Species Occurrence Data Sources. 2020. Available online: https://cran.r-project.org/web/packages/spocc/index.html (accessed on 15 March 2021).
- Chamberlain, S.A.; Szöcs, E. taxize: Taxonomic search and retrieval in R. F1000Research 2013, 2, 191. [Google Scholar] [CrossRef]
- Zizka, A.; Silvestro, D.; Andermann, T.; Azevedo, J.; Ritter, C.D.; Edler, D.; Farooq, H.; Herdean, A.; Ariza, M.; Scharn, R.; et al. CoordinateCleaner: Standardized cleaning of occurrence records from biological collection databases. Methods Ecol. Evol. 2019, 10, 744–751. [Google Scholar] [CrossRef]
- Naimi, B.; Araújo, M.B. sdm: A reproducible and extensible R platform for species distribution modelling. Ecography 2016, 39, 368–375. [Google Scholar] [CrossRef]
- Phillips, S. maxnet: Fitting ‘Maxent’ Species Distribution Models with ‘Glmnet’. R Package Ver. 1.3. 3. 2013. Available online: https://cran.r-project.org/web/packages/maxnet/index.html (accessed on 7 April 2013).
- Kass, J.M.; Vilela, B.; Aiello-Lammens, M.E.; Muscarella, R.; Merow, C.; Anderson, R.P. WALLACE: A flexible platform for reproducible modeling of species niches and distributions built for community expansion. Methods Ecol. Evol. 2018, 9, 1151–1156. [Google Scholar] [CrossRef]
- Kindt, R.; Coe, R. Tree Diversity Analysis. A Manual and Software for Common Statistical Methods for Ecological and Biodiversity Studies; World Agroforestry Centre (ICRAF): Nairobi, Kenya, 2005; ISBN 92-9059-179-X. [Google Scholar]
- Carver, D.; Sosa, C.C.; Khoury, C.K.; Achicanoy, H.A.; Diaz, M.V.; Sotelo, S.; Castañeda-Alvarez, N.P.; Ramirez-Villegas, J. GapAnalysis: An R package to calculate conservation indicators using spatial information. Ecography 2021, 44, 1000–1009. [Google Scholar] [CrossRef]
- Le Onelli, S. Rethinking Reproducibility as a Criterion for Research Quality. Res. Hist. Econ. Though. 2018, 36, 129–146. [Google Scholar] [CrossRef]
- Peikert, A.; van Lissa, C.J.; Brandmaier, A.M. Reproducible Research in R: A Tutorial on How to Do the Same Thing More Than Once. Psych 2021, 3, 836–867. [Google Scholar] [CrossRef]
- Bayraktarov, E.; Ehmke, G.; O’Connor, J.; Burns, E.L.; Nguyen, H.A.; McRae, L.; Possingham, H.P.; Lindenmayer, D.B. Do Big Unstructured Biodiversity Data Mean More Knowledge? Front. Ecol. Evol. 2019, 6, 239. [Google Scholar] [CrossRef]
- Hermoso, V.; Carvalho, S.B.; Giakoumi, S.; Goldsborough, D.; Katsanevakis, S.; Leontiou, S.; Markantonatou, V.; Rumes, B.; Vogiatzakis, I.N.; Yates, K.L. The EU Biodiversity Strategy for 2030: Opportunities and challenges on the path towards biodiversity recovery. Environ. Sci. Policy 2022, 127, 263–271. [Google Scholar] [CrossRef]
Figure 1.
The proportion of research articles utilizing R in the top eight biodiversity conservation journals from 2008 to 2022. The dataset comprises more than 24,100 articles, and the methodologies were thoroughly examined to identify documented instances of R usage.
Figure 1.
The proportion of research articles utilizing R in the top eight biodiversity conservation journals from 2008 to 2022. The dataset comprises more than 24,100 articles, and the methodologies were thoroughly examined to identify documented instances of R usage.

Figure 2.
The percentage of research articles explicitly using R in the eight top biodiversity conservation journals from 2008 to 2022.
Figure 2.
The percentage of research articles explicitly using R in the eight top biodiversity conservation journals from 2008 to 2022.

Figure 3.
The most widely utilized R packages (appearing in over 100 articles) across the eight top biodiversity conservation journals from 2008 to 2022.
Figure 3.
The most widely utilized R packages (appearing in over 100 articles) across the eight top biodiversity conservation journals from 2008 to 2022.

Figure 4.
The top ten R packages frequently employed in the leading eight biodiversity conservation journals from 2008 to 2022.
Figure 4.
The top ten R packages frequently employed in the leading eight biodiversity conservation journals from 2008 to 2022.

Disclaimer/Publisher’s Note: The statements, opinions and data contained in all publications are solely those of the individual author(s) and contributor(s) and not of MDPI and/or the editor(s). MDPI and/or the editor(s) disclaim responsibility for any injury to people or property resulting from any ideas, methods, instructions or products referred to in the content. |
© 2023 by the authors. Licensee MDPI, Basel, Switzerland. This article is an open access article distributed under the terms and conditions of the Creative Commons Attribution (CC BY) license (https://creativecommons.org/licenses/by/4.0/).
Share and Cite
MDPI and ACS Style
Lai, J.; Cui, D.; Zhu, W.; Mao, L. The Use of R and R Packages in Biodiversity Conservation Research. Diversity 2023, 15, 1202. https://doi.org/10.3390/d15121202
AMA Style
Lai J, Cui D, Zhu W, Mao L. The Use of R and R Packages in Biodiversity Conservation Research. Diversity. 2023; 15(12):1202. https://doi.org/10.3390/d15121202
Chicago/Turabian StyleLai, Jiangshan, Dongfang Cui, Weijie Zhu, and Lingfeng Mao. 2023. "The Use of R and R Packages in Biodiversity Conservation Research" Diversity 15, no. 12: 1202. https://doi.org/10.3390/d15121202
Note that from the first issue of 2016, this journal uses article numbers instead of page numbers. See further details here.