Article

DNA Barcoding of Pygmy Hoppers—The First Comprehensive Overview of the BOLD Systems’ Data Shows Promise for Species Identification

1
Matice hrvatske 11, 80101 Livno, Bosnia and Herzegovina
2
Evolution Lab, Division of Zoology, Department of Biology, Faculty of Science, University of Zagreb, Rooseveltov trg 6, 10000 Zagreb, Croatia
3
Zoologisches Museum Hamburg, Leibniz Institut zur Analyse des Biodiversitätswandels, Martin-Luther-King-Platz 3, 20146 Hamburg, Germany
*
Author to whom correspondence should be addressed.
Diversity 2023, 15(6), 696; https://doi.org/10.3390/d15060696
Submission received: 14 April 2023 / Revised: 9 May 2023 / Accepted: 20 May 2023 / Published: 23 May 2023
(This article belongs to the Special Issue Frontiers in DNA Barcoding and Implications for Entomology)

Abstract

:
The COI gene is widely used as a DNA barcode in animals that can assist in the identification of species. One of the widely used aggregators of DNA barcodes is the Barcode of Life Data System (BOLD Systems), which contains around 2500 sequences of Tetrigidae, an understudied orthopteran family with unresolved taxonomy and species that are difficult to identify. In this paper, we provide a summary of the metadata provided with the COI sequences and present a phylogenetic analysis of photographically vouchered sequences using Maximum Likelihood and Bayesian analysis. We found that (1) the subfamily Tetriginae is disproportionately represented in the dataset, (2) most of the records are not identified beyond the family level, (3) most regions, except for Costa Rica, are undersampled, (4) most of the sequences do not have photographic vouchers, and (5) the taxonomic backbone of BOLD is out of date. The phylogenetic analysis showed that the clusters of COI barcodes mostly correspond to species, but some clusters remain ambiguous. The deeper nodes in the phylogenetic trees are not well-supported, indicating that this gene has a very weak phylogenetic signal beyond the specific level.

1. Introduction

Cytochrome oxidase subunit I (COI) is one of the elements in the mitochondrial cytochrome C oxidase protein (COX) and is thus of vital importance for energy production in cells [1]. A 658 bp segment of the COI gene was proposed as a DNA barcode that could assist in the identification of animal species, avoiding common problems of cryptic species, imprecise identification keys, and the lack of taxonomists [2]. It is now a widely used (and misused) marker, with a number of databases dedicated to accumulating barcode sequences across a wide range of animal taxa [3].
In addition to NCBI Genbank, the Barcode of Life Data System, or BOLD Systems, is the most widely used aggregator of DNA sequences and serves as an online database of DNA barcodes aiming to assemble molecular, morphological, and distributional data and make it freely available to researchers worldwide [4]. It offers several useful features, such as the BOLD Identification System, which enables matching uploaded sequences with those in the database to provide identification, and the Barcode Index Number (BIN) System, which clusters sequences using private algorithms to produce molecular operational taxonomic units (mOTUs) that are claimed to closely correspond to species [4]. The latter claim has recently come to light as controversial because the algorithm is not public, relies on some publicly unavailable sequences, and is not consistent when more sequences are added to the database [5]. Other algorithms such as Automatic Barcode Gap Discovery (ABGD), Assemble Species by Automatic Partitioning (ASAP), and the Bayesian Poisson Tree Processes model (bPTP) produce clusters that often do not match BIN clusters [6,7,8,9]. All these algorithms are also strongly dependent on the parameter settings (e.g., gap width). However, the BIN system can provide a general idea about the number of units that are being dealt with, but verification using other sources is necessary [8].
In addition to the clustering algorithm, a major source of error in any public database is false records. It is important for databases to be populated with error-free sequences. Errors can arise from two sources: errors in the sequences, which mainly include sequencing the wrong loci, i.e., pseudogenes or numts [10], and errors that are the result of misidentifications [11]. BOLD has its own system for detecting technical errors to which all the uploaded sequences are subjected [4], but there are also independent solutions, such as the R package “coil” that detects insertions and deletions (indels) and internal stop codons [12,13]. A good example of a taxon where the second problem is common is the pygmy hopper in the family Tetrigidae [11].
Tetrigidae is a monophyletic family in the order Orthoptera, suborder Caelifera. The caeliferan infraorder Acrididea is estimated to have originated in the late Permian and subsequently split into two groups, the family Tetrigidae and the superfamily group Acridomorpha [14]. Today, Tetrigidae comprises 7 subfamilies, 280 genera, and 2073 species [15]. The basis of their taxonomy was established by Ignacio Bolívar in 1887 [16], who distinguished morphologically distinct but polyphyletic subfamilies [17]. The identification of Tetrigidae species is difficult due to several factors. Firstly, Tetrigidae exhibits polymorphism in coloration, body size, and wing length, making those characters difficult to use in isolation [18,19,20]. Secondly, the classification and taxonomy of many groups within Tetrigidae are problematic, with many revisions conducted recently and with more still to come [17,21]. Continuing on the previous point, there is a lack of clear diagnoses for many of the described species and higher taxonomic categories [21], which leads to the lack of identification keys for many taxa [22]. Finally, reference databases such as the OSF [15] sometimes contain multiple different species under a single species (due to unresolved taxonomy or earlier misidentifications), which means that it is often necessary to examine the type specimen to determine relevant diagnostic characters and arrive at a confident identification [23,24]. New species continue to be described, adding to the already strained system [15]. Very little work has been performed on the molecular phylogeny of this family [25,26]. Hence, it is evident that research on Tetrigidae is a developing field that still has to adopt many of the methods used in modern entomology.
Therefore, the aim of this paper is to assess the data available for Tetrigidae in the BOLD database. First, a summary of the metadata provided with the COI sequences is given: the data on taxonomic composition, identification methods, location data, and photographic vouchers are provided to illuminate biases and shortcomings in the database. Second, a phylogenetic analysis of photographically vouchered sequences (safely identifiable) is presented, with the intention of examining the prospects of DNA barcoding in Tetrigidae.

2. Materials and Methods

The dataset was obtained on 22 November 2022 from the BOLD Systems website [4] after searching for “Tetrigidae” in the public data portal and downloading the combined TSV file of sequences and specimen information on all public records. The subsequent curation of the dataset was performed in R [27] using the “janitor” [28] and “coil” [12,13] packages.
A total of 2499 records were downloaded. Of those, 81 did not contain DNA sequences and were removed, leaving 2418 records. In the sequences, every letter denoting an uncertain base (IUPAC code for more than one base contained in some sequences) was replaced with N to make the data compatible with the coil package. The entire coil pipeline (coi5p_pipe() function with the triple_translate argument) was run on the data. 96 sequences (4% of the data) were labeled as likely containing indels causing a shift in the reading frame and were removed to reduce the possibility of including sequences with technical errors or nuclear mitochondrial pseudogenes [4,12]. After this step, 2322 records remained. Records containing sequences shorter than 500 bp (23 sequences, 1% of the data) were removed. The size of the final dataset used in the analysis of the database was 2299 records.
For phylogenetic analyses, only the sequences from records containing photographs with diagnostic characters clearly visible were considered. The specimens were identified by comparing them to the original descriptions and the type specimens available on the Orthoptera Species File Website (OSF) [15], supplemented with relevant identification keys [17,24,29,30]. The specimens that could not be identified due to a variety of factors (e.g., bad image quality, specimens with important diagnostic characters missing, species groups with morphologically similar species, etc.) were removed from this dataset. The specimens which we were able to confidently identify to the genus level or which represented hitherto unknown species or genera were left in the dataset. Ideally, the entire dataset should be reexamined in the future, using a combination of updated morphological and molecular information [11]. The final dataset of 183 COI sequences, including around 60 species in 37 genera, and two outgroup sequences (Tettigonia viridissima (Linnaeus, 1758) [31] (Ensifera, Tettigoniidae) and Myrmeleotettix maculatus (Thunberg, 1815) [32] (Caelifera, Acrididae)), was used for phylogenetic analysis. The sequences were aligned using the MAFFT (Multiple Alignment using Fast Fourier Transform) algorithm, which is available at https://www.ebi.ac.uk/Tools/msa/mafft/ (accessed on 25 November 2022). The aligned sequences were trimmed using the BioEdit program [33], leaving an alignment of 522 bp. The appropriate model for the maximum likelihood analysis and Bayesian analyses was determined using the ModelFinder function implemented in IQ-TREE [34,35]. The best model for our data, according to the BIC criterion, was determined to be GTR+F+I+G4, i.e., a General Time Reversible model with non-uniform evolutionary rates modeled using a discrete Gamma distribution (+G4) with 4 rate categories, under the assumption that a certain fraction of sites is evolutionarily invariable (+I), and with the empirical counts of state frequencies (+F).
A maximum likelihood (ML) phylogenetic analysis was conducted using IQ-TREE [34]. The ML tree was bootstrapped using the ultrafast bootstrap method [36] with 10,000 replicates. Alongside this, an SH-like approximate likelihood ratio test (SH-aLRT) with 1000 replicates was performed [37].
In addition, Bayesian analysis (BA) was performed with MrBayes v.3.2.6 [38]. As not all model parameters are available in MrBayes, we used the closely related GTR+I+G substitution model and ran the analysis for 5 million generations sampling every 500 generations for a total sample of 10,000 trees. Convergence was assumed as an average split frequency below 0.01 was reached. A consensus tree was generated after discarding a burn-in amounting to 25% of the samples. The generated trees were graphically edited using FigTree v1.4.4 [39] to produce figures.
The number of BINs recognized by BOLD was extracted from the download record database. To check this number, an independent exploratory analysis, Assemble Species by Automatic Partitioning (ASAP), was performed. Kimura’s two-parameter substitution model at ts/tv 2.5 was used with default group delimiting settings [9]. A test of substitution saturation, as suggested by Xia et al. [40] and Xia & Lemey [41], with 1000 replicates was performed using DAMBE v.7.3.32 [42].

3. Results

3.1. General Description of the BOLD Dataset

When the entire dataset of 2418 records containing DNA sequences is considered, the sequences have a mean length of 662 bp and a median length of 654 bp. The sequence length values vary between 219 bp and 1717 bp (the first quartile equaling 640 bp and the third quartile equaling 676 bp). The standard deviation of the sequence length values is 134 bp. Most of the values are close to the median. Most of the sequences with extremely high lengths are bound by long stretches of unknown base reads, making the actual data contained in them close to the median as well. This issue is present only in the downloaded dataset; the true length is correctly displayed on the BOLD website.
The coil package detected 96 sequences that likely contain indels that result in a frameshift and none that contain stop codons. The sequence lengths of these sequences are between 219 bp and 1717 bp, with the first quartile of 221 bp and the third quartile of 658 bp. The median value is 558 bp and the mean value is 540 bp, with a standard deviation of 336 bp. It can be observed that this subset has proportionally more short sequences than the entire dataset, but sequences of all lengths are present, i.e., indels were detected throughout the dataset.
The dataset from which the sequences that contain indels were removed contains 2299 records. The sequence lengths have a mean of 669 bp and a median of 654 bp. The sequence length values are dispersed between 505 bp and 1546 bp (the first quartile equaling 641 bp and the third quartile equaling 676 bp). The standard deviation of the sequence length values is 114 bp.

3.2. Review of the BOLD Metadata
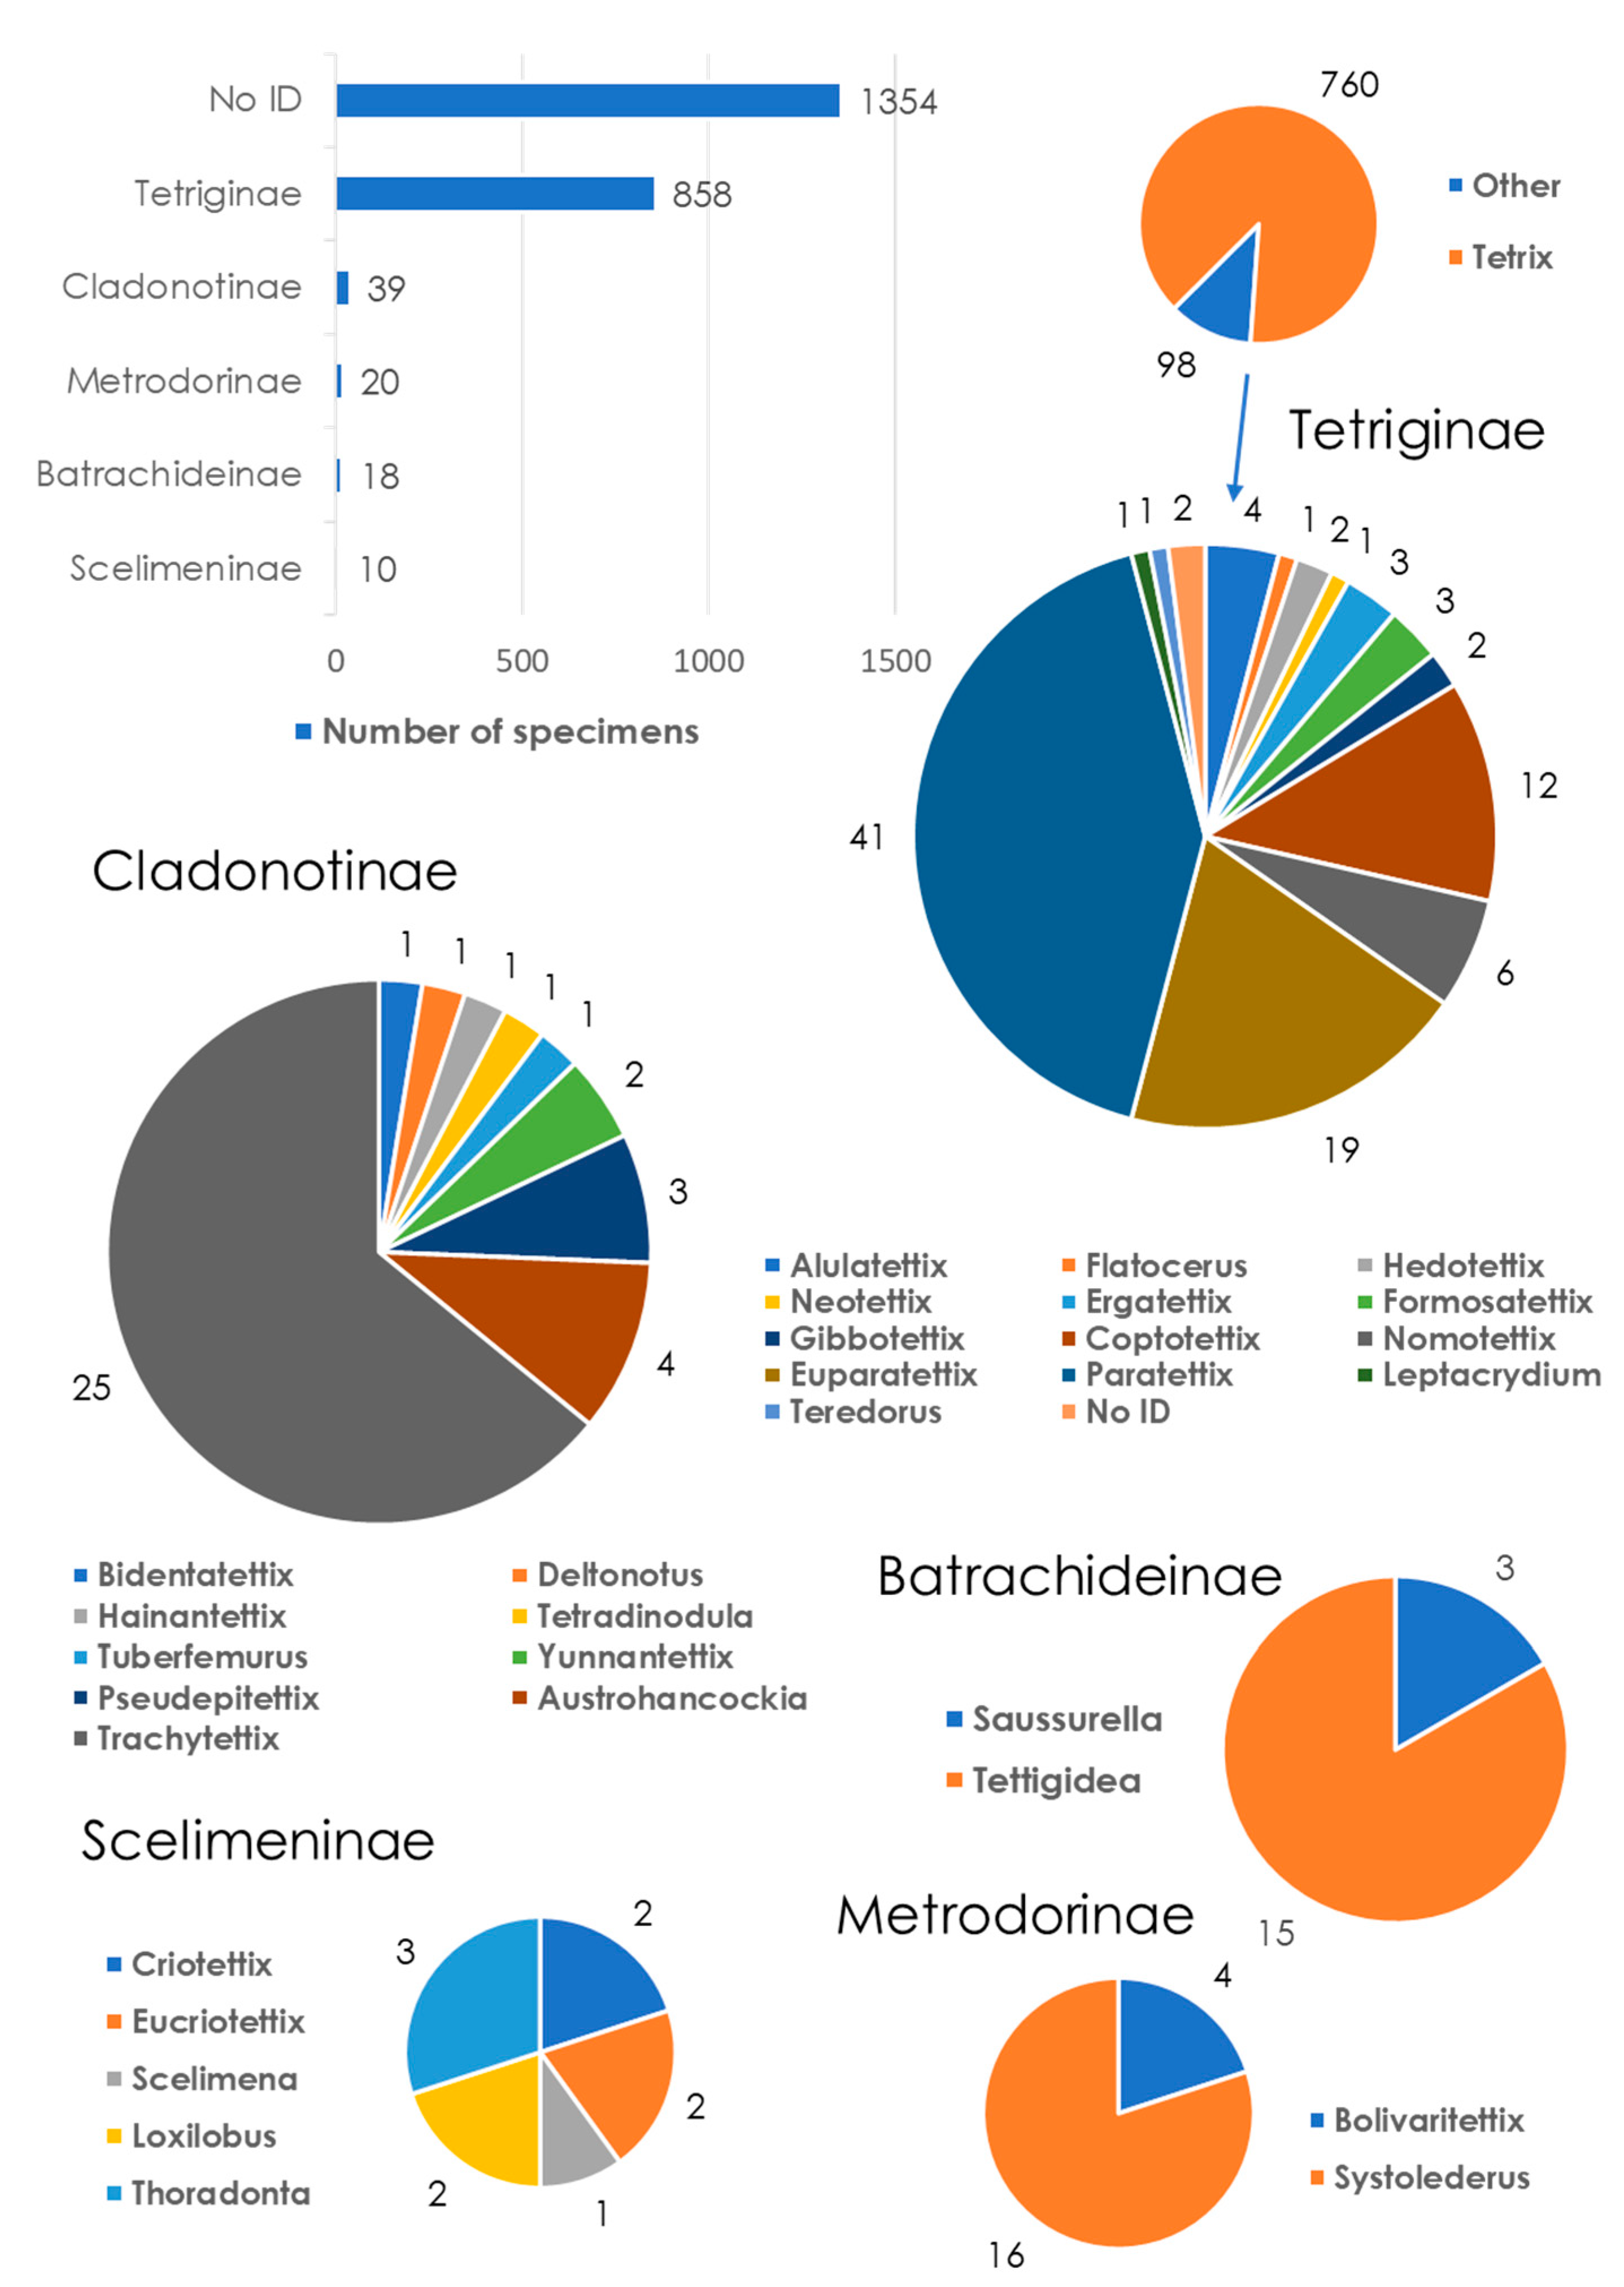
3.2.1. Taxonomy

More than half of the records, 1354 of them, are identified only to the family level. Those that have been identified at the subfamily level are dominated by Tetriginae with 858 records, which are followed by Cladonotinae (39 records), Metrodorinae (20 records), Batrachideinae (18 records), and Scelimeninae (10 records). Missing are the subfamilies Lophotettiginae Hancock, 1909 [43] and Tripetalocerinae Bolívar, 1887 [16], but specimens representing members of these taxa were found among the unidentified records. Furthermore, Tetriginae are dominated by a single genus, Tetrix Latreille, 1802 [44], with 760 records. The remaining genera, both within Tetriginae and in other subfamilies, are represented by relatively few records. A total of 32 genera are identified in the dataset. A complete summary of the data is available in Figure 1. However, some of the genera are incorrectly assigned; hence, a summary of the updated data according to the correct taxonomy [15] is given in Figure 2.
A total of 82 species are recorded in the BOLD database. As previously mentioned, Tetriginae is dominated by the genus Tetrix. Within the genus, Tetrix japonica (Bolívar, 1887) [16] has the most entries with 501 records. Some other Tetrix species have relatively high counts, but most of the species are represented with one record or just a few records. Generally, specimens are either unidentified beyond the family level or identified to the species level. Detailed summaries of the species count per subfamily are available in Appendix A, Figure A1 and Figure A2.

3.2.2. Identification Methods

BOLD allows users to specify the identification method and the literature that was used for the identification of specimens. The literature, when listed, is usually represented just with the original description of the species; hence, this information was not considered further. The most commonly used identification method is BOLD’s “BIN” feature with 1366 uses across the dataset. A total of 164 public BINs are delimited, with only 82 public species being identified. For most of the other records (N = 820), the identification method is not specified. There are very few that used the BOLD ID Engine and morphology. Very few records use multiple methods. An overview of the identification methods used on BOLD is presented in Figure 3.

3.2.3. Geography

Most of the specimens were sampled in the Americas. There are 665 records from South America, 146 from North America, and 1115 from Central America, which is considered here as a separate region. The vast majority of Central American records are from Costa Rica, collected as part of an ongoing barcoding initiative [45]. Other regions have very few records, and there are more than 600 specimens without locality data. A visual summary of the geographical distribution of the BOLD data is available in Figure 4.

3.2.4. Photographic Documentation

Although the system allows one to attach a photograph showing the voucher specimen to the record, this feature is very rarely used. Only 289 (12.6%) records have a photograph attached. Since Tetriginae dominates, a lot of records pertaining to them are without photographs (N = 659) but also a relatively large number do have photographs (N = 199). However, most of the records without photographic evidence are those that lack identification beyond that of the family—1275 unidentified records are not vouchered for with a photograph, and only 79 are. A detailed breakdown of photographic vouchers in the BOLD database is available in Figure 5.

3.3. Sequence Analysis

The relationships between the 183 COI sequences obtained from BOLD are represented with trees inferred using Bayesian analysis and Maximum Likelihood methods. The ML tree with the highest log likelihood (−15,277.4599) is given in Figure 6. The BA tree is given in Figure 7.
The index of substitution saturation (Iss) at 32 OTUs was calculated to be 0.383, while the critical value for asymmetrical trees (Iss.cAsym) was calculated to be 0.378. The p-value of the two-tailed test used to compare these two values is 0.8569, which indicates that there is no significant difference between them. Thus, the test for substitution saturation showed that for our data (trees that have highly asymmetric topologies and contain a large number of taxa—more than 16), the substitution saturation becomes apparent and does not permit an accurate reconstruction of the phylogeny. Thus, the main purpose of the trees is not to reconstruct the phylogeny but to test the resolution of COI sequences at the species level, i.e., to test the usability of the gene for delimiting species.
BOLD’s own BIN system recognizes 69 different BINs among the 183 COI sequences. The ASAP method recognizes between 64 and 77 clusters, with the 64-cluster delimitation being labeled as the best (asap-score 2), followed by 67 (asap-score 3.5) and 63 (asap-score 5.5). The groupings are highly consistent between both systems, with the differences arising almost exclusively from different groupings of Paratettix Bolívar, 1887 [16] records that could not be identified to the species level. Both systems reconstruct the two Costa Rican Tettigidea lateralis (Say, 1824) [46] specimens as two separate clusters that are distinct from the USA representatives of this species, which themselves are sometimes separated into two clusters (visible in Figure 6 and Figure 7). In all analyses, a record of an unidentified genus is attributed to the Paurotarsus insolitus Rehn, 1916 [47] cluster. Since the validity of most of the discrepant clusters cannot be checked morphologically, these results are not further examined but are only briefly discussed. Only around 60 different species can be reliably recognized from the photos in this dataset, owing to the uncertainties in delimiting the Paratettix and Tettigidea specimens.

4. Discussion

In this study, we examined the Tetrigidae records provided in the BOLD database with two aims: (1) to quantify the metadata provided with sequences and (2) to examine the value of DNA barcoding for delimiting species of this orthopteran family. The examination of metadata showed that: (1) there is a strong taxonomic bias favoring the subfamily Tetriginae, (2) most of the records are not identified beyond the family level, (3) most regions (with the notable exception of Costa Rica) are insufficiently sampled, (4) most of the sequences do not have photographic vouchers, and (5) the taxonomic backbone of BOLD is out of date. The phylogenetic analysis showed that COI barcodes often group well together with respect to species identifications attributed to them, showing promise for identifying most of the included species, but some clusters remain ambiguous. The deeper nodes in the phylogenetic trees are not well-supported, implying that this gene has a very weak phylogenetic signal beyond the specific level. The following provides a brief discussion of these results.

4.1. Strengths and Shortcomings of the BOLD Database

The coil package detected 96 sequences (4% of the dataset) that likely contain indels causing shifts in the reading frame and none that contain stop codons. Those sequences were generally shorter, so it is possible that some were wrongly labeled, as coil has an error rate of up to 25% for short sequences [13]. Most of the non-indel sequences are close to the expected length, meaning that BOLD’s own error-seeking system is adequate and the low amount of indels detected with coil could be due to differences in the algorithms used.
More than half of the records are identified only to the family level. Of those that are identified further, the subfamily Tetriginae is a clear leader, and it is dominated only by a single genus, Tetrix, which is not in proportion to the taxonomic composition of Tetrigidae [15]. The taxonomic bias in the BOLD database is evident, and there is very little material to work with outside a few very well-sampled species. Equally concerning is the total number of genera (N = 32) and species (N = 82) that are recorded in the database. These numbers pale in comparison to the global diversity of Tetrigidae [15] and represent less than 5% of the currently described taxa.
The most popular identification method, if even specified, is the BIN feature, which is known to be unstable when used on a relatively sparse dataset [5]. Without a good starting database of sequences, BINs for all but the most often sequenced species should be approached critically. Since most of the sequences remain completely unidentified, this method for identification cannot currently be fully assessed in the context of Tetrigidae, but some observations are provided later in the text. Lastly, very few entries contain “morphology” as the identification method.
The efforts to collect and sequence Tetrigidae are lacking in almost every region. A spatial bias is evident as well, with the records from Costa Rica outnumbering all the others by a significant margin. This is unsurprising since there is an organized effort in Costa Rica to barcode the country’s biodiversity [45]. Despite being well-sampled, Costa Rican records are almost entirely unidentified, making them practically useless in their current form. Those records should be examined using the approach of classical taxonomy to evaluate the practical usability of DNA barcoding in Tetrigidae [48].
The final comment, which casts the previous information in an even more unfavorable light, is one about the photographic vouchers that can be attached to each observation. Only 289 (12.6%) records are vouchered, most with a singular image of the animal in lateral view. This means that the vast majority of data available in BOLD is simply non-confirmable and thus of very limited use at the moment. The records for taxa with a lot of records can be examined by comparing the sequences to each other, but most of the records of less-represented taxa are unidentified and will become usable only once documentation on the vouchered sequences is uploaded to BOLD. Furthermore, taxonomic changes (which are frequent [15,17,21]) are currently not followed by BOLD, as exemplified by the discrepancies between the data shown in Figure 1 and Figure 2. For example, under the taxonomy used by BOLD, the entire subfamily Metrodorinae is incorrectly assigned, as Systolederus Bolívar, 1887 [16] is a member of Tetriginae [49], while Bolivaritettix Günther, 1939 [50] belongs to the unassigned tribe Criotettigini together with Eucriotettix Hebard, 1930 [51] and Criotettix Bolívar, 1887 [16], which are also incorrectly placed in the current system [52]. In addition to these recent changes, a lot of long-standing taxonomic acts are not reflected in the BOLD taxonomy [15].
BOLD is a valuable database that has a lot of potential to aid the study of Tetrigidae in the future, but some steps have to be taken to ensure this. The taxonomic backbone of BOLD should be updated regularly to make the database easier to navigate. The voucher specimens of unidentified BINs should be examined to determine their identities. Barcoding projects for underrepresented regions and taxa should be conducted to populate the database, ideally in cooperation with taxonomists, who can provide species-level identifications.

4.2. DNA Barcoding in Tetrigidae

The COI gene is used as a barcode in animals due to its relatively quick mutation rate, providing the base for delimiting species, but it also contains regions that are more evolutionarily constrained, allowing it to maintain a phylogenetic signal at higher taxonomic levels in some taxa [53,54,55]. However, as at least the deeper branches are not resolved in most animal groups, there is a need to develop other phylogenetically informative markers [56]. Nuclear markers, such as metazoan-level universal single-copy orthologs (USCOs), show high promise for consistent taxon assignment at both lower and higher taxonomic levels [57]. In our analyses of COI for Tetrigidae, very few deeper nodes are supported (Figure 6 and Figure 7), which implies that the variable region in the COI gene has reached the point of substitution saturation [58,59] and is not informative for higher taxonomy in this family. The substitution saturation tests run on our data conform with this interpretation. There are still a lot of problems in the taxonomy of Tetrigidae, with many groups requiring reclassification [21,22,23,24]. In the future, a combination of molecular and morphological studies will be required to sort out this family.
The total number of publicly available BINs of Tetrigidae in the BOLD database is 164. Only 82 species are recognized by name in the database, but it is still unclear how they correspond to the BINs. The 183 sequences we examined belong to 69 different BINs. However, only around 60 species are visually distinguishable. The ASAP clustering method recognizes between 64 and 77 clusters. On the trees, most specimens of a single species are grouped together with maximum statistical support, and most of the BINs and ASAP clusters correspond to the species. This, in addition to the inability to identify every record to the species level, allows us to conclude that clustering seems to be useful for the detection of species in most cases, but exceptions still exist. The following is an analysis of these exceptions, with the aim of further assessing the value of DNA barcoding in Tetrigidae.
The specimens of T. lateralis from North America group well together, but the specimens of this species from Costa Rica are not grouped with the US samples with high support. It is possible that these specimens in fact belong to other species of the T. lateralis complex, which are difficult to delimit from the provided photos. In all of the dendrograms and clustering analyses, the two Paurotarsus insolitus sequences are grouped together with a sequence belonging to an unidentified genus with the following BOLD Process ID: SSPAC8370-13. Considering the ample morphological differences between these taxa, it is not likely that this case represents a very recent speciation event within Batrachideinae.
Phaesticus mellerborgi (Stål, 1855) [60] and Xistrella dohrni Günther, 1939 [50] are grouped together with high support (ML 94/99; BA 100), indicating their relatedness, which is currently not reflected in their taxonomy [15]. A similar situation can be observed in the grouping of the unidentified species of Bolivaritettix and Rostella Hancock, 1913 [61]. Considering the similarities in the facial morphologies of these genera, this could be an important piece of information for resolving the taxonomy of both Criotettigini [52] and Cleostratini Bolívar, 1887 [16,62]. Continuing on from this, there is high support (ML 99/100; BA 100) for grouping the unidentified species of Criotettix and Eucriotettix, which are specious genera in need of revision [63], but it seems certain that their type species are closely related [52]. Lastly, the clade containing Nomotettix cristatus (Scudder, 1862) [64], Tetrix ornata (Say, 1824) [46], Tetrix ceperoi (Bolívar, 1887) [16], and Tetrix tuerki (Krauss, 1876) [65] is well supported (ML 94/97; BA 100), indicating that these species likely diverged recently. The same is true for the clade containing Tetrix brunnerii (Bolívar, 1887) [16], Tetrix transsylvanica (Bazyluk & Kis, 1960) [66], Tetrix bipunctata (Linnaeus, 1758) [31], Tetrix kraussi Saulcy, 1888 [67], and Tetrix depressa Brisout de Barneville, 1848 [68]. However, these two clades are not reconstructed together as parts of a well-supported clade.
The Tetrix bipunctata complex consists of two morphs, T. bipunctata and T. kraussi. These morphs have different microhabitat preferences and are differentiated only by the length of wings, but are otherwise indistinguishable, even using DNA barcoding [48,69]. The status of these taxa needs to be examined using detailed experiments.
Several species of Paratettix Bolívar, 1887 [16] have been identified, and all of them are consistently identified using barcodes, but these species are not reconstructed in a single clade in either of the trees. The same is true for Tetrix when taken as a whole, but some well-supported subgroups can be identified. Many Paratettix specimens could not be identified to the species level using the available photographs, so no comment can be made on the true number of species, which are variably grouped using different clustering analyses. The COI gene generally does not carry information about the intrageneric relationships between species. Three undescribed species of Chiriquia Morse, 1900 [70] and a new genus and species from Madagascar were identified using the photographs in the BOLD database and confirmed as separate using barcoding. There are more potential undescribed species, labeled as “unidentified genus” in the analysis, and even more could be hiding in the database, represented only by sequences without further metadata.

5. Conclusions

In conclusion, DNA barcoding is a promising tool for aiding the identification of Tetrigidae, as it has been shown here that the sequences belonging to a given species are confidently delimited from other species. On the other hand, the COI gene does not carry a sufficiently strong phylogenetic signal that would allow for a simple reconstruction of relationships above the specific level. Phylogeny should be attempted with additional genes, including nuclear genes or even entire genomes, but classical morphological studies are necessary as well in order to resolve the taxonomy of Tetrigidae. Reliable methods for identification stemming from these two fields of research are welcome, but they have to be followed by well-populated and well-curated databases. BOLD is a valuable depository of DNA barcodes, but its value for Tetrigidae is very limited at the moment, as its records lack many important data points, and its taxonomy is not being updated. This can be amended with regional projects that can populate the database with well-curated local data.

Author Contributions

Conceptualization, N.K. and J.S.; methodology, N.K. and M.H.; formal analysis, N.K. and M.H.; data curation, N.K. and J.S.; writing—original draft preparation, N.K.; writing—review and editing, N.K., J.S. and M.H.; visualization, N.K. All authors are of equal contribution. All authors have read and agreed to the published version of the manuscript.

Funding

The APC was funded by the voucher provided by the editors. No other funding for the research was received.

Data Availability Statement

All the data used in this study is publicly available in the BOLD Systems database at https://www.boldsystems.org/, accessed on 25 November 2022. The dataset analyzed in this study is available at osf.io/zqjh5, accessed on 25 November 2022.

Acknowledgments

Thanks to Karmela Adžić for help with identifying some of the Malaysian specimens.

Conflicts of Interest

The authors declare no conflict of interest.

Appendix A

Figure A1. Species composition of Tetriginae identified in the BOLD database.
Diversity 15 00696 g0a1
Figure A2. Species composition of Cladonotinae, Batrachideinae, Scelimeninae, and Metrodorinae identified in the BOLD database.
Diversity 15 00696 g0a2

References

  1. Pentinsaari, M.; Salmela, H.; Mutanen, M.; Roslin, T. Molecular evolution of a widely-adopted taxonomic marker (COI) across the animal tree of life. Sci. Rep. 2016, 6, 35275. [Google Scholar] [CrossRef] [PubMed]
  2. Hebert, P.D.; Cywinska, A.; Ball, S.L.; DeWaard, J.R. Biological identifications through DNA barcodes. Proc. R. Soc. B. 2003, 270, 313–321. [Google Scholar] [CrossRef] [PubMed]
  3. DeSalle, R.; Goldstein, P. Review and interpretation of trends in DNA barcoding. Front. Ecol. Evol. 2019, 7, 302. [Google Scholar] [CrossRef]
  4. Ratnasingham, S.; Hebert, P.D.N. BOLD: The barcode of life data system (http://www.barcodinglife.org). Mol. Ecol. Notes 2007, 7, 355–364. [Google Scholar] [CrossRef]
  5. Fernandez-Triana, J.L. Turbo taxonomy approaches: Lessons from the past and recommendations for the future based on the experience with Braconidae (Hymenoptera) parasitoid wasps. ZooKeys 2022, 1087, 199–220. [Google Scholar] [CrossRef]
  6. Paz, A.; Crawford, A.J. Molecular-based rapid inventories of sympatric diversity: A comparison of DNA barcode clustering methods applied to geography-based vs clade-based sampling of amphibians. J. Biosci. 2012, 37, 887–896. [Google Scholar] [CrossRef]
  7. Rossini, B.C.; Oliveira, C.A.M.; Melo, F.A.G.D.; Bertaco, V.D.A.; Astarloa, J.M.D.D.; Rosso, J.J.; Foresti, F.; Oliveira, C. Highlighting Astyanax Species Diversity through DNA Barcoding. PLoS ONE 2016, 11, e0167203. [Google Scholar] [CrossRef]
  8. Sales, N.G.; Mariani, S.; Salvador, G.N.; Pessali, T.C.; Carvalho, D.C. Hidden diversity hampers conservation efforts in a highly impacted Neotropical river system. Front. Genet. 2018, 9, 271. [Google Scholar] [CrossRef]
  9. Puillandre, N.; Brouillet, S.; Achaz, G. ASAP: Assemble species by automatic partitioning. Mol. Ecol. Resour. 2021, 21, 609–620. [Google Scholar] [CrossRef]
  10. Song, H.; Moulton, M.J.; Whiting, M.F. Rampant Nuclear Insertion of mtDNA across Diverse Lineages within Orthoptera (Insecta). PLoS ONE 2014, 9, e110508. [Google Scholar] [CrossRef]
  11. Lehmann, A.W.; Devriese, H.; Tumbrinck, T.; Skejo, J.; Lehmann, G.U.C.; Hochkirch, A. The importance of validated alpha taxonomy for phylogenetic and DNA barcoding studies: A comment on species identification of pygmy grasshoppers (Orthoptera, Tetrigidae). ZooKeys 2017, 679, 139–144. [Google Scholar] [CrossRef] [PubMed]
  12. Nugent, C.M.; Elliott, T.A.; Ratnasingham, S.; Adamowicz, S.J. coil: An R package for cytochrome c oxidase I (COI) DNA barcode data cleaning, translation, and error evaluation. Genome 2020, 63, 291–305. [Google Scholar] [CrossRef] [PubMed]
  13. Nugent, C.M. coil: Contextualization and Evaluation of COI-5P Barcode Data. R Package Version 1.2.3. CRAN. Available online: https://CRAN.R-project.org/package=coil (accessed on 10 November 2022).
  14. Song, H.; Béthoux, O.; Shin, S.; Donath, A.; Letsch, H.; Liu, S.; McKenna, D.D.; Meng, G.; Misof, B.; Podsiadlowski, L.; et al. Phylogenomic analysis sheds light on the evolutionary pathways towards acoustic communication in Orthoptera. Nat. Commun. 2020, 11, 4939. [Google Scholar] [CrossRef]
  15. Cigliano, M.M.; Braun, H.; Eades, D.C.; Otte, D. Orthoptera Species File. Version 5.0/5.0. Available online: http://Orthoptera.SpeciesFile.org (accessed on 12 March 2023).
  16. Bolívar, I. Essai sur les Acridiens de la tribu des Tettigidae. Ann. Soc. Ent. Belg. 1887, 31, 175–313. [Google Scholar]
  17. Tumbrinck, J. Taxonomic revision of the Cladonotinae (Orthoptera: Tetrigidae) from the islands of South-East Asia and from Australia, with general remarks to the classification and morphology of the Tetrigidae and descriptions of new genera and species from New Guinea and New Caledonia. In Biodiversity, Biogeography and Nature Conservation in Wallacea and New Guinea. Vol. II; Telnov, D., Ed.; The Entomological Society of Latvia: Riga, Latvia, 2014; pp. 345–396. [Google Scholar]
  18. Ahnesjö, J.; Forsman, A. Correlated evolution of colour pattern and body size in polymorphic pygmy grasshoppers, Tetrix undulata. J. Evol. Biol. 2003, 16, 1308–1318. [Google Scholar] [CrossRef]
  19. Steenman, A.; Lehmann, A.W.; Lehmann, G.U.C. Life-history trade-off between macroptery and reproduction in the wing-dimorphic pygmy grasshopper Tetrix subulata (Orthoptera Tetrigidae). Ethol. Ecol. Evol. 2015, 27, 93–100. [Google Scholar] [CrossRef]
  20. Zhao, L.; Lin, L.-L.; Zheng, Z.-M. DNA barcoding reveals polymorphism in the pygmy grasshopper Tetrix bolivari (Orthoptera, Tetrigidae). ZooKeys 2016, 582, 111–120. [Google Scholar] [CrossRef]
  21. Tan, M.K.; Tumbrinck, J.; Baroga-Barbecho, J.B.; Yap, S.A. A new species and morphometric analysis of Cladonotella (Tetrigidae: Cladonotinae). J. Orthoptera Res. 2019, 28, 129–135. [Google Scholar] [CrossRef]
  22. Itrac-Bruneau, R.; Doucet, G. Contribution à la connaissance des Tetrigidae (Orthoptera) de Guyane. Zoosystema 2022, 44, 405–421. [Google Scholar] [CrossRef]
  23. Tumbrinck, J. Taxonomic and biogeographic revision of the genus Lamellitettigodes (Orthoptera: Tetrigidae) with description of two new species and additional notes on Lamellitettix, Probolotettix, and Scelimena. J. Orthoptera Res. 2019, 28, 167–180. [Google Scholar] [CrossRef]
  24. Kasalo, N.; Naskrecki, P.; Rebrina, F.; Skejo, J. Central American Tetrigidae Rambur, 1838 (Orthoptera): A preliminary catalogue. Zoosystema 2023, 45, 177–212. [Google Scholar] [CrossRef]
  25. Chen, A.-H.; Jiang, G.-F. Phylogenetic relationships among 12 species of Tetrigidae (Orthoptera: Tetrigoidea) based on partial sequences of 12S and 16S ribosomal RNA. Zool. Res. 2004, 25, 510–514. [Google Scholar]
  26. Chen, Y.-Z.; Deng, W.-A.; Wang, J.-M.; Lin, L.-L.; Zhou, S.-Y. Phylogenetic relationships of Scelimeninae genera (Orthoptera: Tetrigoidea) based on COI, 16S rRNA and 18S rRNA gene sequences. Zootaxa 2018, 4482, 392–400. [Google Scholar] [CrossRef] [PubMed]
  27. R Core Team. R: A Language and Environment for Statistical Computing; R Foundation for Statistical Computing: Vienna, Austria, 2022; Available online: https://www.R-project.org/ (accessed on 11 November 2022).
  28. Firke, S.; Denney, B.; Haid, C.; Knight, R.; Grosser, M.; Zadra, J. janitor: Simple Tools for Examining and Cleaning Dirty Data. R Package Version 2.1.0. Available online: https://CRAN.R-project.org/package=janitor (accessed on 11 November 2022).
  29. Devriese, H. Bijdrage tot systematiek, morfologie en biologie van de West-Palearktische Tetrigidae. Nieuwsbr. Saltabel. 1996, 15, 1–38. [Google Scholar]
  30. Silva, D.S.M.; Cadena-Castaneda, O.J.; Pereira, M.R. Batrachideinae (Orthoptera: Caelifera: Tetrigidae): An overview of the most diverse tetrigids of the Neotropical region. Zootaxa 2021, 4946, 1–84. [Google Scholar] [CrossRef]
  31. Linnaeus, C.N. Systema Naturae per Regna Tria Naturae, 10th ed.; Holmiae, Impensis Direct. Laurentii Salvii: Stockholm, Sweden, 1758; p. 824. [Google Scholar]
  32. Thunberg, C.P. Hemipterorum maxillosorum genera illustrata plurimisque novis speciebus ditata ac descripta. Mém. Acad. Imp. Sci. St.-Pétersbg. Hist. Acad. 1815, 5, 211–301. [Google Scholar]
  33. Hall, T.A. BioEdit: A User-Friendly Biological Sequence Alignment Editor and Analysis Program for Windows 95/98/NT. Nucleic Acids Symp. Ser. 1999, 41, 95–98. [Google Scholar]
  34. Nguyen, L.-T.; Schmidt, H.A.; von Haeseler, A.; Minh, B.Q. IQ-TREE: A fast and effective stochastic algorithm for estimating maximum likelihood phylogenies. Mol. Biol. Evol. 2015, 32, 268–274. [Google Scholar] [CrossRef]
  35. Kalyaanamoorthy, S.; Minh, B.Q.; Wong, T.K.F.; von Haeseler, A.; Jermiin, L.S. ModelFinder: Fast model selection for accurate phylogenetic estimates. Nat. Methods 2017, 14, 587–589. [Google Scholar] [CrossRef]
  36. Hoang, D.T.; Chernomor, O.; von Haeseler, A.; Minh, B.Q.; Vinh, L.S. UFBoot2: Improving the ultrafast bootstrap approximation. Mol. Biol. Evol. 2017, 35, 518–522. [Google Scholar] [CrossRef]
  37. Guindon, S.; Dufayard, J.-F.; Lefort, V.; Anisimova, M.; Hordijk, W.; Gascuel, O. New Algorithms and Methods to Estimate Maximum-Likelihood Phylogenies: Assessing the Performance of PhyML 3.0. Syst. Biol. 2010, 59, 307–321. [Google Scholar] [CrossRef] [PubMed]
  38. Ronquist, F.; Huelsenbeck, J.P. MrBayes 3: Bayesian phylogenetic inference under mixed models. Bioinformatics 2003, 19, 1572–1574. [Google Scholar] [CrossRef] [PubMed]
  39. Rambaut, A. FigTree v1.4.4. 2018. Available online: https://github.com/rambaut/figtree/releases (accessed on 12 March 2023).
  40. Xia, X.; Xie, Z.; Salemi, M.; Chen, L.; Wang, Y. An index of substitution saturation and its application. Mol. Phylogenet. Evol. 2003, 26, 1–7. [Google Scholar] [CrossRef]
  41. Xia, X.; Lemey, P. Assessing substitution saturation with DAMBE. In The Phylogenetic Handbook: A Practical Approach to DNA and Protein Phylogeny, 2nd ed.; Lemey, P., Salemi, M., Vandamme, A.-M., Eds.; Cambridge University Press: Cambridge, UK, 2009; pp. 615–630. [Google Scholar] [CrossRef]
  42. Xia, X. DAMBE7: New and improved tools for data analysis in molecular biology and evolution. Mol. Biol. Evol. 2018, 35, 1550–1552. [Google Scholar] [CrossRef] [PubMed]
  43. Hancock, J.L. Further studies of the Tetriginae (Orthoptera) in the Oxford University Museum. Trans. Ent. Soc. Lond. 1909, 3, 387–426. [Google Scholar] [CrossRef]
  44. Latreille, P.A. Histoire Naturelle, Genérale et Particuliere, des Crustacés et des Insectes; Wentworth Press: London, UK, 1802; Volume 3, 467p. [Google Scholar] [CrossRef]
  45. Janzen, D.H.; Hallwachs, W.; Blandin, P.; Burns, J.M.; Cadiou, J.; Chacón, I.; Dapkey, T.; Deans, A.R.; Epstein, M.E.; Espinoza, B.; et al. Integration of DNA barcoding into an ongoing inventory of complex tropical biodiversity. Mol. Ecol. Resour. 2009, 9, 1–26. [Google Scholar] [CrossRef]
  46. Say, T. American Entomology or Descriptions of the Insects of North America; Augustus Mitchell, Philadelphia Museum: Philadelphia, PA, USA, 1824; Plate V. [Google Scholar]
  47. Rehn, J.A.G. The Stanford expedition to Brazil. 1911, Dermaptera and Orthoptera I. Trans. Am. Entomol. 1916, 42, 215–308. [Google Scholar]
  48. Hawlitschek, O.; Morinière, J.; Lehmann, G.U.C.; Lehmann, A.W.; Kropf, M.; Dunz, A.; Glaw, F.; Detcharoen, M.; Schmidt, S.; Hausmann, A.; et al. DNA barcoding of crickets, katydids and grasshoppers (Orthoptera) from Central Europe with focus on Austria, Germany and Switzerland. Mol. Ecol. Resour. 2017, 17, 1037–1053. [Google Scholar] [CrossRef]
  49. Devriese, H.; Husemann, M. Afrosystolederus garmsi (Orthoptera, Tetrigidae), a new genus and species from Mount Gibi (Liberia) with remarks on Systolederus, Pseudosystolederus and Teredorus. Zootaxa 2023, 5258, 331–341. [Google Scholar] [CrossRef]
  50. Günther, K. Revision der Acrydiinae (Orthoptera), III. Sectio Amorphopi (Metrodorae Bol. 1887, aut.). Abh. Ber. Staatl. Mus. Tierkd. Völkerkunde Dresd. (Ser. A Zool.) (N.F.) 1939, 20, 16–335. [Google Scholar]
  51. Hebard, M. Acrydiinae (Orthoptera, Acrididae) of Southern India. Rev. Suisse Zool. 1930, 36, 565–592. [Google Scholar] [CrossRef]
  52. Regul, J. Sistematika Skakavaca Veslača (Insecta: Orthoptera: Scelimeninae) Temeljena na Morfološkim Svojstvima [Systematics of Pygmy Rowerhoppers (Insecta: Orthoptera: Scelimeninae) Based on Morphological Characters]. Master’s Thesis, University of Zagreb, Faculty of Science, Department of Biology, Zagreb, Croatia, 2022. [Google Scholar]
  53. Remigio, E.A.; Hebert, P.D. Testing the utility of partial COI sequences for phylogenetic estimates of gastropod relationships. Mol. Phylogenet. Evol. 2003, 29, 641–647. [Google Scholar] [CrossRef]
  54. Ros, V.I.; Breeuwer, J.A. Spider mite (Acari: Tetranychidae) mitochondrial COI phylogeny reviewed: Host plant relationships, phylogeography, reproductive parasites and barcoding. Exp. Appl. Acarol. 2007, 42, 239–262. [Google Scholar] [CrossRef] [PubMed]
  55. Macher, J.N.; Wideman, J.G.; Girard, E.B.; Langerak, A.; Duijm, E.; Jompa, J.; Sadekov, A.; Vos, R.; Wissels, R.; Renema, W. First report of mitochondrial COI in foraminifera and implications for DNA barcoding. Sci. Rep. 2021, 11, 22165. [Google Scholar] [CrossRef]
  56. Eberle, J.; Ahrens, D.; Mayer, C.; Niehuis, O.; Misof, B. A plea for standardized nuclear markers in metazoan DNA taxonomy. Trends Ecol. Evol. 2020, 35, 336–345. [Google Scholar] [CrossRef] [PubMed]
  57. Dietz, L.; Eberle, J.; Mayer, C.; Kukowka, S.; Bohacz, C.; Baur, H.; Espeland, M.; Huber, B.A.; Hutter, C.; Mengual, X.; et al. Standardized nuclear markers improve and homogenize species delimitation in Metazoa. Methods Ecol. Evol. 2023, 14, 543–555. [Google Scholar] [CrossRef]
  58. Strimmer, K.; von Haeseler, A.; Salemi, M. Genetic distances and nucleotide substitution models. In The Phylogenetic Handbook: A Practical Approach to Phylogenetic Analysis and Hypothesis Testing; Lemey, P., Salemi, M., Vandamme, A.-M., Eds.; Cambridge University Press: Cambridge, UK, 2009; pp. 111–141. [Google Scholar] [CrossRef]
  59. Sherwood, A.R.; Sauvage, T.; Kurihara, A.; Conklin, K.Y.; Presting, G.G. A comparative analysis of COI, LSU and UPA marker data for the Hawaiian florideophyte Rhodophyta: Implications for DNA barcoding of red algae. Cryptogam. Algol. 2010, 31, 451. [Google Scholar]
  60. Stål, C. Nya Orthoptera. Öfvers. Kongl. Vetensk.-Akad. Förh. 1855, 12, 348–353. [Google Scholar]
  61. Hancock, J.L. Studies of Tetriginae (Acrydinae) from Sarawak Museum, Borneo. Sarawak Mus. J. 1913, 1, 39–54. [Google Scholar]
  62. Storozhenko, S.Y. Review of the pygmy grasshoppers of the tribe Cleostratini (Orthoptera: Tetrigidae). Far East. Entomol. 2016, 326, 1–44. [Google Scholar]
  63. Adžić, K.; Deranja, M.; Franjević, D.; Skejo, J. Are Scelimeninae (Orthoptera: Tetrigidae) monophyletic and why it remains a question? Entomol. News 2020, 129, 128–146. [Google Scholar] [CrossRef]
  64. Scudder, S.H. Materials for a monograph of the North American Orthoptera including a catalogue of the known New England species. Boston J. Nat. Hist. 1862, 7, 409–480. [Google Scholar] [CrossRef]
  65. Krauss, H.A. Tettix Türki nov. spec. (Orthopt.). Entomol. Mon. 1876, 1, 103–104. [Google Scholar]
  66. Bazyluk, W.; Kis, B. Mesotettix (Uvarovitettix) transsylvanicus subgen. n. et sp. n. de Roumanie (Orthoptera, Tetrigidae). Ann. Zool. 1960, 18, 357–363. [Google Scholar]
  67. Saulcy, F.H.C.D. Notice sur le genre Tetrix, Latr. Bull. Soc. Entomol. Fr. 1888, 6, 135–136. [Google Scholar]
  68. Barneville, L. Brisout de Catalogue des Acrididés qui se trouvent aux environs de Paris. Ann. Soc. Entomol. Fr. 1848, 6, 411–445. [Google Scholar]
  69. Moser, V.; Baur, H.; Lehmann, A.W.; Lehmann, G.U.C. Two species?—Limits of the species concepts in the pygmy grasshoppers of the Tetrix bipunctata complex (Orthoptera, Tetrigidae). ZooKeys 2021, 1043, 33–59. [Google Scholar] [CrossRef]
  70. Morse, A.P. The Acrididae. Subfamily Tettiginae. In Biologia Centrali-Americana. Insecta. Orthoptera; Bruner, L., Morse, A.P., Shelford, R., Eds.; Taylor & Francis: London, UK, 1900; Volume 2, pp. 3–19. [Google Scholar]
Figure 1. Taxonomic composition of Tetrigidae records in the BOLD database. Counts of subfamilies and genera per subfamily are shown. A total of 5 subfamilies and 32 genera are represented.
Diversity 15 00696 g001
Figure 2. Taxonomic composition of Tetrigidae records in the BOLD database based on updated taxonomy. Counts of subfamilies and genera per subfamily are shown according to the currently valid taxonomy. A total of 4 subfamilies and 32 genera are represented, with some genera unassigned to a subfamily.
Diversity 15 00696 g002
Figure 3. Identification methods used for the generation of entries in the BOLD database. Represented are counts of each identification method used and counts per subfamily.
Diversity 15 00696 g003
Figure 4. Records of Tetrigidae subfamilies per geographical area in the BOLD database.
Diversity 15 00696 g004
Figure 5. Records that are accompanied by a photo showing the specimen, counted per subfamily and genus.
Diversity 15 00696 g005
Figure 6. Maximum likelihood tree of 183 COI sequences obtained from BOLD with 10,000 bootstrap replicates. To the right of each node, the SH-aLRT (first number) and bootstrap (second number) values are shown. Each sequence is identified by the species name, country, and BOLD Process ID. Taxa are colored according to the subfamily they belong to; unassigned taxa and outgroups are colored black. Branch lengths represent substitutions per site.
Diversity 15 00696 g006
Figure 7. Bayesian consensus tree of 183 COI sequences obtained from BOLD. To the right of each node, the posterior probability values are shown as percentages. Each sequence is identified by the species name, country, and BOLD Process ID. Taxa are colored according to the subfamily they belong to; unassigned taxa and outgroups are colored black. Branch lengths represent substitutions per site.
Diversity 15 00696 g007
Disclaimer/Publisher’s Note: The statements, opinions and data contained in all publications are solely those of the individual author(s) and contributor(s) and not of MDPI and/or the editor(s). MDPI and/or the editor(s) disclaim responsibility for any injury to people or property resulting from any ideas, methods, instructions or products referred to in the content.

