Article

Genetic Structure and Selection Signature in Flora Scent of Roses by Whole Genome Re-Sequencing

1
Xinjiang Academy of Agricultural Science (XAAS), Urumqi 830091, China
2
College of Ecology and Environment, Xinjiang University, Urumqi 830046, China
*
Authors to whom correspondence should be addressed.
Diversity 2023, 15(6), 701; https://doi.org/10.3390/d15060701
Submission received: 23 March 2023 / Revised: 18 May 2023 / Accepted: 22 May 2023 / Published: 24 May 2023
(This article belongs to the Section Phylogeny and Evolution)

Abstract

:
Roses are important plants, and they are cultivated worldwide for their beautiful flowers, remarkable scent, and nutritious hips. In this study, we re-sequenced the whole genomes of 57 rose cultivars and one wild species that originated from different regions around the world and had different scents, aiming to evaluate their genetic structure and to detect the potential signature of the selective sweep between different scent groups with single-nucleotide polymorphism (SNP) and indel markers. The roses were sequenced at an average depth of 6× to the reference genome of Rosa ‘Old blush’. A total of 2,375,949 SNPs were obtained. The SNP numbers varied among the 58 samples, with an average of 1,271,906 per sample. The phylogeny and population structure revealed that the roses could be divided into three main clusters; however, the groups were not consistent in terms of geographic origin or scent classification. These indicated that rose cultivars have a complex genetic background due to the extensive hybridization between cultivated roses or wild rosa species worldwide. A selective sweep analysis was conducted to detect the selection signatures in rose scent traits. A total of 2430 candidate genes were identified in the strong scent groups, and were at the top 5% FST compared to the moderate group. These genes were significantly enriched in the KEGG pathways of tyrosine metabolism, cyanoamino acid metabolism, alpha-linolenic acid metabolism (13 genes), and phenylpropanoid biosynthesis (30 genes). When the low-scent group was used as the control, 2604 candidate genes were identified at the top 5% FST that were significantly enriched in the KEGG pathways of alpha-linolenic acid metabolism (15 genes), and glutathione metabolism (23 genes). We also observed genes enriched in pathways including the linoleic acid metabolism (five genes), diterpenoid biosynthesis (six genes), and monoterpenoid biosynthesis (seven genes), although they were not significant. These implied a positive selection of rose cultivars with a strong fragrance in terms of fatty acid derivatives, terpenoids and benzenoids/phenylpropanoids during rose breeding. Our study establishes a foundation for the further large-scale characterization of rose germplasm, improving the genetic knowledge of the background of roses.

1. Introduction

Roses are among the most commonly cultivated plants worldwide due to their beautiful flowers, remarkable scent [1,2], and economic importance both as ornamental plants and in their use in the perfume industry, which has motivated rose domestication and breeding. During their long cultivation and breeding history in Europe and Asia [3,4], roses underwent several interspecific hybridizations, introgressions and polyploidizations [5,6], leading to a huge amount of cultivars, with >24,000 available varieties (listed in Roberts et al. [7]). The cultivated rose ancestors derived from 7–10 species from the sections Synstylae (R. moschata, R. wichurana, and R. multiflora), Rosa (R. gallica), Indicae (R. chinensis and R. gigantea), and Pimpinellifoliae (R. foetida) [8,9].
Asian roses were introduced to Europe and progressively used in breeding. Rosa rugosa and the Chinese rose (R. chinensis) were introduced to Europe at the end of the 18th century [2,6,10]. Rosa rugosa is an important plant in the production of perfumes and a valuable germplasm for breeding cultivated roses. The extensive hybridization between this species and native rose species, such as R. blanda and dogroses [11,12], resulted in the emergence of the Hybrid Tea roses (such as Rosa gallica, Rosa damascena, R. chinensis ‘Old Blush’, and R. chinensis ‘Hume’s Blush’) from which most modern roses are derived [1,8]. These complicated breeding and hybridization processes have led to the genetic complexity of roses.
Molecular markers, such as RAPD, AFLP, and SSR have been used to characterize the genetic diversity, genetic differentiation, biogeographic pattern, and the conservation of specific groups of roses (from a single or a few species or cultivars to multiple genotypes) from a specific geographic region, such as Rosa rugosa [13,14], R. damascena [15,16], and R. canina [17]. Rusanov et al. [18] assessed the genetic relationships between 26 R. damascena accessions and 13 garden Damask roses, demonstrating that R. damascena accessions from Bulgaria, Iran, and India, in addition to old European damask rose varieties, possess identical microsatellite profiles and originate from a common ancestor. However, Gaurav et al. [19] found significant genetic diversity among exotic R. damascene accessions and damask rose cultivars. Feng et al. [20] evaluated the genetic diversity and relationships between wild R. rugosa and cultivars, showing that wild accessions and cultivars have a remote genetic relationship, while the main Chinese R. rugosa cultivars have few genetic differences and a narrow genetic background. In contrast, Panwar et al. [21] suggested that the cultivated rose varieties in India display a high level of genetic variability. These indicated genetic diversities vary according to geographic origin or sampling size.
The genetic diversity or genetic relationships between cultivars and wild species have been examined using a wide range of samples. Tan et al. [22] estimated the genetic diversity and genetic differentiation in old Chinese garden roses using SSR markers, suggesting that rose cultivars evolved from the Old Blush Group to the Odorata group, the Ancient Hybrid China group and the modern rose. Aparna et al. [23] investigated the genetic diversity of 25 fragrant rose cultivars of exotic and Indian origin, with SSR markers showing that cultivars of Indian origin showed a higher diversity compared to the selected cultivars of American and European origin. Scariot et al. [24] studied the genetic relationships of 65 old garden roses based on a microsatellite analysis, which suggested that all the genotypes could be clustered into seven major clusters that were substantially consistent with their classification into botanical sections and horticultural groups. Liorzou et al. [2] obtained a broader view of the evolution of the diversity of roses bred in France during the 19th century by assessing a larger sampling size of up to 1228 accessions. Genetic differentiation was detected between ancient European and Asian accessions, and a temporal shift from a European to an Asian genetic background in cultivated European hybrids during the 19th century was induced by frequent crosses with Asian roses throughout the 19th century and/or the selection for Asiatic traits.
In recent years, along with the development of next-generation sequencing, single-nucleotide polymorphism (SNP) has become an important tool for the genotyping of cultivars and genome-wide association studies. Xia et al. [25] developed high-density SNP markers for rose with 158 Rosa chinensis individuals using SLAF-seq. The whole-genome resequencing (WGRS) technique can generate a larger amount of SNP data in a very cost-effective manner [26], which can help to better understand the genetic diversity, structure, and genetic basis of plant traits and variations [27,28]. In this study, we present analyses of the whole genome re-sequencing of 57 rose cultivars and one wild rosa species, aiming to evaluate the genetic structure and the relationships between them, and detected the potential signature of selective sweep between different scent groups with a single-nucleotide polymorphism (SNP) and indel markers. The developed SNPs will be useful for genome-wide association studies and in mapping the genes associated with valuable rose traits.

2. Materials and Methods

2.1. Plant Materials

A total of 57 rose cultivars and one wild species, R. laxa, were collected. The roses were planted at the Institute of the Xinjiang Academy of Agricultural Sciences. They were divided into the following five groups based on their geographic origin: two from Western Asia, eight from North America, 25 from Europe, one from Australia, 18 from China, and four of unknown origin (Table S1). The leaf tissues were collected in April 2022 and dried in silica gel.

2.2. DNA Extraction and Quantification

Genomic DNA from young leaves was extracted using the CTAB method. The concentration and quality of the total genomic DNA were determined using a NanoDrop2000 spectrophotometer (Thermofisher Scientific, Waltham, MA, USA) and then normalized to 10 ng/µL for sequencing.

2.3. Library Construction and Whole Genome Re-Sequencing

DNA was fragmented with a Bioruptor (ThermoFisher Scientific, Waltham, MA, USA) that was used to generate an approximately 350 bp library insert size. The quantity and quality controls of the libraries were carried out with Qubit dsDNA HS Assay kit (ThermoFisher Scientific) and the Agilent 2100 Bioanalyzer System (Agilent Technologies, Santa Clara, CA, USA), respectively. Qualified libraries were sequenced on an Illumina HiSeq platform by a commercial service (Biomarker Technologies, Beijing, China).

2.4. Read Mapping, SNP Calling and Annotation

The raw sequencing data were filtered for adapter contamination and low-quality reads (pair-end reads with N > 10%, and low-quality bases (Phred-like score < 20) higher than 50%); duplicates were obtained using Trimmomatic and SOAP2. This filtered the high-quality ‘final rawdata’. The high-quality paired-end sequencing reads (150 bp) from each cultivar were mapped to the Rosa chinensis variety ‘Old Blush’ [6] reference genome using BWA v0.7.12 (University of Hong Kong, Hong Kong, China). The GATK genome analysis toolkit version 4.1.4.1 (Broad Institute, Cambridge, MA, USA) [29] was used to determine SNPs and indels across all roses using HaplotypeCaller, with the following parameters: QD < 2.0 || MQ < 40.0 || FS > 60.0 || QUAL < 30.0 || MQrankSum < −12.5 || ReadPosRankSum < −8.0 -clusterSize 2 -clusterWindowSize. The SNPs identified by GATK were further filtered based on the criteria of minor allele frequency (MAF: 0.05) and data integrity on site (INT: 0.8) to obtain high-quality SNPs for subsequent analysis. SNP annotation was performed on the basis of the reference genome using snpEff software [30], and the SNPs were categorized into intergenic regions, upstream or downstream regions, and exons or introns. SNPs in coding exons were further classified as synonymous SNPs or nonsynonymous SNPs. The indels in exons were grouped according to whether they led to a frameshift or not.

2.5. Genetic Diversity Estimation

The observed nucleotide diversity or average pairwise divergence (π) and fixation index (Fst) were calculated using vcftools based on the high-confident filtered SNPs. Various measures of genetic diversity, including observed heterozygosity (Ho), polymorphism information content (PIC), and the Shannon index were calculated for the rose groups using the GenoDive program [31] and the ‘GeneticSubsetter’ package [32].

2.6. Population Structure

High-confidence SNPs were used to infer the population structure within rose accessions using ADMIXTURE [33], with K values (the putative number of populations) ranging from 1 to 10. We assessed the number of sub-populations using five-fold cross-validation. A neighbor-joining phylogenetic tree of the rose cultivars was constructed using MEGAX 7.0.14 based on the Nei’s distance, and bootstrapping was repeated 1000 times.

2.7. Screening for Selection Signatures Related to Flora Scent

To uncover the genetic variants involved in the selection of rose scent traits in strong-scent cultivars, we calculated the genome-wide distribution of FST values, including the strong- vs. moderate- and low-scent groups. The FST for sliding windows was calculated using VCFtools [34], with a window size of 100 kb and a step size of 10 kb. The windows with the top 5% of values for the FST simultaneously served as the candidate outliers under strong selective sweeps. All outlier windows were assigned to their corresponding SNPs and genes. The selected genes enriched in Gene Ontology (GO) terms and Kyoto Encyclopedia of Genes and Genomes (KEGG) pathways were determined using BLAST against NR, SwissProt, GO, COG, and KEGG. Multiple comparisons were corrected using the false discovery rate (FDR corrected p < 0.05).

3. Results and Discussion

3.1. Sequencing Statistics and Variation in the Rose Genome

A total of 370.81 Gbp of high-quality clean data (Q30 > 94.27%) was obtained from the genome resequencing of the 58 rose accessions, with an average depth of 6.2× (Table S2). A total of 2,375,949 highly consistent SNPs were identified after the use of the SNP filter. The SNP numbers varied among the 57 cultivars, from 890,350 in ‘Yueyuehong’ to 1,557,369 in ‘Grasse Rose’ (Table S3); on average, the SNP in each accession was 1,271,906.
Most of the nucleotide changes can be classified as transitions (799,196), with a transition/transversion ratio (Ts/Tv ratio) of 1.685 (ranging from 1.59 in R. rugosa ‘Fenghua’ to 1.74 in Rosa ‘Pink O’Hara’) (Table S3, Figure S1). This value is slightly higher than that reported in sweet cherry (1.4675) [28]. The heterozygosity varied in the 58 rose accessions, from 18.30% in R. laxa to 96.5% in R. ‘Yueyuehong’, with a mean value of 57.45% (Table S3). The heterozygosity ratios for the cultivar ‘Fenghua’, R. rugosa ‘Pingyin 1’, R. ‘Lavender bouquet’, R. ‘Chariot’, Rosa sertata × rugosa, and R. rugosa ‘Zizhi’ were 19.57%, 21.52%, 26.58%, 28.84%, 28.03% and 31.84%, respectively, indicating a large difference from the reference genome of ‘Old blush’, whereas the heterozygosity of ‘Yueyuehong’ was 96.5%, implying that the genome of this cultivar was highly consistent with the reference genome.
On average, 23.05% (13.98–36.45%) of the total number of SNPs were located in intergenic regions, 13.85% (9.62–20.9%) in intron, 19.5% in upstream, 16.15% in downstream, and 14.1% (9.56–22.26%) in coding regions (Table 1, Table S4). In line with previous studies, the majority of SNPs were located in non-coding regions. Only a small proportion of the SNPs were observed in the coding region, which is in line with other species [35]. The SNPs found in CDS were slightly higher in roses than in sweet cherry [28] and peach [36].
The SNPs in genic regions include 103,931 synonymous (from 69,364 in ‘Yueyuehong’ to 145,427 in ‘Grasse Rose’), and 83,589 non-synonymous substitutions (from 55,876 in ‘Yueyuehong’ to 115,496 in ‘Grasse Rose’) (Table S4). The non-synonymous-to-synonymous substitution ratio (dN/dS) for the SNPs in the coding regions ranged from 0.766 in ‘Fenghua’ to 0.826 in ‘Chariot’, with an average of 0.806. This is lower than the values reported in other crops or species, such as peach (1.0636) [36], grapevine (1.1732) [37], pigeon pea (1.1835) [38], tomato (1.2334) [35], Chinese plum (1.3037) [39], and sweet cherry (1.78) [28].
Regarding indels, a total of 2,925,938 small insertions or deletions (indels) were identified, of which 1,320,614 were insertions and 1,605,324 were deletions. The indel number also varied in different cultivars, ranging from 312,153 in ‘Yueyuehong’ to 556,043 in ‘Grasse Rose’, with a mean of 444,622 (Table S5). This is lower than the small indels detected from nine Rosa species (between 876,648 and 2,430,123, with an average of 346,498) [6], which indicated that the cultivated roses have a lower genetic diversity than the wild species, and showed a close genetic background between rugosa and modern roses, as demonstrated by the high synteny between R. rugosa and R. chinensis [10].
The size of insertions ranged from 1–~200 nucleotides, and deletions were in the range of 1–~300 nucleotides in length (Figure S2). However, most of the insertions and deletions were of a single nucleotide. Di-, tri-, and quadri-nucleotide insertions and deletions accounted for a relatively low percentage of the total indels (Figure S2). In accordance with SNP, the vast majority of the indels were also located upstream or downstream of genes and in the intergenic regions. Only a small proportion (4.59%, 134,209) were located within CDS, of which 59,973 were insertions and 74,236 were deletions (Table 1, Table S6). The indels detected in CDS also varied in each cultivar. The lowest number of insertions in CDS was found in ‘Yueyuehong’ (4827), and the highest was found in ‘Grasse Rose’ (10,209), with a mean of 7398, while the deletions ranged from 6529 to 12,484, with a mean of 9549 (Table S6).
We further analyzed the distribution of large-effect SNPs, genes with non-synonymous SNP and indel, which may potentially disable gene functions. From 22,892 to 30,026 genes with non-synonymous SNP and 9210 to 15,993 genes with indel were found (Table S7). The lowest were found in the ‘Yueyuehong’ and the highest in were found in the ‘Grasse Rose’.

3.2. Genetic Relationships Based on SNP Data

Based on 2,375,949 high-quality SNPs, the pairwise genetic distance was determined, and a phylogenetic tree of rose accessions was conducted. The phylogenetic tree was divided into three general clades (Figure 1). Clades I and II contained five and nine rose accessions each. Clade III consisted of the remaining 44 cultivars, in which three subclades (S1–S3) were identified. Subclade 1 (S1) comprised two cultivars (‘Blue ribbon’ and ‘Binquanzhilian’); Subclade 2 (S2) mainly consisted of rugosa roses, including ‘Zizhi’, ‘Pingying 1’, ‘Fenghua’, ‘Hetianshamomeigui’, and ‘Grasse rose’. Furthermore, the ‘Damask’, ‘Tineke’, and two new cultivars, R. laxa × hybrida cv. Tianshan Xiaguang and cv. Tianshan Xiangyun, were included in this subclade. Subclade 3 (S3) was the largest clade, consisting of the remaining 29 cultivars. The cultivars from five geographic sites or those with different scents were mixed, suggesting that the genetic relationships between rose cultivars are complex due to the high number of species of various ploidy levels, the worldwide exchanges of roses for breeding activities, and the high level of interspecific hybridization [2].

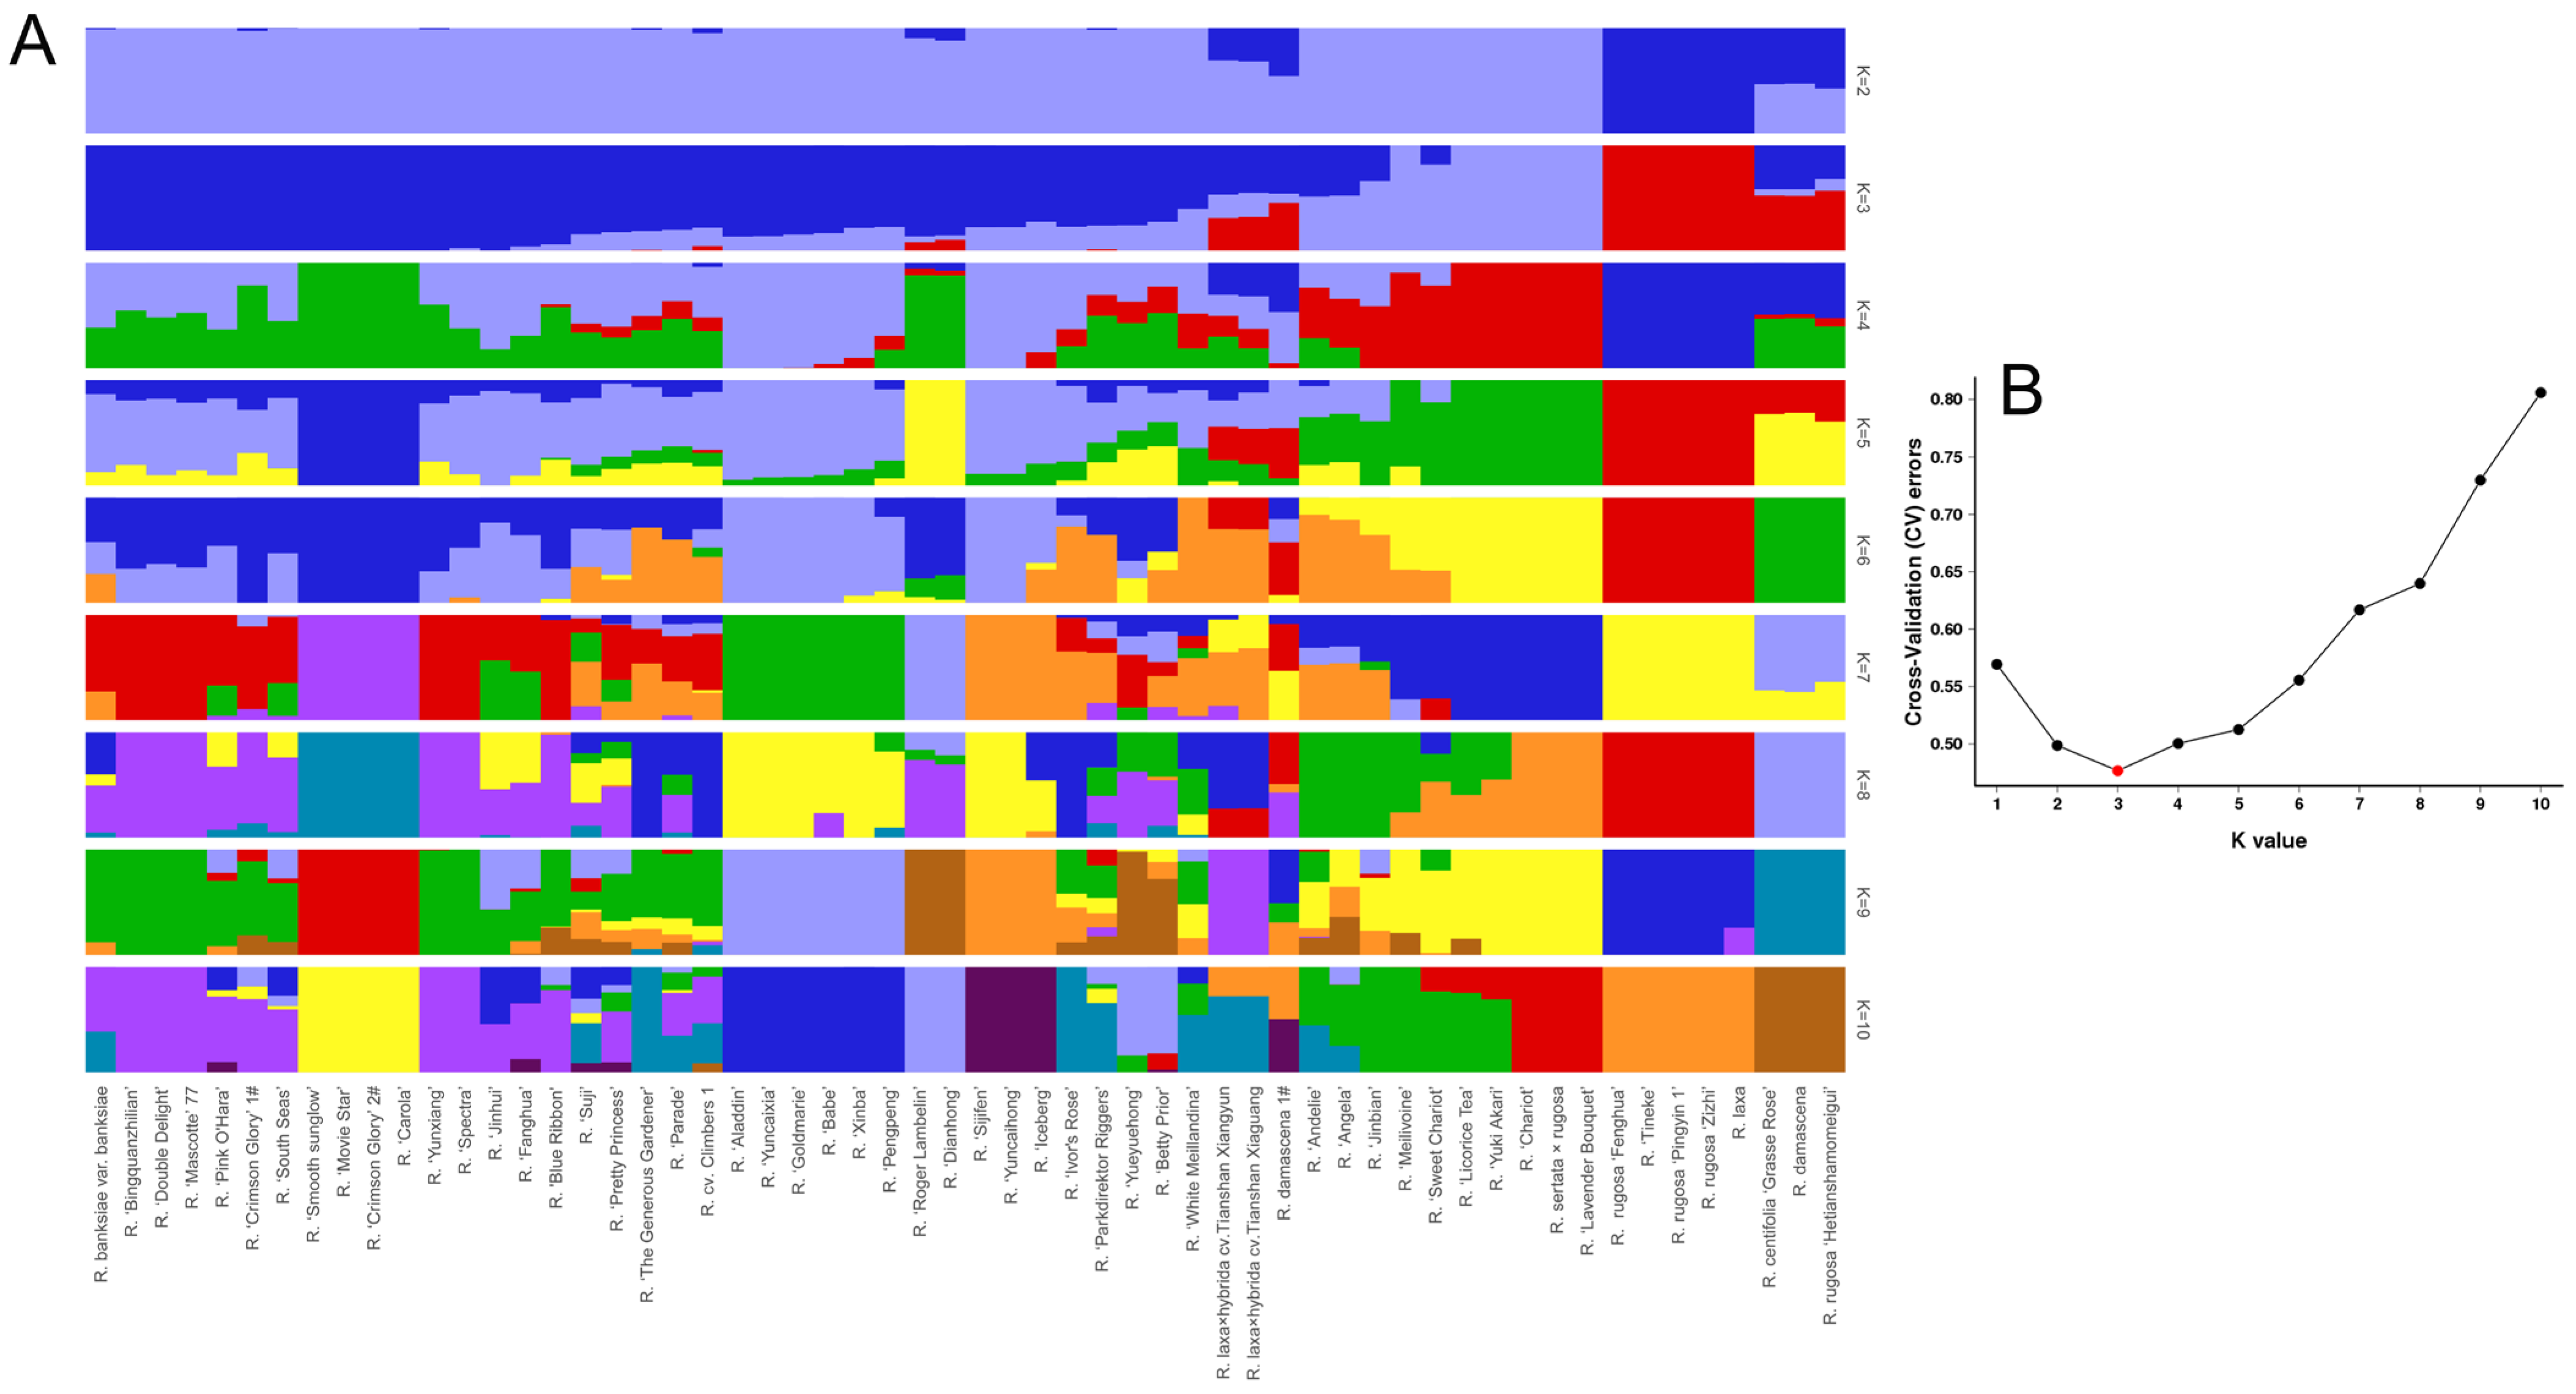
3.3. Population Structure of Roses

A population structure analysis conducted using the Admixture program and SNP data revealed that the 58 accessions could be divided into three groups according to the cross-validation error rate (Figure 2). Of the three groups, Group 1 included the most germplasm, with 39 cultivars. Group 2 comprised 10 cultivars, such as ‘Sweet Chariot’, ‘Meilivoine’, ‘Licorice Tea’, ‘Lavender Bouquet’, ‘Chariot’, ‘Yuki Akari’, and Rosa sertata × rugosa. Group 3 contained eight cultivars, mainly rugosa roses, ‘Fenghua’, ‘Zizhi’, ‘Pingyin 1’, ‘Hetianshamomeigui’, ‘Grasse Rose’, and R. damascena, suggesting a closer relationship among these cultivars, which is in agreement with the phylogenetic tree. Notably, ‘Hetianshamomeigui’, ‘Grasse Rose’, R. laxa × hybrida cv. Tianshan Xiaguang, R. laxa × hybrida cv. Tianshan Xiangyun, ‘Andelie’, and ‘Angela’ showed a mixed genetic background.
The K = 4–10 sub-optimal models were also informative; when K = 4, a fourth cluster composed of ‘Fenghua’, ‘Zizhi’, ‘Pingying 1’, and ‘Tineke’ split from cluster 3. Even when K = 10, these four species still clustered together; this is congruent with the results of the phylogenetic tree (Figure 1), indicating that a closer genetic relationship exists between these cultivars. When K = 7, ‘Heitanshamomeigui’, ‘Grasse Rose’, and Damask clustered together into a different group and another cluster, including Rosa sertata × rugosa, ‘Chariot’, ‘Lavender Bouquet’. The close relationship between ‘Heitanshamomeigui’, ‘Grasse Rose’, and Damask was also suggested by previous works [40]. When K = 9, R. laxa × hybrida cv. Tianshan Xiaguang and cv. Tianshan Xiangyun formed a separate group; these two cold-tolerant cultivars (standing up to −30 °C) were recently developed from hybridization with the garden rose species ‘Fenheping’ and ‘Hongmaozi’ and the cold-tolerant wild species R. laxa [41]. These two cultivars can grow 3 m high and contain 1000 flowers in a single individual of 3 years old [42]. These subgroups were also supported by the NJ phylogenetic tree. Consistent with the phylogenetic relationships, rugosa roses were admixed with other cultivars. Rosa rugosa was introduced to Europe at the end of the 18th century and participated in the breeding of cultivated roses in Europe by the extensive hybridization with native rose species [2,6,10]. Previous research has found that the frequent crosses with Asian roses throughout the 19th century and/or the selection for Asiatic traits may have induced a temporal shift from a European to an Asian genetic background in cultivated European hybrids during the 19th century [2].

3.4. Genetic Diversity

The genetic diversity of the three scent groups was calculated with SNP data. The diversity indexes were generally identical. The PIC of the three groups was around 0.21, and the Shannon index was about 0.4 (Table 2), which is mostly in agreement with the estimations for the 21 cultivated and wild roses according to the SSR markers (average PIC of 0.365) [19].

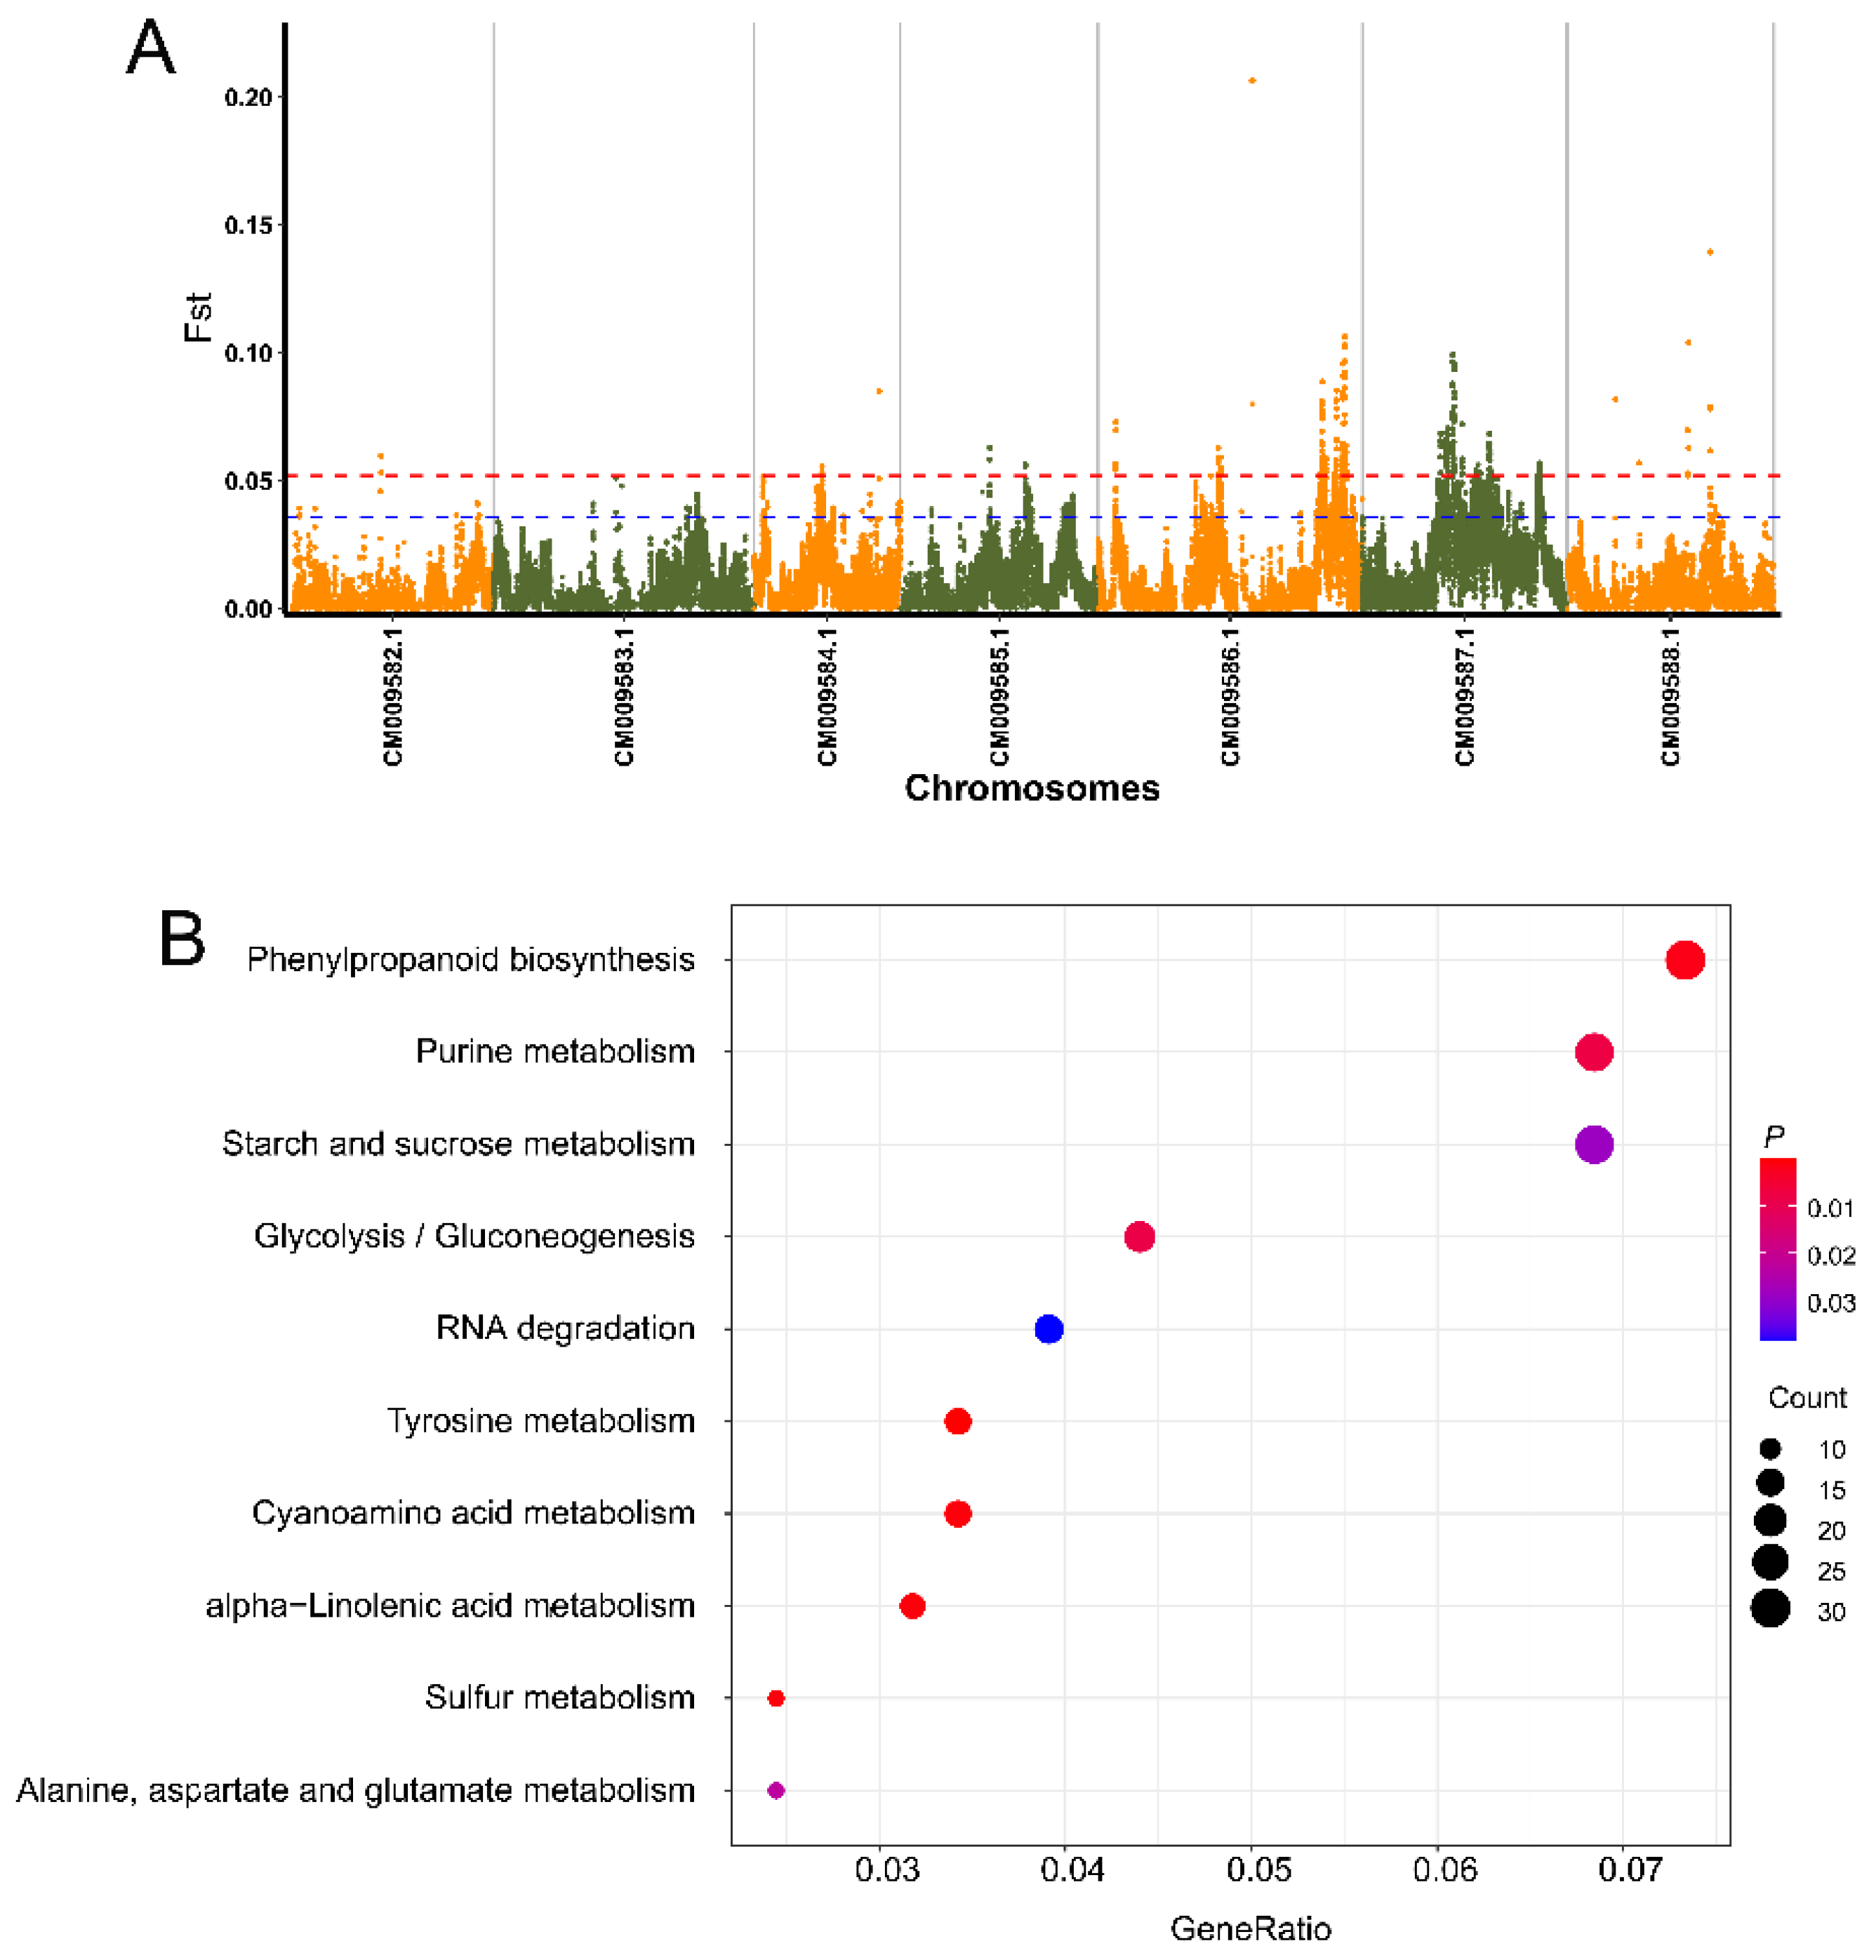
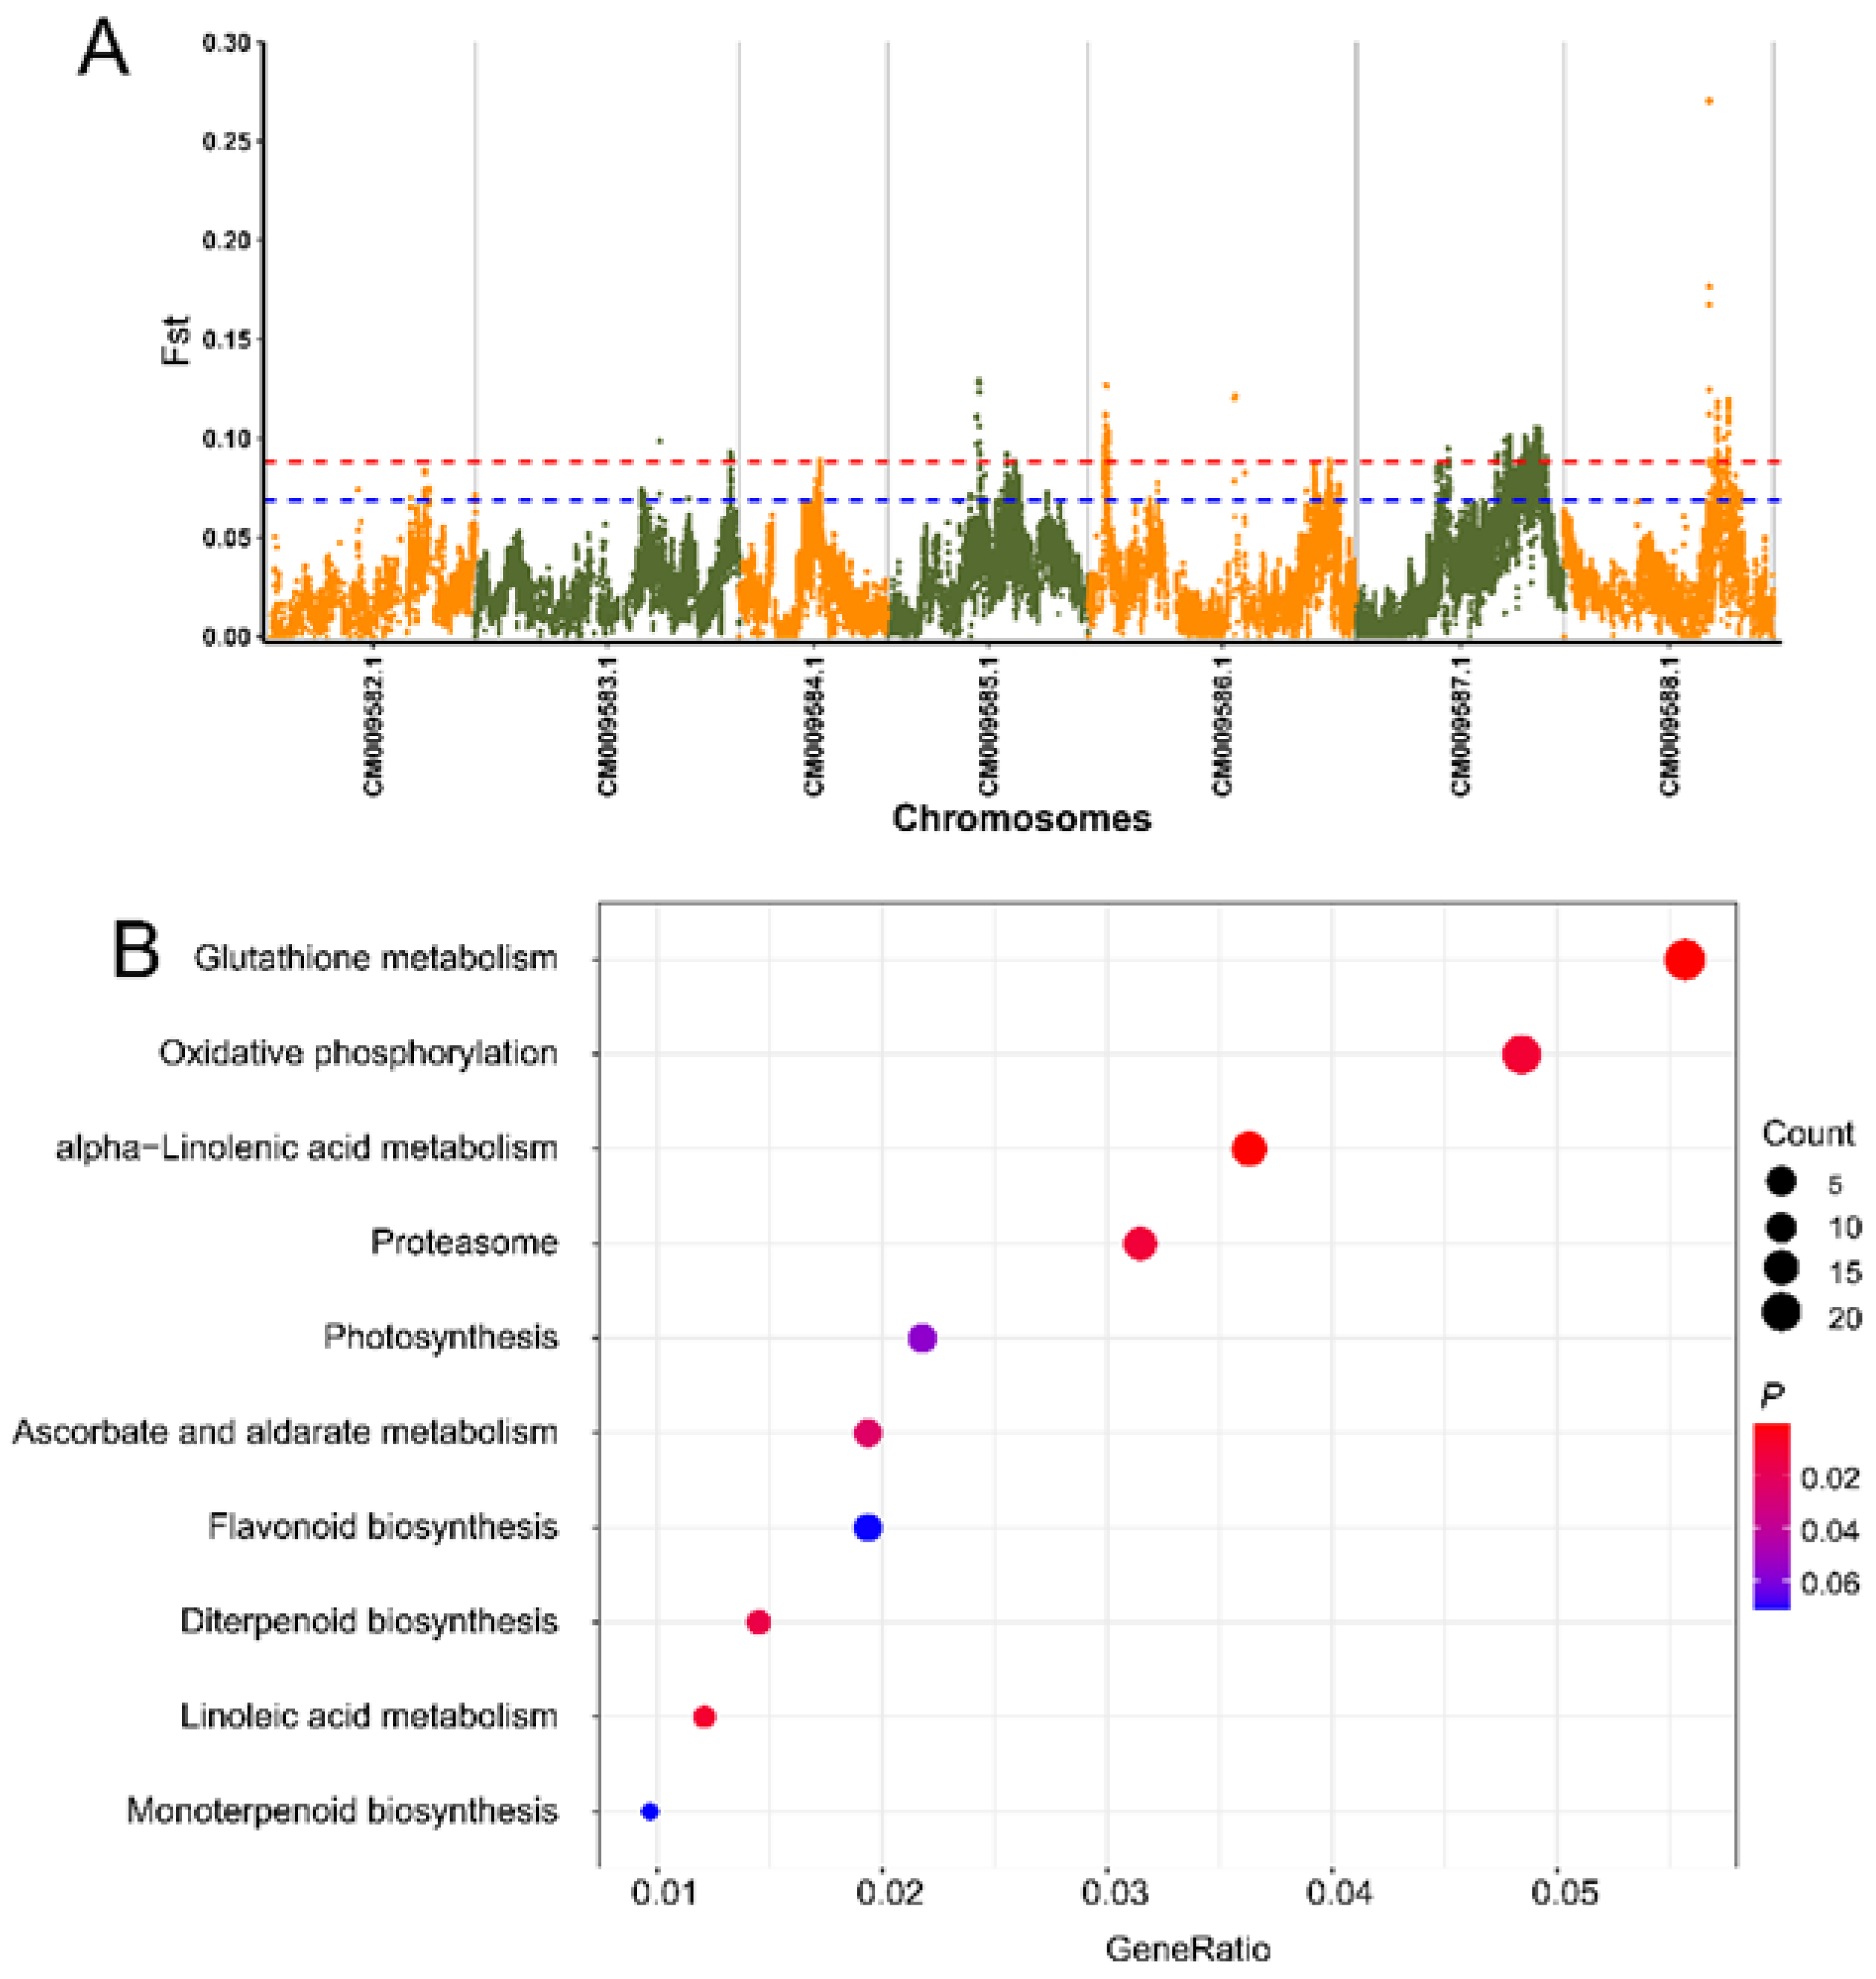
3.5. Genome-Wide Detection of Selective Candidate Loci and Genes Associated with Flower Scent

The fragrance of roses is one of their most economically valuable characteristics. The main sources of floral fragrances primarily consist of terpenes, aromatic compounds, and fatty acid derivatives [43]. We performed a selective sweep analysis and detected potential signals in rose scent selection with high-confidence-level SNPs through a calculation of the Fst values of the two pairwise groups (strong scent/moderate scent, strong scent/low scent). Genomic loci with the top 5% of maximum FST values in each group were identified as selective sweeps in the genome.
Compared to the moderate group, a total of 2430 candidate genes in 141 windows were recognized as potentially affected genes related to the flora scent in the strong scent groups at the top 5% of maximum Fst values (Figure 3A, Table S8). The candidate genes were significantly enriched in KEGG pathways, i.e., tyrosine metabolism (ko00350, FDR-adjusted p = 0.003), cyanoamino acid metabolism (ko00460, FDR-adjusted p = 0.02), alpha-linolenic acid metabolism (ko00592, FDR-adjusted p = 0.02, 13 genes), sulfur metabolism (ko00920, FDR-adjusted p = 0.02), and phenylpropanoid biosynthesis (ko00940, FDR-adjusted p = 0.03, 30 genes) (Figure 3B; Table S9). Although terpenoid backbone biosynthesis (ko00900, p = 0.05, FDR-adjusted p = 0.33, 9 genes) was not significantly enriched, nine genes were in the top 5% with regard to Fst values. The 30 genes enriched in phenylpropanoid biosynthesis were mainly located on chromosome CM009586.1 (20 genes), followed by CM009585.1 (six genes) and CM009587.1 (three genes). The 13 genes enriched in the alpha-linolenic acid metabolism were mainly located on CM009587.1 (11 genes) and CM009586.1 (two genes). Of the nine genes enriched in the terpenoid backbone biosynthesis pathway, seven genes were located on CM009584.1 and CM009586.1.
In addition, a total of 461 candidate genes were identified in 43 windows in the strong-scent groups using the top 1% of maximum Fst values (Table S10). These genes were significantly enriched in KEGG pathways; for instance, pyrimidine metabolism (ko00240, FDR-adjusted p = 0.04, 7 genes), monoterpenoid biosynthesis (ko00902, FDR-adjusted p = 0.04, 3 genes), linoleic acid metabolism (ko00591 p = 0.02, 2 genes), and carotenoid biosynthesis (ko00906, p = 0.07, 2 genes) (Figure S3, Table S11).
When the low-scent group was used as a control, 2604 candidate genes in 96 windows were identified at the top 5% of maximum FST values (Figure 4A, Table S12). The 2604 candidate genes at the top 5% maximum FST were significantly enriched in KEGG pathways, i.e., alpha-linolenic acid metabolism (ko00592, FDR-adjusted p = 0.005, 15 genes), glutathione metabolism (ko00480, FDR-adjusted p = 0.005, 23 genes). In addition, some pathways were also not significantly enriched in genes included in the top 5% Fst sliding windows, including the linoleic acid metabolism (ko00591, p = 0.009, five genes), diterpenoid biosynthesis (ko00904, p = 0.02, six genes), and monoterpenoid biosynthesis (ko00902, p = 0.07, seven genes) (Figure 4B, Table S13). These functional clusters are biologically relevant to floral volatile traits (aromatic flavor) in strong-scent roses.
A total of 794 candidate genes in 47 windows were identified as being in the top 1% of maximum FST values (Table S14). The alpha-linolenic acid metabolism pathway were significantly enriched in genes (seven genes) identified in the top 1% of Fst sliding windows (Figure S4, Table S15).
The strong-scent roses included 17 cultivars (Table S1), most of which originated from Europe (‘Roger Lambelin’, ‘Andelie’, ‘Angela’, ‘Iceberg’, ‘Crimson Glory’, and ‘Tineke’) and China (‘Bingquanzhilian’, ‘Dianhong’, ‘Hetianshamomeigui’, ‘Pingyin 1’, and ‘Zizhi’). Roses from Europe and China are distinct in their flora fragrance characteristics: the major scent components of European roses include 2-phenylethanol and monoterpenes [44], whereas Chinese roses (i.e., R. chinensis var. spontanea) contain high amounts of phenolic methyl ethers (PME), such as 3,5-dimethoxytoluene (DMT) or 1,3,5-trimethoxybenzene (TMB) [44,45]. The biosynthesis of DMT and TMB in Chinese rose species and in many modern varieties are orcinol O-methyltransferases (OOMT) [46]. Although PME biosynthesis was originally restricted to Chinese roses, DMT is a major scent compound of many rose varieties at present, representing up to 90% of total flower volatiles in Tea and Hybrid Tea roses [44,45]. Accordingly, we observed that the OOMT was absent from the candidate region.
Nudix hydrolase (NUDX) hydrolyses a wide range of organic pyrophosphates, and it participates in the biosynthesis of geraniol [1]. The overexpression of a R. rugosa NUDX gene enhances the biosynthesis of scent volatiles in petunia [47]. We also found that NUDX (gene32956) was located in regions with putative selective sweeps (Tables S8 and S12). Terpenes are major scent compounds in roses, and its biosynthesis involves terpene synthase (TPS) proteins [48]. Germacrene D synthase (GDS) encodes the enzyme catalyzing germacrene D synthesis [1]. TPS (gene40968, gene40975, gene48373) (Table S12) and GDS (gene24868, gene48373) (Tables S8 and S12) were also detected in the 5% Fst region. These results indicate that chromosomal regions or genes related to the floral scent might be under selection in strong scent roses.
The VOCs are diverse across rose varieties or species [49]. Monoterpenes represent up to 70% of the scent content in some cultivars, such as the Papa Meilland rose [50]. The main volatile component of R. chinensis var. spontanea is TMB [44]. Citronellol, geraniol, nerol and their acetates, and linalool are the main components of the characteristic fragrance of R. rugosa [51]. The variation in the volatiles of rose flowers of a different geographic origin or species might explain the inconsistency of the candidate genes and enrichment pathways in the two paired groups. We generally observed that some candidate genes were enriched in the alpha-linolenic acid metabolism, the cyanoamino acid metabolism, the terpenoid backbone biosynthesis, the diterpenoid biosynthesis, the monoterpenoid biosynthesis, and the phenylpropanoid biosynthesis pathways in the strong-scent roses, which is in agreement with previous studies demonstrating that most flower fragrance compounds belong to three major biosynthetic pathways: benzenoids/phenylpropanoids, fatty acid derivatives, and terpenoids [49,52].

4. Conclusions

In this study, we re-sequenced the whole genome of 58 roses originating from different regions around the world and with different scents. Phylogeny and structure analyses revealed that the 58 rose accessions did not cluster according to species or geographic origin, but showed a mixed pattern. This indicated that rose cultivars have a complex genetic background due to the extensive hybridization between cultivated roses or wild rose species worldwide. A selective sweep analysis was conducted to detect selection signatures in the scent trait of roses. In the strong-scent roses, the potential genes under selection were mainly involved in fatty acid biosynthesis, and terpenoids and phenylpropanoids biosynthesis; these implied a positive selection of rose cultivars for their strong fragrance during the rose breeding process. Our study has established a foundation for the further large-scale characterization of the rose germplasm, enabling breeders to incorporate diverse germplasm and allelic variants to fine-tune the flowering in rose cultivars and improve the genetic knowledge of the background of roses.

Supplementary Materials

The following supporting information can be downloaded at: https://www.mdpi.com/article/10.3390/d15060701/s1, Table S1: Geographic origin and flora scent characteristics of roses used in this study. Table S2: Summary of whole genome resequencing data of roses. Table S3: Genome-wide SNP variations identified in the roses. Table S4: Annotation of genome-wide SNP variations identified in rose accessions. Table S5: Statistics of genome-wide indel variations identified in the roses. Table S6: Annotation of genome-wide indel variations identified in rose accessions. Table S7: Genes with non-synonymous variations in each accession. Table S8: Chromosomal distribution of identified candidate genes detected between strong/moderate-scent roses with 5% top Fst. Table S9: KEGG pathway enrichment of candidate genes under selection, detected between strong/moderate-scent roses with 5% top Fst. Table S10: Chromosomal distribution of identified candidate genes detected between strong/moderate-scent roses with 1% top Fst. Table S11: KEGG pathway enrichment of candidate genes under selection, detected between strong/moderate scent roses with 1% top Fst. Table S12: Chromosomal distribution of identified candidate genes detected between strong/low-scent roses with 5% top Fst. Table S13: KEGG pathway enrichment of candidate genes under selection, detected between strong/low-scent roses with 5% top Fst. Table S14: Chromosomal distribution of identified candidate genes detected between strong/low-scent roses with 1% top Fst. Table S15: KEGG pathway enrichment of candidate genes under selection, detected between strong/low-scent roses with 1% top Fst. Figure S1: The statistics of SNP type in each cultivar. Figure S2: The length distribution of indel in coding region and whole genome. Figure S3: KEGG enrichment of candidate genes between strong- and moderate-scent roses. The enriched pathways are listed on the left. Colors denote the p-value. The size of each bubble reflects the genes enriched in each pathway.

Author Contributions

Conceptualization, M.S. and G.L.; Methodology, X.R., Y.Z. and Y.L. (Ya Liu); Formal analysis, Y.L. (Yan Li), J.Y., Y.C. and J.H.; Investigation, M.S. and J.H.; Data curation, Y.L. (Ya Liu), J.Z., Y.Z. and J.Y.; Writing—original draft preparation, M.S. and Y.L. (Yan Li); Writing—review and editing, J.Z., J.Y., J.H., Y.C., J.Z. and G.L.; Visualization, Y.L. (Yan Li), X.R. and Y.L. (Ya Liu); Funding acquisition, M.S. and G.L. All authors have read and agreed to the published version of the manuscript.

Funding

This research was funded by the basic scientific research fund for the public welfare research institutes of the Xinjiang Uygur Autonomous Region (ky2021125) and the key research and development plan projects of the Xinjiang Uygur Autonomous Region (No. 2021B02005-1).

Institutional Review Board Statement

Not applicable.

Data Availability Statement

The sequencing raw data have been deposited in NCBI under the accession number PRJNA972694.

Conflicts of Interest

The authors declare that they have no conflict of interest.

References

  1. Raymond, O.; Gouzy, J.; Just, J.; Badouin, H.; Verdenaud, M.; Lemainque, A.; Vergne, P.; Moja, S.; Choisne, N.; Pont, C.; et al. The Rosa genome provides new insights into the domestication of modern roses. Nat. Genet. 2018, 50, 772–777. [Google Scholar] [CrossRef] [PubMed]
  2. Liorzou, M.; Pernet, A.; Li, S.B.; Chastellier, A.; Thouroude, T.; Michel, G.; Malecot, V.; Gaillard, S.; Briee, C.; Foucher, F.; et al. Nineteenth century French rose (Rosa sp.) germplasm shows a shift over time from a European to an Asian genetic background. J. Exp. Bot. 2016, 67, 4711–4725. [Google Scholar] [CrossRef] [PubMed]
  3. Touw, M. Roses in the middle ages. Econ. Bot. 1982, 36, 71–83. [Google Scholar] [CrossRef]
  4. Wang, G. A study on the history of Chinese roses from ancient works and images. Acta Hortic. 2005, 751, 347–356. [Google Scholar] [CrossRef]
  5. Esselink, G.D.; Nybom, H.; Vosman, B. Assignment of allelic configuration in polyploids using the MAC-PR (microsatellite DNA allele counting-peak ratios) method. Theor. Appl. Genet. 2004, 109, 402–408. [Google Scholar] [CrossRef] [PubMed]
  6. Saint-Oyant, L.H.; Ruttink, T.; Hamama, L.; Kirov, I.; Lakhwani, D.; Zhou, N.N.; Bourke, P.M.; Daccord, N.; Leus, L.; Schulz, D.; et al. A high-quality genome sequence of Rosa chinensis to elucidate ornamental traits. Nat. Plants 2018, 4, 473–484. [Google Scholar] [CrossRef] [PubMed]
  7. Roberts, A.; Debener, T.; Gudin, S. Encyclopedia of Rose Science; Elsevier: Amsterdam, The Netherlands; Academic Press: Oxford, UK, 2003. [Google Scholar]
  8. Martin, M.; Piola, F.; Chessel, D.; Jay, M.; Heizmann, P. The domestication process of the Modern Rose: Genetic structure and allelic composition of the rose complex. Theor. Appl. Genet. 2001, 102, 398–404. [Google Scholar] [CrossRef]
  9. Smulders, M.J.M.; Arens, P.; Koning-Boucoiran, C.F.S.; Gitonga, V.W.; Krens, F.A.; Atanassov, A.; Atanassov, I.; Rusanov, K.E.; Bendahmane, M.; Dubois, A.; et al. Rosa. In Wild Crop Relatives: Genomic and Breeding Resources; Kole, C., Ed.; Springer: Berlin, Germany, 2011; pp. 243–275. [Google Scholar]
  10. Zang, F.Q.; Ma, Y.; Tu, X.L.; Huang, P.; Wu, Q.C.; Li, Z.M.; Liu, T.; Lin, F.R.; Pei, S.R.; Zang, D.K.; et al. A high-quality chromosome-level genome of wild Rosa rugosa. DNA Res. 2021, 28, dsab017. [Google Scholar] [CrossRef]
  11. Mercure, M.; Bruneau, A. Hybridization between the escaped Rosa rugosa (Rosaceae) and native R-blanda in eastern North America. Am. J. Bot. 2008, 95, 597–607. [Google Scholar] [CrossRef]
  12. Bruun, H.H. Rosa rugosa Thunb. ex Murray. J. Ecol. 2005, 93, 441–470. [Google Scholar] [CrossRef]
  13. Nagamitsu, T. Genetic structure in chloroplast and nuclear microsatellites in Rosa rugosa around sea straits in northern Japan. Plant Spec. Biol. 2017, 32, 359–367. [Google Scholar] [CrossRef]
  14. Jiang, L.Y.; Zang, D.K. Analysis of genetic relationships in Rosa rugosa using conserved DNA-derived polymorphism markers. Biotechnol. Biotec. Equip. 2018, 32, 88–94. [Google Scholar] [CrossRef]
  15. Baydar, N.G.; Baydar, H.; Debener, T. Analysis of genetic relationships among Rosa damascena plants grown in Turkey by using AFLP and microsatellite markers. J. Biotechnol. 2004, 111, 263–267. [Google Scholar] [CrossRef] [PubMed]
  16. Rai, H.; Raju, D.V.S.; Kumar, M.B.A.; Janakiram, T.; Namita; Krishnan, S.G.; Rana, J.C. Characterization and analysis of genetic diversity among different species of rose (Rosa species) using morphological and molecular markers. Indian J. Agr. Sci. 2015, 85, 240–245. [Google Scholar]
  17. Jurgens, A.H.; Seitz, B.; Kowarik, I. Genetic differentiation of Rosa canina (L.) at regional and continental scales. Plant Syst. Evol. 2007, 269, 39–53. [Google Scholar] [CrossRef]
  18. Rusanov, K.; Kovacheva, N.; Vosman, B.; Zhang, L.; Rajapakse, S.; Atanassov, A.; Atanassov, I. Microsatellite analysis of Rosa damascena Mill. accessions reveals genetic similarity between genotypes used for rose oil production and old Damask rose varieties. Theor. Appl. Genet. 2005, 111, 804–809. [Google Scholar] [CrossRef]
  19. Gaurav, A.K.; Namita; Raju, D.V.S.; Ramkumar, M.K.; Singh, M.K.; Singh, B.; Krishnan, S.G.; Panwar, S.; Sevanthi, A.M. Genetic diversity analysis of wild and cultivated Rosa species of India using microsatellite markers and their comparison with morphology based diversity. J. Plant Biochem. Biot. 2022, 31, 61–70. [Google Scholar] [CrossRef]
  20. Feng, L.G.; Sheng, L.X.; Shao, D.W.; Tao, J.; Zhao, L.Y. Fluorescent amplified fragment length polymorphism (AFLP) analysis of genetic diversity and relationship of Chinese Rosa rugosa germplasm resources. Afr. J. Biotechnol. 2011, 10, 4524–4531. [Google Scholar]
  21. Panwar, S.; Singh, K.P.; Sonah, H.; Deshmukh, R.K.; Namita; Prasad, K.V.; Sharma, T.R. Molecular fingerprinting and assessment of genetic diversity in rose (Rosa x hybrida). Indian J. Biotechnol. 2015, 14, 518–524. [Google Scholar]
  22. Tan, J.R.; Wang, J.; Luo, L.; Yu, C.; Xu, T.L.; Wu, Y.Y.; Cheng, T.R.; Wang, J.; Pan, H.T.; Zhang, Q.X. Genetic relationships and evolution of old Chinese garden roses based on SSRs and chromosome diversity. Sci. Rep. 2017, 7, 15437. [Google Scholar] [CrossRef]
  23. Aparna, V.; Bhat, K.V.; Janakiram, T.; Prasad, K.V.; Raju, D.V.S.; Sapna, P.; Namitha; Singh, K.P. Assessment of genetic diversity and population structure of fragrant rose (Rosa x hybrida) cultivars using microsatellite markers. Indian J. Agric. Sci. 2019, 89, 212–218. [Google Scholar]
  24. Scariot, V.; Akkak, A.; Botta, R. Characterization and genetic relationships of wild species and old garden roses based on microsatellite analysis. J. Am. Soc. Hortic. Sci. 2006, 131, 66–73. [Google Scholar] [CrossRef]
  25. Xia, A.N.; Yang, A.A.; Meng, X.S.; Dong, G.Z.; Tang, X.J.; Lei, S.M.; Liu, Y.G. Development and application of rose (Rosa chinensis Jacq.) SNP markers based on SLAF-seq technology. Genet. Resour. Crop. Evol. 2022, 69, 173–182. [Google Scholar] [CrossRef]
  26. Li, Y.L.; Ruperao, P.; Batley, J.; Edwards, D.; Martin, W.; Hobson, K.; Sutton, T. Genomic prediction of preliminary yield trials in chickpea: Effect of functional annotation of SNPs and environment. Plant Genome 2022, 15, e20166. [Google Scholar] [CrossRef]
  27. Wang, J.D.; Zhang, Z.L.; Gong, Z.L.; Liang, Y.J.; Ai, X.T.; Sang, Z.W.; Guo, J.P.; Li, X.Y.; Zheng, J.Y. Analysis of the genetic structure and diversity of upland cotton groups in different planting areas based on SNP markers. Gene 2022, 809, 146042. [Google Scholar] [CrossRef]
  28. Xanthopoulou, A.; Manioudaki, M.; Bazakos, C.; Kissoudis, C.; Farsakoglou, A.M.; Karagiannis, E.; Michailidis, M.; Polychroniadou, C.; Zambounis, A.; Kazantzis, K.; et al. Whole genome re-sequencing of sweet cherry (Prunus. avium L.) yields insights into genomic diversity of a fruit species. Hortic. Res. 2020, 7, 60. [Google Scholar] [CrossRef]
  29. McKenna, A.; Hanna, M.; Banks, E.; Sivachenko, A.; Cibulskis, K.; Kernytsky, A.; Garimella, K.; Altshuler, D.; Gabriel, S.; Daly, M.; et al. The Genome Analysis Toolkit: A MapReduce framework for analyzing next-generation DNA sequencing data. Genome Res. 2010, 20, 1297–1303. [Google Scholar] [CrossRef]
  30. Cingolani, P.; Platts, A.; Wang, L.L.; Coon, M.; Nguyen, T.; Wang, L.; Land, S.J.; Lu, X.Y.; Ruden, D.M. A program for annotating and predicting the effects of single nucleotide polymorphisms, SnpEff: SNPs in the genome of Drosophila melanogaster strain w(1118); iso-2; iso-3. Fly 2012, 6, 80–92. [Google Scholar] [CrossRef]
  31. Meirmans, P.G.; Van Tienderen, P.H. GENOTYPE and GENODIVE: Two programs for the analysis of genetic diversity of asexual organisms. Mol. Ecol. Notes 2004, 4, 792–794. [Google Scholar] [CrossRef]
  32. Graebner, R.C.; Hayes, P.M.; Hagerty, C.H.; Cuesta-Marcos, A. A comparison of polymorphism information content and mean of transformed kinships as criteria for selecting informative subsets of barley (Hordeum vulgare L. s. l.) from the USDA Barley Core Collection. Genet. Resour. Crop Evol. 2016, 63, 477–482. [Google Scholar] [CrossRef]
  33. Alexander, D.H.; Novembre, J.; Lange, K. Fast model-based estimation of ancestry in unrelated individuals. Genome Res. 2009, 19, 1655–1664. [Google Scholar] [CrossRef]
  34. Danecek, P.; Auton, A.; Abecasis, G.; Albers, C.A.; Banks, E.; DePristo, M.A.; Handsaker, R.E.; Lunter, G.; Marth, G.T.; Sherry, S.T.; et al. The variant call format and VCFtools. Bioinformatics 2011, 27, 2156–2158. [Google Scholar] [CrossRef]
  35. Aflitos, S.; Schijlen, E.; de Jong, H.; de Ridder, D.; Smit, S.; Finkers, R.; Wang, J.; Zhang, G.Y.; Li, N.; Mao, L.K.; et al. Exploring genetic variation in the tomato (Solanum section Lycopersicon) clade by whole-genome sequencing. Plant J. 2014, 80, 136–148. [Google Scholar] [CrossRef]
  36. Li, Y.; Cao, K.; Zhu, G.R.; Fang, W.C.; Chen, C.W.; Wang, X.W.; Zhao, P.; Guo, J.; Ding, T.Y.; Guan, L.P.; et al. Genomic analyses of an extensive collection of wild and cultivated accessions provide new insights into peach breeding history. Genome Biol. 2019, 20, 36. [Google Scholar] [CrossRef]
  37. Liang, Z.C.; Duan, S.C.; Sheng, J.; Zhu, S.S.; Ni, X.M.; Shao, J.H.; Liu, C.H.; Nick, P.; Du, F.; Fan, P.G.; et al. Whole-genome resequencing of 472 Vitis accessions for grapevine diversity and demographic history analyses. Nat. Commun. 2019, 10, 1190. [Google Scholar] [CrossRef]
  38. Varshney, R.K.; Saxena, R.K.; Upadhyaya, H.D.; Khan, A.W.; Yu, Y.; Kim, C.; Rathore, A.; Kim, D.; Kim, J.; An, S.; et al. Whole-genome resequencing of 292 pigeonpea accessions identifies genomic regions associated with domestication and agronomic traits. Nat. Genet. 2017, 49, 1082–1088. [Google Scholar] [CrossRef]
  39. Zhang, Q.X.; Zhang, H.; Sun, L.D.; Fan, G.Y.; Ye, M.X.; Jiang, L.B.; Liu, X.; Ma, K.F.; Shi, C.C.; Bao, F.; et al. The genetic architecture of floral traits in the woody plant Prunus mume. Nat. Commun. 2018, 9, 1702. [Google Scholar] [CrossRef]
  40. Sun, M.L.; Zhang, J.; Li, Y.; Lin, G.C. Preliminary study on the phylogenetic relationship of Rosa. rugosa ‘Hetian shamomeigui’. Acta Bot. Boreal. Occident. Sin. 2021, 41, 222–233. [Google Scholar]
  41. Guo, R.H.; Sui, Y.J.; Yang, F.Y.; Liu, H. A new cold-resistant rose cultivar‘Tianshan Xiangyun’. Acta Hortic. Sin. 2011, 38, 1417–1418. [Google Scholar] [CrossRef]
  42. Sui, Y.J.; Guo, R.H.; Yang, F.Y.; He, L. Comparative experiment on biological characteristics of cold-resistant rose ‘Tianshan Xiangyun’. Pract. For. Technol. 2012, 9, 57–58. [Google Scholar] [CrossRef]
  43. Hirata, H.; Ohnishi, T.; Tomida, K.; Ishida, H.; Kanda, M.; Sakai, M.; Yoshimura, J.; Suzuki, H.; Ishikawa, T.; Dohra, H.; et al. Seasonal induction of alternative principal pathway for rose flower scent. Sci. Rep. 2016, 6, 20234. [Google Scholar] [CrossRef] [PubMed]
  44. Joichi, A.; Yomogida, K.; Awano, K.; Ueda, Y. Volatile components of tea-scented modern roses and ancient Chinese roses. Flavour Frag. J. 2005, 20, 152–157. [Google Scholar] [CrossRef]
  45. Guterman, I.; Shalit, M.; Menda, N.; Piestun, D.; Dafny-Yelin, M.; Shalev, G.; Bar, E.; Davydov, O.; Ovadis, M.; Emanuel, M.; et al. Rose scent: Genomics approach to discovering novel floral fragrance-related genes. Plant Cell 2002, 14, 2325–2338. [Google Scholar] [CrossRef] [PubMed]
  46. Scalliet, G.; Journot, N.; Jullien, F.; Baudino, S.; Magnard, J.L.; Channelière, S.; Vergne, P.; Dumas, C.; Bendahmane, M.; Cock, J.M.; et al. Biosynthesis of the major scent components 3,5-dimethoxytoluene and 1,3,5-trimethoxybenzene by novel rose O-methyltransferases. FEBS Lett. 2002, 523, 113–118. [Google Scholar] [CrossRef]
  47. Sheng, L.; Zang, S.; Wang, J.; Wei, T.; Xu, Y.; Feng, L. Overexpression of a Rosa rugosa Thunb. NUDX gene enhances biosynthesis of scent volatiles in petunia. PeerJ 2021, 2, e11098. [Google Scholar] [CrossRef]
  48. Aharoni, A.; Giri, A.P.; Verstappen, F.W.; Bertea, C.M.; Sevenier, R.; Sun, Z.; Jongsma, M.A.; Schwab, W.; Bouwmeester, H.J. Gain and loss of fruit flavor compounds produced by wild and cultivated strawberry species. Plant Cell 2004, 16, 3110–3131. [Google Scholar] [CrossRef]
  49. Zhou, L.J.; Yu, C.; Cheng, B.X.; Han, Y.; Luo, L.; Pan, H.T.; Zhang, Q.X. Studies on the volatile compounds in flower extracts of Rosa odorata and R. chinensis. Ind. Crop Prod. 2020, 146, 112143. [Google Scholar] [CrossRef]
  50. Magnard, J.L.; Roccia, A.; Caissard, J.C.; Vergne, P.; Sun, P.L.; Hecquet, R.; Dubois, A.; Hibrand-Saint Oyant, L.; Jullien, F.; Nicole, F.; et al. Biosynthesis of monoterpene scent compounds in roses. Science 2015, 349, 81–83. [Google Scholar] [CrossRef]
  51. Spiller, M.; Berger, R.G.; Debener, T. Genetic dissection of scent metabolic profiles in diploid rose populations. Theor. Appl. Genet. 2010, 120, 1461–1471. [Google Scholar] [CrossRef]
  52. Croteau, R.; Karp, F. Origin of Natural Odorants. In Perfume: Art, Science and Technology; Muller, P., Lamparsky, D., Eds.; Elsevier Applied Sciences: New York, NY, USA, 1991; pp. 101–126. [Google Scholar]
Figure 1. The phylogenetic relationship of rose cultivars using SNP markers. The bootstrap values are indicated with bubbles. The classification of floral scent is highlighted with a background color, where pink, purple, and green represent a strong-scent rose, a moderate-scent rose, and a low-scent rose, respectively. The geographic origin of each rose is indicated with a colored star, with a green star for Europe, a red star for China, a blue star for western Asia, a purple star for North America, a yellow star for Australia, and a grey star for cultivars of unknown origin.
Diversity 15 00701 g001
Figure 2. Genetic clustering and differentiation of rose cultivars using SNPs. (A) Cluster assignments for K = 2–9 estimated in the admixture. Each bar represents one rose accession, and the colors represent the partitioning of the sample in each group. (B) Cross-validation test values for a different number of clusters (K).
Diversity 15 00701 g002
Figure 3. Selective sweep analysis between the strong/moderate-scent rose group (moderate-scent rose group as control) to detect selection signatures in strong-scent roses. (A) Genomic regions with strong selective signals in strong-scent rose groups. Distribution of FST values calculated in 10 kb sliding windows with 100 kb increments. A red line indicates the top 1% of FST distributions and a blue line indicates the top 5% of FST. (B) KEGG enrichment of candidate genes between strong- and moderate-scent roses. The enriched pathways are listed on the left. Colors denote the p-value. The size of each bubble reflects the genes enriched in each pathway.
Diversity 15 00701 g003
Figure 4. Selective sweep analysis between strong/low-scent rose groups (low-scent rose group as control) for the detection of selection signatures in strong scent roses. (A) Genomic regions with strong selective signals in strong-scent rose groups. Distribution of FST values calculated in 10 kb sliding windows with 100 kb increments. The red line indicates the top 1% of FST distributions and the blue line indicates the top 5% of FST. (B) KEGG enrichment of candidate genes between strong- and low-scent roses. The enriched pathways are listed on the left. The colors denote the p-value. The size of each bubble reflects the genes enriched in each pathway.
Diversity 15 00701 g004
Table 1. Genome-wide variations identified in rose cultivars.
No.Cultivar
Name
SNPsIndels
TotalIntronIntergenicCDSTotalIntronIntergenicCDS
TotalSynnSynTotalFram
shf
InserDel
1Rosa ‘Ivor’s Rose’1,307,661180,871357,630182,00199,07680,251432,25578,41897,40816,49710,60017001871
2Rosa ‘Aladdin’1,258,866180,125338,831181,43398,84680,034426,43079,44594,31616,09210,28116631846
3Rosa ‘Andelie’1,238,244176,240332,253176,03595,56077,895406,27075,07889,91115,188974615431743
4Rosa ‘Angela’1,257,173175,758335,130174,74195,03677,153421,22776,14193,05215,83810,20315991783
5Rosa ‘Babe’1,254,028179,014335,073179,77297,82979,282423,00478,53393,54115,85010,15915891863
6Rosa banksiae var. banksiae1,220,569174,592329,302174,75495,36676,933414,67277,31090,92315,299981615871742
7Rosa ‘White Meillandina’1,455,802203,664398,167196,823106,72787,123492,82689,670110,28417,92111,57018421987
8Rosa damascena 1#1,205,798195,841277,211207,499115,37789,717464,88694,57091,04218,23210,76923222232
9Rosa ‘Bingquanzhilian’1,441,849202,641396,580206,134111,91191,262498,43791,813111,18918,78911,98719452161
10Rosa ‘Iceberg’1,150,678164,959308,738161,74787,69171,697384,45171,38985,03914,195925514031595
11Rosa ‘Chariot’1,175,700161,796321,378148,44180,04566,107383,31667,53388,72913,355879312401433
12Rosa damascena1,378,891227,181319,849223,694122,89597,995491,676101,85396,40818,68011,52021772178
13Rosa ‘Parade’1,344,859188,306365,677188,834102,47283,572451,01382,178101,48116,94610,76217431981
14Rosa ‘Dianhong’1,166,345189,101265,223197,509108,26586,622422,90085,35483,55916,97210,57219022001
15Rosa ‘Fanghua’1,385,662200,772368,013208,754114,79491,101474,76490,202104,29518,45211,54419522225
16Rosa rugosa ‘Fenghua’1,036,722193,705185,729210,005117,63490,101445,55897,47175,11019,26311,25325662404
17Rosa ‘Licorice Tea’1,136,549157,251304,052155,32684,15268,800382,58267,15586,87714,304933813751579
18Rosa ‘Pretty Princess’1,328,390186,719360,616187,256101,60082,930449,56582,503100,22016,83210,69717701958
19Rosa ‘Spectra’1,261,911183,116337,586182,11599,39480,141431,66081,62594,17416,13510,18017081909
20Rosa ‘Hetianshamomeigui’1,454,887243,654316,090259,965142,942113,845527,405110,79099,50921,81113,21026552635
21Rosa ‘Double Delight’1,239,876180,066330,655183,079100,12180,494428,27681,22493,45716,17610,18916971917
22Rosa ‘Jinbian’1,389,521195,333374,772188,660102,11583,692462,74584,153103,77416,96911,02316341875
23Rosa ‘Jinhui’1,324,109190,429358,251189,323102,94283,662459,35385,871102,78217,38011,04218312011
24Rosa ‘Goldmarie’1,326,837195,795345,111197,351108,27586,314452,37887,10596,94217,17610,90218252028
25Rosa ‘Mascotte’77’1,348,336194,927360,430192,203104,89584,567469,42588,000103,50817,08310,92417521948
26Rosa ‘Carola’1,398,326199,214377,170199,483108,22688,377493,42790,848109,28218,34911,54619752153
27Rosa ‘The Generous Gardener’1,344,478189,502364,040195,627106,45586,312450,82483,304100,00917,52311,18218301995
28Rosa sertata × rugosa1,188,949161,730324,249157,58485,44169,747387,03267,98889,54614,294937013311601
29Rosa ‘Blue Ribbon’1,186,726167,403323,515168,17191,11874,532401,34473,97689,49115,054962715351700
30Rosa ‘Pink O’Hara’1,404,933194,208394,423196,383106,50587,051481,73687,461110,30118,27911,67618712126
31Rosa ‘Crimson Glory’ 1#1,254,209179,744336,313187,844102,57082,607434,23981,39795,05216,94410,65218891989
32Rosa ‘South Seas’1,382,117205,619357,989216,528120,03393,629480,14593,954102,70318,77211,71820492217
33Rosa ‘Pengpeng’1,299,944187,800339,374192,,915105,86384,373445,30983,73696,60717,12410,80418121963
34Rosa rugosa ‘Pingyin 1’1,068,091196,673193,577216,731121,15793,214459,20199,40678,38320,37611,87727172526
35Rosa centifolia ‘Grasse Rose’1,557,369248,092363,014264,223145,427115,496556,043113,146109,08322,69313,76427292727
36Rosa ‘Sijifen’1,186,996164,523327,305163,31988,24072,660400,26072,29490,65214,989965215321691
37Rosa ‘Suji’1,374,657195,871369,643192,156104,27885,114475,78487,848105,43917,34611,12417361991
38Rosa ‘Tineke’1,159,157210,645217,998228,676127,22398,869493,822105,81886,58821,29912,53328002607
39Rosa ‘Meilivoine’1,362,014188,865369,434185,994100,91482,312435,75178,23098,33516,31710,50116561865
40Rosa cv. Climbers 11,394,736201,047379,712188,753102,07483,893480,96989,538106,39316,92510,89417381911
41Rosa ‘Sweet Chariot’1,265,480171,094349,046166,83290,22773,989420,67773,40997,16015,37010,08514531680
42R. laxa × hybrida cv. Tianshan Xiaguang1,347,767217,477325,469206,677113,90690,101492,22299,67098,90117,26910,72319602053
43R. laxa × hybrida cv. Tianshan Xiangyun1,403,917217,849346,639224,597123,84497,794505,945101,081104,13019,57911,92823552316
44Rosa ‘Smooth sunglow’1,254,136181,357330,425186,622101,99281,998437,98882,50195,27116,69510,49817991966
45Rosa ‘Xinba’1,343,121195,384355,231194,716106,54985,364459,93186,611101,42617,22110,92917981964
46Rosa ‘Betty Prior’1,191,623171,810310,885172,33793,70076,147409,68975,96289,23115,646993516111808
47Rosa ‘Yuki Akari’1,249,571171,664337,954166,17389,67773,898408,31871,76494,28314,985984114301580
48Rosa ‘Lavender Bouquet’1,185,191160,931324,550155,33984,06568,890385,48667,79789,39913,992917413001578
49Rosa ‘Movie Star’1,244,338180,865329,689179,96397,63679,745435,78581,79995,06716,23010,28716971890
50Rosa ‘Yueyuehong’890,350127,942230,090127,10969,36455,876312,15355,73370,19711,356737411071305
51Rosa ‘Yuncaihong’1,151,872161,160314,582157,10784,98269,829389,43970,74687,46914,401926914451635
52Rosa ‘Yuncaixia’1,329,661191,778350,676191,567104,65484,102450,46784,49897,80516,98610,88217551988
53Rosa ‘Yunxiang’1,338,109196,573350,437199,055108,42687,843474,46490,366102,29118,10311,37919562073
54Rosa ‘Parkdirektor Riggers’1,442,596209,991380,201200,675108,72988,996504,13394,083108,62518,11211,62018632030
55Rosa ‘Crimson Glory’ 2#1,177,506170,541312,935174,29695,01676,801408,20576,59390,01515,600988716821795
56Rosa ‘Roger Lambelin’1,217,137186,897296,511195,810106,97686,184447,58686,03194,94217,90211,29119592084
57Rosa rugosa ‘Zizhi’1,033,306193,036187,447210,695117,92090,469433,11995,62373,89018,77010,96025052349
58Rosa laxa1,052,914190,259195,950211,707118,84890,638439,52294,25477,09019,01811,12925382362
Syn: Synonymous; nSyn: NonSynonymous. Inser: Insertion; Del: Deletion; Fram shf: Frame shift.
Table 2. The diversity index of roses in each scent group.
GroupStrong ScentModerate ScentLow Scent
Nei0.270.2610.255
Ho0.2190.2230.223
PIC0.2160.2120.208
H0.4110.4050.397
Nei: Nei diversity index; Np: Number of polymorphic markers; Ho: Observed heterozygosity; PIC: Polymorphism information content; H: Shannon Wiener index.
Disclaimer/Publisher’s Note: The statements, opinions and data contained in all publications are solely those of the individual author(s) and contributor(s) and not of MDPI and/or the editor(s). MDPI and/or the editor(s) disclaim responsibility for any injury to people or property resulting from any ideas, methods, instructions or products referred to in the content.

