Article

Habitat Selection Differences of Two Sympatric Large Carnivores in the Southwestern Mountains of China

1
Key Laboratory of Biodiversity and Ecological Engineering, School of Life Sciences, Ministry of Education, Beijing Normal University, Beijing 100875, China
2
College of Life Sciences, China West Normal University, Nanchong 637001, China
3
Society of Entrepreneurs and Ecology (SEE) Foundation, Beijing 100020, China
4
Xinlong Forestry and Grassland Bureau, Xinglong 626899, China
5
China Felid Conservation Alliance, Beijing 101121, China
*
Authors to whom correspondence should be addressed.
Diversity 2023, 15(9), 968; https://doi.org/10.3390/d15090968
Submission received: 13 July 2023 / Revised: 23 August 2023 / Accepted: 25 August 2023 / Published: 27 August 2023
(This article belongs to the Special Issue Ecology, Conservation and Restoration of Threatened Animal)

Abstract

:
Large terrestrial carnivores play a crucial role in the top–down control of terrestrial ecosystems by maintaining ecosystem stability and biodiversity. However, intense interspecific competition typically occurs among large sympatric carnivores, leading to population reduction or extinction. Spatial partitioning through divergent habitat selection mitigates such competition. In this study, we analyzed the main environmental factors influencing the habitat selection and fragmentation of suitable habitats in Xinlong County, Sichuan Province, using 410 infrared cameras from 2015 to 2023. By employing generalized linear and maximum entropy models, we developed an ensemble model to predict the suitable habitat distribution of leopards (Panthera pardus) and wolves (Canis lupus). The results revealed significant disparities in suitable habitat distributions of leopards and wolves as coexisting large carnivores. Leopards prefer understory, whereas wolves prefer high-altitude meadows. Wolves spatially avoid leopards, who secure relatively superior resources and relegate wolves to inferior habitats. Although suitable habitat patches for both species cluster intensely, habitat connectivity remains low owing to pronounced anthropogenic disturbances, which is especially evident in the higher fragmentation of wolf habitats. These results suggest that sympatric large carnivores can reduce spatial competition intensity and promote spatial partitioning by selecting divergently suitable habitats, thereby facilitating species coexistence.

1. Introduction

Carnivores play a pivotal role in the food chain, crucially contributing to preserving ecological balance and species diversity. Notably, large carnivores (weighing > 15 kg) control the populations of herbivorous animals and secondary predators through trophic cascade effects, thereby upholding ecosystem stability [1,2]. Nevertheless, escalating global anthropogenic disturbances, habitat loss, fragmentation, reduced fecundity, and climate change have rapidly declined the once-abundant large carnivore populations. Currently, they are primarily concentrated in eight global hotspots [1,3,4], and the southwestern mountainous area of China has emerged as a significant hotspot characterized by the concentrated distribution of large carnivores. The convergence of carnivore distributions inevitably escalates interspecies competition. Consistent with the competitive exclusion principle, competitors with similar ecological characteristics cannot coexist within the same niche, either simultaneously or for an extended period. To achieve coexistence, a modification in the ecological niche of at least one of the competitors is necessary [5]. Consequently, the survival of large terrestrial carnivores is imperiled not only by external stressors but also by intense interspecific competitive interactions, prompting ecologists to focus on investigating the coexistence mechanisms and conservation strategies of these magnificent predators.
Recent studies on carnivore competition and coexistence have predominantly focused on three ecological niche dimensions: spatial, temporal, and nutritional dynamics [2]. Among these dimensions, exploring the spatial ecological niche forms the fundamental basis for understanding carnivore competition and coexistence at the local scale. Notably, disparities in habitat preference among species serve as an effective mechanism for driving spatial niche differentiation, particularly for large carnivores. For example, in Nepal’s National Park, leopards (Panthera pardus) strategically position themselves at the periphery of tiger (Panthera tigris) territories, deliberately selecting relatively suboptimal habitats to achieve spatial avoidance [6].
Habitat selection is a critical aspect of the survival of large carnivores and is influenced by various factors, including individual characteristics, environmental conditions, and anthropogenic disturbances. Understanding the intricate interplay between these factors is important for effective conservation management [7,8]. Large carnivores exhibit selective preferences driven by adaptability, behavioral characteristics, and the need to enhance resilience against external threats and interspecific competition. For example, a tiger’s distinctive orange coat with black stripes provides excellent camouflage within forest thickets, effectively blending light and shade patterns. This distinctive coat provides effective camouflage because certain herbivores cannot distinguish between orange and green [9]. The availability of crucial resources, including water and prey, shapes carnivore habitat selection. A study in Iran highlighted the significance of ecological zones with high vegetation cover and rainfall in providing abundant prey resources for leopards and influencing their habitat preferences [10]. Interspecific competition also plays a pivotal role, as observed in South Asia, where leopards favor habitats with relatively low prey resources and vegetation cover to minimize competition with tigers [6]. Moreover, the escalation of anthropogenic disturbances has introduced additional complexities. For example, road construction and infrastructure edge effects have prompted tiger and leopard populations in Thai national parks to move away from human settlements [11]. These disturbances contribute to habitat loss and fragmentation and pose significant threats to the persistence of large carnivore populations. Habitat fragmentation can impair key ecosystem functions and cause long-term cumulative effects by reducing biodiversity [12]. Fragmentation results in increased habitat patches, patch isolation, and potential habitat loss [13]. Reducing anthropogenic disturbance and enhancing habitat connectivity are critical measures for mitigating the adverse effects of fragmentation. For example, heterogeneous habitat connectivity has been instrumental in safeguarding the remaining cheetah population in Iran [14]. In conclusion, the selection of suitable habitats for large carnivores necessitates the consideration of prey availability, environmental conditions, and human disturbance. Analysis of habitat fragmentation is essential for guiding the development of scientifically grounded conservation management strategies.
Leopards and wolves (Canis lupus), the focal species in this study, are large carnivores with distinct characteristics and habitat preferences. Leopards, which are solitary ambush hunters, tend to favor secluded habitats for survival. Their global distribution spans sub-Saharan Africa, southeast Asia, and east Asia (Figure 1a). In contrast, wolves are group-living animals known for their opportunistic predation and remarkable adaptability to various environments, including the tundra, grasslands, and forests [15]. Wolves have a wide-ranging global distribution (Figure 1a). There is a certain degree of spatial overlap between wolves and leopards, and because of their dietary preferences, coexisting wolves and leopards often engage in intense competition. Studies conducted in areas where wolves and leopards coexist have found that the survival rate of leopards can increase to 98% in the absence of wolves [16].
Currently, comparative research on habitat selection differences between leopards and wolves is scarce in both domestic and international studies of large carnivores. The southwestern mountainous region of China is one of the few regions in which leopards and wolves coexist. Notably, diverse habitats and abundant prey resources make it an excellent area for investigating the differences in habitat selection between these two species [17].
Previous studies have demonstrated that variations in habitat preference among species can lead to spatial niche differentiation. However, the specific factors that influence these preferences remain poorly understood. This study focused on Xinlong County, which is situated within the southwestern mountain range. Our primary objective was to ascertain whether the habitat selection strategies employed by leopards and wolves in Xinlong County contribute to the differentiation of their spatial ecological niches. Thus, we propose the following predictions: (1) there are significant differences in the suitable habitat distributions of sympatric leopards and wolves; (2) leopards and wolves exhibit spatial independence in their mutual interactions; and (3) suitable habitats for both leopards and wolves are strongly influenced by anthropogenic disturbances, leading to high levels of habitat fragmentation. Camera traps were used to investigate disparities in suitable habitat distributions for leopards and wolves as well as their responses to environmental factors.

2. Materials and Methods

2.1. Study Area

The Xinlong region, located in the Ganzi Tibetan Autonomous Prefecture of Sichuan Province, lies in the middle reaches of the Yalong River (99°37′–100°54′ E, 30°23′–31°32′ N). The topography of the region is characterized by high elevations in the north that gradually descend to low elevations in the south. The Yalong River flows through the county from north to south, dividing it into eastern and western parts and creating a typical alpine valley terrain with an altitude exceeding 3000 m. The region experiences a typical plateau monsoon climate characterized by hot, rainy summers and cold, dry winters with significant vertical variations in climate. The interplay between terrain and climate has created diverse habitats for wildlife and sustained abundant wild flora and fauna. In addition to top-level carnivores such as leopards and wolves, the area is home to secondary predators such as the red fox (Vulpes vulpes), leopard cat (Prionailurus bengalensis), and Pallas’s cat (Otocolobus manul), as well as a rich array of prey species, including blue sheep (Pseudois nayaur), tufted deer (Elaphodus cephalophus), wild boar (Sus scrofa), and Chinese serow (Capricornis milneedwardsii) [17]. The forests and meadows in the region are subjected to varying degrees of anthropogenic disturbance, primarily caused by Tibetan herders, whose livelihoods predominantly rely on grazing practices. However, the cultural belief of most Tibetans that they refrain from killing animals has contributed to the persistence of numerous endangered and rare species, thereby aiding in the preservation of biodiversity within the region. The combined influence of the natural environment and cultural customs has created highly favorable conditions for the coexistence of wild animals in the Xinlong region.

2.2. Data Collection

2.2.1. Camera Trapping Surveys

Species distribution data were obtained using infrared camera trapping. Monitoring was conducted during two distinct periods: from 2015 to 2021, during which 193 cameras were utilized, and from 2022 to 2023, during which 217 cameras were deployed. In the initial period, infrared cameras were placed randomly, focusing on areas known for frequent wildlife activities. From 2022 to 2023, we established a systematic carnivore monitoring network in Xinlong County using a grid-based layout of 1 km × 1 km grid cells. One camera was placed within each grid cell, ensuring a minimum distance of 500 m between cameras. The specific deployment criteria were as follows: (1) the presence of animal traces (such as hair, feces, and footprints) at the chosen sites; (2) ensuring that the monitoring target was at the center of the camera’s field of view; and (3) setting camera parameters as follows: 24 h system operation, medium sensitivity, capturing three consecutive shots followed by a 20 s video, and a 1 min interval between each sequence.
Leopards were detected at 160 of the 410 surveyed camera sites, whereas wolves were observed at 170 locations.

2.2.2. Environmental Variables

Based on the objectives of this study and previous relevant research, we selected topography, vegetation, disturbance, and prey as environmental factors to analyze the distribution of suitable habitats for leopards and wolves (Table S1) [18]. The following six topographic variables were considered: elevation (ELE), slope (SLP), distance to water (DTW), distance to cliffs (DTC), distance to valleys (DTV), and distance to ridges (DTR). All these variables were extracted from the Digital Elevation Model (DEM) of Xinlong County using ArcGIS 10.8 for surface and hydrological analyses. DEM data were obtained from the geospatial data cloud platform (https://www.gscloud.cn/, (accessed on 15 May 2023)). The Enhanced Vegetation Index (EVI) was used as a vegetation variable. The EVI was calculated using Landsat 8 satellite imagery that underwent atmospheric correction and radiometric calibration. The vegetation index tool computed the average EVI values in May and August. The EVI data were corrected using ENVI 5.3. The disturbance variables encompassed the distance to roads (DTD) and distance to settlements (DTS). Vector data for roads and settlements, as well as surface cover raster data, were acquired from the National Catalogue Service for Geographic Information (https://www.webmap.cn/, (accessed on 15 May 2023)). The distance analysis tool in ArcGIS 10.8 was applied to generate raster data for DTD and DTS. Furthermore, the analysis included prey variables. Initially, habitat distribution prediction was conducted for 11 prey species. We extracted predicted prey distribution response values using the “Extract Multi Values to Points” tool in ArcGIS 10.8. Spearman’s correlation analysis was used to assess intervariable relationships. Variables with a correlation coefficient |r| > 0.7 were retained, prioritizing ecologically meaningful factors. Finally, we incorporated ELE, DTC, DTR, DTV, DTW, EVI, DTD, DTS, SLP, and five prey-related variables into the model. Prey species included blue sheep (BS), tufted deer (TD), blood pheasants (Ithaginis cruentus) (BP), horses (Equus ferus caballus) (HR), and wild boar (WB).

2.3. Data Analysis

2.3.1. Ensemble Model

Species Distribution Models (SDMs) are valuable tools for integrating species distribution data with abiotic factors. However, given the availability of various model types, it is crucial to carefully select an appropriate model and adjust its parameters according to the specific research question [19]. Among the common SDMs, the Maximum Entropy Model (MaxEnt) is an ecological niche model that utilizes only species occurrence points and environmental variables to predict the suitable habitat distribution of the target species in the study area. MaxEnt has gained popularity in recent years because it can achieve relatively accurate predictions with a limited data volume [20,21,22,23,24]. Nevertheless, a limitation of MaxEnt is the potential risk of overfitting. The Generalized Linear Model (GLM) is also a powerful method for species distribution prediction, but its accuracy relies heavily on the quality and quantity of available samples [25]. Ensemble models that combine MaxEnt and GLM integrate the outcomes of both models, offering a means of reducing the individual algorithm prediction uncertainty to some extent.
All occurrence and non-occurrence data for different species were prepared. To avoid spatial autocorrelation, we performed subsampling for each species occurrence point within 1000 m and established corresponding 1000 m buffers. The non-occurrence points falling within the buffers were excluded, and the remaining non-occurrence points were subsampled [26].
The dataset was divided into two subsets to assess the quality of the models: training and test sets. Random sampling was used to allocate 20% of the total data as the test set for model validation, and the remaining 80% was used as the training set for model training.
The “glm” and “maxent” functions were used to construct the model for fitting. Model performance was evaluated using the area under the receiver operating characteristic curve (AUC) and the True Skill Statistic (TSS), which represent the accuracy of the model simulation. The AUC value ranges can be interpreted as follows: values between 0.5 and 0.6 indicate model failure; 0.6 to 0.7 indicate poor performance; 0.7 to 0.8 indicate moderate performance; 0.8 to 0.9 indicate good performance; and 0.9 to 1.0 indicate excellent performance [27]. The TSS value ranges can be interpreted as follows: values below 0.4, failure; 0.4 to 0.55, poor performance; 0.55 to 0.7, moderate performance; 0.7 to 0.85, good performance; and 0.85 to 1, excellent performance [28]. Additionally, the model weights were calculated based on the AUC values, and the GLM predictions were combined with those of the MaxEnt model to obtain the ensemble results.
Using the “bm_VariablesImportance” function of the “biomod2” package in R, we extracted the environmental variable importance. The relative importance of the environmental variables predicted by each model was calculated by conducting three separate model runs, and the average of these three runs was used as the result. The results were normalized individually. The ensemble model then determined the relative importance of the environmental variables by calculating a weighted average of the normalized results. Additionally, the response curves for the environmental variables were predicted based on the ensemble model outcomes. The R packages used for model construction included “sf” and “rJava”. Environmental variable importance extraction and environmental response curve plotting were performed using the R packages “biomod2” and “ggplot2”. All analyses were conducted using R, version 4.2.1 (https://www.r-project.org, (accessed on 10 June 2023)).

2.3.2. Assessment of Habitat Suitability

Habitat suitability maps for leopards and wolves were reclassified using ArcGIS 10.8 (https://www.esri.com/zh-cn/arcgis/products/arcgis-desktop, (accessed on 10 June 2023)) with threshold values of 0.57 and 0.61, respectively. These values were derived from the ensemble model, and reclassification resulted in maps for evaluating habitat suitability levels. Subsequently, the suitable habitat area was calculated using the image element method.

2.3.3. Assessment of Suitable Habitat Landscapes

In this study, leopard and wolf habitats were classified as either suitable or unsuitable. The classification results were rasterized using ArcGIS 10.8 and then imported into Fragstats V4.2.0 (https://fragstats.org/index.php, (accessed on 10 June 2023)) as a layer. Fragstats was used to extract landscape parameters at the class scale based on this layer. Seven indices were selected for the class scale, which was categorized into four types of indicators: area indicator (percentage of landscape, PLAND); shape indicator (landscape shape index, LSI; edge density, ED; perimeter–area fractal dimension, PAFRAC); connectivity index (Connectance Index, CONNECT; Aggregation Index, AI); and fragmentation index (patch density, PD). These indices were used to analyze the landscape characteristics of suitable and unsuitable habitats for leopards and wolves in the study area (Table S2).

2.3.4. Spatial Interactions

We employed a two-species occupancy model to explore the spatial interactions between leopards and wolves. Based on the assumptions of the occupancy model and monitoring data from the infrared camera trap sites, we selected data from the cold season (November to April of the following year) to construct a two-species occupancy model. This choice was driven by harsh environmental conditions and reduced prey activity during the cold season, potentially intensifying competition between leopards and wolves. Because the dominance status between leopards and wolves could not be definitively ascertained, we separately analyzed two scenarios by designating each species as dominant in two rounds of two-species occupancy modeling to ultimately establish their relationship.
For each study species, we established monitoring histories based on 7-day detection periods, with 26 detections conducted during the survey period. Sites with fewer than 10 detection periods (monitoring time of less than 70 days) were excluded, leaving a final dataset of 310 sites. Guided by the results of the ensemble model, we incorporated influential environmental variables for both leopards and wolves into a two-species occupancy model. We constructed eight candidate models for each species, selected the model with the lowest ΔAIC as the optimal model, and calculated the estimated species interaction factor (SIF) values based on relevant parameters from the selected models [29]. When the SIF = 1, the spatial distributions of the two species are independent. When the SIF < 1, the spatial distributions tend to segregate, whereas when the SIF > 1, the spatial distributions tend to overlap. All analyses were performed using PRESENCE 2.13.47 (https://www.mbr-pwrc.usgs.gov/software/presence.html, (accessed on 10 June 2023)).

3. Results

3.1. Ensemble Model Accuracy Assessment

In the ensemble model, the AUC values for leopard and wolf habitat prediction were 0.81 and 0.71, respectively, while the TSS values were both 0.67. According to the AUC and TSS evaluation criteria, these values suggest that the ensemble model reasonably evaluates habitat suitability for leopards and wolves. Furthermore, the prediction accuracy of the GLM was higher than that of MaxEnt, as shown in Table 1.

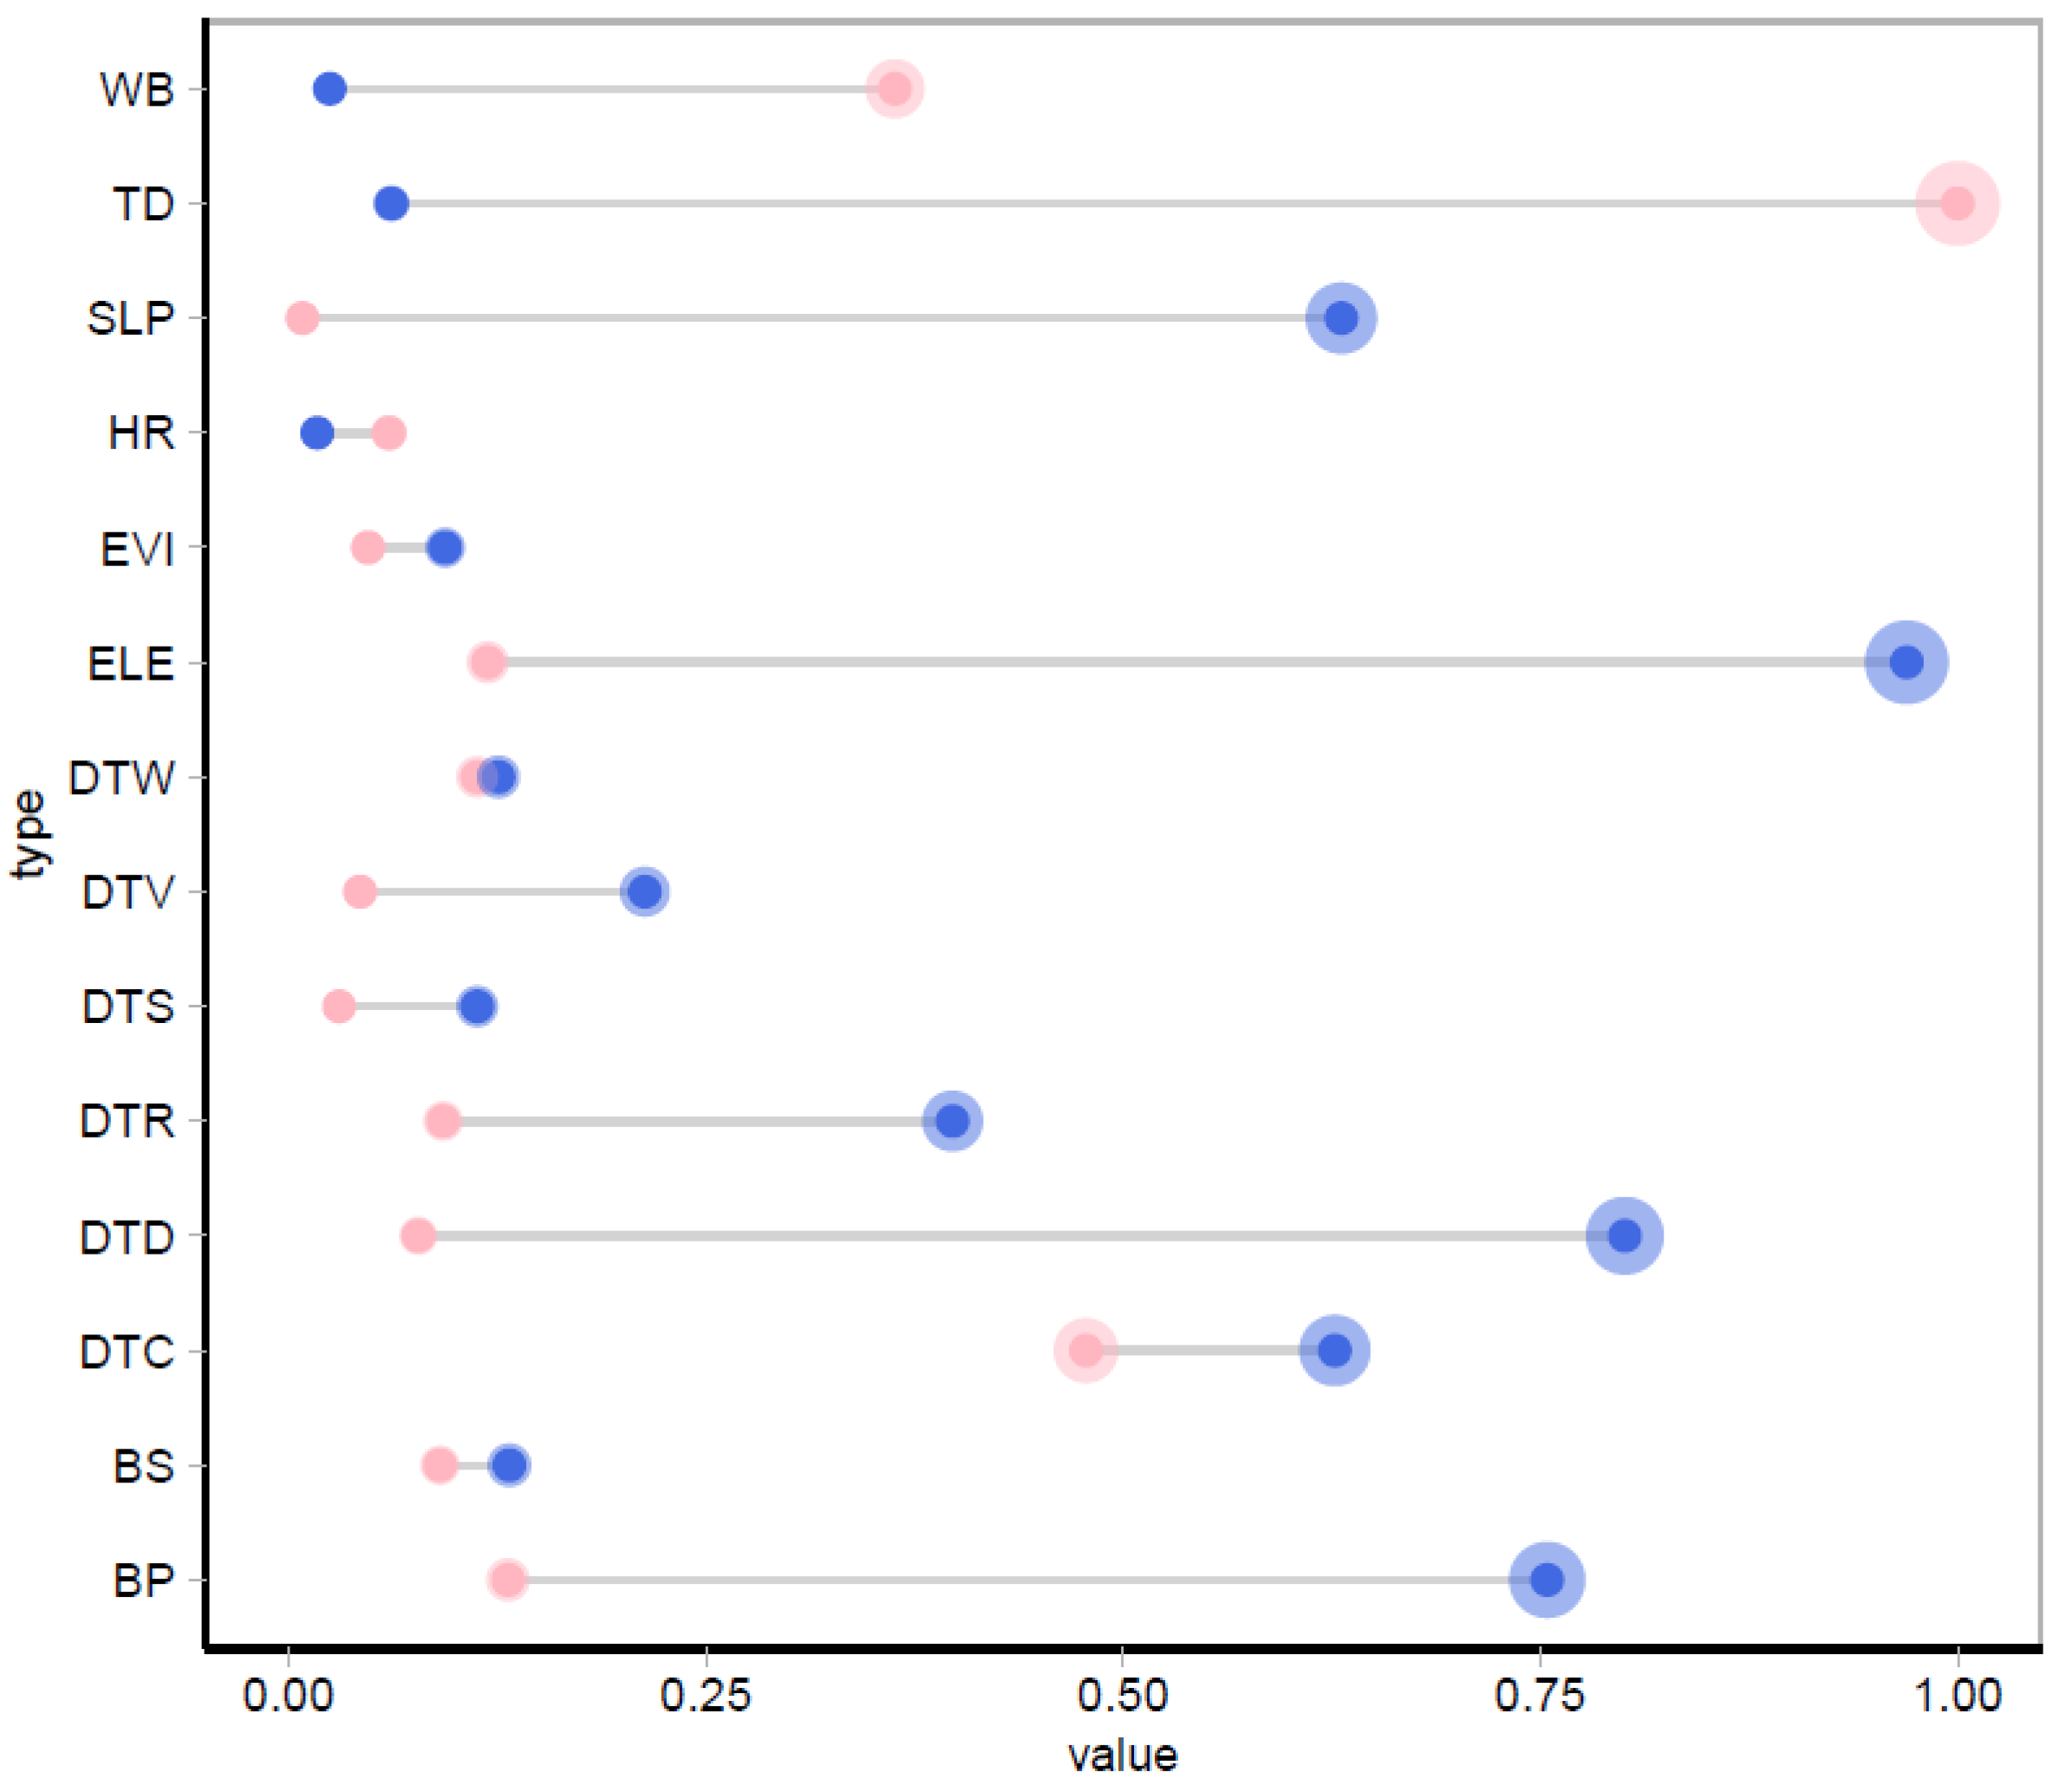
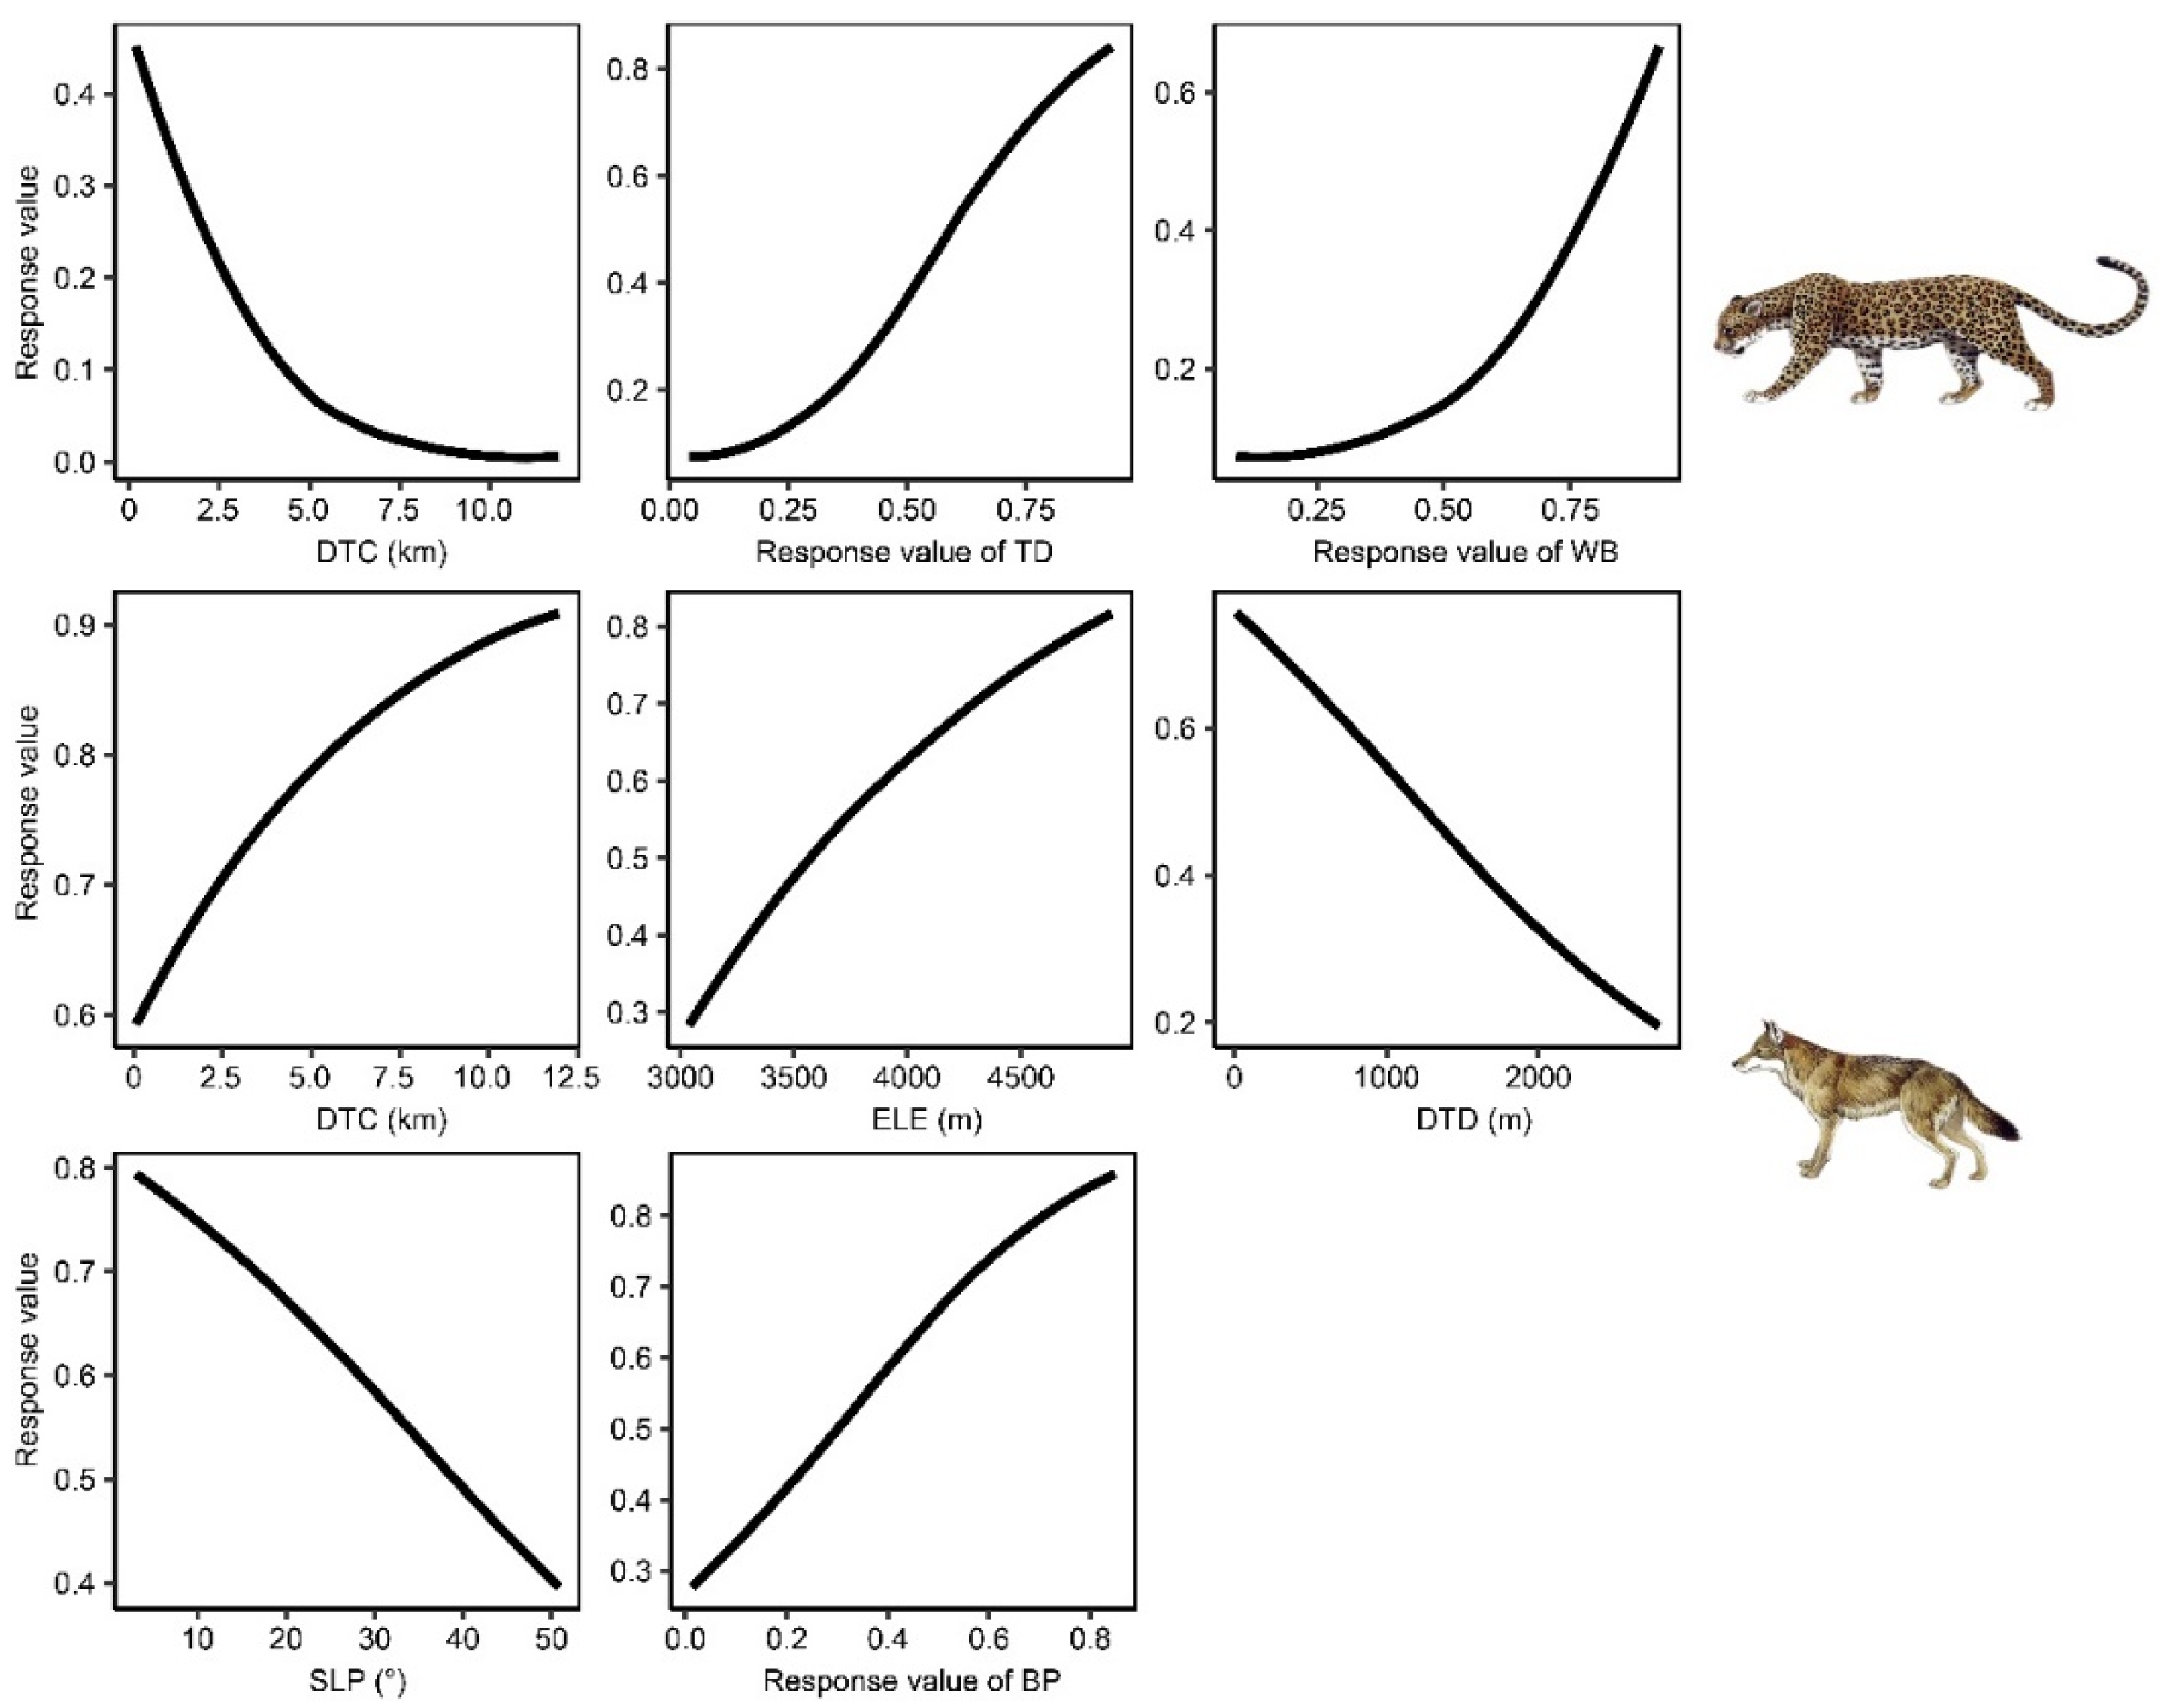
3.2. Environmental Variable Importance Analysis

The environmental variable importance derived from the ensemble model indicated that TD was the most crucial factor influencing the suitable habitat distribution of leopards, with the highest contribution to the model. Additionally, the relatively important environmental variables for leopards included DTC and WB. In contrast, ELE, DTD, BP, SLP, and DTC affected wolf habitat distribution, among which ELE made the most significant contribution (Figure 2). Environmental response curves were plotted using the aforementioned environmentally influential variables for leopards and wolves (Figure 3). The results revealed that leopards prefer areas near cliffs with high predicted distribution values for TD and wild boar. However, wolves preferred regions at high elevations with low slopes, proximity to roads yet distance from cliffs, and areas with high predicted distribution values of blood pheasants.

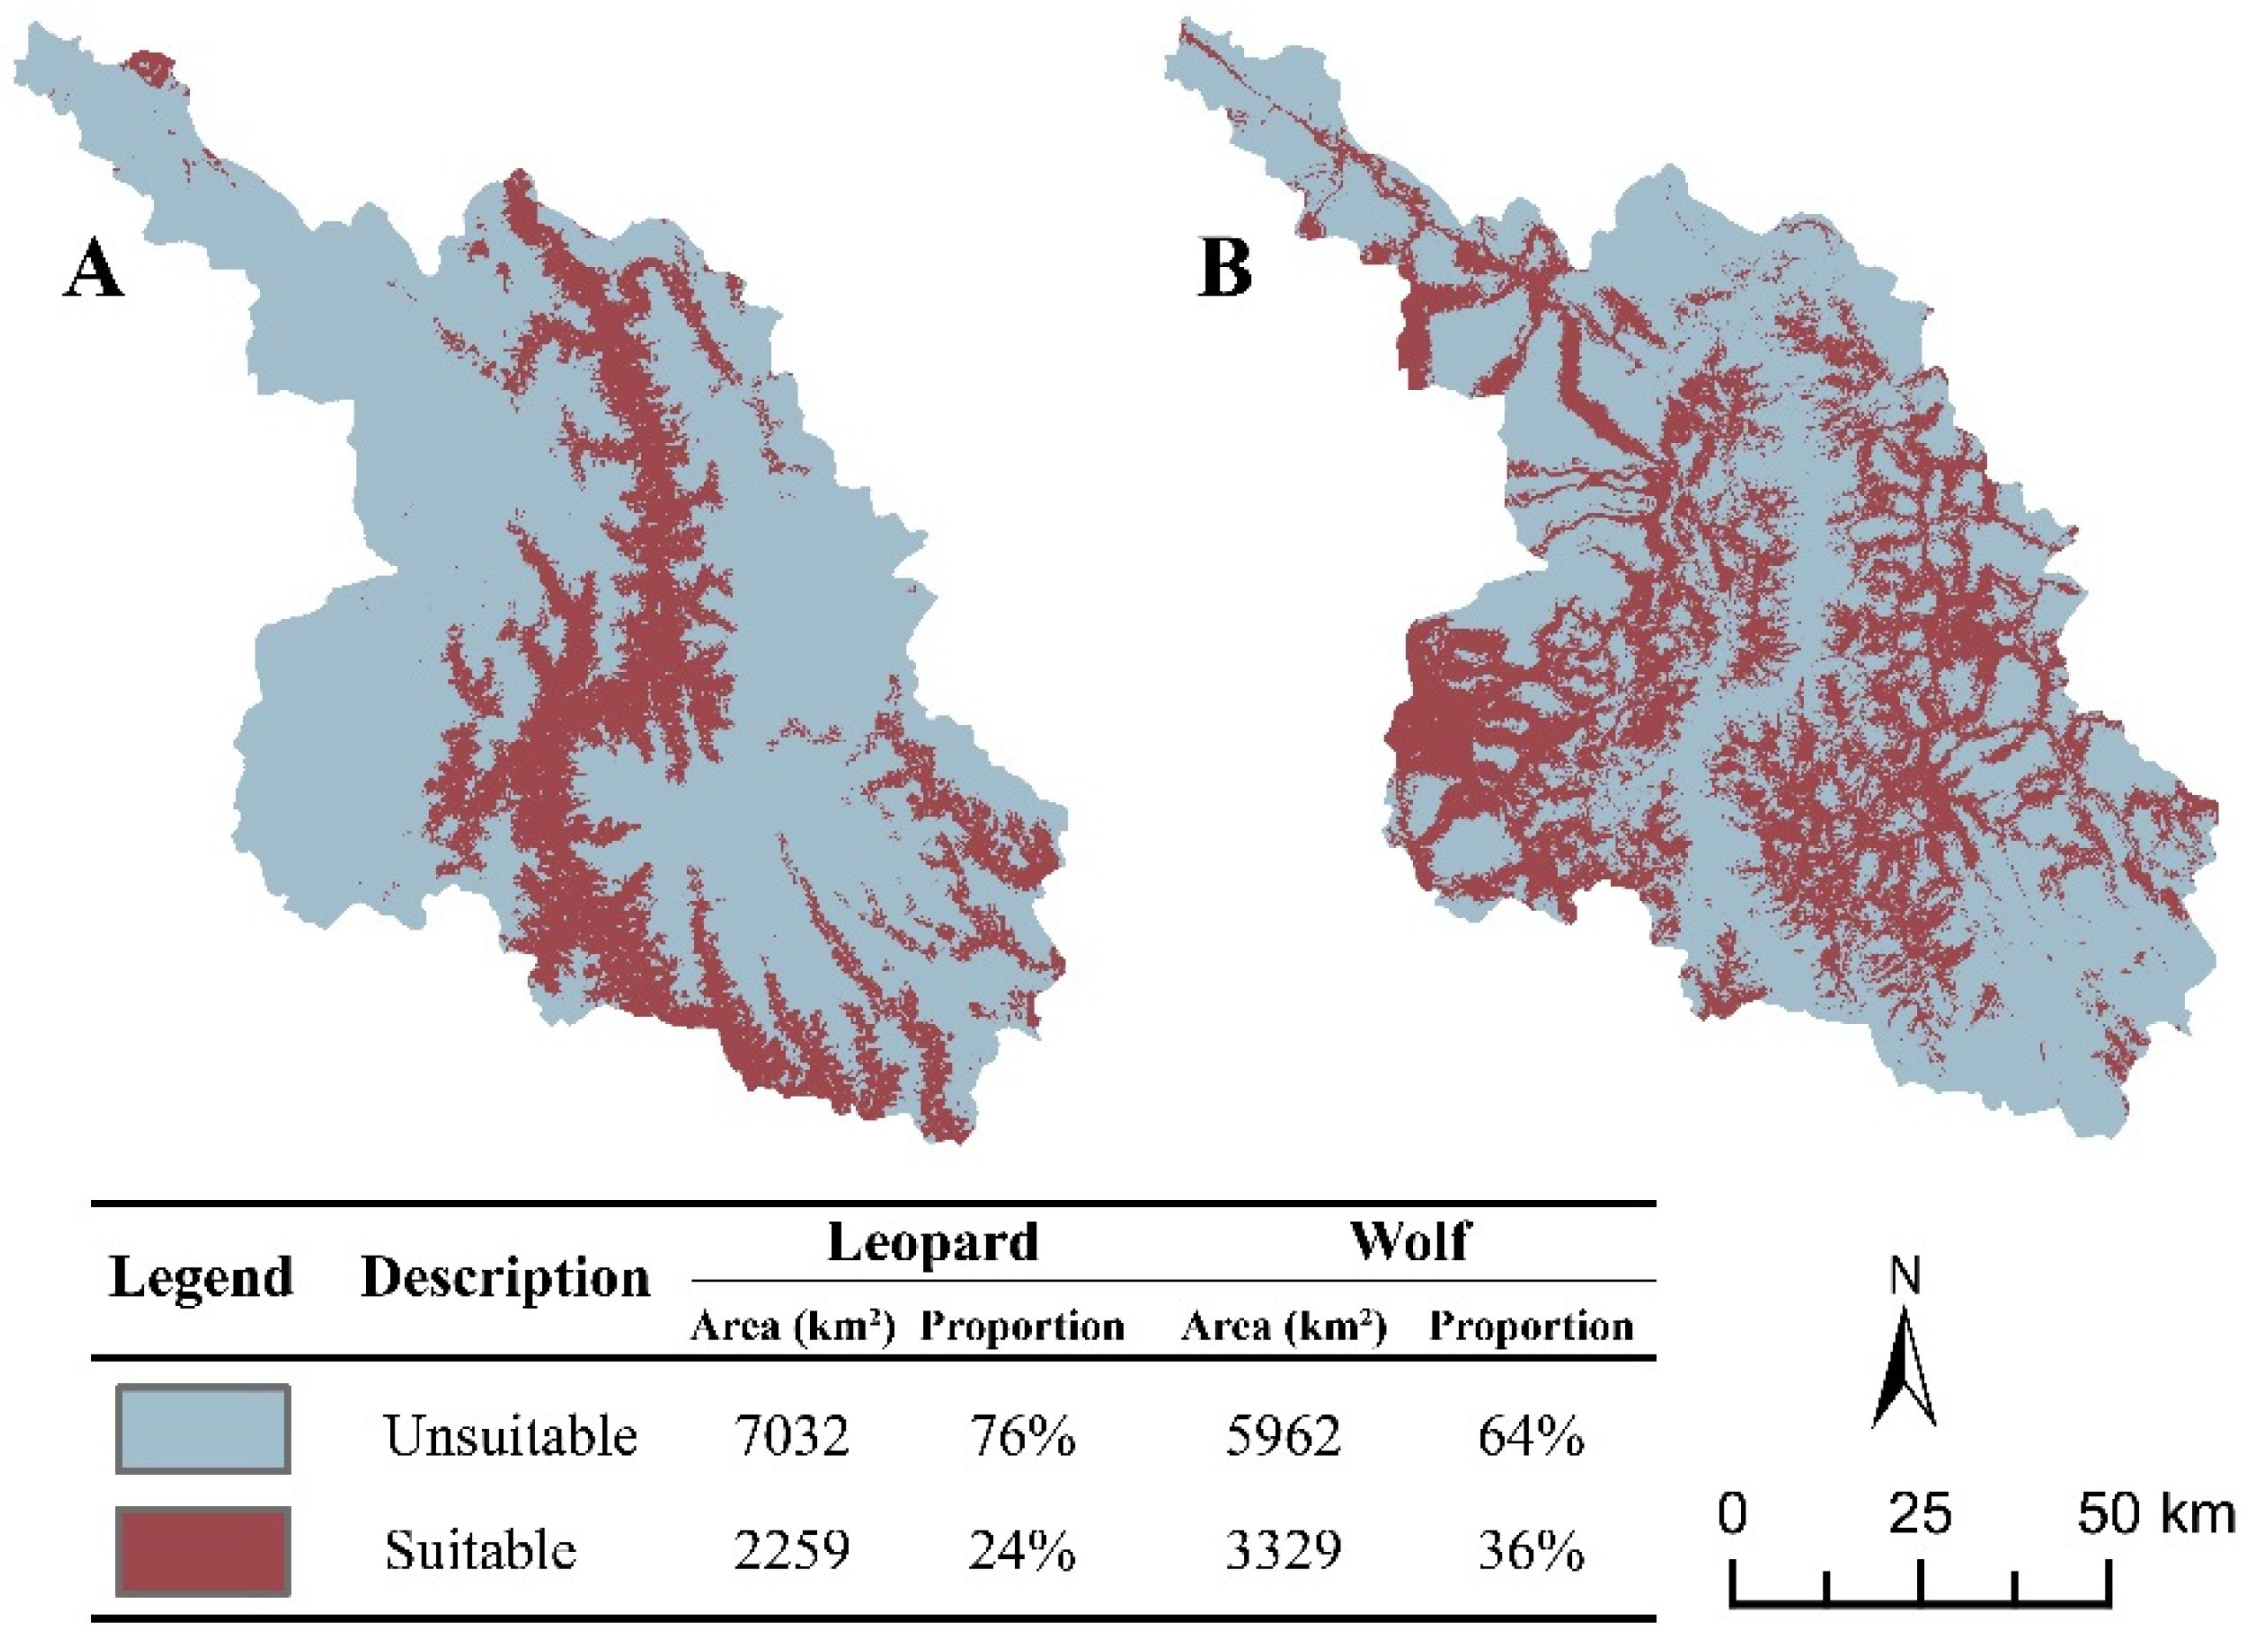
3.3. Habitat Suitability Evaluation

The study area covers a total area of approximately 9291 km. The suitable habitat for leopards occupied an area of approximately 2259 km2, accounting for 24% of the total study area. Suitable habitats were predominantly distributed along both banks of the Yalong River and extended to surrounding areas (Figure 4A). Conversely, unsuitable habitats covered an area of approximately 7032 km2, representing 76% of the total study area. It was primarily located in the eastern and western parts of the study area (Figure 4A). The suitable habitat for wolves accounted for 36% of the total study area, covering approximately 3329 km. It was mainly distributed in the northwestern, southwestern, and eastern regions of the study area (Figure 4B). In contrast, unsuitable habitats occupied approximately 5962 km2, accounting for 64% of the study area. It was concentrated in the southeastern part of the study area (Figure 4B).
Overall, the suitable habitat for leopards was smaller than that for wolves within the study area, and the distribution of their most suitable habitats tended to be separate.

3.4. Habitat Suitability Landscape Evaluation

The landscape pattern of the study area was assessed using Fragstats 4.2 software, which analyzes several landscape metrics, including PLAND, PD, ED, LSI, AI, CONNECT, and PAFRAC. The findings are summarized as follows (Table 2): (1) Area index: The PLAND of wolves (52.14%) was nearly twice as large as that of leopards (27.65%), indicating a greater extent of suitable habitat patches for wolves than for leopards. (2) Fragmentation index: The number of patches per unit area of suitable habitat was 0.45/km2 for leopards and 1.99/km2 for wolves, suggesting a high degree of fragmentation in the suitable habitat of wolves than that of leopards. (3) Shape index: Both the ED and LSI values were higher for wolves (ED: 35.09 m/ha, LSI: 118.24) than for leopards (ED: 11.78 m/ha, LSI: 54.75), indicating irregular and complex shapes of suitable habitats for wolves. (4) Patch aggregation index: Both leopards and wolves exhibited a high aggregation of suitable habitats with values close to 100%. (5) Habitat connectivity index (threshold of 500 m): Both leopards and wolves exhibited a low aggregation of suitable habitats, with values close to 0%, indicating that habitat connectivity for both was deficient. (6) Disturbance index: The landscape shape complexity of suitable habitats for both leopards and wolves was moderate, as indicated by the PAFRAC values (leopard: 1.34, wolf: 1.46).

3.5. Spatial Interactions

Based on the results of the ensemble model, we selected the environmental variables TD, DTC, and WB for leopards and ELE, DTD, SLP, DTC, and BP for wolves as influential factors for the two-species occupancy model. According to the two-species occupancy model outcomes, the model with the lowest ΔAIC was chosen as the optimal one (Table S3). In scenarios where leopards held dominance, wolves exhibited spatial avoidance behavior toward leopards (SIF = 0.88 ± 0.55). Furthermore, the occupancy rate of wolves in areas where leopards were present was lower than in areas where leopards were absent (psiBA = 0.44 ± 0.27 < psiBa = 0.61 ± 0.21). Conversely, when wolves were the dominant species, their spatial distribution appeared independent of leopards (SIF = 1).

4. Discussion

Understanding variations in suitable habitat selection among large carnivores is crucial for understanding multispecies competition and coexistence. It also enhances our knowledge of ecological behaviors, adaptations, and interactions with the environment. Such insights are vital for the development of effective conservation and management strategies [10,30,31]. We revealed the following insights: (1) large differences in the distribution of suitable habitats for leopards and wolves in Xinlong County; (2) wolves spatially avoided leopards; and (3) both leopards and wolves showed an aggregated distribution of suitable habitats, but habitat connectivity was low. Although the area of the wolf-suitable habitat was larger than that of the leopard, wolf habitat fragmentation was higher, and the shape of habitat patches was more complex, indicating that it was more affected by human activities.

4.1. Divergent Suitable Habitat Selection

The predicted suitable habitat for the sympatric leopard in Xinlong County is mainly in the understory area, and for the wolf, it is mainly in the meadow area. The results of the environmental factor responses reflect this difference: leopards preferred areas close to cliffs, whereas wolves preferred areas at higher elevations, farther away from cliffs, and with gentle slopes. This may be related to large differences in the ecological habits of leopards and wolves. Habitat studies on leopards and wolves have indicated that leopards usually prefer the understory, whereas wolves choose to move in open meadows [32,33]. This is related to their environmental adaptations, such as coat color, senses, and herding. Research has revealed a correlation between the dappled patterns on a leopard’s body and patches of sunlight filtering through vegetation, aiding camouflage during forest hunting [34]. In mountainous grassland areas, wolves usually have gray or brown fur, making it easy to hide [35]. Leopards possess exceptional visual acuity, enabling them to detect potential prey with keenness. They are skilled climbers and jumpers that are well-suited for ambushing prey in forested areas. In contrast, wolves possess a highly developed sense of smell and excel at tracking their prey. They are adapted to endurance running and adept at navigating vast wilderness areas in search of prey [36].
The divergent distribution of suitable habitats may also be linked to interspecific interactions between leopards and wolves. The coexistence of large carnivores within the same range can engender intense interspecific competition due to their similar ecological niches [37]. The results of the two-species occupancy model indicated that leopards occupied a dominant role and wolves were subordinates. Furthermore, based on the responses of leopards and wolves to different prey variables, the distribution of leopards was mainly affected by high quality prey (tufted deer), while wolves was mainly affected by inferior prey (blood pheasants). Owing to the abundant prey resources within the territory of Xinlong County [17], even if wolves are relegated to comparatively subpar habitats, they can ensure population survival. This outcome further bolsters the notion that interspecific competition will likely exist between coexisting leopards and wolves in Xinlong County. Furthermore, leopards, being the dominant species, tend to occupy premium resources while relegating wolves to less favorable habitats, thereby facilitating niche differentiation and coexistence.

4.2. Habitat Fragmentation

The habitat fragmentation analysis revealed that both leopards and wolves exhibited high levels of aggregation in suitable habitat patches; however, habitat connectivity remained notably low. This phenomenon is primarily attributed to human activities. The distribution of suitable leopard habitats coincides, to some extent, with areas of human settlement, inevitably subjecting habitat connectivity to disturbances arising from anthropogenic actions such as logging and grazing [38]. The fragmentation of wolf habitats surpasses that of leopards, manifesting in more intricate habitat shapes and indicating a greater impact by human activities. Our findings highlight that wolves prefer areas closer to human settlements (Figure S1). This preference could be linked to the predation of domestic cattle, as residents tend to release cattle in areas closer to their homes. Concurrently, under interspecific suppression imposed by leopards, wolves may be forced to accept relatively inferior prey resources, whereas domestic cattle represent a high-quality food source in terms of ease of capture and nutritional value, which makes wolves prefer to target them [39]. This scenario could potentially escalate human–wolf conflicts within the region, ultimately posing a threat to the quality of wolf habitats.

4.3. Conclusions and Conservation Recommendations

Understanding the disparities in habitat selection and responses to environmental factors between leopards and wolves has profound implications for comprehending the competition and coexistence dynamics among large carnivores and devising scientifically informed conservation management strategies. This study emphasizes that large carnivores, such as leopards and wolves, leverage variations in habitat selection to facilitate spatial niche differentiation. Further investigations at finer scales are imperative for a more comprehensive understanding of competition and coexistence, encompassing temporal activity and dietary differences.
Our findings revealed minimal habitat connectivity and pronounced fragmentation of habitats suitable for leopards and wolves. This phenomenon can potentially impede the maintenance of large carnivore populations within the Xinlong region and subsequently disrupt the equilibrium of the entire ecosystem [1]. Moreover, the looming concern of escalated human–wolf conflicts could further compromise the quality of wolf habitats. The gradual implementation of strategies such as enclosed cattle husbandry, accompanied by judicious ecological compensation measures, might prove instrumental in alleviating this issue [38].

Supplementary Materials

The following supporting information can be downloaded at: https://www.mdpi.com/article/10.3390/d15090968/s1, Table S1: Description of environmental variables in the Ensemble model; Table S2: Evaluation Indicators of Habitat Landscape Characteristics and Their Ecological Significance, Table S3: Results of the Conditional Two-Species Occupancy Model, Figure S1: Environmental response curves with relatively low variable importance values.

Author Contributions

Conceptualization, T.T., X.C. and B.Y.; methodology, T.T., X.C. and H.P.; formal analysis, T.T., X.C. and H.P.; investigation, T.T., X.C., Y.J., X.Z., Y.X. and D.S.; writing—original draft preparation, T.T.; writing—review and editing, X.C., B.Y. and L.Z.; visualization, T.T., X.C. and H.P.; resources, X.C., B.Y. and L.Z.; data curation, T.T. and X.C.; funding acquisition, B.Y. and L.Z.; project administration, X.C. and Y.J. All authors have read and agreed to the published version of the manuscript.

Funding

This research was founded by the Ant Group and China Environmental Protection Foundation (2222000094).

Institutional Review Board Statement

Not applicable.

Data Availability Statement

The data presented in this study are available on request from the corresponding author.

Acknowledgments

The work received financial support from the Ant Group and China Environmental Protection Foundation. We thank the support from the Sichuan Protected Areas Station and the Sichuan Wildlife Investigation and Protection Station.

Conflicts of Interest

The authors declare no conflict of interest.

References

  1. Ripple, W.J.; Estes, J.A.; Beschta, R.L.; Wilmers, C.C.; Ritchie, E.G.; Hebblewhite, M.; Berger, J.; Elmhagen, B.; Letnic, M.; Nelson, M.P.; et al. Status and Ecological Effects of the World’s Largest Carnivores. Science 2014, 343, 1241484. [Google Scholar] [CrossRef] [PubMed]
  2. Li, Z.; Duo, L.; Li, S.; Wang, T. Competition and coexistence among terrestrial mammalian carnivores. Biodivers. Sci. 2021, 29, 81–97. [Google Scholar] [CrossRef]
  3. Marske, K.A.; Lanier, H.C.; Siler, C.D.; Rowe, A.H.; Stein, L.R. Integrating Biogeography and Behavioral Ecology to Rapidly Address Biodiversity Loss. Proc. Natl. Acad. Sci. USA 2023, 120, e2110866120. [Google Scholar] [CrossRef] [PubMed]
  4. Ali, H.; Din, J.U.; Bosso, L.; Hameed, S.; Kabir, M.; Younas, M.; Nawaz, M.A. Expanding or Shrinking? Range Shifts in Wild Ungulates under Climate Change in Pamir-Karakoram Mountains, Pakistan. PLoS ONE 2021, 16, e0260031. [Google Scholar] [CrossRef]
  5. Hardin, G. The Competitive Exclusion Principle: An Idea That Took a Century to Be Born Has Implications in Ecology, Economics, and Genetics. Science 1960, 131, 1292–1297. [Google Scholar] [CrossRef]
  6. Odden, M.; Wegge, P.; Fredriksen, T. Do Tigers Displace Leopards? If so Why? Ecol. Res. 2010, 25, 875–881. [Google Scholar] [CrossRef]
  7. Widodo, F.A.; Imron, M.A.; Sunarto, S.; Giordano, A.J. Carnivores and Their Prey in Sumatra: Occupancy and Activity in Human-Dominated Forests. PLoS ONE 2022, 17, e0265440. [Google Scholar] [CrossRef]
  8. Ahmad, F.; Nawaz, M.A.; Salim, M.; Rehan, M.; Farhadinia, M.; Bosso, L.; Kabir, M. Patterns of Spatial Distribution, Diel Activity and Human-Bear Conflict of Ursus thibetanus in the Hindu Kush Mountains, Pakistan. Glob. Ecol. Conserv. 2022, 37, e02145. [Google Scholar] [CrossRef]
  9. Fennell, J.G.; Talas, L.; Baddeley, R.J.; Cuthill, I.C.; Scott-Samuel, N.E. Optimizing Colour for Camouflage and Visibility Using Deep Learning: The Effects of the Environment and the Observer’s Visual System. J. R. Soc. Interface 2019, 16, 20190183. [Google Scholar] [CrossRef]
  10. Shahsavarzadeh, R.; Hemami, M.-R.; Farhadinia, M.S.; Fakheran, S.; Ahmadi, M. Spatially Heterogeneous Habitat Use across Distinct Biogeographic Regions in a Wide-Ranging Predator, the Persian Leopard. Biodivers. Conserv. 2023, 32, 2037–2053. [Google Scholar] [CrossRef]
  11. Ngoprasert, D.; Lynam, A.J.; Gale, G.A. Human Disturbance Affects Habitat Use and Behaviour of Asiatic Leopard Panthera pardus in Kaeng Krachan National Park, Thailand. Oryx 2007, 41, 343–351. [Google Scholar] [CrossRef]
  12. Haddad, N.M.; Brudvig, L.A.; Clobert, J.; Davies, K.F.; Gonzalez, A.; Holt, R.D.; Lovejoy, T.E.; Sexton, J.O.; Austin, M.P.; Collins, C.D.; et al. Habitat Fragmentation and Its Lasting Impact on Earth’s Ecosystems. Sci. Adv. 2015, 1, e1500052. [Google Scholar] [CrossRef]
  13. De Lima Filho, J.A.; Vieira, R.J.A.G.; De Souza, C.A.M.; Ferreira, F.F.; De Oliveira, V.M. Effects of Habitat Fragmentation on Biodiversity Patterns of Ecosystems with Resource Competition. Phys. A Stat. Mech. Its Appl. 2021, 564, 125497. [Google Scholar] [CrossRef]
  14. Ahmadi, M.; Balouchi, B.N.; Jowkar, H.; Hemami, M.-R.; Fadakar, D.; Malakouti-Khah, S.; Ostrowski, S. Combining Landscape Suitability and Habitat Connectivity to Conserve the Last Surviving Population of Cheetah in Asia. Divers. Distrib. 2017, 23, 592–603. [Google Scholar] [CrossRef]
  15. Liu, X. Overlapping Dietary and Food Ecological Niches of Three Species of Canids in Eastern Inner Mongolia. Master’s Thesis, Qufu Normal University, Qufu, China, 2009. [Google Scholar]
  16. Zafar-ul Islam, M.; Volmer, R.; Al Boug, A.; Shehri, A.A.; Gavashelishvili, A. Modelling the Effect of Competition for Prey and Poaching on the Population of the Arabian Leopard, Panthera pardus nimr, in Saudi Arabia (Mammalia: Felidae). Zool. Middle East 2020, 66, 95–106. [Google Scholar] [CrossRef]
  17. Xu, Y.; Wang, B.; Gu, X.; Song, D.; Yang, B. Camera Trapping Reveals Area of Conservation Significance for Large and Medium-Sized Mammals on the Eastern Tibetan Plateau. Oryx 2022, 56, 137–144. [Google Scholar] [CrossRef]
  18. Qiao, J. Distribution and Behavior of Leopard (Panthera pardus), Snow Leopard (Panthera unica) and Gray Wolf (Canis lupus) in Gongga Mountain, Sichuan Province. Master’s Thesis, Sichuan Agricultural University, Chengdu, China, 2022. [Google Scholar]
  19. Kamino, L.H.Y.; Stehmann, J.R.; Amaral, S.; De Marco, P.; Rangel, T.F.; de Siqueira, M.F.; De Giovanni, R.; Hortal, J. Challenges and Perspectives for Species Distribution Modelling in the Neotropics. Biol. Lett. 2011, 8, 324–326. [Google Scholar] [CrossRef] [PubMed]
  20. Liu, Z.; Gao, H.; Teng, L.; Su, Y.; Wang, X.; Kong, Y. Habitat suitability assessment of blue sheep in Helan Mountain based on MAXENT modeling. Acta Ecol. Sin. 2013, 33, 7243–7249. [Google Scholar] [CrossRef]
  21. Qi, Z.; Xu, W.; Xiong, X.; Ou, Y.; Zheng, H.; Gan, D. Assessment of potential habitat for Ursus thibetanus in the Qinling Mountains. Biodivers. Sci. 2011, 19, 343–352. [Google Scholar] [CrossRef]
  22. Yang, B.; Zhang, Q.; Wang, B.; Gong, X.; Duan, C.; Zhang, Y. The habitat suitability evaluation of Salweenia bouffordiana based on MaxEnt model. Acta Ecol. Sin. 2020, 40, 6077–6085. [Google Scholar] [CrossRef]
  23. Ancillotto, L.; Mori, E.; Bosso, L.; Agnelli, P.; Russo, D. The Balkan Long-Eared Bat (Plecotus kolombatovici) Occurs in Italy—First Confirmed Record and Potential Distribution. Mamm. Biol. 2019, 96, 61–67. [Google Scholar] [CrossRef]
  24. Kaky, E.; Nolan, V.; Alatawi, A.; Gilbert, F. A Comparison between Ensemble and MaxEnt Species Distribution Modelling Approaches for Conservation: A Case Study with Egyptian Medicinal Plants. Ecol. Inform. 2020, 60, 101150. [Google Scholar] [CrossRef]
  25. Brito, J.C.; Crespo, E.G.; Paulo, O.S. Modelling Wildlife Distributions: Logistic Multiple Regression vs Overlap Analysis. Ecography 1999, 22, 251–260. [Google Scholar] [CrossRef]
  26. Qing, J.; Yang, Z.; He, K.; Zhang, Z.; Gu, X.; Yang, X.; Zhang, W.; Yang, B.; Qi, D.; Dai, Q. The Minimum Area Requirements (MAR) for Giant Panda: An Empirical Study. Sci. Rep. 2016, 6, 37715. [Google Scholar] [CrossRef]
  27. Swets, J. Measuring the Accuracy of Diagnostic Systems. Science 1988, 240, 1285–1293. [Google Scholar] [CrossRef] [PubMed]
  28. Allouche, O.; Tsoar, A.; Kadmon, R. Assessing the Accuracy of Species Distribution Models: Prevalence, Kappa and the True Skill Statistic (TSS). J. Appl. Ecol. 2006, 43, 1223–1232. [Google Scholar] [CrossRef]
  29. Richmond, O.M.W.; Hines, J.E.; Beissinger, S.R. Two-Species Occupancy Models: A New Parameterization Applied to Co-Occurrence of Secretive Rails. Ecol. Appl. 2010, 20, 2036–2046. [Google Scholar] [CrossRef] [PubMed]
  30. Yang, H.; Zhao, X.; Han, B.; Wang, T.; Mou, P.; Ge, J.; Feng, L. Spatiotemporal Patterns of Amur Leopards in Northeast China: Influence of Tigers, Prey, and Humans. Mamm. Biol. 2018, 92, 120–128. [Google Scholar] [CrossRef]
  31. Karanth, K.U.; Srivathsa, A.; Vasudev, D.; Puri, M.; Parameshwaran, R.; Kumar, N.S. Spatio-Temporal Interactions Facilitate Large Carnivore Sympatry across a Resource Gradient. Proc. R. Soc. B 2017, 284, 20161860. [Google Scholar] [CrossRef]
  32. Wei, W. The Suitability Evaluation of Amur Tiger (Panthera tigris altaica) and Amur Leopard (Panthera pardus orientalis) Habitat Based on Remote Sensing and GIS. Master’s Thesis, JiLin University, Changchun, China, 2019. [Google Scholar]
  33. Han, L. Habitat Selectivities and Seasonal Variations of Wolves (Canis lupus) in Mount Kalamaili Ungulate Nature Reserve, Xinjiang, China. Master’s Thesis, Xinjiang University, Urumqi, China, 2015. [Google Scholar]
  34. Allen, W.L.; Cuthill, I.C.; Scott-Samuel, N.E.; Baddeley, R. Why the Leopard Got Its Spots: Relating Pattern Development to Ecology in Felids. P. Roy. Soc. B-Biol. Sci. 2010, 278, 1373–1380. [Google Scholar] [CrossRef] [PubMed]
  35. Bannasch, D.L.; Kaelin, C.B.; Letko, A.; Loechel, R.; Hug, P.; Jagannathan, V.; Henkel, J.; Roosje, P.; Hytonen, M.K.; Lohi, H.; et al. Dog Colour Patterns Explained by Modular Promoters of Ancient Canid Origin. Nat. Ecol. Evol. 2021, 5, 1415. [Google Scholar] [CrossRef] [PubMed]
  36. Botts, R.T.; Eppert, A.A.; Wiegman, T.J.; Blankenship, S.R.; Rodriguez, A.; Wagner, A.P.; Ullrich, S.E.; Allen, G.R.; Garley, W.M.; Asselin, E.M.; et al. Does Moonlight Increase Predation Risk for Elusive Mammals in Costa Rica? Trop. Conserv. Sci. 2020, 13, 194008292095240. [Google Scholar] [CrossRef]
  37. Palomares, F.; Caro, T.M. Interspecific Killing among Mammalian Carnivores. Am. Nat. 1999, 153, 492–508. [Google Scholar] [CrossRef] [PubMed]
  38. Liu, M.; Wang, Y.; Xia, F.; Bu, H.; Liu, Y.; Shen, X.; Li, S. Free-Ranging Livestock Altered the Spatiotemporal Behavior of the Endangered North Chinese Leopard (Panthera pardus japonensis) and Its Prey and Intensified Human–Leopard Conflicts. Integr. Zool. 2023, 18, 143–156. [Google Scholar] [CrossRef]
  39. Xinning, S.; Dazhao, S.; Qiaowen, H.; Sheng, L.; Meng, Y. Fast Surveys and Molecular Diet Analysis of Carnivores Based on Fecal DNA and Metabarcoding. Biodivers. Sci. 2019, 27, 543. [Google Scholar] [CrossRef]
Figure 1. (a) Global distribution range of leopards and wolves; (b) The location of Xinlong region in the mountains of southwest China; (c) Distribution of camera-trapping in Xinlong County.
Diversity 15 00968 g001
Figure 2. Importance of environmental variables for suitable habitat. A pink solid circle represents leopards, while blue represents wolves. The size of the circle corresponds to the magnitude of the value, with larger circles indicating higher values. The vertical-axis represents 14 environmental variables, including WB (wild boar), TD (tufted deer), SLP (slope), HR (horse), EVI (Enhanced Vegetation Index), ELE (elevation), DTW (distance to water), DTV (distance to valleys), DTS (distance to settlements), DTR (distance to ridges), DTD (distance to roads), DTC (distance to cliffs), BS (blue sheep), and BP (blood pheasant). The horizontal axis represents the relative importance values of each environmental variable in contributing to the model.
Diversity 15 00968 g002
Figure 3. Leopards (above) and wolves (below) environmental response curves. The first row, from left to right, represents the response value changes of leopards to DTC (distance to cliffs), TD (tufted deer), and WB (wild boar). The second row, from left to right, represents the response value changes of wolves to DTC, ELE (elevation), and DTD (distance to roads). The third row, from left to right, represents the response value changes of wolves to SLP (slope) and BP (blood pheasant). Gray-shaded areas represent 95% confidence intervals.
Diversity 15 00968 g003
Figure 4. Distribution of habitat suitability for leopards (A) and wolves (B) in Xinlong County. Gray–red for suitable habitat distribution and gray–blue for unsuitable habitat distribution.
Diversity 15 00968 g004
Table 1. AUC and TSS values of different species distribution models.
SpeciesGLMMaxEntEnsemble Model
AUCTSSAUCTSSAUCTSS
Leopard0.870.690.750.630.810.67
Wolf0.780.690.630.650.710.67
AUC: values between 0.5 and 0.6 indicate model failure, whereas those from 0.6 to 0.7 indicate poor performance; 0.7 to 0.8 indicate moderate performance; 0.8 to 0.9 indicate good performance; and 0.9 to 1.0 indicate excellent performance TSS: values below 0.4, failure; 0.4 to 0.55, poor performance; 0.55 to 0.7, moderate performance; 0.7 to 0.85, good performance; and 0.85 to 1, excellent performance.
Table 2. Evaluation indices of landscape characteristics of suitable habitats for leopards and wolves.
SpeciesPLANDPDEDLSIAICONNECT PAFRAC
Leopard27.650.4511.7854.7596.820.111.34
Wolf52.141.9935.09118.2494.940.041.36
The percentage of landscape (PLAND) is the percentage (%) of the total area of a certain patch type in the entire landscape area. Patch Density (PD) indicates the number of patches per unit area, reflecting the fragmentation of the landscape. Edge Density (ED) reflects the degree of landscape fragmentation: the larger the value, the greater the degree of fragmentation. Landscape Shape Index (LSI) calculates the deviation degree of patch edge shape from a circle or square in the landscape. The closer the value was to 1, the closer the patch shape was to a circle or square. Aggregation Index (AI) reflects the aggregation between patches of the same type: the smaller the value, the more discrete the landscape. Connectance Index (CONNECT) reflects the connectivity between patch types: the higher the value, the higher the landscape connectivity. Perimeter-Area Fractal Dimension (PAFRAC) reflects the complexity of the landscape shape, 1 ≤ PAFRAC ≤ 2: the closer it tends to 1, the simpler the landscape shape is, and it may be less disturbed by humans.
Disclaimer/Publisher’s Note: The statements, opinions and data contained in all publications are solely those of the individual author(s) and contributor(s) and not of MDPI and/or the editor(s). MDPI and/or the editor(s) disclaim responsibility for any injury to people or property resulting from any ideas, methods, instructions or products referred to in the content.

