
Soil Horizons Harbor Differing Fungal Communities
by
 , , and
Enno Mager
1,2,
Ronja Brockhage
3,
Meike Piepenbring
2,
Francisca Segers
4,5,
Nourou Soulemane Yorou
6,
Ingo Ebersberger
4,5,7 and
Ralph Daniel Mangelsdorff
2,* 1
Department of Forest Protection, Bavarian State Institute of Forestry and Forest Sciences, 85354 Freising, Germany
2
Mycology Research Group, Faculty of Biological Sciences, Goethe University Frankfurt, 60438 Frankfurt am Main, Germany
3
Landschaftspflegeverband Naturschutzfonds Wetterau e.V., Homburger Straße 17, 61169 Friedberg, Germany
4
Applied Bioinformatics Group, Faculty of Biological Sciences, Goethe University Frankfurt, 60438 Frankfurt am Main, Germany
5
LOEWE Centre for Translational Biodiversity Genomics (TBG), 60325 Frankfurt am Main, Germany
6
Research Unit Tropical Mycology and Plants-Soil Fungi Interactions (MyTIPS), Faculty of Agronomy, University of Parakou, Parakou BP 123, Benin
7
Senckenberg Biodiversity and Climate Research Centre, 60325 Frankfurt am Main, Germany
*
Author to whom correspondence should be addressed.
Diversity 2024, 16(2), 97; https://doi.org/10.3390/d16020097
Submission received: 31 December 2023
/
Revised: 24 January 2024
/
Accepted: 29 January 2024
/
Published: 1 February 2024
(This article belongs to the Special Issue Biodiversity and Ecology of Soil Fungal Communities)
Abstract
:In the present study, the mycobiomes of two soils with different ecological conditions located in Benin (West Africa) were investigated by environmental sequencing (Illumina MiSeq) of the ITS2-region of ribosomal DNA to gain information about the influence of pedological stratification on fungal diversity. For each soil depth and horizon, fungal diversity and community composition were analyzed as well as the potential impact of site characteristics, like vegetation, on these traits. The retrieved sequences revealed in all their replicates high similarities between fungal communities of samples from the same site and soil horizon, but differed within one site in their horizons. It was possible to assign a saprotrophic, symbiotrophic, or parasitic lifestyle to 24% of the recorded fungal mOTUs. Plant parasites were found in all samples in similar proportions. The presence of ectomycorrhizal fungi in one site could be linked to the presence of ectomycorrhizal trees. Overall, it was observed that fungal diversity decreased with increasing depth if only one horizon was present, whereas a deeper horizon present at one site contained communities with a distinct composition regarding the taxonomical affiliations and lifestyles of the fungi found compared to the upper layer. Hence, soil horizonation seems to drive differences in the composition of fungal communities, and should be regarded with more attention when analyzing soil mycobiomes.
Keywords:
Benin; ectomycorrhiza; eDNA; fungi; fungal lifestyle; inselberg; lichens; soil fungi; soil horizons1. Introduction
Fungi occupy ecological key positions as decomposers, commensals, symbionts, and parasites. They degrade organic and inorganic materials, are symbionts for the majority of the primary producers of terrestrial ecosystems, or live as parasites or parasitoids [1,2,3,4,5]. Soils are shaped by abiotic factors, e.g., bedrock, sedimentary deposition, precipitation, and temperature, as well as biotic factors, e.g., vegetation, fungi, and fauna like termites [6,7,8,9,10]. These factors cause the formation of soils and eventually distinct pedological horizons, that are characterized by unique properties like grain size distribution and pH, supporting a specific set of organisms to live in them [11].
Soils in tropical West African cratonic regions, like central Benin, are formed by precipitation patterns that change radically over time, leading to prolonged dry and wet periods [12]. By profound weathering of the bedrock, stable minerals like goethite, haematite, gibbsite, and quartz are enriched in these layers. After the quartz has weathered away, the residues form laterite that acts as a protective shield against erosion in wet periods but is physically eroded by temperature changes and wind. Due to this, ground levels have subsided by several kilometers. Soils in the West African savannah belt that were formed by these processes are nutrient-poor, acidic, and very deep. Old plutonic magma chambers withstand erosion and remain as inselbergs in the landscape. Inselbergs are considered rather dry habitats because of increased runoff and shallow soils, but they can provide shade by clefts, where soil formation can take place, or fossil soils are conserved. This abiotic diversity is usually considered to be one of the reasons why these mountains are renowned as diversity hot spots in the region [8,13,14,15,16].
West Africa has a long settlement history with a high population density. For this reason, the entire area, except the inaccessible inselbergs, is utilized and regularly burned by humans. Human activities like tillage disturb the natural formation of soil horizons and in combination with torrential precipitation events promote erosion. In the plains, woodlands have formed in areas that are mainly used for grazing cattle. On top of the inselbergs, however, some isolated patches of vegetation are not reached by the annual fires, and forests with older trees can be found. Here, the formation of organic layers and soil horizons is enabled.
Due to the deposition of organic material on the soil surface, the topsoil layer has the highest availability of nutrients and is considered biologically most active. Its direct contact with the free air body makes the oxygen content highest [5], which is relevant for vertical biological activity of the several-meter-deep Ferralsols found in such regions in Benin, West Africa.
In order to determine fungal diversity in soils, culture trials, microscopical studies, and environmental sequencing have been used to analyze samples from numerous locations [11,17,18,19,20,21]. Most investigations focusing on fungal diversity in soils were carried out in temperate and subtropical regions, while tropical regions, especially Africa, remain understudied [1,21,22,23,24,25,26,27,28,29,30,31,32]. For Western Africa, only a few environmental sequencing studies, targeting exclusively top soils, have been conducted [2,33].
A common approach for the analysis of environmental sequencing data to assess fungal diversity is clustering. Hereby, global thresholds are used to achieve discrimination of mOTUs (molecular operational taxonomic units) [2,20,33,34]. Afterwards, these mOTUs are assigned to taxa and ecological functions based on information in databases [2,33,35,36,37].
To obtain more representative data, several soil samples are pooled together, allowing for the detection of a higher portion of the fungal diversity present at a certain site at a reasonable expense [2,38]. By isolation trials of soil samples with different pH-values and pedological horizons in temperate regions, it was shown in the 1950s that these characteristics lead to different fungal communities, and it was suggested that soil horizonation should be taken into account. Nevertheless, lower pedological horizons seemed to contain a subset of topsoil fungal communities [11].
In the last decades, some further investigations have been conducted in temperate and subtropical regions. Voríšková et al. [24] investigated the vertical distribution of soil fungi within the L, F, and Ah horizons in a Quercus petraea-forest and found a decreasing number of OTUs in the Ah-horizon, next to a higher proportion of EcM-fungi. Yang et al. [25] investigated vertical fungal distribution in a high-elevation desert environment in China and found that over a distance of 900 km, the fungal community composition in the upper 15 cm was more similar to each other than between the upper layer and the second soil layer at 15–30 cm. Luo et al. [22] investigated the vertical distribution of fungi in the organic and mineral layer of a mixed deciduous-coniferous subtropical forest in China. Like the other investigations, a higher difference was observed between the two layers than between the organic layers of different sites.
The majority of research focused on topsoils to inventory the mycoedaphon e.g., [2,23,33,39]. Due to this limitation, the composition of fungal communities with regard to soil horizonation, their turnover, and their lifestyle are poorly known.
In the present investigation, we address the following research questions: Do soils in tropical, semi-dry Western Africa harbor different fungal communities in the same soil horizon depending on the depth, or do deeper soil layers in the same soil horizon host a fraction of the upper layer? At sites where pedogenesis has caused horizonation, do we observe differing fungal communities above and below the limit between two soil horizons? We expect that the difference between fungal communities above and below the limit between the two horizons is larger than if we compare the upper and lower layers in the same soil horizon. Do soils that are disturbed due to tread, grazing, and fire host different fungal communities than sites that are less disturbed? We expect that there is a marked difference between a site with stable vegetation and a site with disturbed vegetation. Does the site with stable vegetation host more or less species-rich fungal communities than the site with disturbed vegetation? We expect the diversity to be higher at the disturbed site due to heterogeneity and higher richness of plant species.
2. Materials and Methods
2.1. Field Site Description
For this investigation of the vertical distribution of fungal communities in soils in Benin, West Africa, two soil-cores from two sites (site 1 and site 2) with different ecological conditions were sampled (Figure 1). The two sampling sites are located next to the Wari Maro forest reserve approximately 50 km southwest of the city of Parakou. The region has an elevation of around 210 to 640 m a. s. l. and a tropical savannah climate with dry winters and damp summers (AW climate) defined by the solar altitude [40]. These two sites represent the existing spectrum of rather natural soils present in the area and are characterized by a high degree of weathering resulting in deep and sesquioxide-rich soils (Table S2).
Site 1 (Figure 1A,C) is located in the plain, at 315 m a. s. l. at 9°08′36.3″ N 2°07′57.2″ E. It is located approximately 15 m from the road connecting Wari Maro (also written as Ouari Maro) and Wanou (Ouanaou). The soil-core was taken on the 5th of August 2016 in a small area with forest savannah surrounded by farmland. The site harbors diverse savannah vegetation including rather young trees of different ages interspaced with patches of grassland, other herbaceous plants, and footpaths (Table S1). In addition, the cycad Encephalartos barteri Carruth. ex Miq. ssp. barteri (Cycadales) is present. Since this species is of little use to the local communities, poisonous for the grazing cattle, slow growing, and has a low potential for long-distance dispersal, this indicates that the sampling site, at least during the last decades, had been a stable environment and is not a young fallow. According to local standards, the site can be considered undisturbed, but it is impacted by tread, grazing, and fire. To ensure conditions as natural as possible, the soil-core was taken right underneath the spiny fronds of one of the larger cycads. Through this, the sampling spot was protected from treading.
Site 2 (Figure 1B,D) is located near the top of the 640 m a. s. l. high inselberg Soubakpérou, with the coordinates 9°08′46.0″ N 2°09′38.7″ E. The sampling site is located right underneath the mountain’s peak in a cleft where the soil-core was taken on the 6th of August in 2016. Due to the steep flanks, the uppermost parts of the mountain are mostly surrounded by bare rock, and protected against the annual fires. Inside the mentioned cleft a small forest has formed consisting of trees of different ages (Table S2). The trees shade the ground to an extent that barely supports the growth of heliophilous plants like grasses (8% of the plant species at site 2 as opposed to 23% at site 1; Tables S2 and S3). Most of the surface is covered by leaf litter and dead wood, and even standing dead wood was noticed.
2.2. Experimental Design and Sampling
In order to reduce contamination, the two soil-cores were obtained by digging an annular hole around a standing soil pillar of approximately 25 cm in diameter. After reaching the maximum depth possible, the exposed cores were bandaged with medical gypsum bandages and cut loose. Each soil-core had a weight between 10 and 15 kg. After the cores were released, the cut faces were bandaged as well, and the orientations were marked. The cores were transported into the laboratory of the University of Parakou, where they were cut into a total of five pieces, weighing between two and five kilograms each, labeled, and covered again with bandages. These pieces were dried on desiccators at approximately 30–40 °C. The samples were shipped to the laboratory in Frankfurt, Germany, where they were treated with UV light to destroy organisms and DNA on the surface of the cores. Then the blocks were cut open and material was taken from their inner part.
The core from site 1 showed no soil horizonation and samples for environmental sequencing were taken from this first pedological horizon at a depth of one centimeter and a depth of 34 cm (Figure 1C). The soil at site 2, on top of the Soubakpérou inselberg showed a distinct horizonation. The first pedological horizon was sampled at a depth of 2 cm and the second pedological horizon was sampled twice, at depths of 26 cm and 47 cm (Figure 1D). All samples were coded by an Arabian number for the site, followed by a Roman number for the pedological horizon, followed by an Arabian number for the sample within the respective pedological horizon, and, if applicable, a letter denoting the replicate of the sample, e.g., 1/I1/a for the first replicate (a) of the sample from the upper level (1) of the first pedological horizon (I) of site 1.
2.3. Soil Characteristics
2.4. DNA Isolation and Analysis
The ITS2 sequences of the soil samples were sequenced on an Illumina MiSeq platform, clustered with SWARM and taxonomically assigned against reference sequence data of the Unite database. We chose a paired-end sequencing library layout, specified a read length of 280 base pairs, and took three to four replicates from each soil sample resulting in a total of 16 sub-samples. DNA was extracted from soil and then sequenced on an Illumina MiSeq platform targeting the region ITS2 using the ITS3 (5′ GCATCGATGAAGAACGCAGC 3′) and the ITS4 (5′ TCCTCCGCTTATTGATATGC 3′) primer binding site [42,43]. The sequencing was performed using the paired-end read mode and a read length of 280 base pairs. DNA extraction and sequencing were carried out by Eurofins Medigenomix GmbH (Ebersberg, Germany) using the procedures required by the company. A negative control was included during DNA extraction and sequencing to detect possible contaminations during laboratory handling.
2.5. Bioinformatics and Statistical Analyses
Sequence read sets were initially inspected and summary statistics were generated with FastQC (version 0.11.9) [44]. Low-quality regions were removed with Trimmomatics (version 0.36) [45]. The settings PE, SLIDINGWINDOW:4:15, and MINLEN:36 were used. The forward and reverse reads were merged using Pandaseq [46] with default settings. After that, a single linkage clustering of the contigs was performed with SWARM (version 2.0) [47] using the ‘fastidious’ option, a clustering threshold ‘d’ of 1, and the ‘-w’ option. In this process, two contigs with a number of substitutional differences not exceeding the clustering threshold are combined into one cluster. If a read cannot be linked to any other read, it forms the seed of a new cluster. This makes ‘d’ a local clustering threshold, meaning that it does not define the overall variability within a cluster. Since single linkage clustering approaches are prone to connect more divergent clusters via chains of individual merged reads, SWARM identifies and breaks up such chained clusters. Beyond this, for d = 1 the above-mentioned ‘fastidious’ option of SWARM allows the linkage of very small clusters to larger clusters in order to take randomly missing sequences into account and the ‘-w’ option allows the extraction of each cluster’s most frequent contig, called the representative sequence. MEGAN [48] (version 5) was used to assign mOTUs (molecular operational taxonomic units) taxonomically. For each MOTU, we used the representative sequence as a query for a BlastN search [49] against the Unite database [35]. The taxa represented by all Blast hits within a 10% bit score margin of the best hit were then extracted, and their last common ancestor was used as a tentative taxonomic assignment for the MOTU. In the next step, the taxonomic information and the abundances were used to create a MOTU table (Table S5).
2.6. α-Diversity
All mOTUs represented by less than six reads were removed [50]. For the remaining mOTUs an alignment was created using QIIMEs (version 1.9.1) ‘align seqs.py’ [51]. From this alignment, a phylogeny was calculated using QIIMEs script ‘make phylogeny.py’ selecting the method ‘fasttree’. For the next steps, a mapping file was generated manually and validated using QIIMEs script ‘validate mapping file.py’. To assess the completeness of the environmental sequencing, a multiple rarefaction analysis was conducted using QIIMEs script ‘alpha rarefaction.py’. Ten rarefactions were performed at each rarefaction depth between 1000 and 160,000 reads with steps of 1000. In order to compare the diversity of all samples, they were rarefied to 65,216 reads using QIIMEs script ‘single rarefaction.py’. Analyses of variance were performed for MOTU richness between sites, horizons, and samples. The α-diversity [52] was assessed using QIIMEs script ‘alpha diversity.py’. A Principal Coordinates Analysis (PCoA) was performed with QIIMEs script ‘principal coordinates.py’ and the first two dimensions were plotted to visualize the degrees of similarity between the samples and their replicates.
2.7. β-Diversity
The β-diversity was investigated using QIIMEs script ‘beta diversity.py’, specifying Bray–Curtis dissimilarity [53], unweighted unifrac, and weighed unifrac as metrics [54]. The result of the previous step was used to analyze the principal coordinates with QIIMEs script ‘principal coordinates.py’. The function generated a multidimensional matrix, that contained all samples and their principal coordinates.
2.8. Fungal Lifestyle
As a base for lifestyle assignments, an already existing dataset was used [2]. For this dataset, fungal genera were assigned to trophic classes, if at least 75% of the known species within a genus showed the same trait. These traits are either biotrophy, saprotrophy, or symbiotrophy. Fungal genera observed in this study, that were not included in the dataset, were assigned to a trait if at least 75% of the genera in the dataset that belong to the same family showed the same trait.
3. Results
3.1. Soil Characteristics
Two soils from central Benin, West Africa, were investigated. These soils represent Geric Ferralsols according to WRB (Table S3) [9]. The soil in the plain (site 1) presented a single horizon with uniform grain size distribution. There was no organic material on the surface and no topsoil enriched in organic material. The soil on the mountain (site 2) showed an abrupt increase of the clay fraction between the first soil horizon and the second soil horizon of approximately 11% (absolute). The pH of the soil on the mountain was much more acidic than the soil on the plain (Table 1).
3.2. DNA Isolation and Analysis
In total 2,250,129 read pairs were generated. Read pair counts for the individual samples ranged from a minimum of 76,125 for sample 1/I1/b to a maximum of 194,870 for sample 2/II2/a, with an average of 74.81% of their bases having a quality score of at least 30 (<0.1% sequencing error) (Table S4). After trimming and merging, out of 2,250,129 read pairs, 2,157,782 (96%) contigs were generated. The negative control yielded less than 2.5% of the reads of an average sample. Due to this small fraction and the fact that the negative control contained mostly sequences of mOTUs (molecular operational taxonomic units) not present in the samples (e.g., Malassezia sp. and Rhizocarpon sp.), the amount of contamination in the data was negligible.
3.3. α-Diversity
The 2,157,782 reads were grouped into 219,775 clusters. After the removal of clusters with less than six reads, 4299 mOTUs remained representing seven fungal phyla. While half of the mOTUs could be assigned on division and class level, only less than 2% of them could be assigned at species level (Table 2).
The multiple rarefaction analyses did not show a full saturation of the number of observed mOTUs. The number of mOTUs to be expected in the soils cannot be ascertained, since the counts of mOTUs were still rising at the highest rarefaction depths (Figure 2A). A total of 2421 mOTUs were observed in two samples from the soil in the plain, while on the mountain, a total of 2620 mOTUs could be observed in three samples from three levels of the soil-core. Analyses of variance of the number of mOTUs at a level of 66,000 contigs showed that the two sites and the three horizons are significantly different (significance level of 0.05) regarding their MOTU richness, while the samples taken from the same horizon, i.e., 1/I1 and 1/I2 as well as 2/II1 and 2/II2, were rather similar to each other. The communities in the deeper pedological horizon of site 2 overall appear poorer in mOTUs (Figure 2B). This analysis revealed 18 fungal species that could be identified at the species level (Table 3).
3.4. β-Diversity
Approximately 6.7% of the mOTUs are shared between all three pedological horizons investigated (Figure 2B). At site 1, where only one soil horizon was found, 49% of the mOTUs were shared between the two samples taken in different depths (Figure 2C) and at site 2, where two soil horizons were found, 49% of the mOTUs were shared in the soil horizon II at different depths (Figure 2D), while at site 2 only 27% of the mOTUs were shared between the samples taken from different pedological horizons (Figure 2B).
The fungal diversity of the two sites at different depths was also analyzed by a principal coordinate analysis (PCoA). The results show that fungal diversity within the same pedological horizon is similar, but differed between different pedological horizons and the two sites (Figure 3). Replicates taken at the same location at the same depth are highly similar regarding Bray-Curtis dissimilarity, unweighted unifrac dissimilarity, and weighted unifrac dissimilarity. In addition to this, the replicates from the two layers sampled at site 1 in the plain are alike, and the replicates from the two bottommost layers sampled at site 2 on the mountain are similar regarding all metrics. The samples taken in the topmost layer of the soil on the mountain were dissimilar to all samples taken from the deeper horizon regarding all metrics (Figure 4).
3.5. Fungal Lifestyle
The assignment of fungal lifestyles was possible for approximately 24% of all mOTUs (Table 4). Assignments at the family level increased the number of assigned mOTUs only slightly. The fraction of mOTUs that could be assigned was highest for both uppermost layers, while only a few mOTUs of deeper layers could be assigned to a lifestyle. The soil at site 2 showed a higher share of saprotrophic mOTUs among the assignable mOTUs than the soil at site 1. This was especially evident for the uppermost layers. Sequences of lichenized fungi were detected mainly in the top layer at site 2, while at site 1 no sequences of lichens were found at all. Arbuscular mycorrhizal fungi were detected in all pedological horizons at both sites, but they were more abundant in the topmost section of the first pedological horizon of site 1. Plant pathogenic fungi were present in all samples on both sides. Their number showed a slight decline with increasing depth, with numbers at site 1 being higher than those at site 2. The number of mOTUs assigned to fungi with ectomycorrhizal lifestyle was higher for the soil in the plain than for the soil on the mountain. The number of mycoparasitic fungi was low and decreased with increasing depth at both sites.
4. Discussion
4.1. Soil Characteristics
Both soils investigated in Benin are Ferralsols. Ferralsols are usually several meters deep, so during sampling the lowest pedological stratum was not reached at any of the two sites [9]. Both soils are acidic. Especially on the mountain (site 2), the soil is so acidic that aluminum is released and may be toxic for plants (Table 1 and Table S3) [7,8,9]. Pedological surveys conducted in and around the Wari Maro forest reserve found similar soils [55,56,57].
At site 1, only one soil horizon was found. Due to regular burning, washing off, and activity of termites, no organic residue remains at the surface for a prolonged period, i.e., no organic layer is present. Due to the location on top of the inselberg, pedogenesis at site 2 was different from site 1. At site 2, organic matter has accumulated, and the constant deposition of material from the surrounding boulders and leaching by rain caused the dislocation of clay particles that led to a soil horizonation (Table 1).
4.2. DNA Isolation and Analysis
Overall, the sequences of fungi obtained by environmental sequencing reveal a high sequencing quality (Table S4), which suggests that sequencing errors are unlikely to interfere with the taxonomic assignments. A correlation between the number of isolated contigs and the content of organic matter in the soils could not be observed. This phenomenon is mentioned by other investigators as well [2].
4.3. α-Diversity
Around one-half of the fungal mOTUs (molecular operational taxonomic units) that could be assigned to a lifestyle were found at both sites, one-third in all samples and more than three-quarters only in the upper layers. Different divisions, orders, and species of fungi were detected for the first time in Benin. The total number of fungal mOTUs is estimated to exceed 2421 for sampling site 1 in the plain. At sampling site 2, 2620 mOTUs were detected, including a total of 1695 mOTUs found at the upmost pedological horizon, and 1632 mOTUs at the second pedological horizon. Since the rarefaction analysis did not show saturation at the given sequencing depth, the true diversity is expected to be higher in all cases, especially at site 2. Although at site 1, fewer samples were taken and fewer contigs were analyzed than at site 2 (850,000 versus 1,400,000 contigs), only a slightly higher number of 2620 mOTUs was observed at site 2. In addition to this, individual samples taken at site 1 showed a higher diversity of mOTUs, if they are compared at an equal sample size (Figure 2). Hence, site 1 is considered to be more diverse concerning fungi than site 2, but a greater sequencing depth would be needed for more precise estimates.
By collecting macroscopically visible fungi over several years in a defined area, species counts in the range of 400 to 3500 are reached, mostly depending on the effort made in the surveys [28,58,59,60]. These investigations are difficult to compare with the present investigation, since they were made at different spatial (one to several hectares) and temporal (a few years to some decades) scales, and focused on macroscopically visible fungi. Species diversity is expected to be much higher when environmental sequencing is used since this approach can detect a high diversity of microfungi in addition to macrofungi. The present investigation surveyed soil-borne fungi, while above-ground mycodiversity (especially leaf-dwelling fungi) was only partially accessed. The fungal diversity in Benin was estimated to be low compared to the neighboring countries, although no numbers were provided [2]. According to the literature, only 432 fungal species are currently known to occur in Benin, but the diversity is expected to be much higher [30,32].
The fungal species identified within this study are the first records of species of the divisions Calcarisporiellomycota, Chytridiomycota, Kickxellomycota, and Mortierellomycota and the first finding of the order Rhytismatales for Benin [32]. From the fungal species to which mOTUs were assigned, 33% occurred in all soil samples (Table 3), whereas only 6.7% of all mOTUs occurred in all samples (Figure 2). 50% of all identified fungal species occurred in both sites, and 83% were only found in the upper layers (Figure 2). This indicates that mainly ubiquitous fungi are determinable and that fungal species occurring in the upper soil layers are better known than those in deeper layers. Apart from these species, many mOTUs could only be assigned to the genus level. Some of them belong to species of the genus Termitomyces (Agaricales), a group of saprotrophic fungi cultivated by termites. Termitomyces spp. and termites were observed at both sites.
Under ideal circumstances, such as a fully informative DNA region, complete databases, and perfect clustering, one species would be expected to form one mOTU. The 18 species closest to the mOTUs clustered by SWARM during this investigation (Table 3), however, correspond to a total of 75 mOTUs, resulting in an average of approximately four mOTUs per species. This can be interpreted in different ways. It could be assumed that every known species on average contains three further currently unrecognized (cryptic) species, or that the clustering was too strict and on average led to the splitting of one species into four mOTUs. The authors [23] of other studies have claimed that too short amplicons are the reason for such multiple assignments and that such shortcomings can be overcome by sequencing the entire ITS rDNA region. Due to the small number of records, the local restrictions of this analysis, and the high statistical deviation, the species assignments presented here should be taken with caution and only be seen as a hint. Out of these 18 species, only Marasmius ferruginoides had been reported from Benin before [61]. For 13 of the 18 species, the genera are cited for the first time for Benin.
4.4. β-Diversity
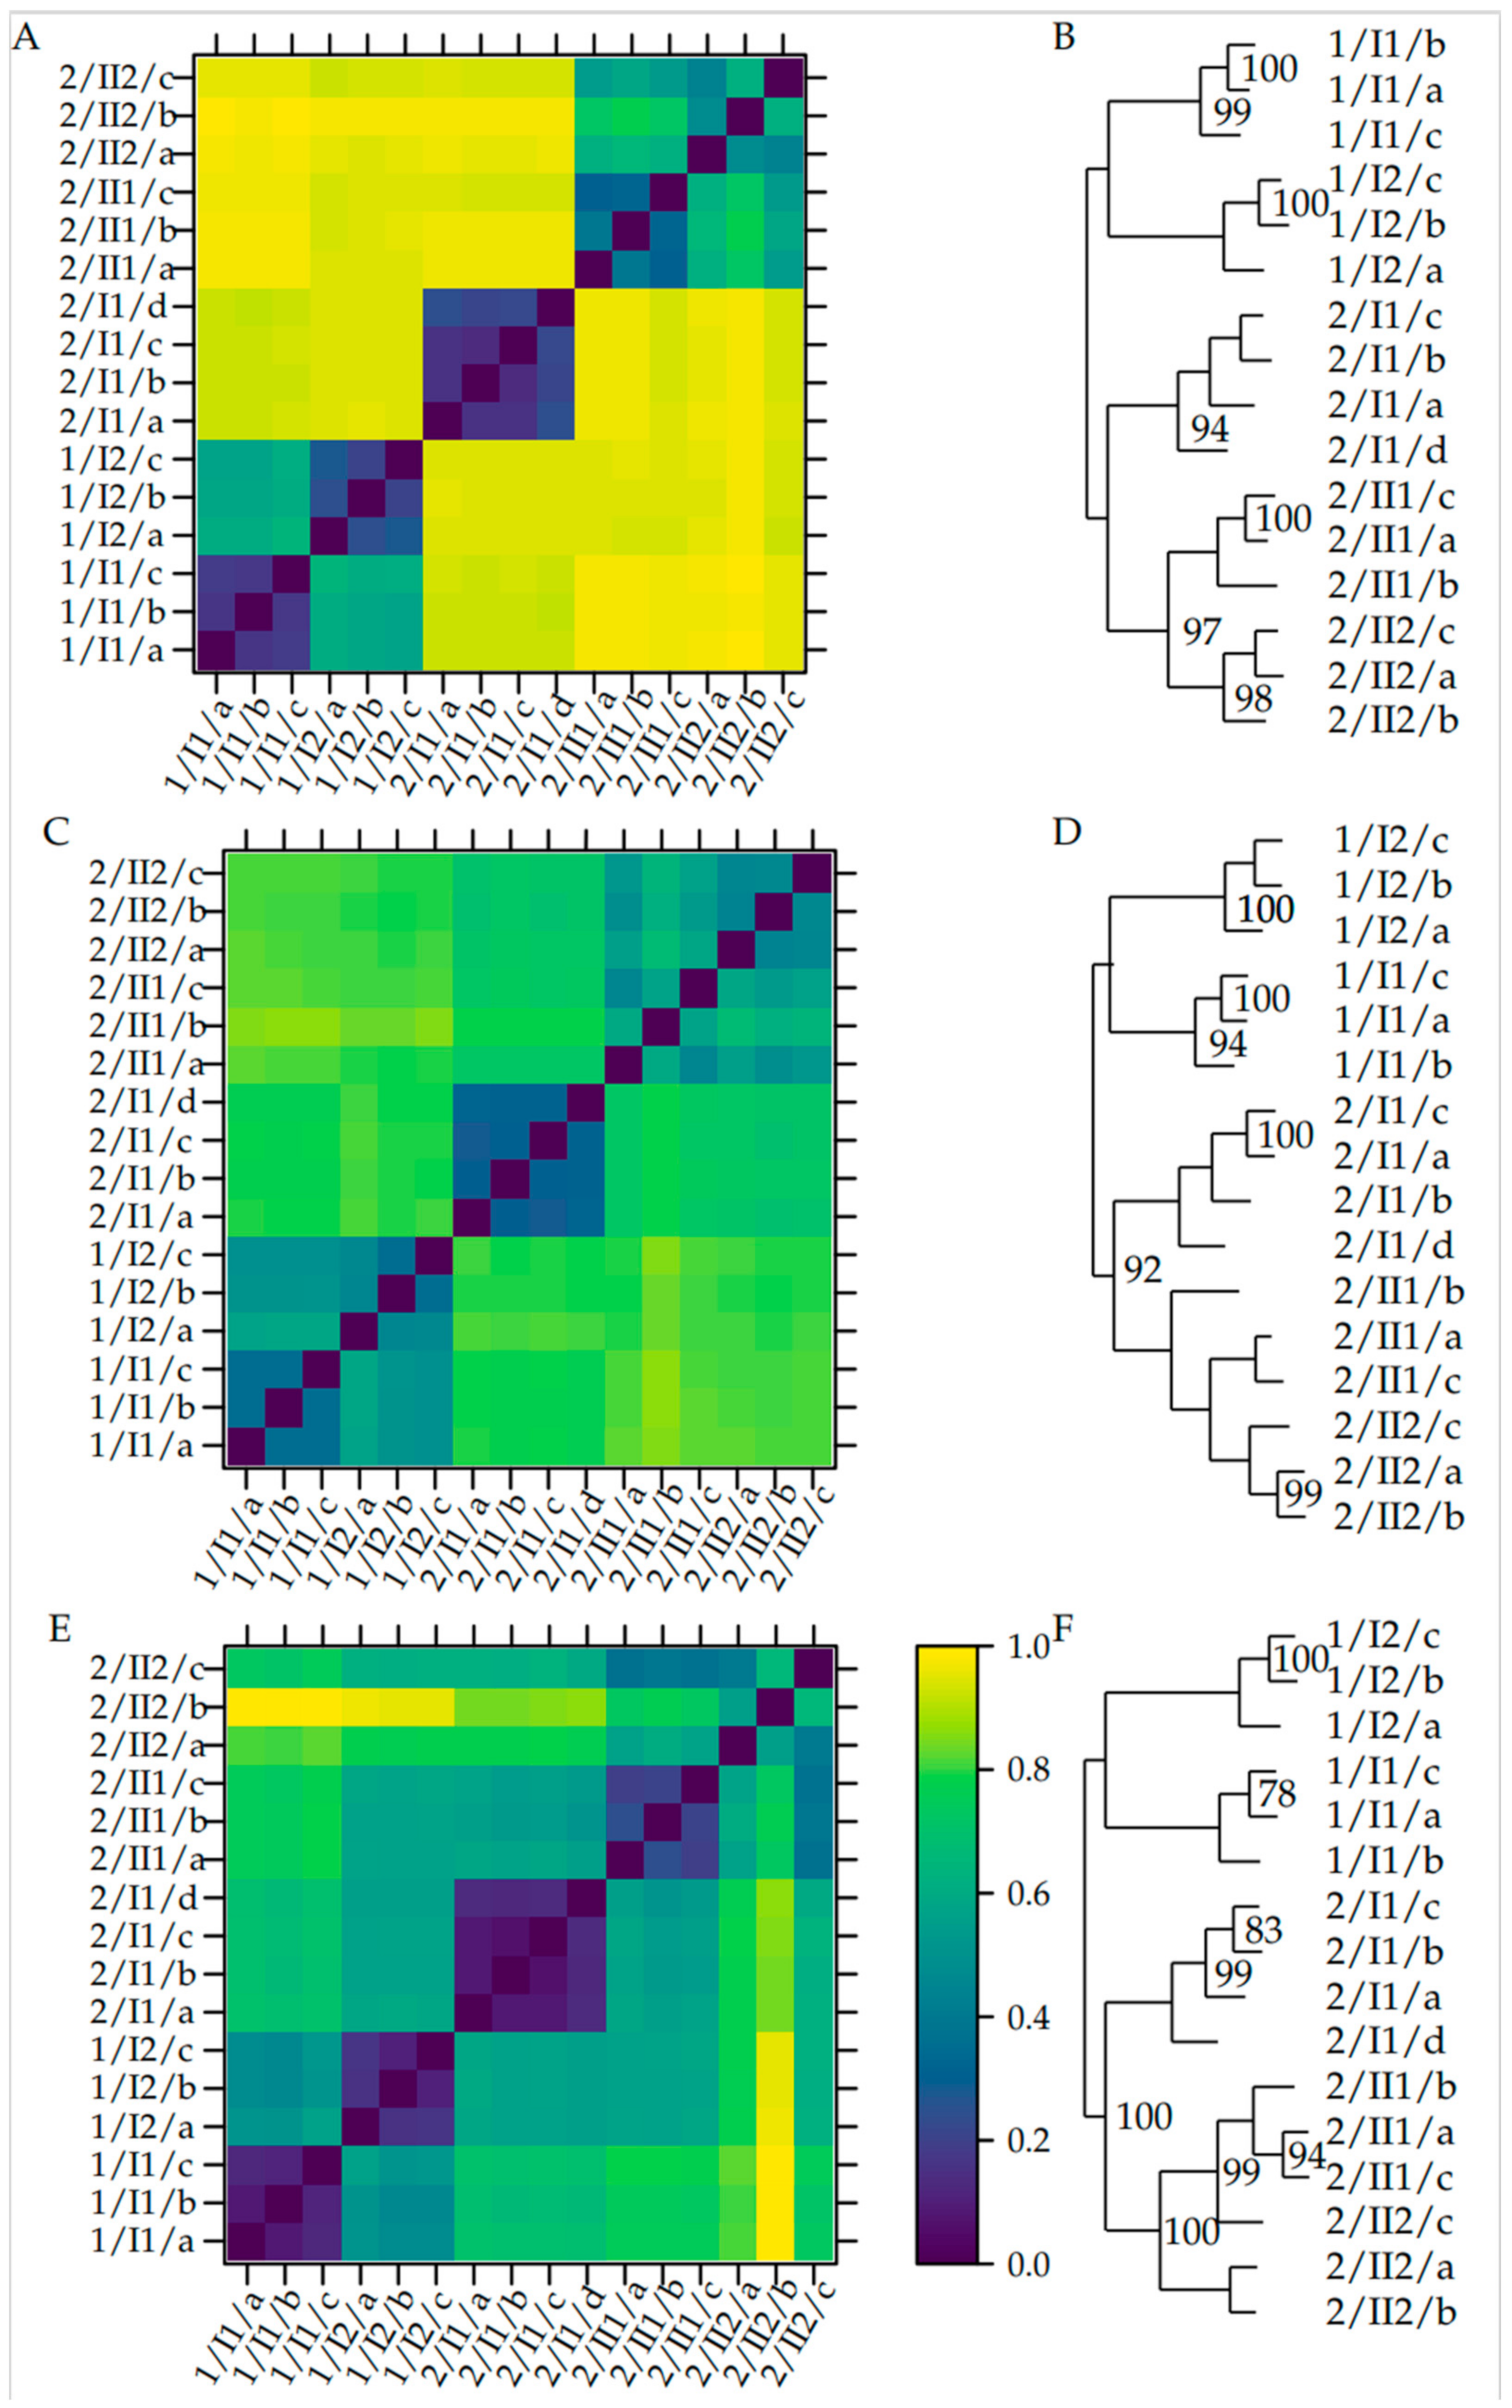
Around half of the fungal mOTUs overlap between the upper and lowest sample of the homogenous site 1, whereas less than one-third overlap between the two horizons of site 2. The diversity of vegetation cover is reflected by fungal mOTUs at both sites. Within the soil-core at site 1, no discernible pedological horizons could be observed, whereas the soil-core at site 2 showed a clear differentiation between an upper and a lower horizon, which was detected according to World Reference Base and Bodenkundliche Kartieranleitung 5 [7,8,9]. This observation is reflected by fungal communities being more similar between the upper and the lower samples (33 cm apart) in site 1, whereas the samples of the upper and the lower horizon at site 2 were different, although they were only 24 cm apart. This observation is confirmed by the fact that there is an overlap of 49% between the mOTUs of the two samples of site 1, and an overlap of 86% between the two samples belonging to the lower horizon of site 2, while there is only an overlap of 27% between the upper and the lower horizon at site 2 (Figure 2). This result was confirmed by the dissimilarity analysis, which showed low dissimilarities between the samples taken from the same horizon, but higher dissimilarities between the samples taken from different horizons at the same site (Figure 4A). This is particularly true if only the presence/absence of a MOTU is taken into account as in the case of the Bray-Curtis dissimilarity. If phylogenetic relationships of the mOTUs are considered, as in the case of the unweighted unifrac dissimilarity, this pattern is still visible (Figure 4B). The principal coordinates analysis (Figure 3) showed this pattern by samples from the same horizon grouping with each other.
The superficially similar vegetation cover of the two sites is remarkably different at a closer look. Whereas site 1 harbors woodland that is rich in species of different ecological affiliations, site 2 is covered by vegetation with more characteristics of a climax state (Tables S2 and S3). The latter favors competitive strategists and because of this, less diverse vegetation. [15,62,63]. The fungal communities found at the different sites reflect these observations: Whereas site 1 carries more plant species growing on a more homogeneous soil and a richer fungal community, site 2 carries fewer plant species on a more heterogeneous soil. These heterogeneous characteristics promote the differentiation of fungal communities relative to the different conditions prevailing at their specific horizon. The more stable conditions at site 2 support the occurrence of a less diverse fungal community. The higher fungal diversity at site 1 might be due to the higher diversity of plants and the co-existence of open land species like different grasses (species of Andropogon, Panicum, Paspalum and Setaria; all Poaceae) and forest species like Nervilia kotschyi (Orchidaceae) and Chlorophytum sp. (Anthericaceae) in the herbal layer (Figure 1, Table S1). This is typical for a forêt claire (woodland), as opposed to the more uniform forêt dense (dense forest) at site 2 (Table S2). Such observations are supported by Tedersoo et al. [23], who noted a positive effect of tree diversity on fungal species richness. On the other hand, forest island habitats yielded the highest fungal diversity probably due to an edge effect [23]. We investigated a forest island (site 2) but did not find such a high diversity, probably due to the isolated position of this small forest at the top of an inselberg and its more climax state vegetation where species have agglomerated in their niches, whereas at site 1 there is a degree of stochastic coming and going of species [15,16,63,64,65,66]. These observations are supported by other studies by which an increase in the number of species and a shift towards more ubiquitous communities due to human influence is documented [67,68].
4.5. Fungal Lifestyle
The fraction of mOTUs that could be associated with a particular lifestyle decreases with increasing depth in the soil at both sites (Table 4). This indicates that more knowledge exists about near-ground-surface fungal communities, than deep-ground communities. It also suggests that deep soil fungi are distinct from fungi near the ground surface and specific to deeper pedological horizons and their pedological characteristics, whereas it is commonly assumed that deep soil communities correspond to a small fraction of the top soil community [2,11]. The decline between the topmost and the lower layers is more drastic at site 2 than at site 1, because at site 2 there are two pedological horizons with different pedological properties.
Plant pathogens did not show a dependency on the soil layer (Table 3). If they were mainly incorporated into the soil as remnants of decomposing above-ground organic material, a decrease in their number with increasing depth would be expected. Due to their relatively even distribution in the soils, they are probably soil-borne plant pathogens. This is supported by the lack of biotrophic plant pathogens like species of Asterinales, Erysiphaceae, Meliolales, Phyllachorales, and Pucciniales [30,32].
The presence of lichens in a high abundance on rocks and tree trunks at site 2 is only partially reflected by environmental sequencing (Table 4). Only five mOTUs from Degelia (Pannariaceae) were detected. Until now, no species of this genus had been reported from West Africa [32]. On site 1, much fewer lichens were observed on rocks and tree trunks, and in addition, they appeared to be less mature. This seems to be due to the regularly occurring bushfires at this site in combination with associated air pollution, while site 2 is more rarely affected by fire and more humid at night due to its higher altitude. At site 1, lichens were not detected at all by environmental sequencing (Table 4). At both sites, no lichens were observed growing on the ground, fitting the observation that until now only four terricolous lichens have been reported from West Africa [32]. This might be due to bushfires, intense treading by cattle, and humans at site 1, the intense tree coverage, and the accumulation of leaf litter at site 2. For these reasons, lichens are not well represented by environmental sequencing of soils at both sites. The low number of lichens detected in this study and the absence of leaf parasites indicate that the translocation of DNA from aboveground into these soils is low.
The savannah forests present in the investigation area are dominated by ectomycorrhizal trees [69]. Examples of ectomycorrhiza forming species of trees are Isoberlinia doka (Fabaceae), which was found exclusively at site 1 in low abundance, Manilkara multinervis (Sapotaceae), which was found exclusively at site 2 with medium coverage, and several species of Caesalpinioideae and Detarioideae (Fabaceae) only present at site 1 (Tables S1 and S2). Many plant species, however, have not yet been investigated for their capability to form ectomycorrhizal relationships [33,69]. The higher number of known ectomycorrhizal trees at site 1 is in accordance with the much higher prevalence of ectomycorrhiza-forming fungi detected by environmental sequencing at site 1 in comparison to site 2 (Table 4).
Ectomycorrhizal fungi were most abundant in the top layer at site 1. A high abundance of ECM fungi in top layers has already been described [70] and might be due to the higher root activity in this layer and the fact that ectomycorrhizal fungi are involved in the phosphorus recycling by decomposing leaf litter and passing the released phosphorus to their symbionts. This is especially important for Ferralsols with their low phosphorus availability due to phosphorus adsorption to sesquioxides [8]. Some well-known ectomycorrhizal fungal genera like Amanita, Inocybe, Scleroderma, and Tomentella were detected on both sites mostly from top layers and, with the exception of Amanita, less abundant on site 2. In central European forests, the fraction of EcM-fungi increased in relation to other lifestyles in deeper parts of the soil [24], whereas in subtropical forests, Luo et al. [22] did not observe such a clear signal. Due to the choice of primers, the Glomeromycota, which are known to form arbuscular mycorrhizae with other plants present in the area, are probably underrepresented in the samples [2,71,72].
Overall, the fraction of mOTUs assignable near to species and lifestyles was low (Table 4), as expected for understudied areas like tropical Africa [30,32]. Such gaps should be filled by fieldwork, ecological observations, morphological analyses, genetic analyses, and culture trials. As ascertained by other investigations [2,30,32,33] and confirmed by our results, a high diversity of fungi remains to be discovered in tropical Africa.
5. Conclusions
In an undisturbed forest at the top of an inselberg in Benin (site 2), we observed distinct fungal communities in two different soil horizons, while the soil-core from a disturbed forest in the plain (site 1) was more homogenous concerning soil characteristics and fungal diversity. Thereby, we deduce that soil horizonation (pedogenesis) drives the formation of specific fungal communities. Fungal communities reflect pedological horizons rather than the depth within the soil. Environmental sequencing studies aiming to detect the complete fungal diversity at a given site should therefore consider samples from deeper soil horizons in addition to topsoil layers, especially when horizonation is observed.
Through human impact and fire at site 1, the vegetation is characterized by a relatively high number of plant species with different ecological characteristics including ruderal strategists, while we found less plant species richness including more competition strategists on site 2. As fungal diversity is closely related to plant diversity, the higher plant species richness at site 1 may contribute to an elevated number of fungal mOTUs at site 1.
Supplementary Materials
The following supporting information can be downloaded at: https://www.mdpi.com/article/10.3390/d16020097/s1; Table S1: List of plants found at sampling site 1, located in the plain close to Wari Maro, Benin; Table S2: List of plants found at sampling site 2 located on top of the inselberg Soubakpérou close to Wari Maro, Benin; Table S3: Soil characteristics of the two Geric Ferralsols in Benin, investigated in this study; Table S4: Yields and quality of fungal read pairs, number of read pairs, total number of bases, proportion of bases that reach a quality of at least 30, average base quality for all samples and number of mOTUs found in each replicate. Table S5: mOTU-table, abundance, sample/replicate, taxonomical assignment.
Author Contributions
Conceptualization: E.M. and R.D.M.; supervision: I.E. and R.D.M.; funding acquisition: M.P., I.E. and N.S.Y.; resources: M.P., I.E. and N.S.Y.; fieldwork: E.M., R.B. and R.D.M.; laboratory work: E.M. and R.B.; statistical analysis, E.M. and F.S.; visualization: E.M. writing original draft preparation, E.M.; writing review and editing, E.M., R.B., M.P., F.S., N.S.Y., I.E. and R.D.M. All authors have read and agreed to the published version of the manuscript.
Funding
Research trips and fieldwork were funded by the Volkswagen foundation (grant Az 90.127), within the second mycological summer school in Benin. I.E. and F.S. acknowledge support by the research funding program Landes-Offensive zur Entwicklung Wissenschaftlich-ökonomischer Exzellenz (LOEWE) of the State of Hessen, Research Center for Translational Biodiversity Genomics (TBG). N.S.Y. is supported by the German Federal Ministry of Education and Research (BMBF, 01DG20015FunTrAf).
Institutional Review Board Statement
Not applicable.
Data Availability Statement
The datasets generated for this study can be found in the NCBI repository under the ID PRJNA714260.
Acknowledgments
We would like to thank the participants and supporters of the second and third mycological summer schools and the community of Wari Maro for their help and hospitality. Furthermore, we want to thank Hyppolite Aignon and Marina Hiemann for their help during field work, Doris Bergmann-Dörr and Dagmar Schneider for their support with the pedological laboratory work, Karen Hahn for her advice, and Rubén I. López, José G. Maciá-Vicente and Vinh Tran for their help with data and software handling. We thank David Prochotta for improving the English of the manuscript and we thank three anonymous reviewers for comments on an earlier version of this paper.
Conflicts of Interest
The authors declare no conflicts of interest.
References
- Hawksworth, D.L. The magnitude of fungal diversity: The 1.5 million species estimate revisited. Mycol. Res. 2001, 105, 1422–1432. [Google Scholar] [CrossRef]
- Tedersoo, L.; Bahram, M.; Põlme, S.; Kõljalg, U.; Yorou, N.S.; Wijesundera, R.; Ruiz, L.V.; Vasco-Palacios, A.M.; Thu, P.Q.; Suija, A.; et al. Global diversity and geography of soil fungi. Science 2014, 346, 1256688. [Google Scholar] [CrossRef]
- Bosso, L.; Scelza, R.; Testa, A.; Cristinzio, G.; Rao, M.A. Depletion of pentachlorophenol contamination in an agricultural soil treated with Byssochlamys nivea, Scopulariopsis brumptii and urban waste compost: A laboratory microcosm study. Water Air Soil Pollut. 2015, 226, 183. [Google Scholar] [CrossRef]
- Chen, M.; Arato, M.; Borghi, L.; Nouri, E.; Reinhardt, D. Beneficial Services of Arbuscular Mycorrhizal Fungi—From Ecology to Application. Front. Plant Sci. 2018, 9, 1270. [Google Scholar] [CrossRef]
- Zanne, A.E.; Abarenkov, K.; Afkhami, M.E.; Aguilar-Trigueros, C.A.; Bates, S.; Bhatnagar, J.M.; Busby, P.E.; Christian, N.; Cornwell, W.K.; Crowther, T.W.; et al. Fungal functional ecology: Bringing a trait-based approach to plant-associated fungi. Biol. Rev. 2020, 95, 409–433. [Google Scholar] [CrossRef]
- Jongmans, A.G.; van Breemen, N.; Lundström, U.; van Hees, P.A.W.; Finlay, R.D.; Srinivasan, M.; Unestam, T.; Giesler, R.; Melkerud, P.; Olsson, M. Rock-eating fungi. Nature 1997, 389, 682–683. [Google Scholar] [CrossRef]
- Ad-Hoc-AG Boden. Bodenkundliche Kartieranleitung 5 (KA5), 5th ed.; Schweizerbart’sche Verlagsbuchhandlung: Stuttgart, Germany, 2005. [Google Scholar]
- Zech, W.; Schad, P.; Hintermaier-Erhard, G. Böden der Welt: Ein Bildatlas, 2nd ed.; Springer: Berlin/Heidelberg, Germany, 2014. [Google Scholar]
- IUSS Working Group. World Reference Base (WRB) for Soil Resources 2014, Update 2015, International Soil Classification System for Naming Soils and Creating Legends for Soil Maps; Food and Agriculture Organization: Rome, Italy, 2015; Available online: https://www.fao.org/3/i3794en/I3794en.pdf (accessed on 24 December 2023).
- Dubey, A.; Malla, M.A.; Khan, F.; Chowdhary, K.; Yadav, S.; Kumar, A.; Sharma, S.; Khare, P.K.; Khan, M.L. Soil microbiome: A key player for conservation of soil health under changing climate. Biodivers. Conserv. 2019, 28, 2405–2429. [Google Scholar] [CrossRef]
- Warcup, J. The ecology of soil fungi. Trans. Br. Mycol. Soc. 1951, 34, 376–399. [Google Scholar] [CrossRef]
- Hamilton, A.C.; Taylor, D. History of climate and forests in tropical Africa during the last 8 million years. Clim. Change 1991, 19, 65–78. [Google Scholar] [CrossRef]
- Michel, P. Reliefgenerationen in Westafrika. In Beiträge zur Reliefgenese in Verschiedenen Klimazonen: Erweiterte Vorträge der Gordon-Konferenz 20–23.02.1975; Institut für Geographie der Universität Würzburg: Würzburg, Germany, 1977; pp. 111–130. [Google Scholar]
- Louis, H. Allgemeine Geomorphologie: Textteil und Gesonderter Bilderteil, 4th ed.; Walter de Gruyter: Berlin, Germany; New York, NY, USA, 1979. [Google Scholar]
- Porembski, S.; Barthlott, W. Granitic and gneissic outcrops (inselbergs) as centers of diversity for desiccation-tolerant vascular plants. Plant Ecol. 2000, 151, 19–28. [Google Scholar] [CrossRef]
- Porembski, S.; Barthlott, W. Inselbergs: Biotic Diversity of Isolated Rock Outcrops in Tropical and Temperate Regions; Springer Science & Business Media: Berlin/Heidelberg, Germany, 2000; Volume 146, pp. 1–524. [Google Scholar] [CrossRef]
- Martin, J.P. Use of acid, rose bengal, and streptomycin in the plate method for estimating soil fungi. Soil Sci. 1950, 69, 215–232. [Google Scholar] [CrossRef]
- Bridge, P.; Spooner, B. Soil fungi: Diversity and detection. Plant Soil 2001, 232, 147–154. [Google Scholar] [CrossRef]
- Baldrian, P.; Kolařík, M.; Štursová, M.; Kopecký, J.; Valášková, V.; Větrovský, T.; Žifčáková, L.; Šnajdr, J.; Rídl, J.; Vlček, Č.; et al. Active and total microbial communities in forest soil are largely different and highly stratified during decomposition. ISME J. 2012, 6, 248–258. [Google Scholar] [CrossRef] [PubMed]
- Taylor, D.L.; Hollingsworth, T.N.; McFarland, J.W.; Lennon, N.J.; Nusbaum, C.; Ruess, R.W. A first comprehensive census of fungi in soil reveals both hyperdiversity and fine-scale niche partitioning. Ecol. Monogr. 2014, 84, 3–20. [Google Scholar] [CrossRef]
- Khokon, A.M.; Schneider, D.; Daniel, R.; Polle, A. Soil layers matter: Vertical stratification of root-associated fungal assemblages in temperate forests reveals differences in habitat colonization. Microorganisms 2021, 9, 2131. [Google Scholar] [CrossRef] [PubMed]
- Luo, X.; Liu, K.; Shen, Y.; Yao, G.; Yang, W.; Mortimer, P.E.; Gui, H. Fungal community composition and diversity vary with soil horizons in a subtropical forest. Front. Microbiol. 2021, 12, 650440. [Google Scholar] [CrossRef] [PubMed]
- Tedersoo, L.; Anslan, S.; Bahram, M.; Drenkhan, R.; Pritsch, K.; Buegger, F.; Padari, A.; Hagh-Doust, N.; Mikryukov, V.; Gohar, D.; et al. Regional-scale in-depth analysis of soil fungal diversity reveals strong pH and plant species effects in Northern Europe. Front. Microbiol. 2020, 11, 1953. [Google Scholar] [CrossRef]
- Voříšková, J.; Brabcová, V.; Cajthaml, T.; Baldrian, P. Seasonal dynamics of fungal communities in a temperate oak forest soil. New Phytol. 2014, 201, 269–278. [Google Scholar] [CrossRef]
- Yang, T.; Adams, J.M.; Shi, Y.; Sun, H.; Cheng, L.; Zhang, Y.; Chu, H. Fungal community assemblages in a high elevation desert environment: Absence of dispersal limitation and edaphic effects in surface soil. Soil Biol. Biochem. 2017, 115, 393–402. [Google Scholar] [CrossRef]
- Soderstrom, B.E.; Baath, E. Soil microfungi in three Swedish coniferous forests. Ecography 1978, 1, 62–72. Available online: https://www.jstor.org/stable/3682101 (accessed on 12 December 2023). [CrossRef]
- Hawksworth, D.L. The fungal dimension of biodiversity: Magnitude, significance, and conservation. Mycol. Res. 1991, 95, 641–655. [Google Scholar] [CrossRef]
- Rudolph, S.; Maciá-Vicente, J.; Lotz-Winter, H.; Schleuning, M.; Piepenbring, M. Temporal variation of fungal diversity in a mosaic landscape in Germany. Stud. Mycol. 2018, 89, 95–104. [Google Scholar] [CrossRef]
- van der Linde, S.; Suz, L.M.; Orme, C.D.L.; Cox, F.; Andreae, H.; Asi, E.; Atkinson, B.; Benham, S.; Carroll, C.; Cools, N.; et al. Environment and host as large-scale controls of ectomycorrhizal fungi. Nature 2018, 558, 243–248. [Google Scholar] [CrossRef]
- Guerra, C.A.; Heintz-Buschart, A.; Sikorski, J.; Chatzinotas, A.; Guerrero-Ramírez, N.; Cesarz, S.; Beaumelle, L.; Rillig, M.C.; Maestre, F.T.; Delgado-Baquerizo, M.; et al. Blind spots in global soil biodiversity and ecosystem function research. Nat. Commun. 2020, 11, 3870. [Google Scholar] [CrossRef]
- Nguyen, D.Q.; Schneider, D.; Brinkmann, N.; Song, B.; Janz, D.; Schöning, I.; Daniel, R.; Pena, R.; Polle, A. Soil and root nutrient chemistry structure root-associated fungal assemblages in temperate forests. Environ. Microbiol. 2020, 22, 3081–3095. [Google Scholar] [CrossRef] [PubMed]
- Piepenbring, M.; Maciá-Vicente, J.G.; Codjia, J.E.I.; Glatthorn, C.; Kirk, P.; Meswaet, Y.; Minter, D.; Olou, B.A.; Reschke, K.; Schmidt, M.; et al. Mapping mycological ignorance—Checklists and diversity patterns of fungi known for West Africa. IMA Fungus 2020, 11, 13. [Google Scholar] [CrossRef] [PubMed]
- Meidl, P.; Furneaux, B.; Tchan, K.I.; Kluting, K.; Ryberg, M.; Guissou, M.-L.; Soro, B.; Traoré, A.; Konomou, G.; Yorou, N.S.; et al. Soil fungal communities of ectomycorrhizal dominated woodlands across West Africa. MycoKeys 2021, 81, 45–68. [Google Scholar] [CrossRef]
- Kõljalg, U.; Nilsson, R.H.; Abarenkov, K.; Tedersoo, L.; Taylor, A.F.S.; Bahram, M.; Bates, S.T.; Bruns, T.D.; Bengtsson-Palme, J.; Callaghan, T.M.; et al. Towards a unified paradigm for sequence-based identification of fungi. Mol. Ecol. 2013, 22/21, 5271–5277. [Google Scholar] [CrossRef]
- Nilsson, R.H.; Larsson, K.-H.; Taylor, A.F.S.; Bengtsson-Palme, J.; Jeppesen, T.S.; Schigel, D.; Kennedy, P.; Picard, K.; Glöckner, F.O.; Tedersoo, L.; et al. The UNITE database for molecular identification of fungi: Handling dark taxa and parallel taxonomic classifications. Nucleic Acids Res. 2018, 47, D259–D264. [Google Scholar] [CrossRef] [PubMed]
- Põlme, S.; Abarenkov, K.; Nilsson, R.H.; Lindahl, B.D.; Clemmensen, K.E.; Kauserud, H.; Nguyen, N.; Kjøller, R.; Bates, S.T.; Baldrian, P.; et al. FungalTraits: A user-friendly traits database of fungi and fungus-like stramenopiles. Fungal Divers. 2020, 105, 1–16. [Google Scholar] [CrossRef]
- Sahraei, S.E.; Furneaux, B.; Kluting, K.; Zahieh, M.; Rydin, H.; Hytteborn, H.; Rosling, A. Soil eukaryote community shift but not composition is consistently recovered by different OTU inference methods applied to long read metabarcoding data. Authorea 2021. Preprints. [Google Scholar] [CrossRef]
- Nguyen, N.H.; Song, Z.; Bates, S.T.; Branco, S.; Tedersoo, L.; Menke, J.; Schilling, J.S.; Kennedy, P.G. FUNGuild: An open annotation tool for parsing fungal community datasets by ecological guild. Fungal Ecol. 2016, 20, 241–248. [Google Scholar] [CrossRef]
- Fierer, N. Embracing the unknown: Disentangling the complexities of the soil microbiome. Nat. Rev. Microbiol. 2017, 15, 579–590. [Google Scholar] [CrossRef]
- Kottek, M.; Grieser, J.; Beck, C.; Rudolf, B.; Rubel, F. World map of the Köppen-Geiger climate classification updated. Meteorol. Z. 2006, 15, 259–263. [Google Scholar] [CrossRef] [PubMed]
- Köhn, M. Korngrößenbestimmung mittels Pipettanalyse. Tonindustrie-Zeitung 1929, 55, 729–731. [Google Scholar]
- White, T.J.; Bruns, T.; Lee, S.; Taylor, J. Amplification and direct sequencing of fungal ribosomal RNA genes for phylogenetics. In PCR Protocols: A Guide to Methods and Applications; Innis, M.A., Gelfand, D.H., Sninsky, J.J., White, T.J., Eds.; Academic Press: New York, NY, USA, 1990; pp. 315–322. [Google Scholar]
- Masoudi, A.; Wang, M.; Zhang, X.; Wang, C.; Qiu, Z.; Wang, W.; Wang, H.; Liu, J. Meta-analysis and evaluation by insect-mediated baiting reveal different patterns of Hypocrealean entomopathogenic fungi in the soils from two regions of China. Front. Microbiol. 2020, 11, 1133. [Google Scholar] [CrossRef] [PubMed]
- Babraham Institute. Fastqc: A Quality Control Tool for High Throughput Sequence Data. Available online: https://www.bioinformatics.babraham.ac.uk/projects/fastqc/ (accessed on 4 March 2018).
- Bolger, A.M.; Lohse, M.; Usadel, B. Trimmomatic: A flexible trimmer for Illumina sequence data. Bioinformatics 2014, 30, 2114–2120. [Google Scholar] [CrossRef] [PubMed]
- Masella, A.P.; Bartram, A.K.; Truszkowski, J.M.; Brown, D.G.; Neufeld, J.D. PANDAseq: Paired-end assembler for illumina sequences. BMC Bioinform. 2012, 13, 31. [Google Scholar] [CrossRef] [PubMed]
- Mahé, F.; Rognes, T.; Quince, C.; de Vargas, C.; Dunthorn, M. Swarm: Robust and fast clustering method for amplicon-based studies. PeerJ 2014, 2, e593. [Google Scholar] [CrossRef] [PubMed]
- Huson, D.; Weber, N. Microbial community analysis using MEGAN. Methods Enzymol. 2013, 531, 465–485. [Google Scholar] [CrossRef] [PubMed]
- Altschul, S.F.; Gish, W.; Miller, W.; Myers, E.W.; Lipman, D.J. Basic local alignment search tool. J. Mol. Biol. 1990, 215, 403–410. [Google Scholar] [CrossRef]
- Bokulich, N.A.; Subramanian, S.; Faith, J.J.; Gevers, D.; Gordon, J.I.; Knight, R.; Mills, D.A.; Caporaso, J.G. Quality-filtering vastly improves diversity estimates from Illumina amplicon sequencing. Nat. Methods 2013, 10, 57–59. [Google Scholar] [CrossRef]
- Caporaso, J.G.; Kuczynski, J.; Stombaugh, J.; Bittinger, K.; Bushman, F.D.; Costello, E.K.; Fierer, N.; Gonzalez Peña, A.; Goodrich, J.K.; Gordon, J.I.; et al. QIIME allows analysis of high-throughput community sequencing data. Nat. Methods 2010, 7, 335–336. [Google Scholar] [CrossRef]
- Shannon, C.E. A mathematical theory of communication. Bell Syst. Tech. J. 1948, 27, 379–423. [Google Scholar] [CrossRef]
- Bray, J.R.; Curtis, J.T. An ordination of the upland forest communities of southern Wisconsin. Ecol. Monogr. 1957, 27, 326–349. [Google Scholar] [CrossRef]
- Lozupone, C.A.; Hamady, M.; Kelley, S.T.; Knight, R. Quantitative and qualitative β diversity measures lead to different insights into factors that structure microbial communities. Appl. Environ. Microbiol. 2007, 73, 1576–1585. [Google Scholar] [CrossRef] [PubMed]
- Junge, B. Die Böden des Oberen Ouémé-Einzugsgebietes in Benin/Westafrika. Ph.D. Thesis, University Bonn, Bonn, Germany, 2004. [Google Scholar]
- Junge, B.; Skowronek, A. Genesis, properties, classification and assessment of soils in Central Benin, West Africa. Geoderma 2007, 139, 357–370. [Google Scholar] [CrossRef]
- Hiepe, C. Soil Degradation by Water Erosion in a Sub-Humid West-African Catchment: A Modelling Approach Considering Land Use and Climate Change in Benin. Ph.D. Thesis, Rheinische Friedrich Wilhelms-Universität Bonn, Bonn, Germany, 2008. [Google Scholar]
- Piepenbring, M.; Hofmann, T.A.; Unterseher, M.; Kost, G. Species richness of plants and fungi in western Panama: Towards a fungal inventory in the tropics. Biodivers. Conserv. 2012, 21, 2181–2193. [Google Scholar] [CrossRef]
- Hawksworth, D.L. Global species numbers of fungi: Are tropical studies and molecular approaches contributing to a more robust estimate? Biodivers. Conserv. 2012, 21, 2425–2433. [Google Scholar] [CrossRef]
- Rossman, A.Y. Protocols for an All Taxa Biodiversity Inventory of Fungi in a Costa Rican Conservation Area; Parkway Publishers, Inc.: Boone, NC, USA, 1998. [Google Scholar] [CrossRef]
- Antonín, V. Supplements to the monograph of tropical african species of Marasmius (Basidiomycota, Marasmiaceae). Cryptogam. Mycol. 2013, 34, 113–135. [Google Scholar] [CrossRef]
- Parmentier, I.; Oumorou, M.; Porembski, S.; Lejoly, J.; Decocq, G. Ecology, distribution, and classification of xeric monocotyledonous mats on inselbergs in West Africa and Atlantic central Africa. Phytocoenologia 2006, 36, 547–564. [Google Scholar] [CrossRef]
- Oumorou, M.; Lejoly, J. Écologie, flore et végétation de l’inselberg Sobakpérou (nord-Bénin). Acta Bot. Gallica 2003, 150, 65–84. [Google Scholar] [CrossRef]
- Frahm, J.-P.; Porembski, S. Moose von Inselbergen in Benin. Trop. Bryol. 1998, 14, 3–10. [Google Scholar]
- Giertz, S. Analyse der Hydrologischen Prozesse in den Sub-Humiden Tropen Westafrikas unter Besonderer Berücksichtigung der Landnutzung am Beispiel des Aguima-Einzugsgebietes in Benin. Ph.D. Thesis, University Bonn, Bonn, Germany, 2004. [Google Scholar]
- Niu, B.; Fu, G. Response of plant diversity and soil microbial diversity to warming and increased precipitation in alpine grasslands on the Qinghai-Xizang Plateau—A review. Sci. Total Environ. 2023, 912, 168878. [Google Scholar] [CrossRef] [PubMed]
- Correia, M.; Espelta, J.M.; Morillo, J.A.; Pino, J.; Rodríguez-Echeverría, S. Land-use history alters the diversity, community composition and interaction networks of ectomycorrhizal fungi in beech forests. J. Ecol. 2021, 109, 2856–2870. [Google Scholar] [CrossRef]
- Guerra, C.A.; Bardgett, R.D.; Caon, L.; Crowther, T.W.; Delgado-Baquerizo, M.; Montanarella, L.; Navarro, L.M.; Orgiazzi, A.; Singh, B.K.; Tedersoo, L.; et al. Tracking, targeting, and conserving soil biodiversity. Science 2021, 371, 239–241. [Google Scholar] [CrossRef]
- Bâ, A.M.; Duponnois, R.; Moyersoen, B.; Diédhiou, A.G. Ectomycorrhizal symbiosis of tropical African trees. Mycorrhiza 2012, 22, 1–29. [Google Scholar] [CrossRef]
- Sprent, J.I.; James, E.K. Legume evolution: Where do nodules and mycorrhizas fit in? Plant Physiol. 2007, 144, 575–581. [Google Scholar] [CrossRef]
- Davison, J.; de León, D.G.; Zobel, M.; Moora, M.; Bueno, C.G.; Barceló, M.; Gerz, M.; León, D.; Meng, Y.; Pillar, V.D.; et al. Plant functional groups associate with distinct arbuscular mycorrhizal fungal communities. New Phytol. 2020, 226, 1117–1128. [Google Scholar] [CrossRef]
- Davison, J.; Moora, M.; Semchenko, M.; Adenan, S.B.; Ahmed, T.; Akhmetzhanova, A.A.; Alatalo, J.M.; Al-Quraishy, S.; Andriyanova, E.; Anslan, S.; et al. Temperature and pH define the realised niche space of arbuscular mycorrhizal fungi. New Phytol. 2021, 231, 763–776. [Google Scholar] [CrossRef]
Figure 1.
Localities in Benin, where soil samples were taken, and soil profiles with information on depths and codes of samples. (A) Site 1 is located in the plain and browsed by cattle. On the left, the cycad Encephalartos barteri. (B) Site 2, located on the inselberg Soubakpérou with Amorphophallus dracontioides, Nervilia bicarinata, and Oplismenus sp. (C) Soil profile of site 1. (D) Soil profile of site 2.
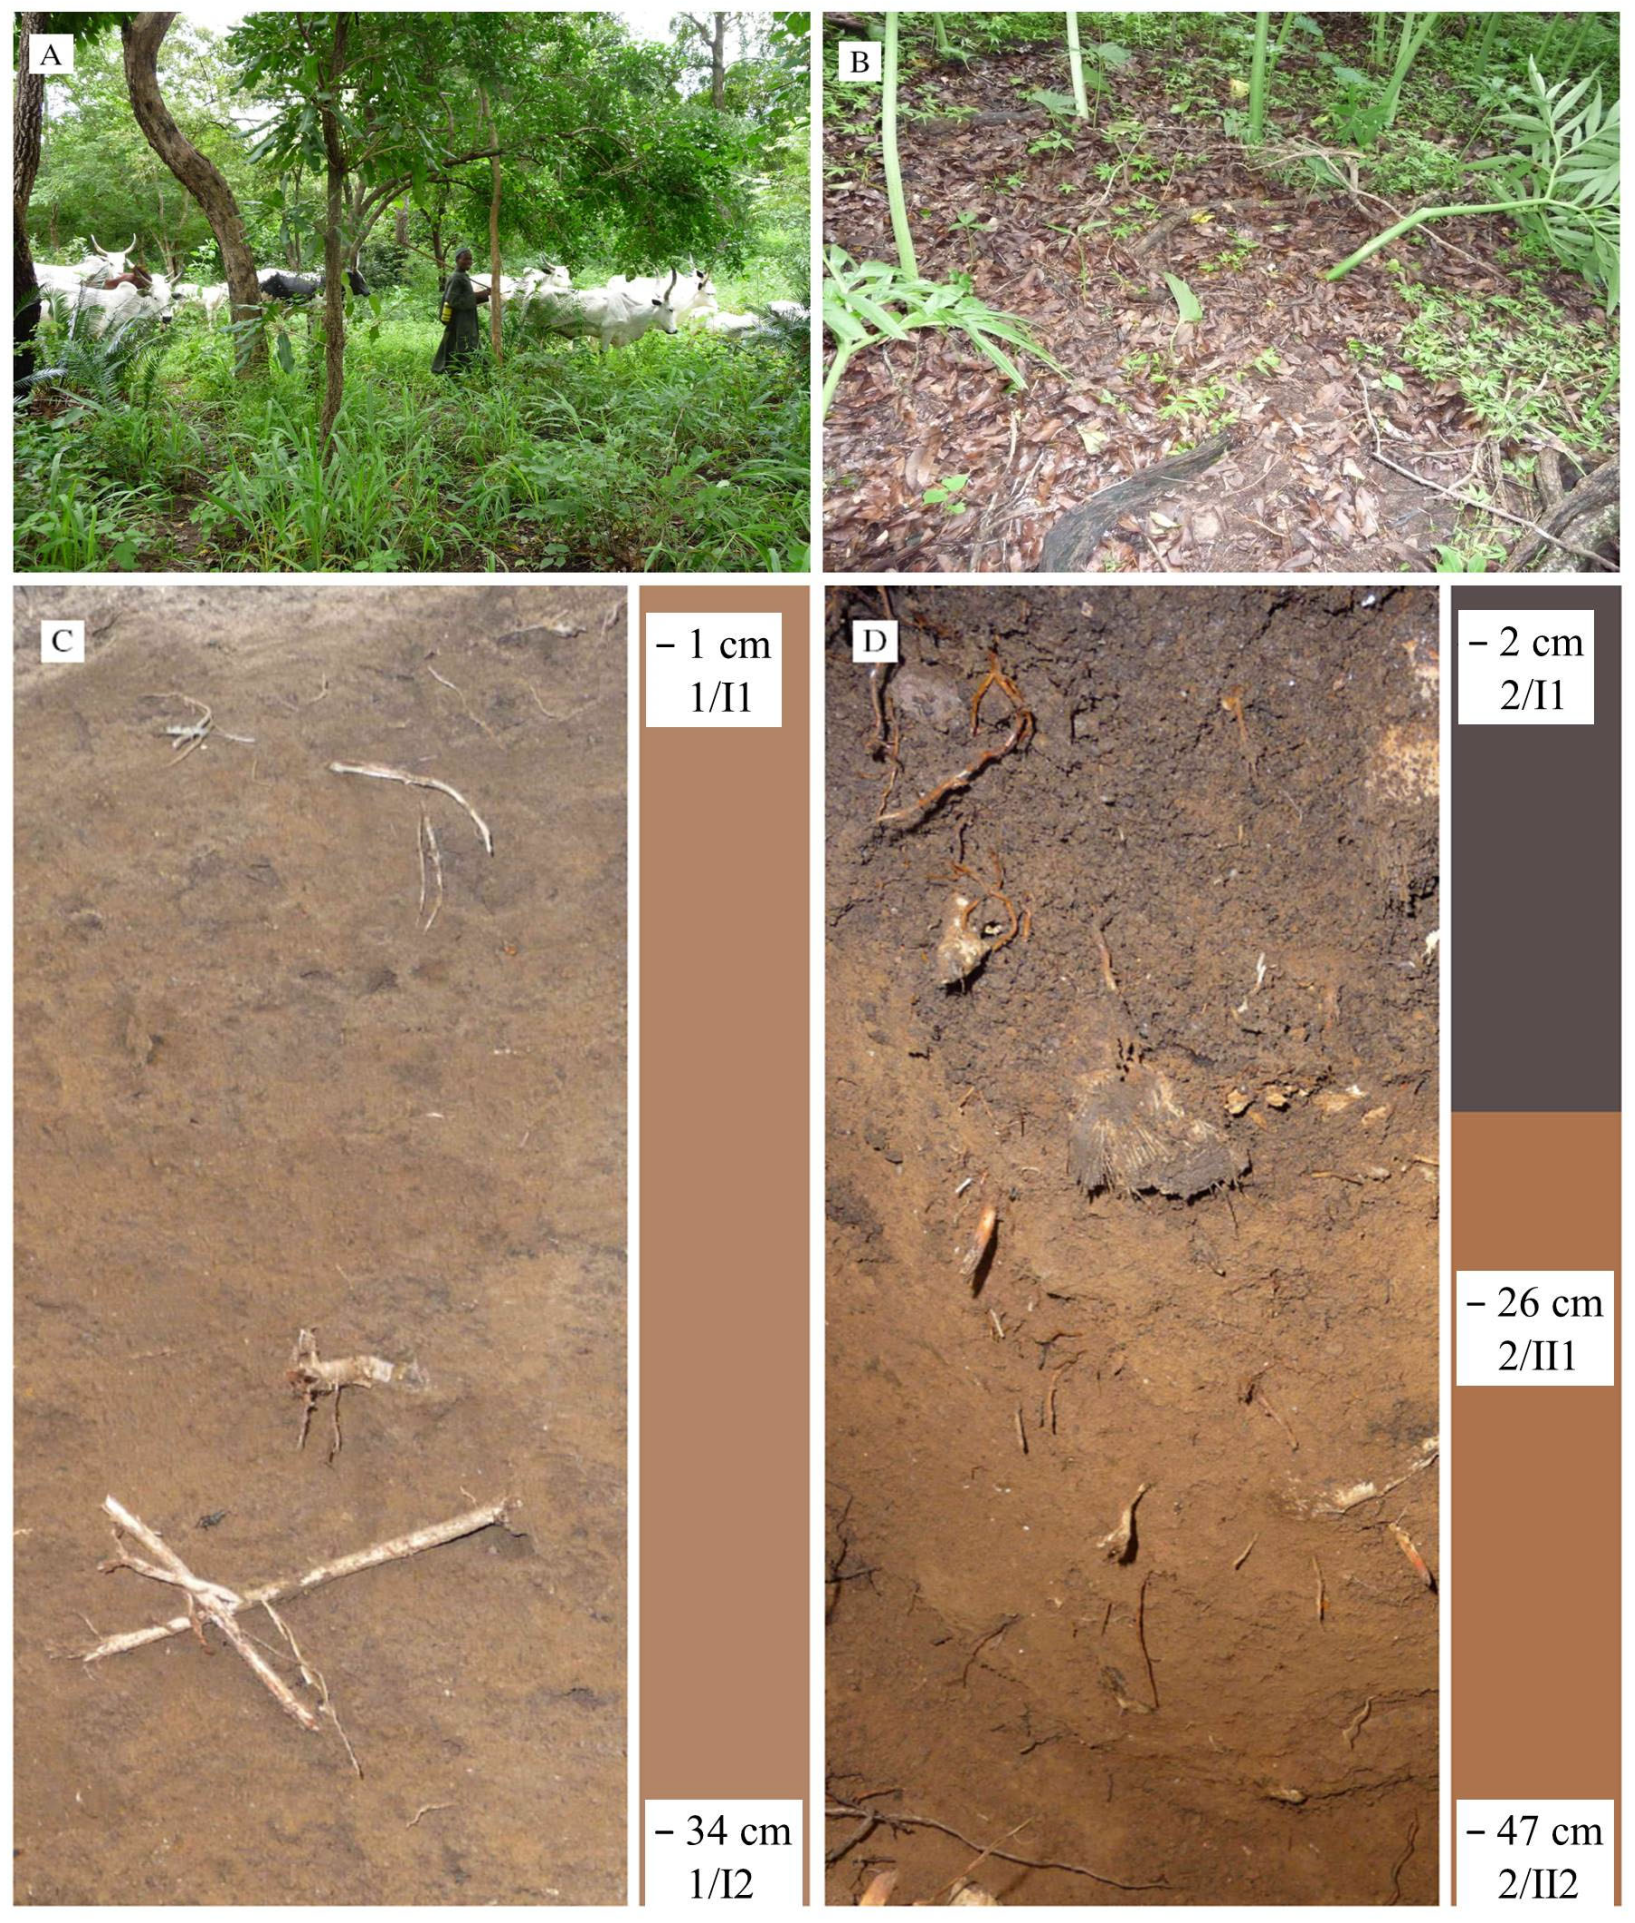
Figure 2.
Diversity of fungal mOTUs of two investigated soils (from sites 1 and 2) and their horizons. (A) Mean number of mOTUs remaining in the dataset after rarefaction to different sample sizes. Each sample was rarefied 10 times for each size. (B) mOTUs and shared mOTUs of the three pedological horizons of the two sampling sites. (C) mOTUs and shared mOTUs of two samples taken at site 1 from the same pedological horizon. (D) mOTUs and shared mOTUs of two samples from the same pedological horizon taken at site 2. Samples denoted by ‘site/pedological horizon and layer’ e.g., 1/I1 and 1/I2 within 1/I.
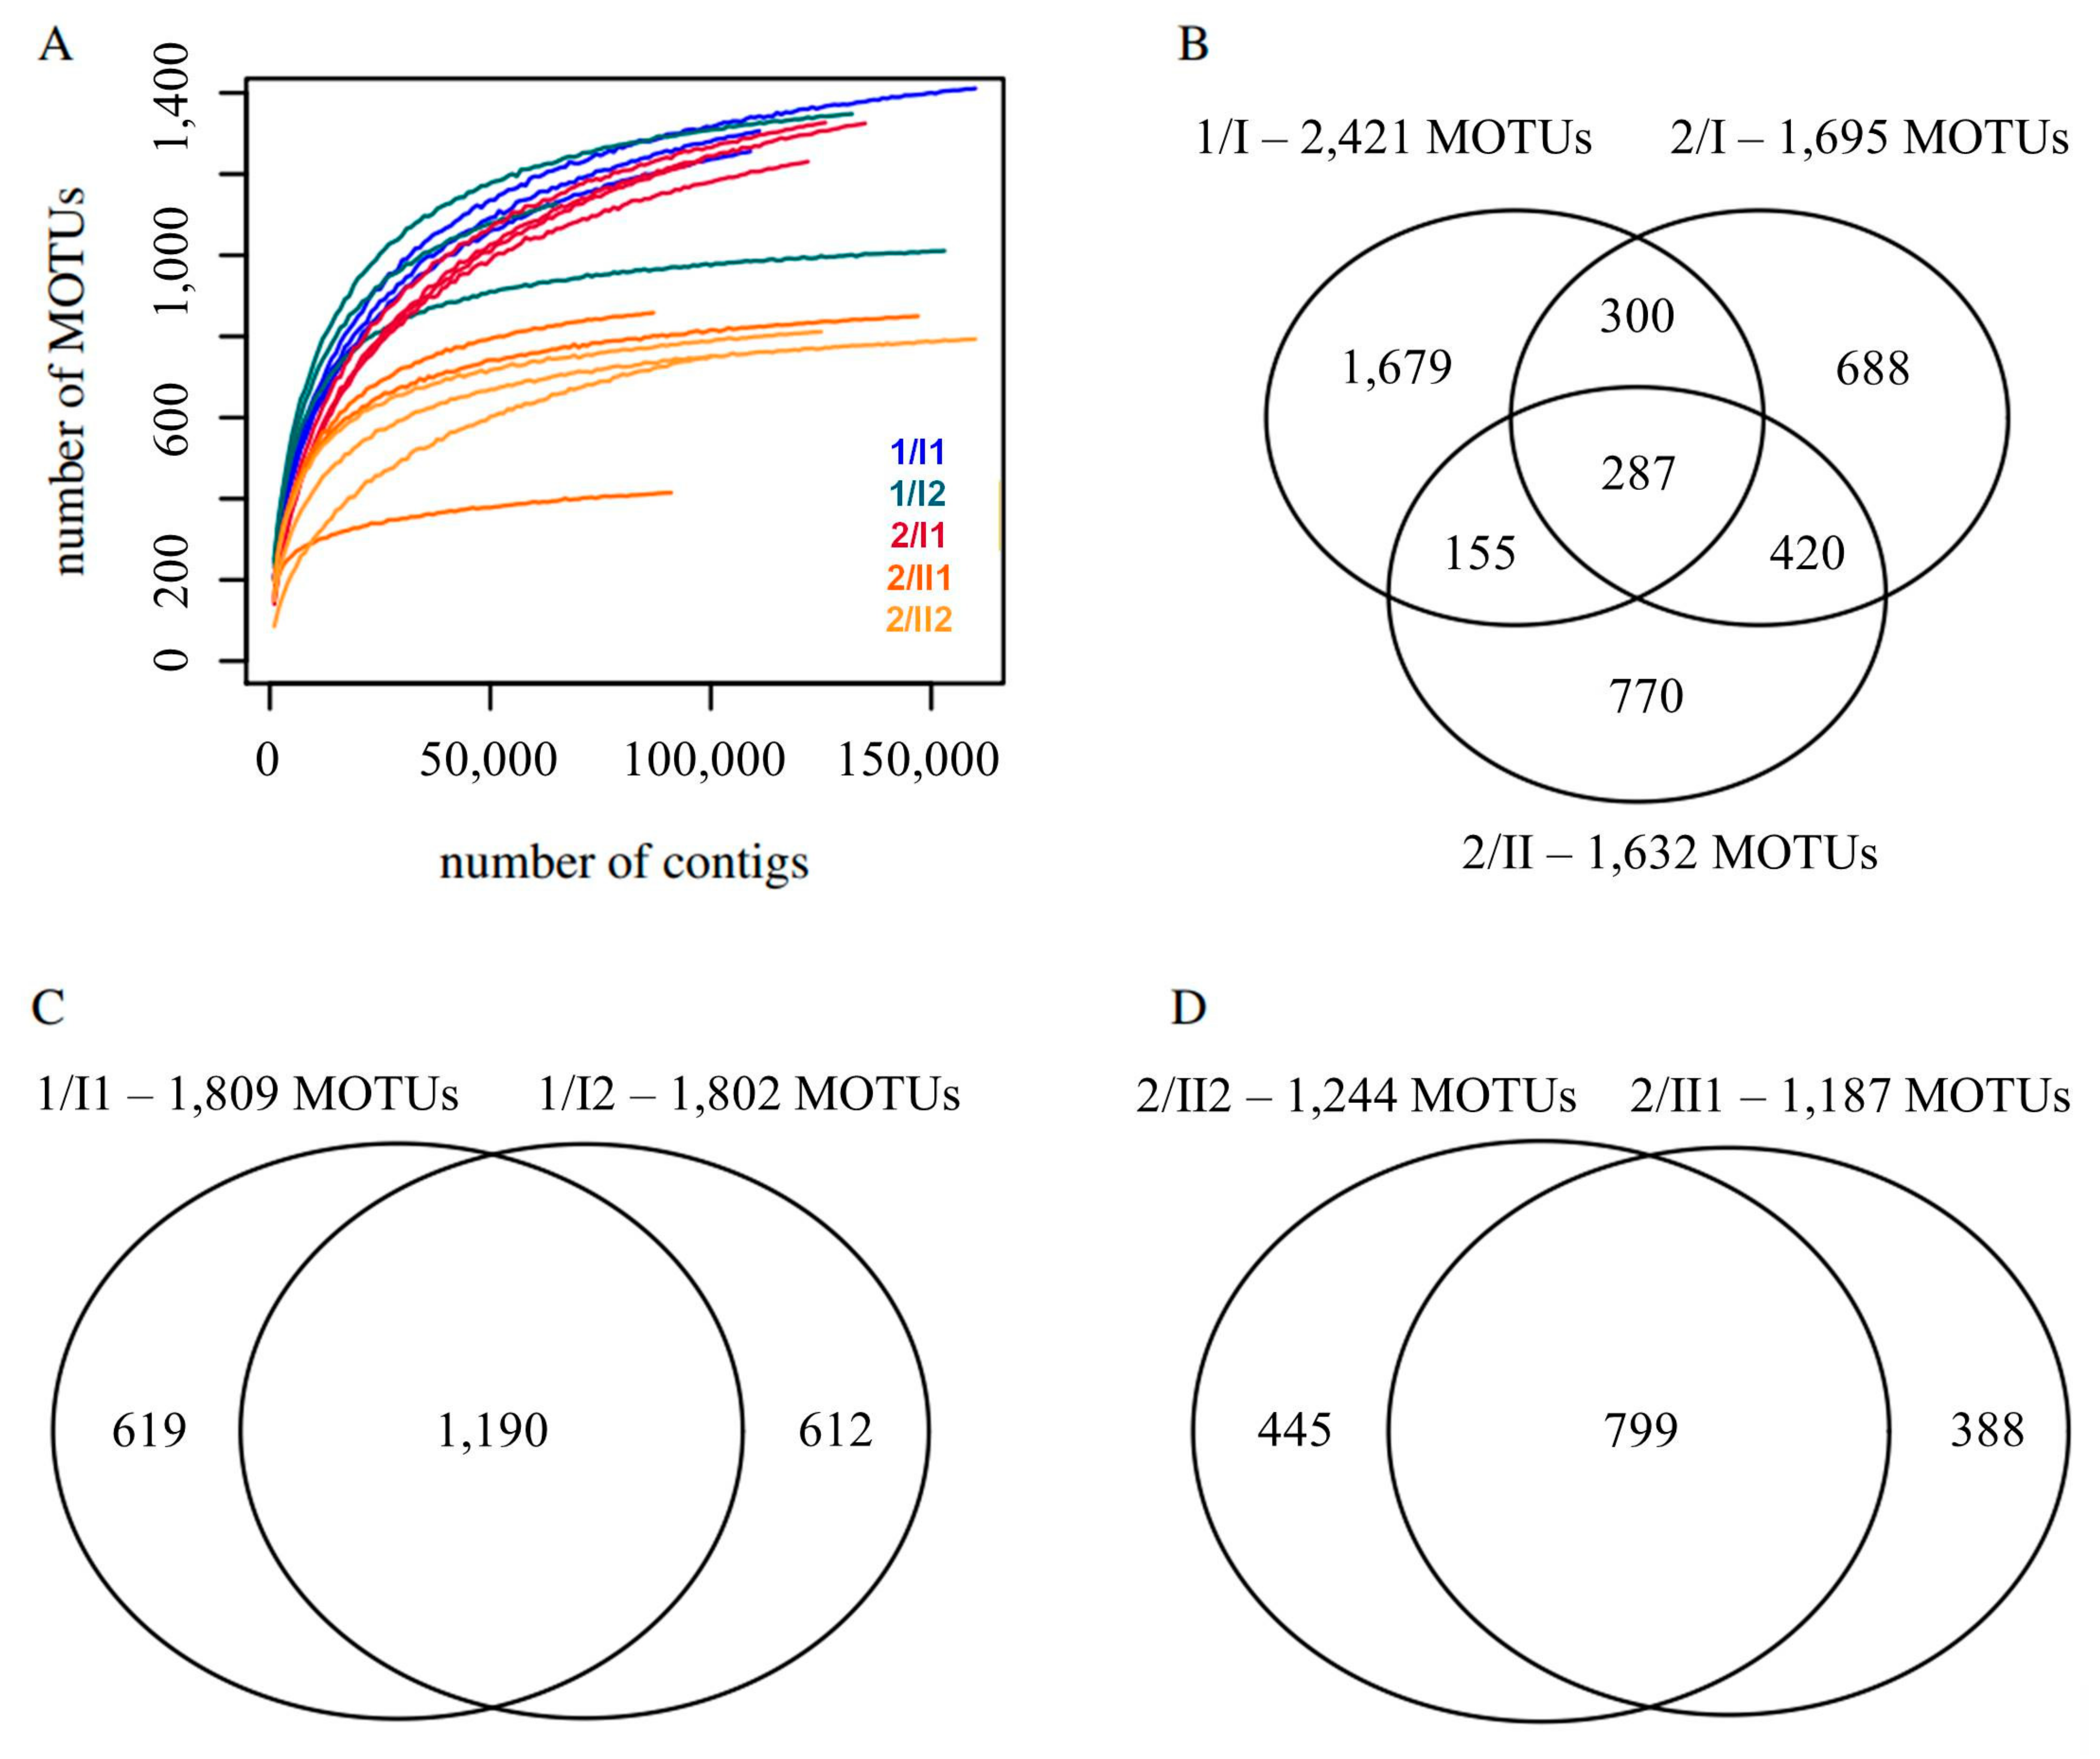
Figure 3.
Principal coordinates analyses of fungi detected by environmental sequencing. Samples consist of three to four replicates. Replicates belonging to the same sample are surrounded by a circle and denoted by ‘site/pedological horizon and layer’ e.g., 1/I1. (A) Based on Bray-Curtis dissimilarity; PC1: 39% and PC2: 34%. (B) Based on unweighted unifrac dissimilarity; PC1: 37% and PC2: 24%. Blue: Samples taken at site 1. Red: Samples taken at site 2.
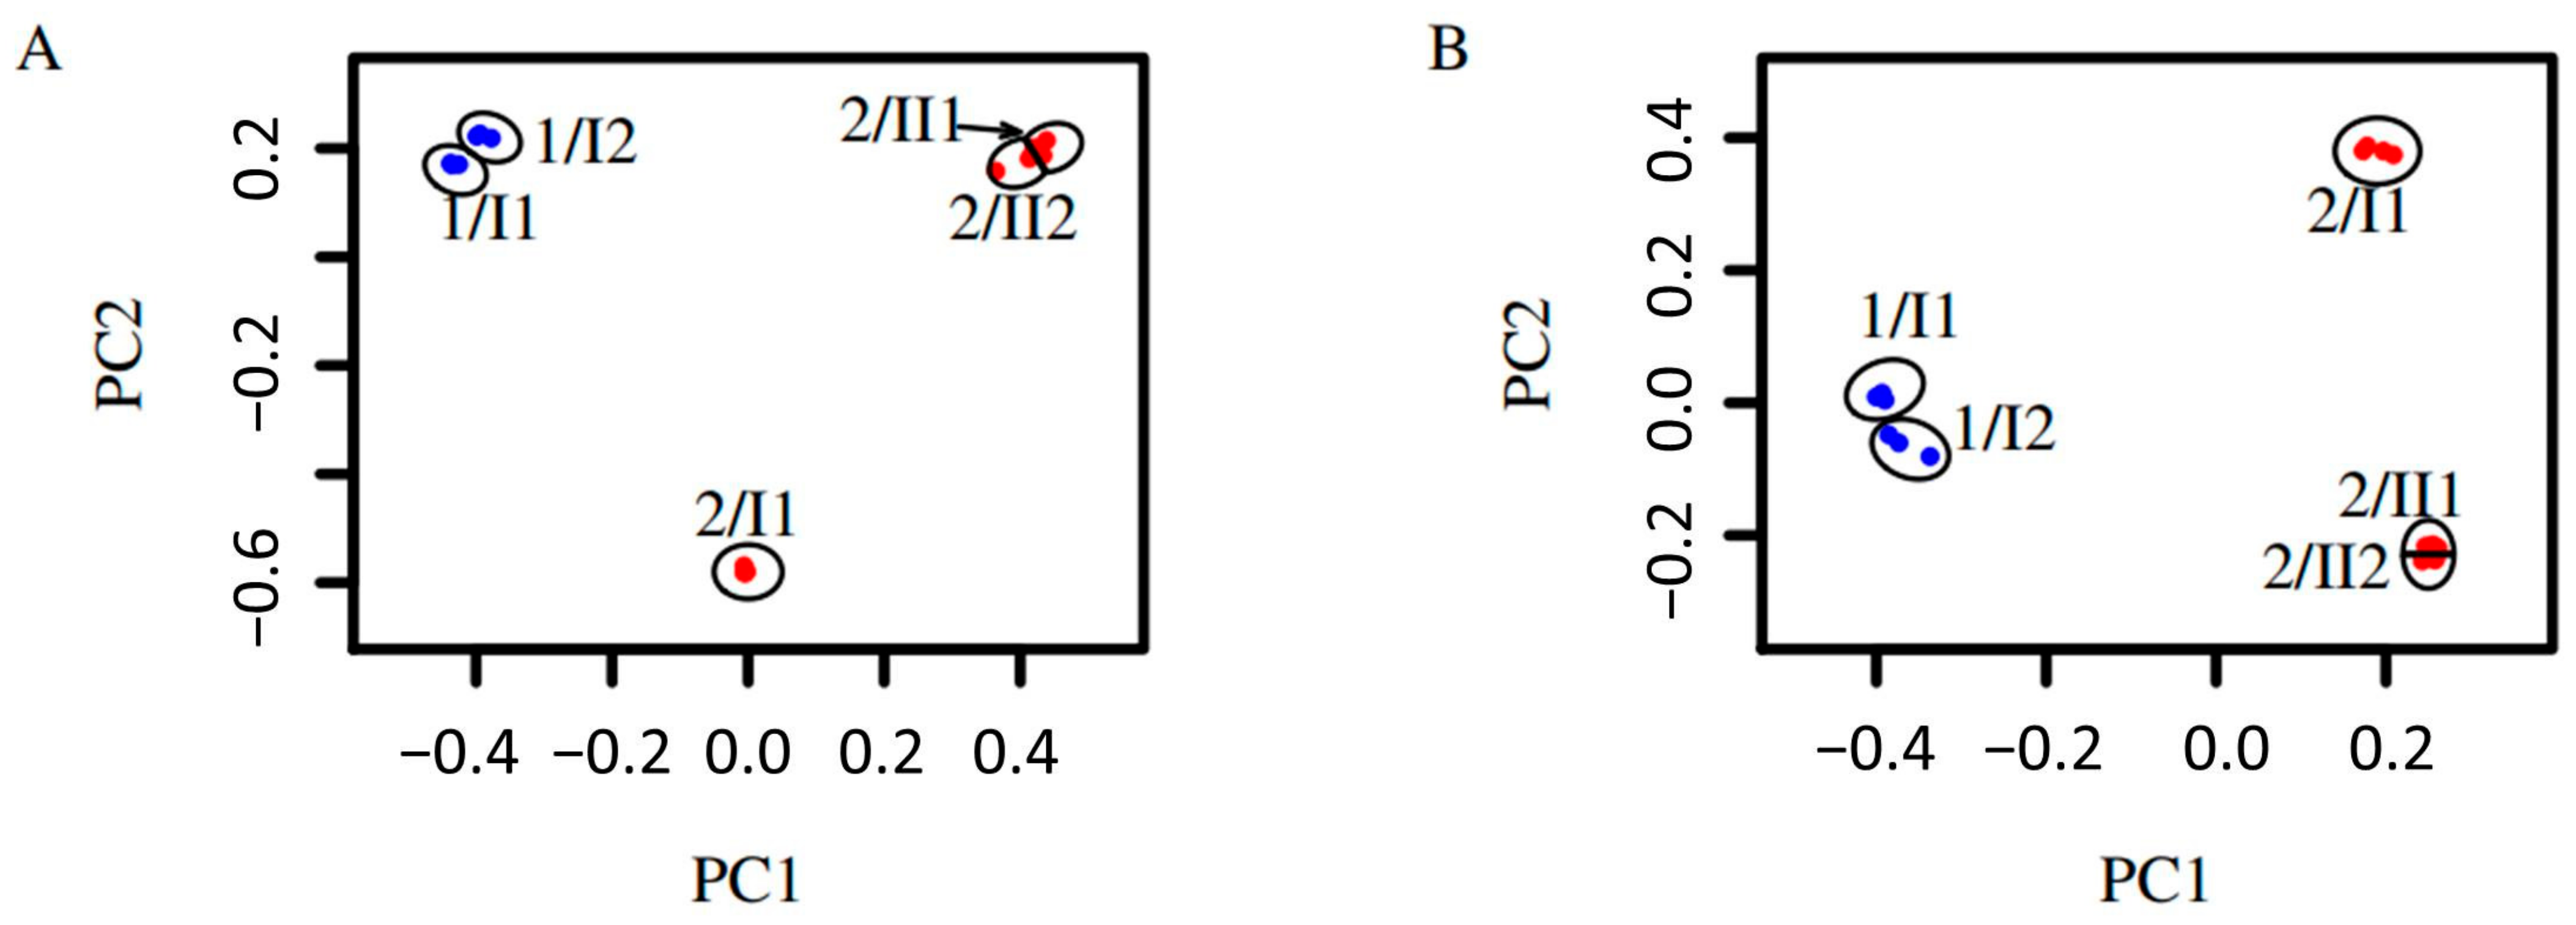
Figure 4.
Left: Dissimilarity between samples and replicates of fungal communities detected by environmental sequencing. Samples denoted by ‘site/pedological horizon and layer/replicate’, e.g., 1/I1/a. Scale denoting dissimilarity between respective samples according to metric. Right: UPGMA-trees with bootstrap percentages (1000 replicates). (A,B) Based on Bray-Curtis dissimilarity. (C,D) Based on unweighted unifrac dissimilarity. (E,F) Based on weighted unifrac dissimilarity after normalization.

Table 1.
Soil characteristics (pH and grain-size distribution) of sites and layers.
| Site | Sample | pH (%) | Sand (%) | Silt (%) | Clay (%) |
|---|---|---|---|---|---|
| site 1 | 1/I1 | 6.3 | 66.64 | 24.68 | 8.68 |
| 1/I2 | 6.1 | 70.85 | 22.71 | 6.44 | |
| site 2 | 2/I1 | 4.9 | 44.76 | 30.51 | 24.73 |
| 2/II1 | 4.0 | 37.47 | 27.33 | 35.19 | |
| 2/II2 | 4.0 | 34.28 | 29.03 | 36.69 |
Table 2.
The number of fungal mOTUs obtained from soil in Benin at different levels of taxonomic resolution.
Table 2.
The number of fungal mOTUs obtained from soil in Benin at different levels of taxonomic resolution.
| Taxonomic Level | Number of mOTUs | Fraction of Total mOTUs [%] |
|---|---|---|
| species | 75 | 1.7 |
| genus | 713 | 27 |
| family | 1285 | 30 |
| order | 1789 | 42 |
| class | 2050 | 48 |
| division | 2072 | 48 |
| unassigned | 2227 | 52 |
| total | 4299 | 100 |
Table 3.
MOTUs of the complete ITS2 sequence clustered by SWARM and taxonomically assigned against reference sequence data of the Unite database that could most closely be assigned to the following species. Samples are denoted by ‘site, pedological horizon, and layer’.
Table 3.
MOTUs of the complete ITS2 sequence clustered by SWARM and taxonomically assigned against reference sequence data of the Unite database that could most closely be assigned to the following species. Samples are denoted by ‘site, pedological horizon, and layer’.
| Order | Species | 1/I1 | 1/I2 | 2/I1 | 2/II1 | 2/II2 |
|---|---|---|---|---|---|---|
| Agaricales | Marasmius ferruginoides | + | ||||
| Calcarisporiellales | Calcarisporiella thermophila | + | + | |||
| Cladochytriales | Nowakowskiella elegans | + | + | + | + | + |
| Eurotiales | Aspergillus tamarii | + | ||||
| Eurotiales | Penicillium ornatum | + | + | + | + | + |
| Glomerales | Claroideoglomus walkeri | + | + | + | + | + |
| Hypocreales | Beauveria felina | + | + | + | ||
| Mortierellales | Mortierella ambigua | + | + | |||
| Mucorales | Cunninghamella blakesleeana | + | + | + | ||
| Pleosporales | Falciformispora senegalensis | + | + | + | + | + |
| Pleosporales | Lepidosphaeria nicotiae | + | + | + | + | + |
| Pleosporales | Pseudoxylomyces elegans | + | + | + | + | |
| Ramicandelaberales | Ramicandelaber taiwanensis | + | + | |||
| Rhizophlyctidales | Rhizophlyctis rosea | + | + | + | + | |
| Rhytismatales | Lophodermium piceae | + | + | |||
| Sordariales | Humicola fuscoatra | + | + | + | + | + |
| Spizellomycetales | Spizellomyces dolichospermus | + | + | + | ||
| Tremellales | Saitozyma podzolica | + |
Table 4.
Lifestyle assignments of fungi detected by environmental sequencing. Samples denoted by ‘site/pedological horizon and layer/replicate’. Assignments based on Tedersoo et al. [2].
Table 4.
Lifestyle assignments of fungi detected by environmental sequencing. Samples denoted by ‘site/pedological horizon and layer/replicate’. Assignments based on Tedersoo et al. [2].
| Replicate | Total Number of mOTUs | Unassigned | Assigned | Saprotrophic | Animal Parasitic | Arbuscular Mycorrhizal | Lichenized | Ectomycorrhizal | Mycoparasitic | Plant Pathogenic |
|---|---|---|---|---|---|---|---|---|---|---|
| 1/I1/a | 1307 | 902 | 405 | 244 | 9 | 12 | 0 | 92 | 3 | 43 |
| 1/I1/b | 1415 | 982 | 433 | 264 | 6 | 11 | 0 | 99 | 2 | 46 |
| 1/I1/c | 1257 | 865 | 392 | 233 | 7 | 11 | 0 | 98 | 1 | 40 |
| 1/I2/a | 1011 | 783 | 228 | 171 | 6 | 5 | 0 | 18 | 0 | 25 |
| 1/I2/b | 1127 | 852 | 275 | 205 | 6 | 7 | 0 | 20 | 1 | 33 |
| 1/I2/c | 1349 | 1.029 | 320 | 227 | 7 | 8 | 0 | 30 | 1 | 42 |
| 2/I1/a | 1235 | 803 | 432 | 371 | 8 | 2 | 5 | 3 | 3 | 37 |
| 2/I1/b | 1327 | 869 | 458 | 397 | 7 | 1 | 5 | 4 | 2 | 39 |
| 2/I1/c | 1231 | 798 | 433 | 375 | 7 | 3 | 5 | 3 | 4 | 33 |
| 2/I1/d | 1327 | 862 | 465 | 396 | 7 | 2 | 5 | 6 | 3 | 43 |
| 2/II1/a | 858 | 655 | 203 | 168 | 4 | 6 | 0 | 5 | 1 | 17 |
| 2/II1/b | 415 | 332 | 83 | 68 | 0 | 3 | 0 | 0 | 1 | 11 |
| 2/II1/c | 850 | 659 | 191 | 163 | 4 | 4 | 0 | 3 | 1 | 14 |
| 2/II2/a | 796 | 594 | 202 | 163 | 5 | 3 | 0 | 4 | 1 | 24 |
| 2/II2/b | 752 | 538 | 214 | 176 | 4 | 3 | 0 | 4 | 1 | 24 |
| 2/II2/c | 812 | 627 | 185 | 150 | 5 | 5 | 1 | 2 | 1 | 19 |
| all | 4299 | 3221 | 1078 | 804 | 14 | 22 | 5 | 112 | 6 | 107 |
Disclaimer/Publisher’s Note: The statements, opinions and data contained in all publications are solely those of the individual author(s) and contributor(s) and not of MDPI and/or the editor(s). MDPI and/or the editor(s) disclaim responsibility for any injury to people or property resulting from any ideas, methods, instructions or products referred to in the content. |
© 2024 by the authors. Licensee MDPI, Basel, Switzerland. This article is an open access article distributed under the terms and conditions of the Creative Commons Attribution (CC BY) license (https://creativecommons.org/licenses/by/4.0/).
Share and Cite
MDPI and ACS Style
Mager, E.; Brockhage, R.; Piepenbring, M.; Segers, F.; Yorou, N.S.; Ebersberger, I.; Mangelsdorff, R.D. Soil Horizons Harbor Differing Fungal Communities. Diversity 2024, 16, 97. https://doi.org/10.3390/d16020097
AMA Style
Mager E, Brockhage R, Piepenbring M, Segers F, Yorou NS, Ebersberger I, Mangelsdorff RD. Soil Horizons Harbor Differing Fungal Communities. Diversity. 2024; 16(2):97. https://doi.org/10.3390/d16020097
Chicago/Turabian StyleMager, Enno, Ronja Brockhage, Meike Piepenbring, Francisca Segers, Nourou Soulemane Yorou, Ingo Ebersberger, and Ralph Daniel Mangelsdorff. 2024. "Soil Horizons Harbor Differing Fungal Communities" Diversity 16, no. 2: 97. https://doi.org/10.3390/d16020097
Note that from the first issue of 2016, this journal uses article numbers instead of page numbers. See further details here.