
Shallow Hard-Bottom Benthic Assemblages of South Bay (Antarctic Peninsula): An Update 40 Years Later


1
Universidad Nacional de Córdoba, Facultad de Ciencias Exactas, Físicas y Naturales, Ecología Marina, Córdoba 5016, Argentina
2
Departamento Científico, Instituto Antártico Chileno, Plaza Muñoz Gamero, 1055, Punta Arenas 6200000, Chile
3
Millennium Institute Biodiversity of Antarctic and Subantarctic Ecosystems (BASE), Las Palmeras 3425, Ñuñoa, Santiago 7750000, Chile
4
Oceana Chile, Av. Suecia 0155, Oficina 1001, Santiago 8320000, Chile
5
Consejo Nacional de Investigaciones Científicas y Técnicas (CONICET), Instituto de Diversidad y Ecología Animal (IDEA), Córdoba 5000, Argentina
*
Authors to whom correspondence should be addressed.
Diversity 2024, 16(3), 162; https://doi.org/10.3390/d16030162
Submission received: 23 January 2024
/
Revised: 22 February 2024
/
Accepted: 23 February 2024
/
Published: 5 March 2024
(This article belongs to the Section Marine Diversity)
Abstract
:This work completes and updates the information about the diversity and distribution of benthic assemblages in an Antarctic fjord (South Bay, Antarctic Peninsula) 40 years after the first and only community-level study was conducted there. To determine the community changes, a photographic survey was conducted at four sites with different substrate inclinations along a bathymetric gradient of 5–20 m depth. In total, 160 photoquadrats were analyzed, resulting in a total area of 40 m2. Sixty taxa represented by 12 phyla were identified, of which eight phyla corresponded to animals. The remaining species corresponded to macroalgae and benthic diatoms, both taxa presenting the highest coverages of the entire study area. The highest richness and diversity values were obtained at greater depths and at the sites with the steepest slopes. Here, we discuss the role of substrate inclination and depth in the structure of the benthic assemblages concerning possible variations in the presence and frequency of physical disturbances (e.g., ice disturbance and sedimentation). The abundances, densities, and distributions of all species found are detailed, updating the ecological data of the benthic ecosystem of this Antarctic fjord from the previously published assessment four decades ago. In a continent where rapid environmental changes are being experienced due to climate-induced processes, we discuss the first massive record of benthic diatoms in this fjord and the striking absence of the sea urchin Sterechinus neumayeri, an abundant species from previous records from the early 1980s.
1. Introduction
Anthropogenic climate change has exposed ecosystems to unprecedented conditions over millennia, significantly affecting land and ocean species. The global temperature of our planet has increased by around 1 °C since the beginning of the 20th century, and it will continue to increase in the upcoming decades, even under ambitious climate mitigation scenarios [1]. This increase in temperature has not been uniform on either spatial or temporal scales, with the Polar Regions being the places that have experienced the highest rates of temperature increase in the last 50 years. Particularly, the Western Antarctic Peninsula (WAP) has undergone the highest rates of seawater and air temperature rise [1,2], where even coastal areas have already recorded water temperatures predicted for the year 2100 [3] and unusual air temperatures in the context of natural trends of the last 2000 years [2,4,5,6]. Due to this warming, the WAP has experienced multiple environmental consequences, such as a reduction in cold winters [7], ocean acidification [8,9], sea level rise [10], and increases in snowfall [11,12], among others. On the other hand, the speed and magnitude of recent climate change may exceed the capabilities of biological systems to adapt to these environmental changes and, therefore, cause risks to ecosystems and their life forms [13,14,15]. Many biological responses, such as changes in species distribution, expansion of opportunistic species, extinction of less-competitive species, changes in the biological niche, and the potential settlement and spread of invasive species, have been postulated due to these ongoing environmental changes [16,17,18,19,20,21].
Regional warming in the WAP has also driven massive ice loss and glacier retreats [22,23,24], with a decrease in annual sea ice duration [25,26]. This massive and fast ice loss has significant consequences for the structures of Antarctic shallow benthic communities due to ice-mediated disturbances [27,28,29,30,31]. Iceberg scouring events create a patchy (fragmented) mosaic of assemblages at differing stages of recovery in polar substrates [32,33,34]. To date, many studies around Antarctica have suggested that the consequences of the impact of the icebergs on benthic communities decrease with depth and also with the inclination of the substrate, acting as important buffers of this mechanical impact [31,34,35,36,37,38].
In South Bay, a fjord located on Doumer Island (Antarctic Peninsula), recent works have provided new information on the diversity and taxonomy of sponges [39,40,41], sponge-associated microorganisms [42,43], heat stress responses [44], and benthic primary production [45]. However, detailed information on South Bay at the community level is scarce and outdated [46,47]. Zamorano’s pioneer research contains essential reference data of benthic assemblage, but, unfortunately, no monitoring has been carried out for the last four decades as the Yelcho scientific station (located at South Bay) remained closed and was reopened only in 2014. Our study aims to provide new detailed ecological data on the spatial distribution of the current benthic assemblages. In addition, we also discuss some striking changes regarding Zamorano’s observations 40 years ago. Finally, we also address the role of depth and substrate inclination in the structure of the benthic communities in a dynamic environment heavily influenced by ice scouring.
2. Materials and Methods
2.1. Study Area
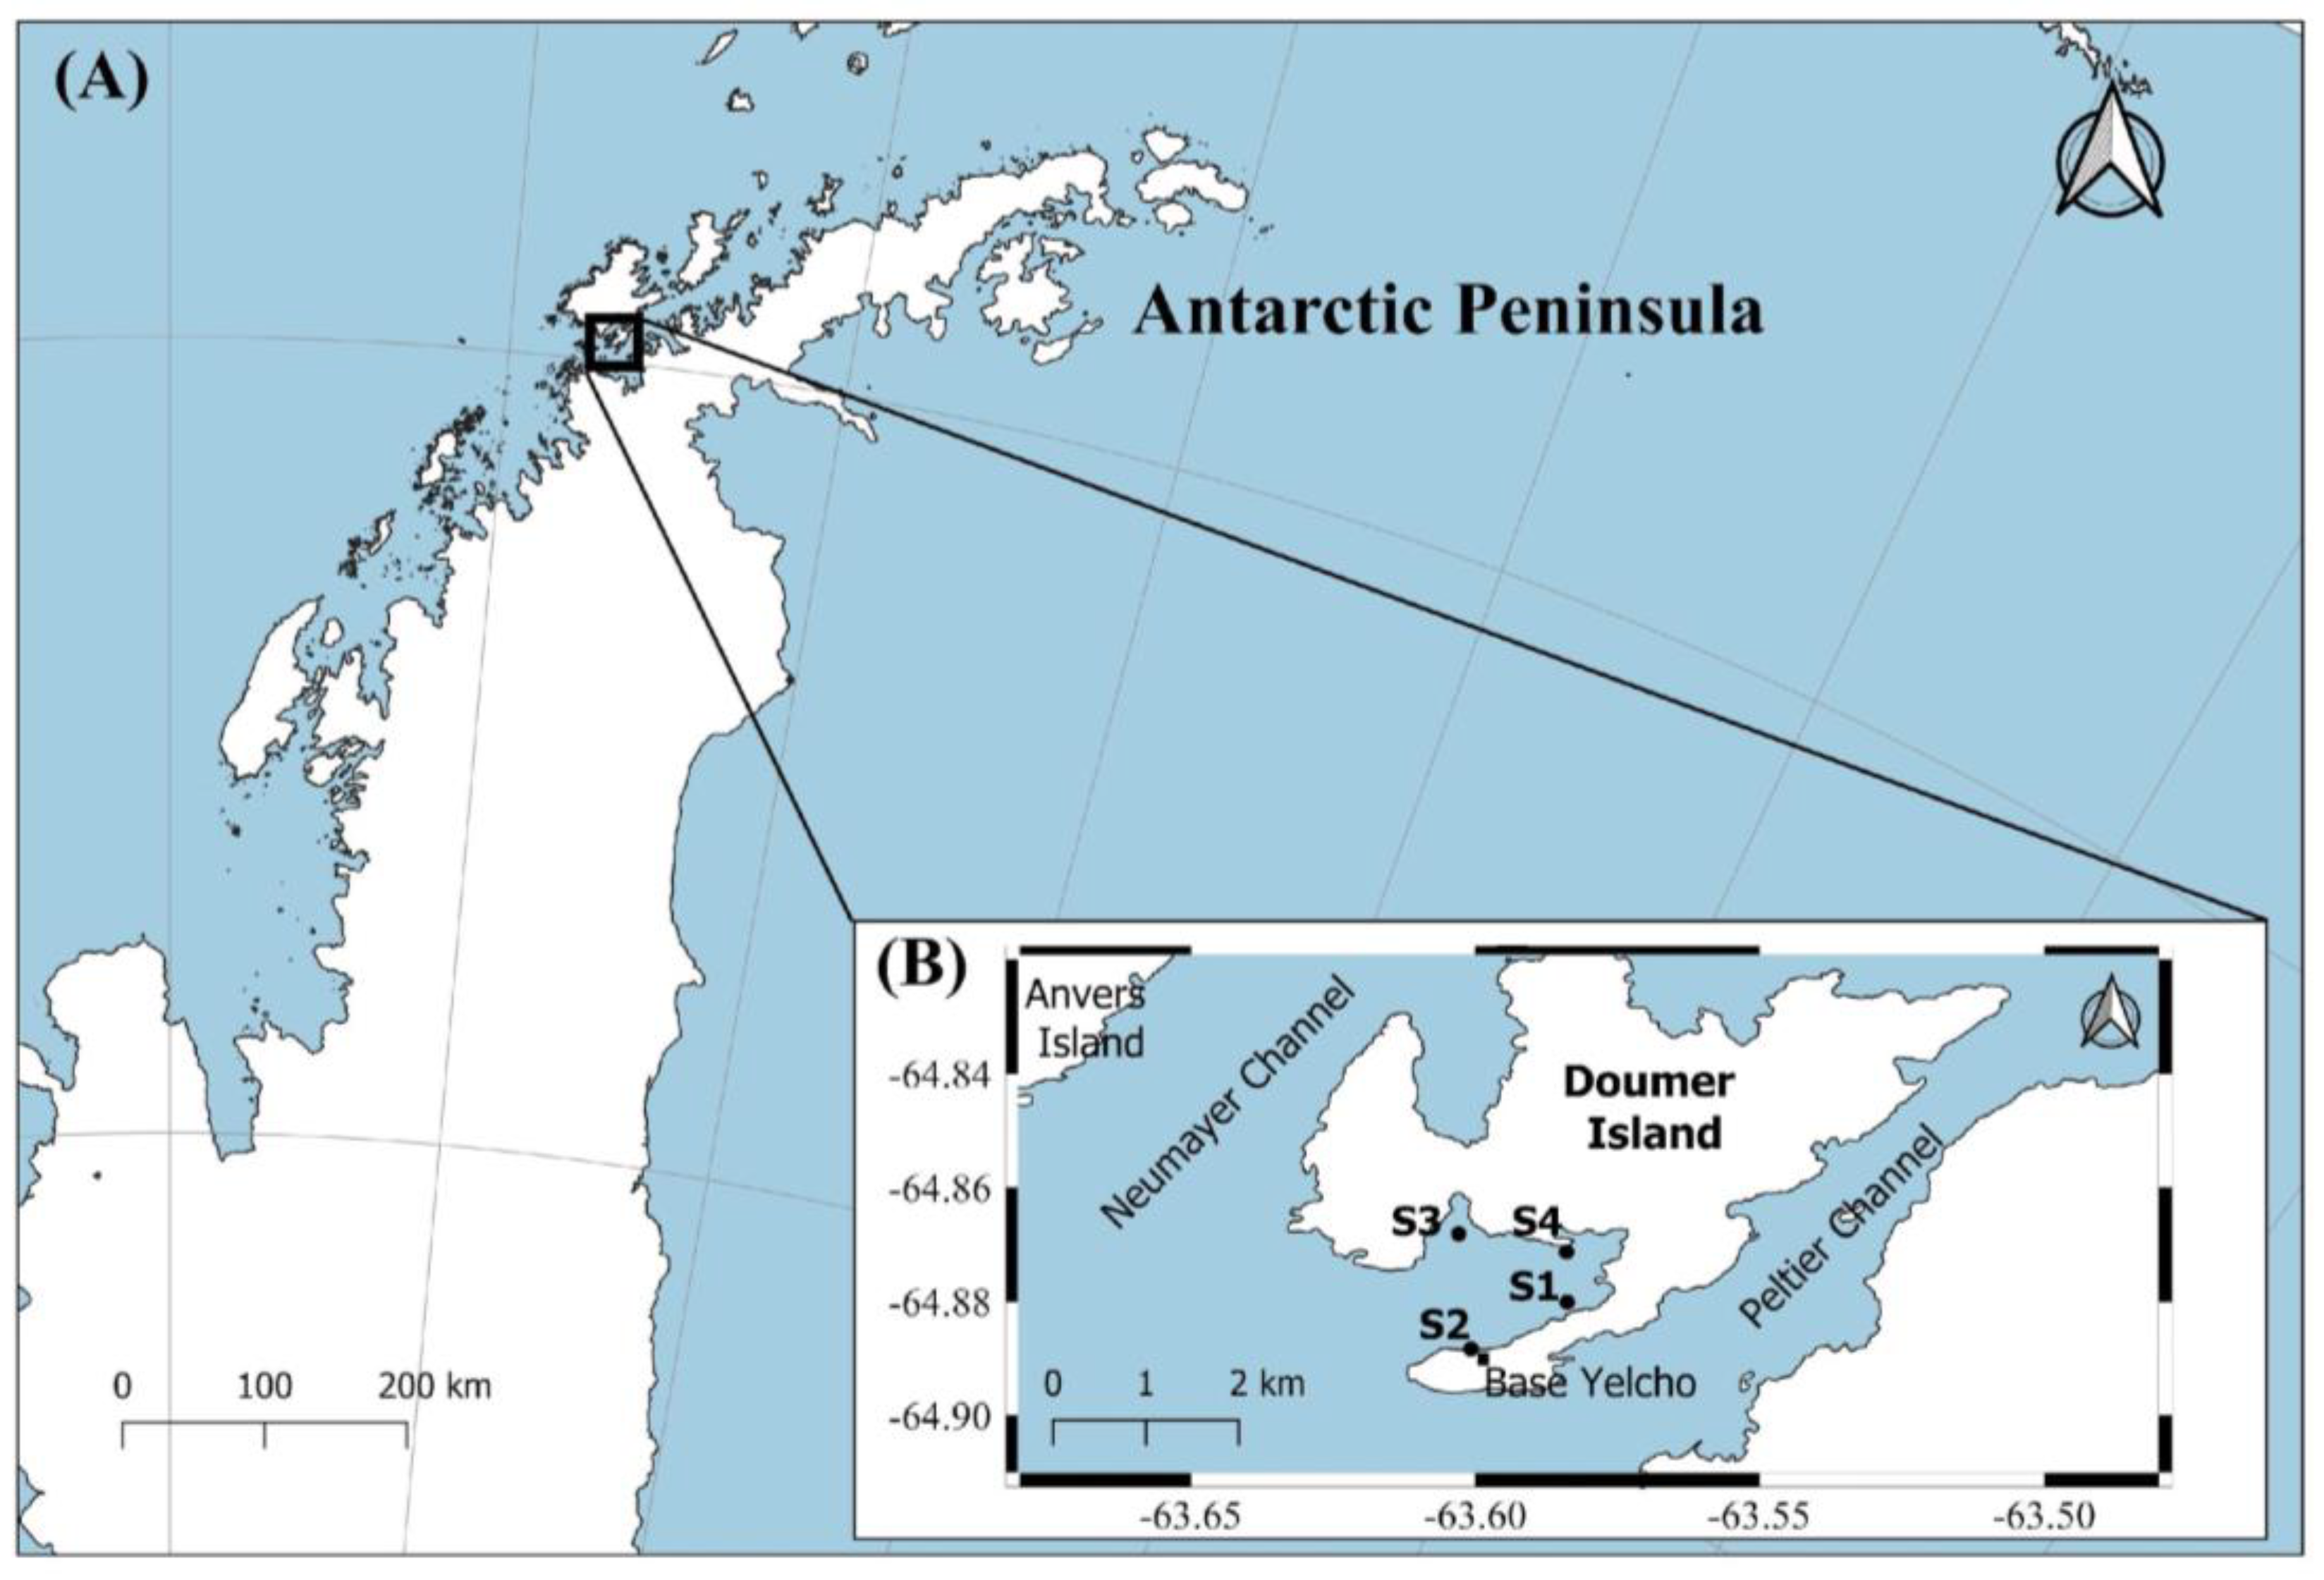
This study was carried out in South Bay (64°51′00″ S; 63°35′00″ W), an Antarctic fjord located on Doumer Island (Palmer archipelago, WAP), where the Chilean Yelcho scientific station operates during the Austral summer (Figure 1). A glacier at the head of the bay partially surrounds South Bay, and several other glaciers are located near the island between the Neumayer and the Peltier Channels. The bay covers an area of ~2.3 km2 with water depths ranging from <30 m at the north-east end of the bay to 60–90 m at the mouth of the bay (south-west end), and up to 222 m depth in the central region [45]. There is also an Antarctic Specially Protected Area (ASPA 146). The bay is characterized mainly by a mixture of rocky substrates and soft bottoms (with thin sediment deposits in a rocky bottom). The shallow areas present rocky steep slopes and highly heterogeneous benthic habitats [45,46]. Average air temperatures in the summer months are between 3.2 °C and 4.1 °C, depending mainly on the direction of the winds [48]. The seawater temperature experiences local variability with a range between −1.7 °C to more than 2 °C with some episodes of warming reaching 3 °C [3]. The waters in the bay generally freeze in the winter months and stay ice-free from September/October to April (Modified Copernicus Sentinel data 2020/Sentinel Hub) [49].
2.2. Sampling Design and Data Analysis
The sampling was performed over the 2018 Austral Summer season (January and February) at four sites in the bay: Site 1 (S1), Site 2 (S2), Site 3 (S3), and Site 4 (S4). The sampling sites were selected according to a substrate inclination gradient, detailed here from highest to lowest slope: S1 (~90°) > S2 (~70°) > S3 (~30° to ~50°) > S4 (~10° to ~30°). At each site, four photographic transects were undertaken by SCUBA diving at 5, 10, 15, and 20 m depths. A total of 10 images of 0.25 m2 each were taken at each depth. An Olympus E-PL7 mirrorless digital camera fitted into a housing (Olympus PT-EP12) with a 15 mm wide-angle lens was used to take the pictures (50 × 50 cm). A 10 cm aluminum rule was attached to the housing and used later as a reference to quantify the sampled area.
Photographs were projected onto 50 × 50 cm grids with 100 uniformly distributed points, and those underlying each organism were counted to estimate the percentage coverage and bare substratum per square meter. The animals in each photograph were counted (abundance), and the total number was divided by the area sampled (0.25 m2) to estimate densities. Colonial organisms, such as bryozoans and ascidians, were taken as single individuals. All coverage values in the text are given as mean ± SE. The photographs were analyzed using the Coral Point Count (CPC) software version 4.1 [50]. The resolution of the images was sufficiently acceptable to detect and identify organisms larger than ~10 mm in diameter. Therefore, organisms with sizes smaller than this measure, such as juveniles of Margarella antarctica, were probably missed. All fauna were identified to the lowest possible taxonomic level. Some components of the biota were excluded from the analysis: encrusting taxa (some smaller bryozoans and terebellid polychaetes) and diatoms could not be accurately identified and quantified.
A generalized linear mixed model (GLMM) was used for the analysis with abundance as a variable; site, depth, and photo as classification criteria; site, depth, and site*depth as fixed factors; and each photo as a random factor. The corresponding contrasts were made. A Poisson error distribution with a log-link function was used. The significance level was set at α = 0.05, and Fisher’s test (LSD) was performed to compare the means. The analyses were performed with InfoStat v2020 [51]. The coverage data, which included, in addition to fauna, values of diatoms, macroalgae, and encrusting algae, were used to compare the diversity of marine benthic communities among depths, sites, and transects using the specific richness (S’) and the Shannon–Wiener index (H’). A General and Mixed Linear Model was used to compare the Shannon–Wiener indices, and the analyses were performed with InfoStat v2020v [51]. For some analyses, faunal components were classified into two groups: mobile (Mollusca, Nemertea, and Echinodermata) and sessile animals (Porifera, Bryozoa, Brachiopoda, Cnidaria, and Chordata).
A series of multivariate analyses were performed to assess the structural patterns of the assemblages and analyze spatial variations. To that effect, three initial matrices were constructed with each taxon’s average coverage percentage data: one with the data for each transect, another by site, and another by depth. Then, after a square root was transformed to down-weigh the influence of the most dominant taxa [52], similarity matrices were constructed using the Bray–Curtis similarity distance. A cluster analysis using the UPGMA method was conducted as a classification analysis to build a dendrogram describing the similarity between transects, sites, and depths. Additionally, a non-metric multidimensional scaling (nMDS) was used as an ordination technique to visualize changes in species composition and assemblage structure across transects, sites, and depths. Then, to test for statistical differences among priori-defined assemblages (defined by depths), the same similarity matrix was used to perform a one-way Analysis of Similarities (ANOSIM). Finally, to determine the individual contribution of each species to the similarity observed between samples and the conformation of the structure of the groups, the analysis of similarities (SIMPER) was used. All the statistical data analyses were performed using Infostat Past 4.03.
3. Results
3.1. Taxonomic Diversity
A total of 160 photoquadrats were analyzed, covering a total area of 40 m2. Across the four sampled sites, 60 taxa were identified, represented by 12 phyla and 17 classes. Of these phyla, eight correspond to animals, with 1753 observed individuals. Table 1 shows the list of faunal taxa identified at the four sites and the abundance classes at each depth of each site. The rest of the taxonomic entities correspond to three phyla of algae and a group of benthic diatoms (Table 1).
The GLMM detected significant differences between the abundances (F = 10.83; p = <0.0001) and the values of the Shannon indices of the sites (Table 2). For both analyses, S3 showed differences with S1 and S2 but not with S4, while S2 did not show differences with S1 but differed with the other two sites. For S3 and S4, lower diversity values were obtained than S1 and S2, which exhibited higher values in their Shannon indices. The highest abundance and richness of fauna was found at S1 (1121 individuals; S’ = 52), specifically at 15 m (911 individuals; S’ = 43), while the lowest abundance and richness were recorded at S3 (169 individuals; S’ = 27) at 5 m (9 individuals; S’ = 3). The GLMM did not show significant differences between the four depths (F = 1.27; p = 0.28) for abundance but did for the Shannon indices, where 20 m, which showed the highest diversity value, differed from the other depths (Table 2). Richness was higher at 15 (S’ = 54) and 20 m (S’ = 53) compared to the shallowest depths (Table 2).
3.2. Percentage Coverage and Densities
The sessile fauna was more significant than the mobile fauna regarding mean coverage (3.12 ± 1.65% and 2.21 ± 0.06%, respectively). Still, when analyzed by site, the mobile fauna presented higher coverage values than the sessile fauna (except the S1). While the sessile fauna exhibited a consistent pattern, where values increased with increasing depth, the patterns of the mobile fauna varied between sites. S3 and S2 showed similar trends in mobile fauna with lower coverage at 5 m, increasing with depth. In contrast, S4 reached high coverage values in the shallows. In S1, the mobile fauna coverage remained constant in the first meters, and its value decreased from 15 to 20 m (Figure 2).
Figure 2.
Percentage coverage of each taxon and substrate in the four sampled sites at South Bay, Doumer Island (WAP). Due to the large number of taxa, they were grouped into five groups. The sessile included Porifera, Cnidaria, Bryozoa, Brachiopoda, and Chordata; mobiles included Mollusca, Nemertea, and Echinodermata; while green, red, and brown algae formed the group of macroalgae.
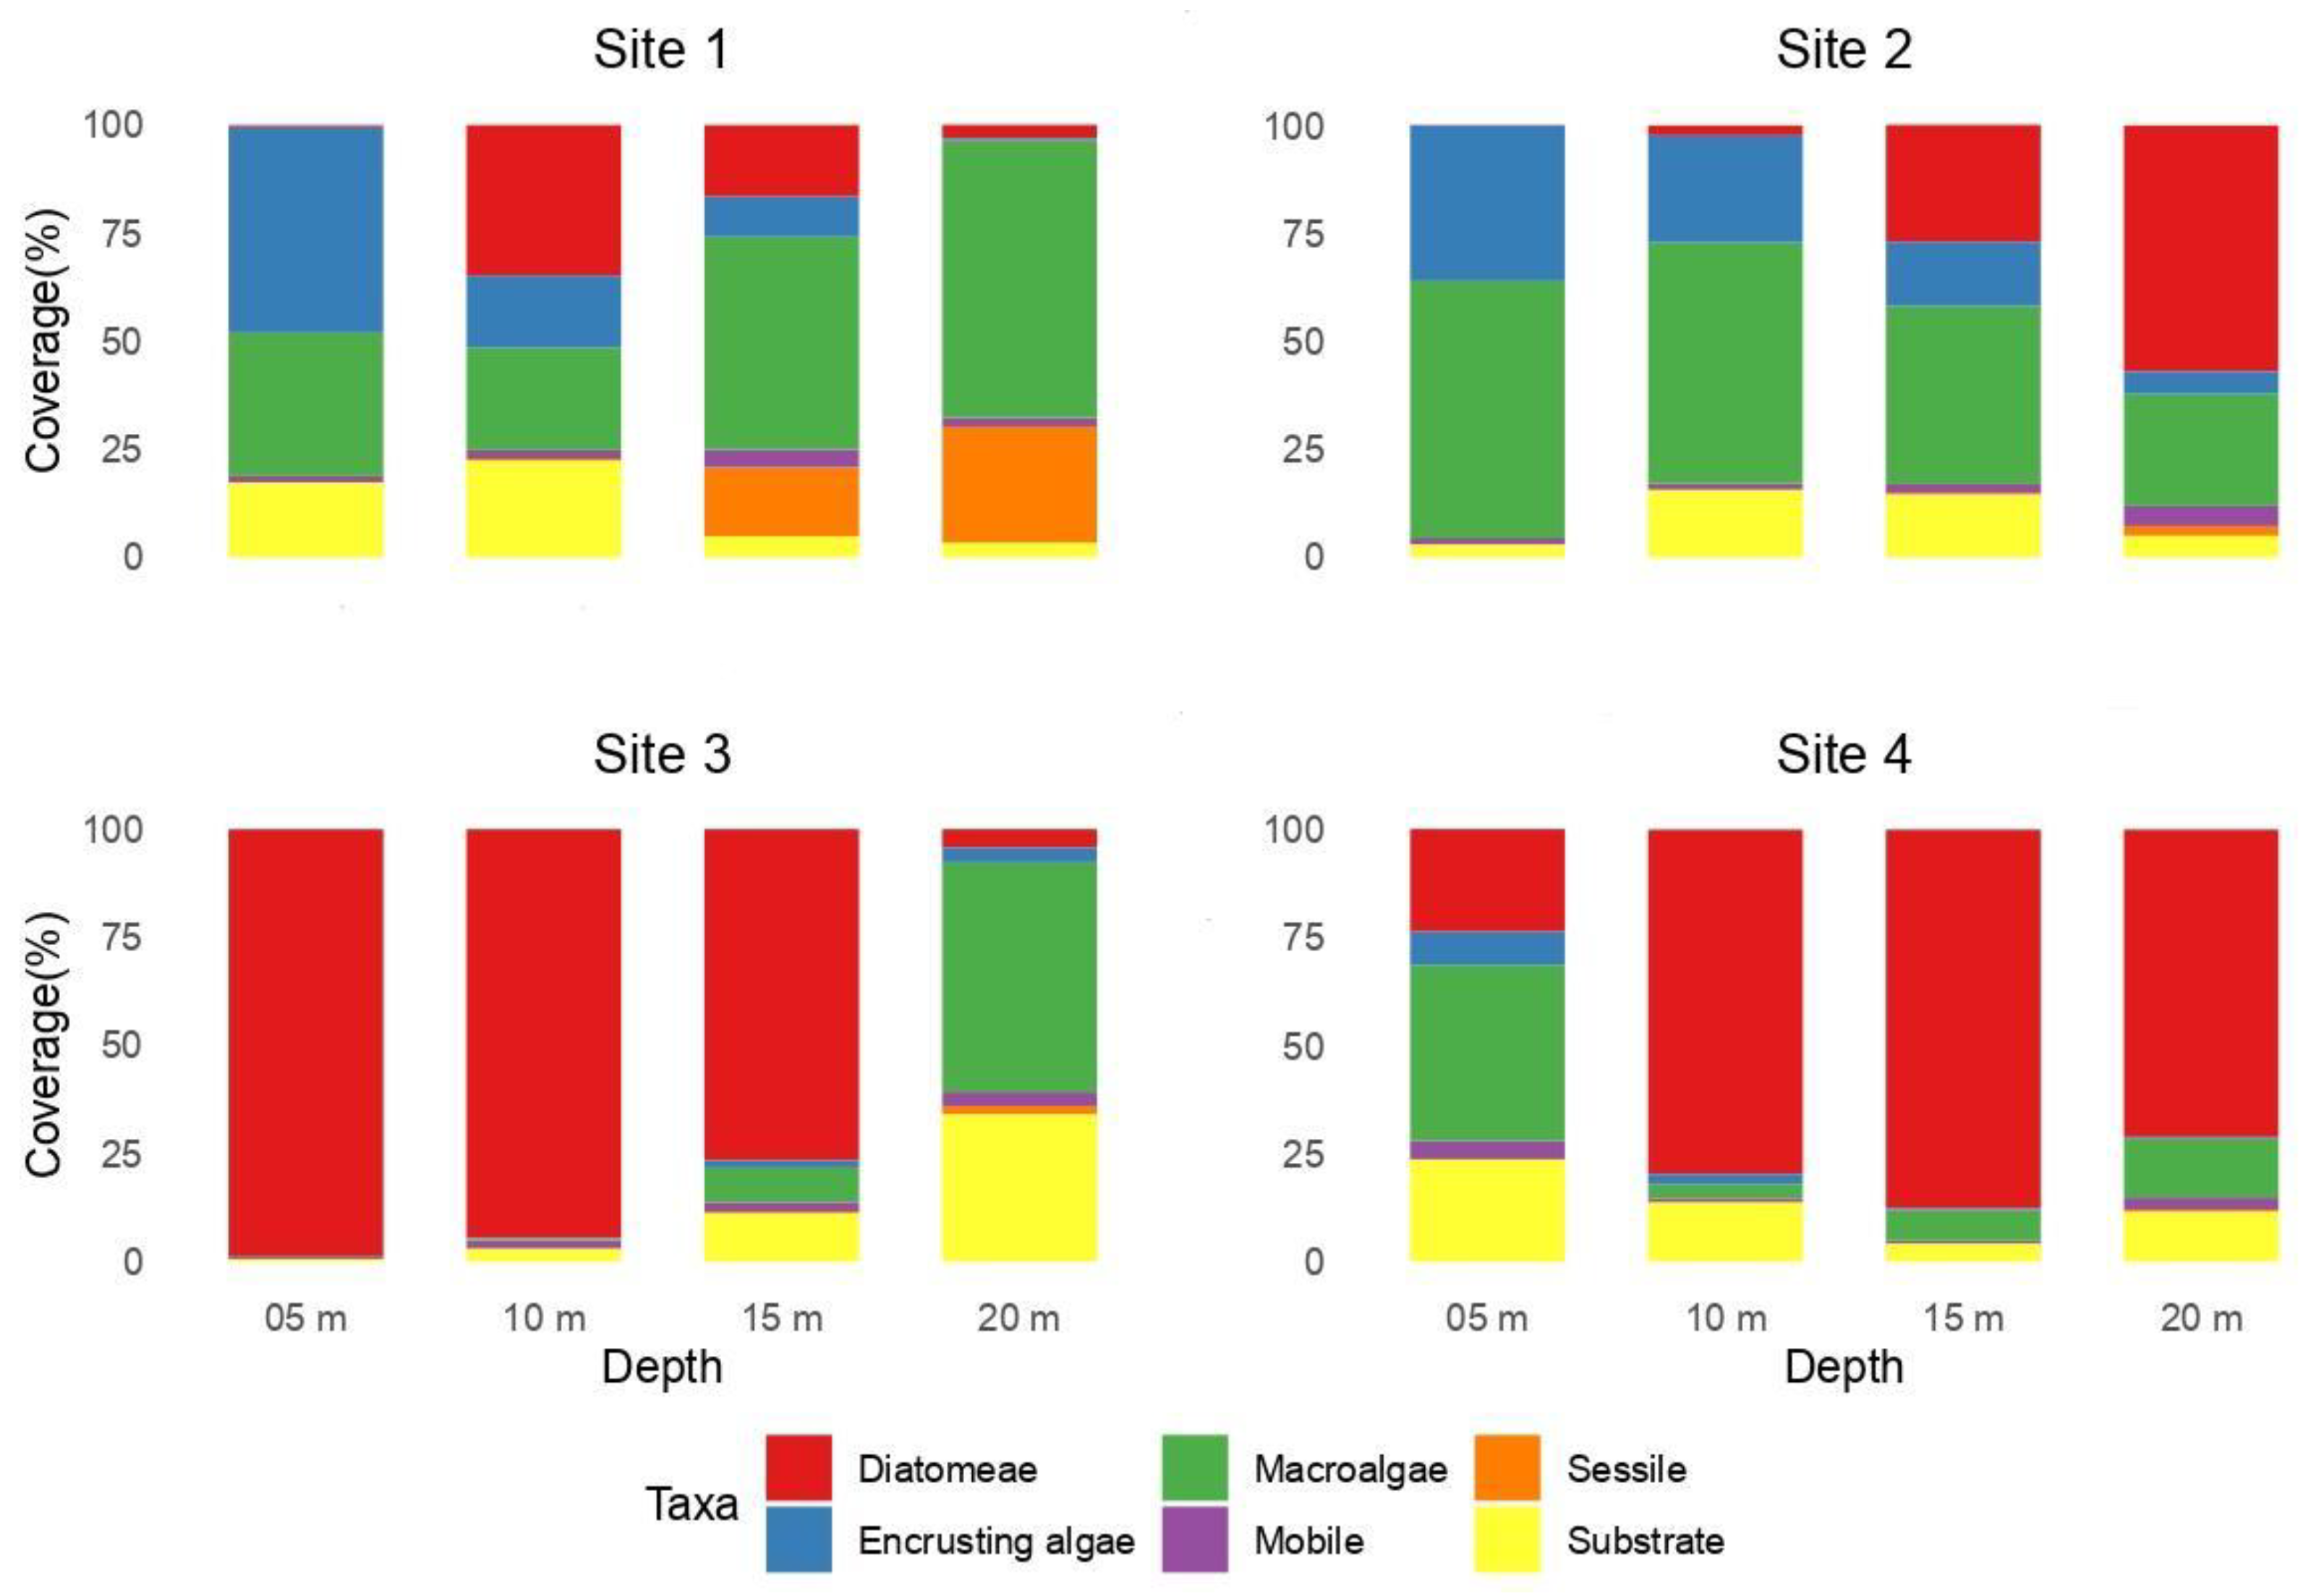
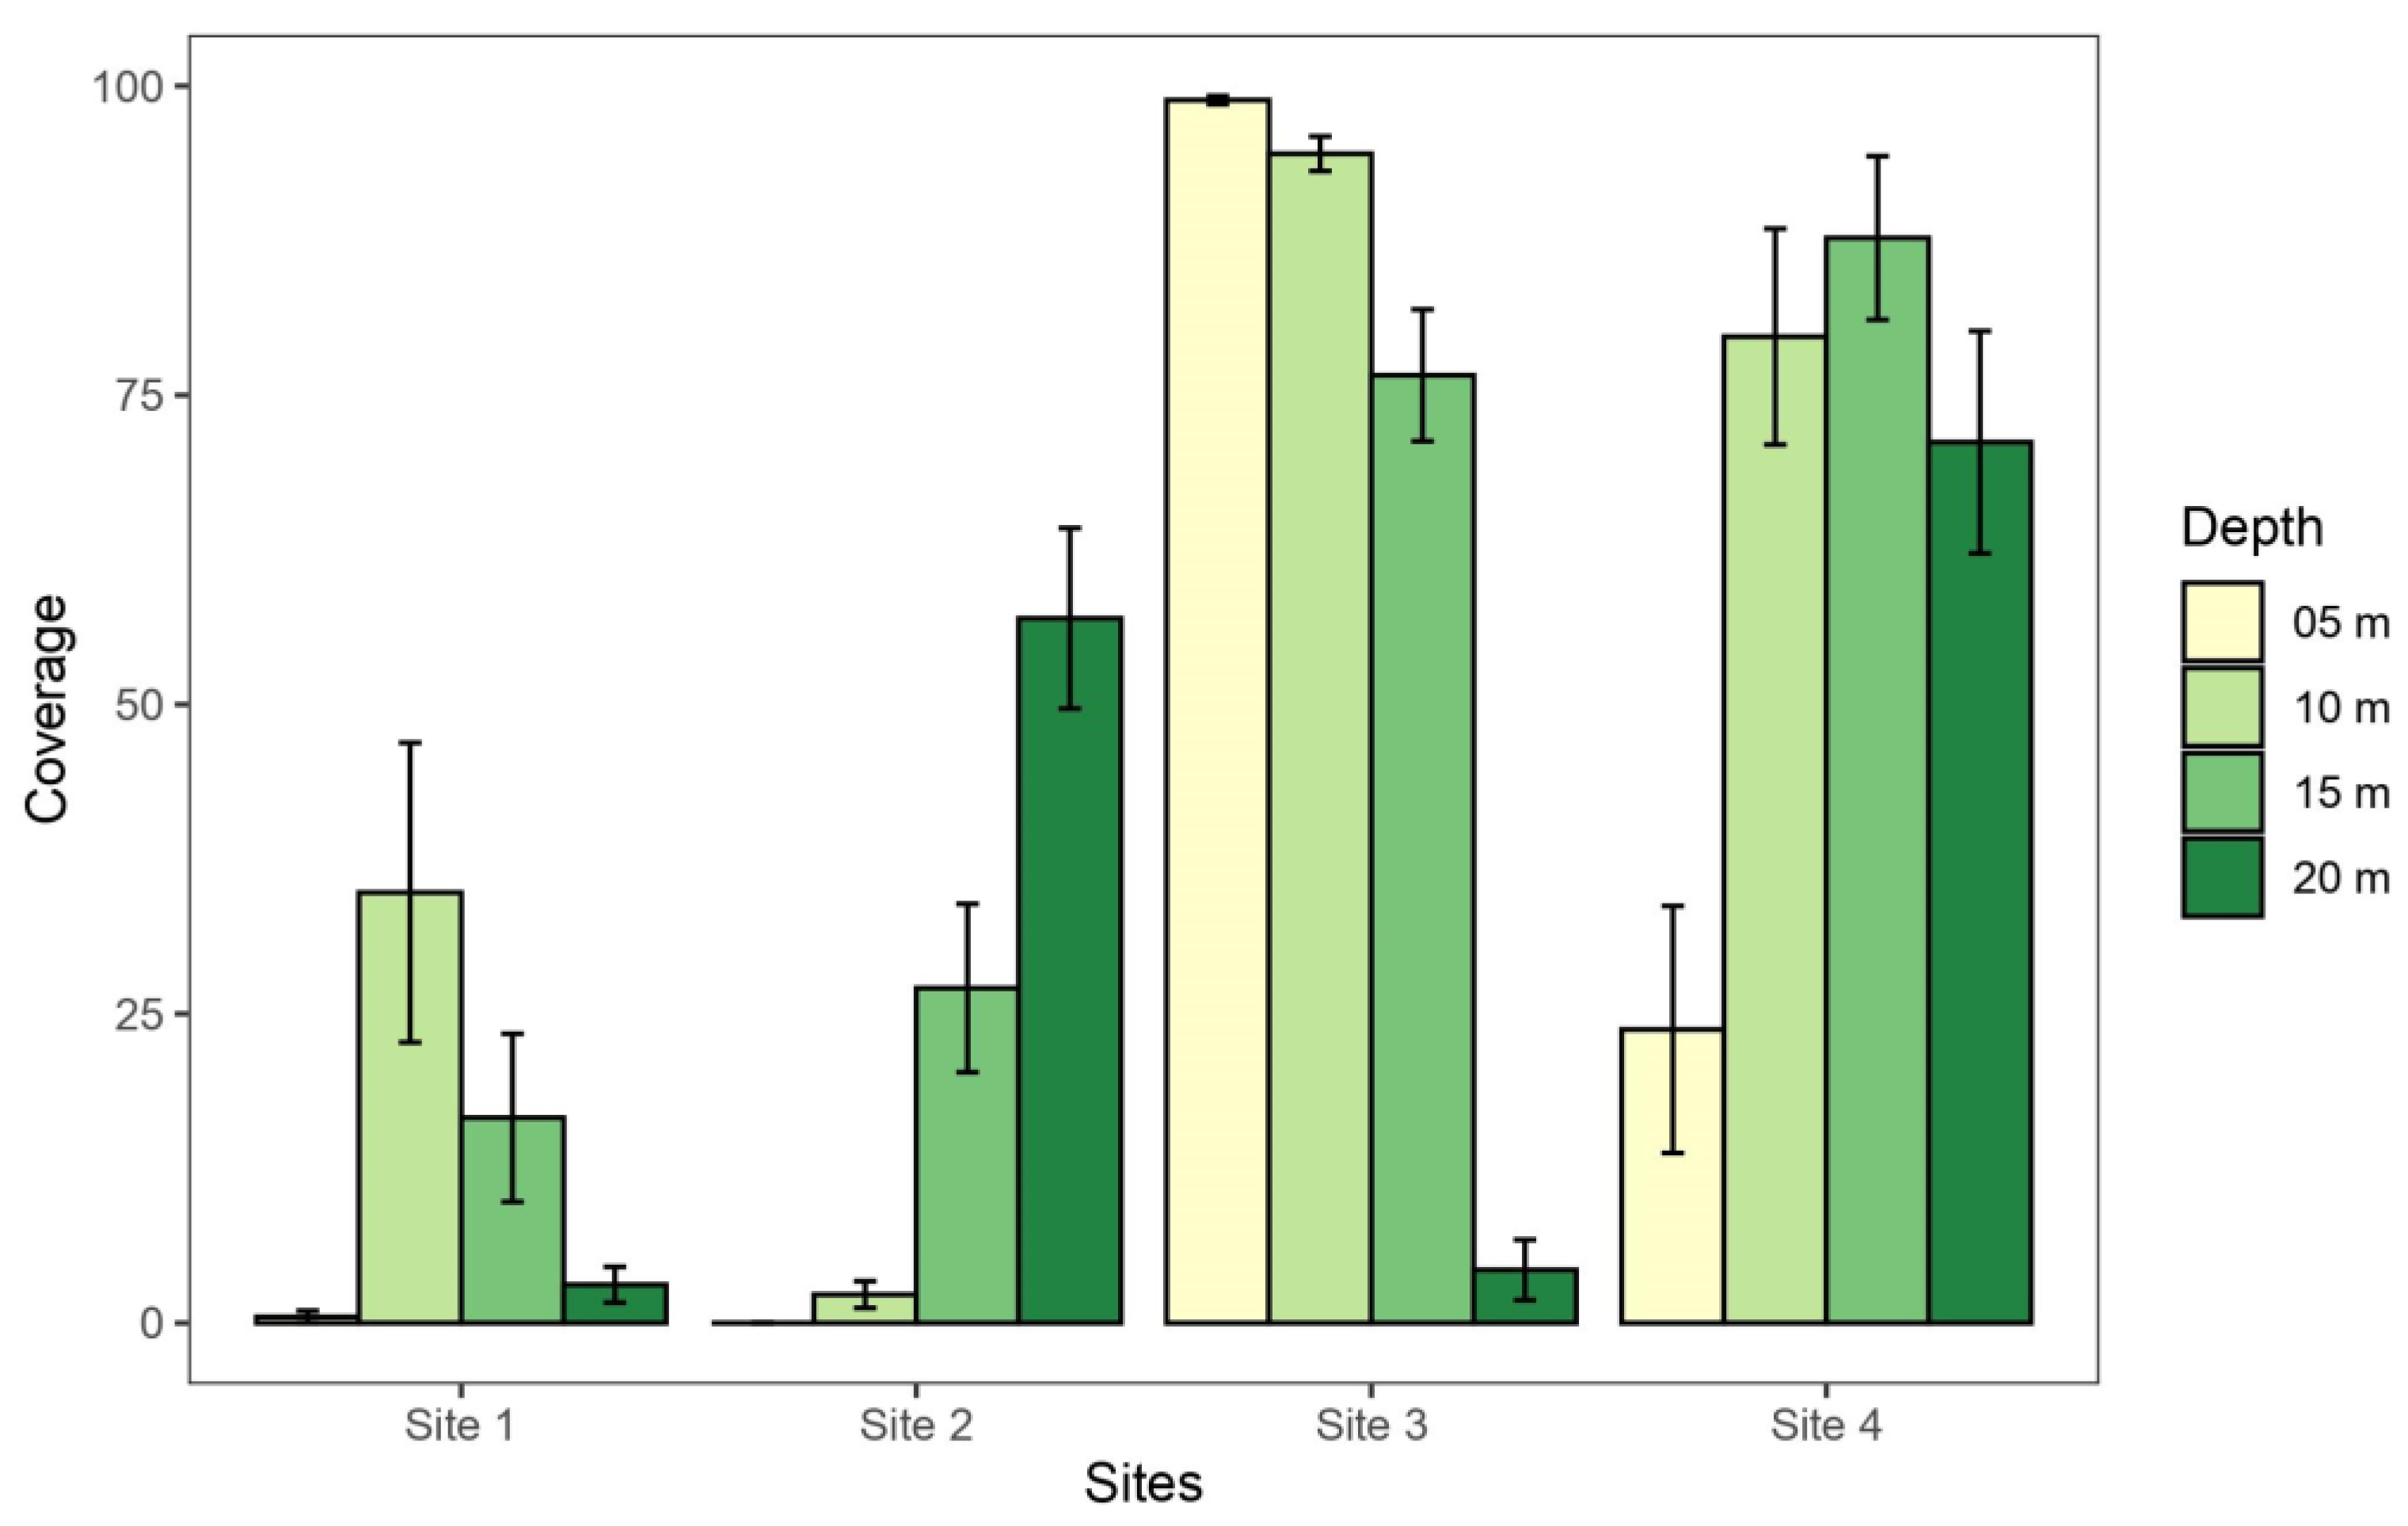
The taxon that presented the highest percentage of total coverage was Diatomeae (benthic diatoms), which covered an average of 42.37% (±11.87%) of the total transects. This taxon was recorded at all sites and depths except for at 5 m at S2 (Figure 3). The highest percentage coverage was recorded at the S3 site, at 5 and 10 m depths (98.85% and 94.52%, respectively).
Figure 3.
Percentage coverage of benthic diatoms (±SE) at each depth of the four sampled sites at South Bay, Doumer Island (WAP).
Figure 3.
Percentage coverage of benthic diatoms (±SE) at each depth of the four sampled sites at South Bay, Doumer Island (WAP).
Macroalgae was the second most important group in terms of total coverage, showing a mean coverage of close to 30% (29.94 ± 9.09%), with Himantothallus grandifolius and Palmaria decipiens being the main contributors. The highest coverage was registered in S1 and S2, with H. grandifolius having major coverage at these sites, while P. decipiens dominated in S3 and S4. Encrusting algae generally presented high percentages (: 10.68 ± 3.18%), showing higher coverage values at shallower levels and decreasing with depth (except for S3). In all the transects, the percentages of the substrates (bare soil, rock, or sand) were recorded, with coverages of between ~9% and ~13% per site, where S3 presented the lowest percentage at 5 m (0.6%) and the highest (34%) at 20 m (Figure 2).
Regarding fauna, Porifera were recorded at all sites (except for S3) (: 2.51 ± 2.17%), with an increase in density with increased depth. At 15 and 20 m from S1, the highest density of sponges was recorded, with 14 and 17.6 ind/m2, respectively. Mycale (Oxymycale) acerata and Sphaerotylus antarcticus were the most dominant species. Other fauna taxa were rare and presented an average coverage of less than 2% per site (Figure 2). However, some classes, such as Asteroidea, Anthozoa, and Holothuroidea, had high densities of individuals. Asteroidea were present at all locations and depths, with a significant abundance of the seastar Odontaster validus, which peaked in S3 at 15 m (27.2 ind.m2). Holothuroids were found between 15 and 20 m depth at all sites, with high-density values, particularly at S1 and S2 (20 ind.m2 and 12.4 ind.m2). The density decreased as depth increased in gastropods, which were represented mainly by the limpet Nacella concinna. S3 was an exception in this pattern, as no Margarella antarctica or Doris kerguelenensis individuals were recorded at 5 and 10 m, but they were present at the deepest depths. The maximum gastropod density peak was in the first meters of S4. Anemones (Class Anthozoa) were scarce and, due to their size, they did not present a great coverage. However, the highest density value of the entire sampling was recorded for the soft coral Clavularia sp., with densities of up to ~320 ind.m2 at S1. Ascidians (Class Ascidiacea) were absent in S2 and generally presented low coverage values and densities in the other sites (Figure 4) (see Supplementary Materials for complete taxa list details).
3.3. Multivariate Analysis
Multivariate analyses showed that the benthic assemblages were significantly different at each site (Global ANOSIM R = 0.25, p < 0.001, 9999 permutations). The test yielded an R close to zero for S1–S2 (R = 0.061) and for S3–S4 (R = 0.058), indicating that, although the differences were significant, the assemblages of these pairs of sites were highly similar between them (Table 3). Diatom filaments comprised the main dissimilarity between sites (with percentages of up to 12%), mainly in S3 and S4, where this taxon recorded high coverage values. Encrusting pink algae (absent in S3 and with minor coverage in S4) and macroalgae (mainly Palmaria decipiens and Himantothallus grandifolius) ranked second. Likewise, the contributions of the substrate (between 5 and 6% in some places) were significant. The fauna did not contribute large percentages of similarities within 60% of the contributing species. The low R values indicate that there were no significant dissimilarities between depths (Global ANOSIM R = 0.16, p < 0.03, 9999 permutations) and that the assemblages of contiguous depths were less dissimilar between them than with those at the greatest distance, indicating that communities at 15–20 m depth were more homogeneous than those at 5–20 m depth (Table 3). The pairwise comparison showed that higher dissimilarities were observed at 5 m, and that benthic diatoms, macroalgae, and encrusting algae were the taxa that contributed more to differences between depths, in the same way as for sites. Although in low percentages, some organisms belonging to the fauna, such as Nacella concinna and Odontaster validus, contributed to the differentiation between depths. The SIMPER tables are shown in the Supplementary Materials.
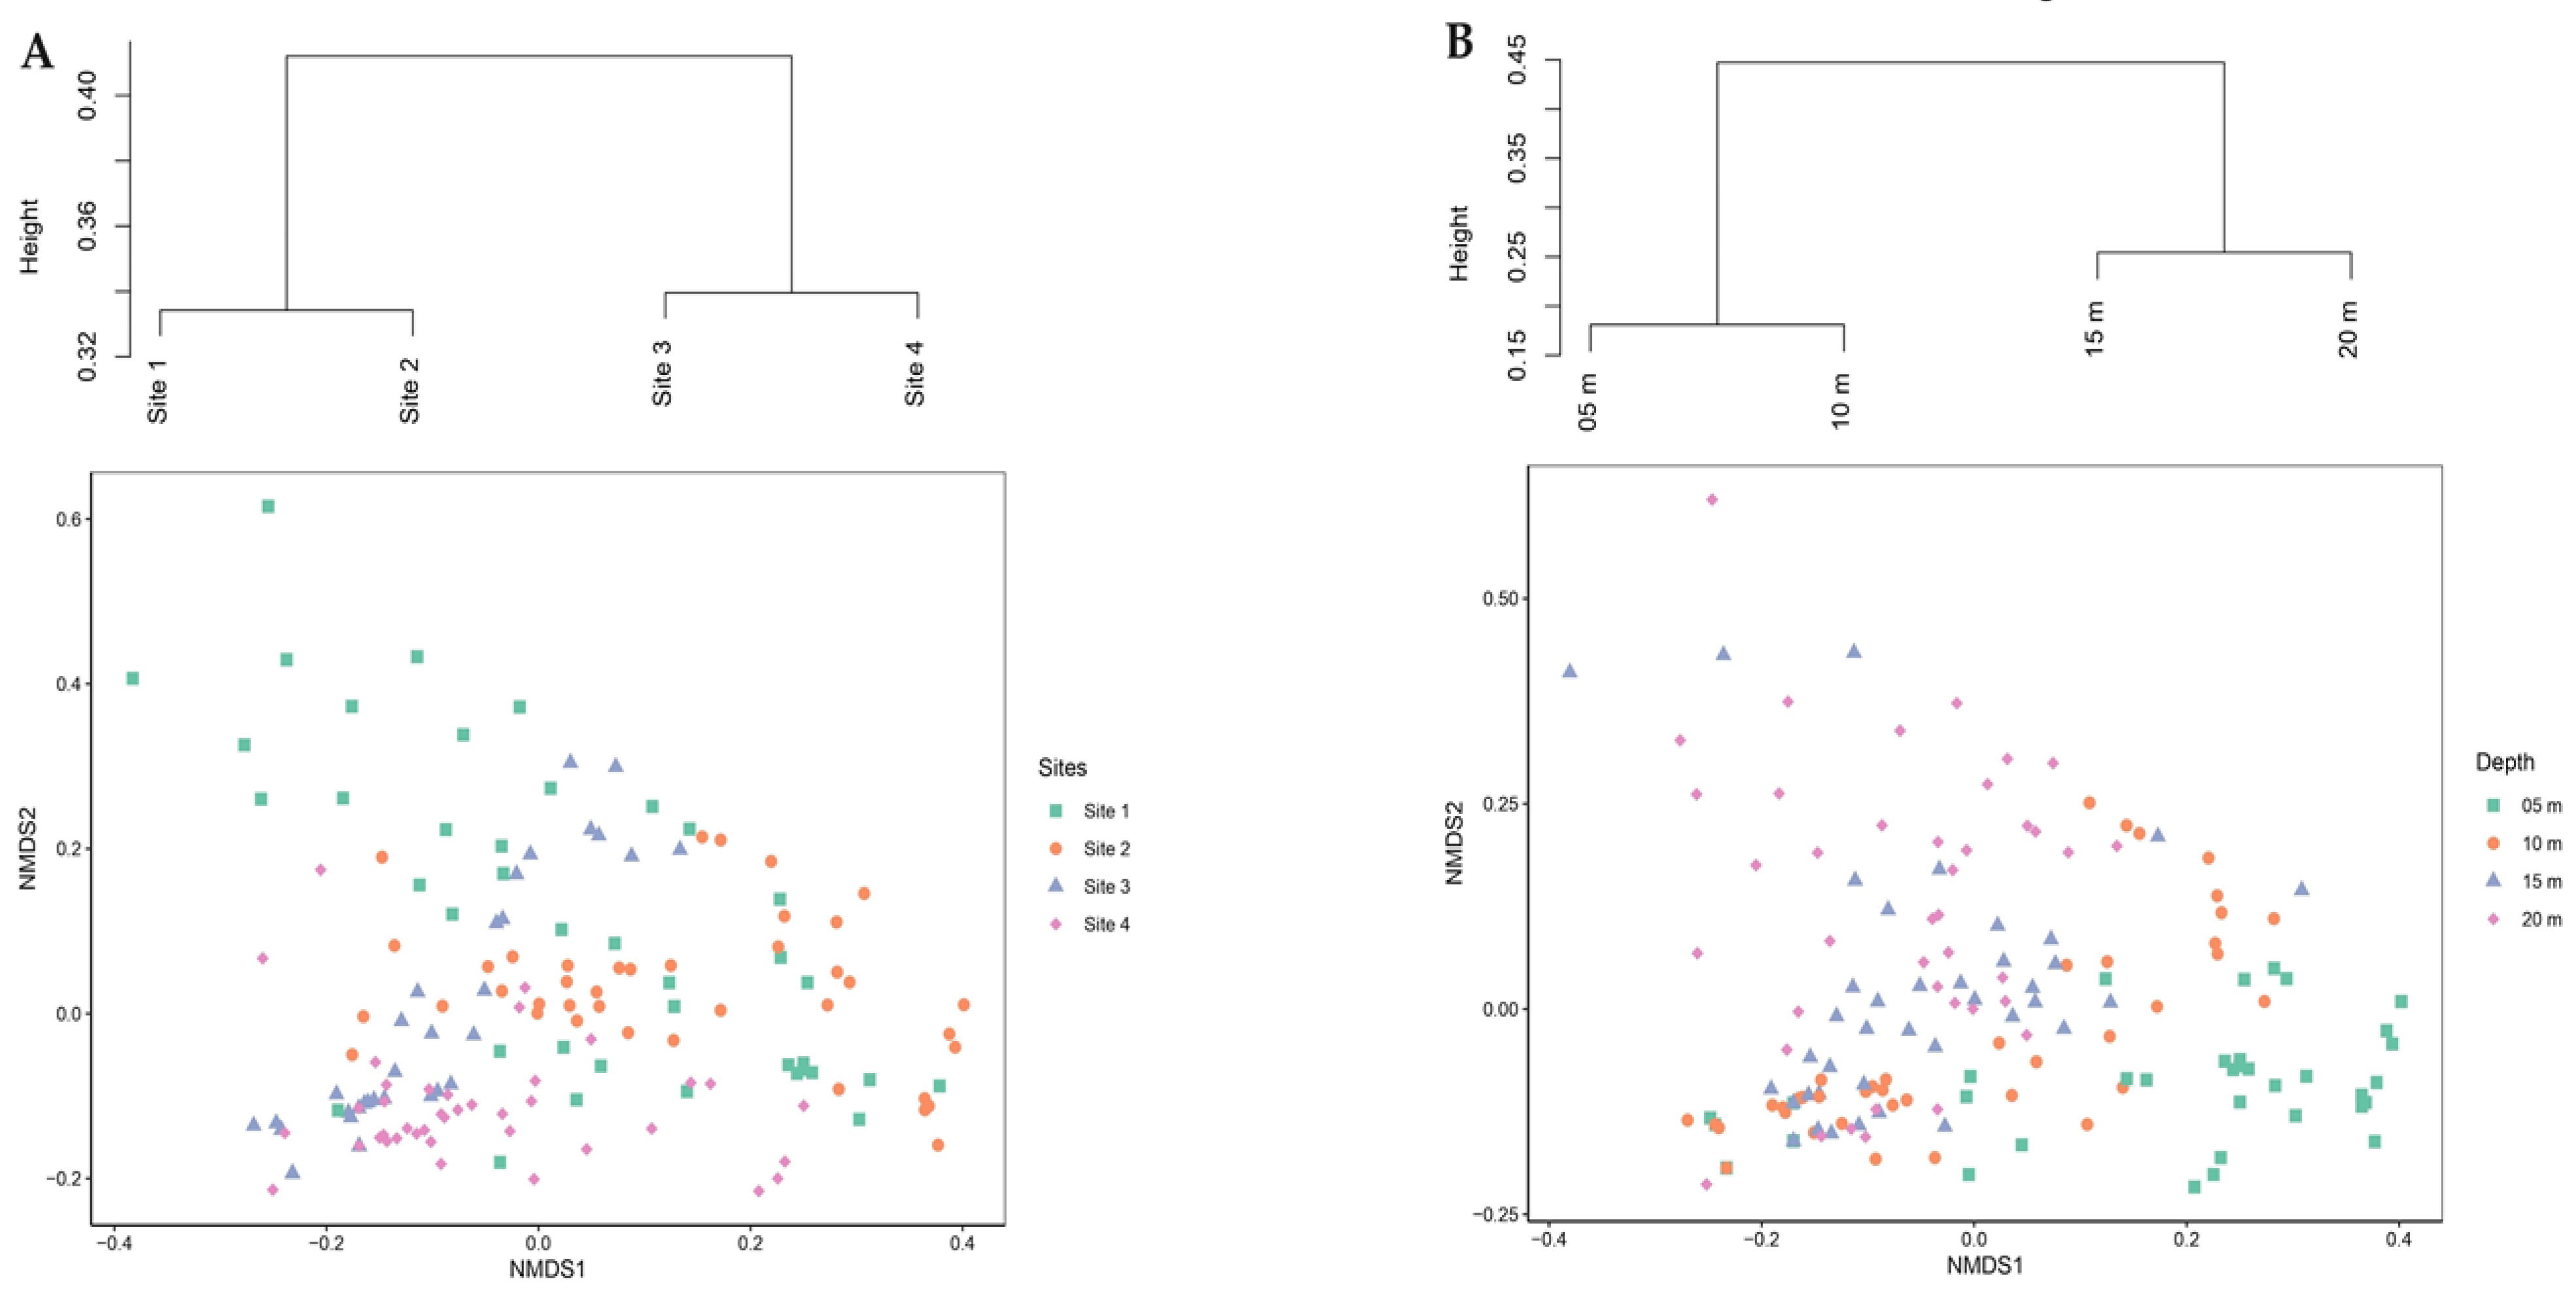
The ANOSIM test was consistent with the cluster analysis for sites, which were clustered in two main groups: S1–S2 and S3–S4, with a dissimilarity of 0.40 between them (Figure 5A). The nMDS ordination for depth revealed a slight gradient pattern from right to left from 5 to 20 m (Figure 5B). The cluster analysis of taxon coverage produced two clusters: one with the shallowest depths (5 and 10 m) and the other with the deepest (15 and 20 m), with a dissimilarity of 0.45 between them, in line with the ANOSIM test for depths.
4. Discussion
The only published antecedent on the characterization of the benthos of South Bay at the community level was published by Zamorano [46], but see [45]. Therefore, our work represents the most up-to-date and detailed information on the spatial patterns of the shallow-water benthic assemblages at South Bay, Doumer Island (Antarctic Peninsula). However, it is important to note that our objective was not to do a straight comparison between both works, mainly considering that (1) the sampling design and methodology are slightly different (sample collection vs. photoquadrats) and (2) our study covered a more extensive sampling area inside the Bay, including sites not previously sampled. Although a direct comparison cannot be conducted due to the absence of a comprehensive, long-term data set, we have taken Zamorano’s work as a starting point to report specific observations between past and present assemblages in this Antarctic fjord, which is highly important considering climate change’s current and future projections [53].
In the present study, 38 faunal taxa were recorded, almost the same amount (N = 39) Zamorano [46] documented for South Bay 40 years earlier. Many common species, such as Nacella concinna, Margarella antarctica, Odontaster validus, Labidiaster annulatus, Mycale (Oxymycale) acerata, some ascidians, and brachiopods, were recorded in both studies. However, six out of the 39 taxa documented by Zamorano belonged to Amphipoda and Isopoda, organisms not registered from our analyses due to their small size. In this regard, it is important to note that Zamorano’s methodology was based on manual sample collection in plastic bags, while our fieldwork data was based on photoquadrats. Phototransect is a noninvasive methodology with many advantages over manual collection, but it is a method that could sub-estimate the richness of small species. On the other hand, the absence in our transects of some species documented in the Zamorano study, such as the brittle star Ophionotus victoriae, Laternula elliptica, and other bivalves (five taxa in total), could be explained by differences in the topography of the sampled sites, because those species mainly occur in soft substrates [54,55,56,57], which were not sampled here.
The absence of the sea urchin Sterechinus neumayeri is striking since it is a very common member of the Antarctic benthic communities [27,58,59,60] and especially since its contribution to the biomass of South Bay was one of the highest in Zamorano’s study in the early 1980s. An increased temperature in South Bay could not explain this absence, since this species has proven to be an organism resistant to increased water temperature [61,62]. Although our data were collected by photography, our observations on the lack of records of S. neumayeri are also supported by hundreds of dives conducted in the bay since the reopening of the Yelcho station, with no records of this species by any of the groups conducting diving since 2014. In addition, a recent study by Amsler et al. [60] studying potential correlations between sea ice cover and macroalgal cover along the WAP, reported a clear pattern of an abundance of S. neumayeri with a low presence in northern sites (around Anvers and Doumer Islands) and an increasing presence at southern sites (e.g., Marguerite Bay). Amsler et al. [60] also noted some differences with previous records around Palmer Station (Anvers Island), where abundances in the late 1980s ranged between 0 to 8 sea urchins m−2. A similar situation occurred in McMurdo Sound, Ross Sea Region, where S. neumayeri was reported missing in the 2010 surveys [63]. The authors explained that this heavy decrease was mainly due to sedimentation and changes in the size of food particles caused by a change in productivity in the area due to a blockage of the currents by icebergs and a possible increase in the iron released by the melting of glaciers. This potential situation could have occurred in South Bay; however, more studies are needed to determine the possible causes of the absence of S. neumayeri.
Another interesting outcome to highlight is the presence of benthic filamentous diatoms in almost all sampled sites and depths, a phenomenon not previously reported in South Bay. In our study, benthic diatoms were the taxon with the highest coverage, covering almost 50% of the sampled transects on average. Recent works associate diatom blooms with areas influenced by sediment inflow from melting glaciers [64,65,66,67,68]. In our study, the highest coverage percentages of these benthic diatoms were recorded at S3 and S4, both sites with significant glacial influence. Additionally, similar to the work of Ahn et al. [64], here we observed evidence of the massive blooming of benthic diatoms in shallow seafloor substrates, including many filter-feeders completely covered with a thick growth of diatoms. These new observations are important considering that benthic diatoms constitute a potential primary food item for secondary producers and represent appropriate indicator taxa for predicting the status of the sensitive polar benthic community in fast-retreating glacial areas under the current global warming regime [69].
Structural Patterns and Possible Driving Factors
In this study, the mean total coverage of the sessile fauna was greater than that of the mobile fauna. However, this was mainly due to the great coverage of sessile organisms in S1, since, when analyzing the average coverage by sites, mobile organism coverage exceeded that of sessile organisms in all sites except S1. These results are consistent with those described by Zamorano [46] for South Bay, where the sessile macrofauna were described as diverse but not very abundant up to 20 m. The prevalence of sessile epibenthic filter feeders is a common and extended feature of Antarctic benthic assemblages [56]. Here, the low coverage of small sessile organisms could be due to underestimating their real coverage since large amounts of macroalgae or the large fronds of Himantothallus grandifolius can cover these individuals (see Newcombe and Cardenas, 2011). Porifera was the sessile faunal taxon with the highest coverage, and Mycale (Oxymycale) acerata was the most abundant species recorded. A total richness of 15 taxa of Porifera was recorded for the entire bay, which is consistent with the previous records by Zamorano [47] and Cárdenas et al. [39]. The sponge abundance peaked between 15 and 20 m at S1, which could be partly influenced by the abundant presence of large macroalgae that allow the development of positive algae–sponge interactions [40,70,71,72] Regarding mobile organisms, the seastars Granaster nutrix and Odontaster validus, and the limpet Nacella concinna, constituted the most numerous species in this study. Granaster nutrix had not been registered in South Bay until now, but O. validus and N. concinna had already been recorded as among the most abundant mobile species within this fjord [46]. Odontaster validus was the most abundant species, with a mean density similar to that found on Anvers Island [59] and higher than that reported for McMurdo Sound [73]. Their conspicuous presence in all sites could be due to their ability to vary resource utilization across differing habitat compositions, which may be a key response allowing their persistence and survival in the face of environmental change [74]. The limpet N. concinna showed a significant density in the first meters of all the sites (except for S3); in S4, it was responsible for the high total fauna abundance values, registering at 5 m a density of limpets up to four times greater than in the other sites.
Depth has been recognized as a crucial element in structuring benthic communities in several Antarctic locations due to the lowering of the impact of ice as depth increases [31,34,75]. The present study shows a bathymetric change from assemblages with less diversity and richness in shallow depths to more diverse assemblages at greater depths. Our results also show that assemblages were not clustered clearly by depths, but were broadly arranged along a trajectory of increasing depth, where the adjacent depth stations became generally more similar with increasing depth. The diversity pattern found along the bathymetric gradient coincides with that previously described in other coastal areas of the WAP [28,36,46,52,75,76]. Decreasing the frequency of disturbance with depth may have resulted in communities at 20 m being more homogenous and characterized by structural sessile fauna, which may have promoted diversity by increasing habitat complexity and providing substrate for epifauna. Here, sessile forms dominated at greater depths, and species richness was higher at S1 than at S2, S3, and S4. The S1 site had the steepest sloped topography, with an almost vertical cliff face, and therefore may have been more protected than horizontal ones due to a reduction in the abrasive effect of ice [38,77]. The vertical cliffs could also lessen the effect of other factors, such as sediment accumulation [19,78] and water flow [79], or even offer concave reliefs for the settlement of species with negative phototropic larvae [80]. In addition, the bathymetry decreases abruptly near S1, which would prevent the substrate from being impacted by the larger icebergs. As a result of these decreased disturbance pressures, S1 may have developed more complex sessile assemblages. The S3 and S4 sites showed the lowest richness and Shannon indices; both sites are characterized by the weakest slopes, which might exhibit a more significant impact surface, with greater probabilities of impact on the benthic communities settled there. No clear distribution patterns were detected regarding percentage cover, demonstrating a highly heterogeneous environment, which was already reported for South Bay by [40] and [45].
In this work, we deepen and update our knowledge about the structure of benthic assemblages in South Bay, an Antarctic fjord located in a region that has registered major warming in the last 60 years. Systematically obtaining ecological data in a continuous and extensive time series is a great pending matter in the polar regions. However, sporadic sampling in the same localities and with similar methodologies allows, at least, the drawing of attention to specific evident changes over time. In that sense, after comparing two “snapshots” separated by 40 years, our work also asks two open-ended questions: (1) why is there a striking absence of Sterechinus neumayeri, one of the most abundant echinoids in Antarctica and one of the most dominant in number and biomass in the former study conducted here?; (2) what is causing the occurrence of massive blooming of benthic diatoms associated with the benthic megafauna? It should be noted that these massive blooms of benthic diatoms had never been recorded in this fjord, but it is a phenomenon that has been documented on the rise in recent years in shallow Antarctic waters.
Considering the observed changes recorded here, along with the previous records of significant variability in seawater temperature of South Bay and the general increase in air temperatures in the WAP, we can expect that disturbances due to faster glacier retreats will be intensified and expand further into this fjord and other adjacent areas. In this sense, monitoring benthic communities and understanding environmental drivers influencing the structure and diversity of shallow communities in the Antarctic glacial fjords is crucial to understanding these rapidly changing ecosystems.
Supplementary Materials
The following supporting information can be downloaded at: https://www.mdpi.com/article/10.3390/d16030162/s1, Table S1: Full Taxonomic list of taxa present in South Bay, Doumer Island, Antarctica; Table S2: (A) SIMPER analysis showing the differences between assemblages from different sites. Taxa are shown (60% “cut-off”) and their contribution to dissimilarity. Abbreviations: EA: encrusting algae; (B) SIMPER analysis showing the differences between assemblages from different depths. Taxa are shown (60% “cut-off”) and their contribution to dissimilarity. Abbreviations: EA: encrusting algae; indet.: indeterminates.
Author Contributions
S.M.: data curation; formal analysis; visualization; writing—original draft. C.A.C.: methodology; writing—review and editing. D.B.-G.: data curation; formal analysis. C.L.: conceptualization; methodology; data curation; writing—review and editing. All authors have read and agreed to the published version of the manuscript.
Funding
This research was funded by ANID/FONDECYT/INACH/INICIACION (#11150129), INACH “Marine Protected Areas” Program (2403052), ANID/Millennium Science Initiative Program (ICN2021_002) and National Geographic Society (Grant #CP-097R-17).
Institutional Review Board Statement
Not applicable.
Data Availability Statement
The original contributions presented in the study are included in the article, further inquiries can be directed to the corresponding authors.
Acknowledgments
CC is supported by the INACH “Marine Protected Areas” Program and ANID/Millennium Science Initiative Program (ICN2021_002). Logistic and financial support was also provided by Consejo Nacional de Investigaciones Científicas y Técnicas (CONICET) and National Geographic Society (Grant #CP-097R-17). We thank Pablo Merlo and Fernando Casanoves for helping with analysis and statistics, and Macaya, Deregibus, and Díaz Lorca for helping with species identification.
Conflicts of Interest
The authors declare that the research was conducted in the absence of any commercial or financial relationships that could be construed as potential conflicts of interest.
References
- Pörtner, H.O.; Roberts, D.C.; Adams, H.; Adler, C.; Aldunce, P.; Ali, E.; Begum, R.A.; Betts, R.; Kerr, R.B.; Biesbroek, R. Climate Change 2022: Impacts, Adaptation and Vulnerability; IPCC: Geneva, Switzerland, 2022. [Google Scholar]
- Steig, E.J.; Schneider, D.P.; Rutherford, S.D.; Mann, M.E.; Comiso, J.C.; Shindell, D.T. Warming of the Antarctic ice-sheet surface since the 1957 International Geophysical Year. Nature 2009, 457, 459–462.56. [Google Scholar] [CrossRef] [PubMed]
- Cárdenas, C.A.; González-Aravena, M.; Santibañez, P.A. The importance of local settings: Within-year variability in seawater temperature at South Bay, Western Antarctic Peninsula. PeerJ 2018, 6, e4289. [Google Scholar] [CrossRef] [PubMed]
- Stenni, B.; Curran, M.A.J.; Abram, N.J.; Orsi, A.; Goursaud, S.; Masson-Delmotte, V.; Neukom, R.; Goosse, H.; Divine, D.; van Ommen, T.; et al. Antarctic climate variability on regional and continental scales over the last 2000 years. Clim. Past 2017, 13, 1609–1634. [Google Scholar] [CrossRef]
- Robinson, S.A.; Klekociuk, A.R.; King, D.H.; Pizarro Rojas, M.; Zúñiga, G.E.; Bergstrom, D.M. The 2019/2020 summer of Antarctic heatwaves. Glob. Chang. Biol. 2020, 26, 3178–3180. [Google Scholar] [CrossRef]
- Turner, J.; Marshall, G.J.; Clem, K.; Colwell, S.; Phillips, T.; Lu, H. Antarctic temperature variability and change from station data. Int. J. Climatol. 2020, 40, 2986–3007. [Google Scholar] [CrossRef]
- Turner, J.; Maksym, T.; Phillips, T.; Marshall, G.J.; Meredith, M.P. The impact of changes in sea ice advance on the large winter warming on the western Antarctic Peninsula. Int. J. Climatol. 2013, 33, 852–861. [Google Scholar] [CrossRef]
- Hauri, C.; Doney, S.C.; Takahashi, T.; Erickson, M.; Jiang, G.; Ducklow, H.W. Two decades of inorganic carbon dynamics along the West Antarctic Peninsula. Biogeosciences 2015, 12, 6761–6779. [Google Scholar] [CrossRef]
- Jones, E.M.; Fenton, M.; Meredith, M.P.; Clargo, N.M.; Ossebaar, S.; Ducklow, H.W.; Venables, H.J.; de Baar, H.J. Ocean acidification and calcium carbonate saturation states in the coastal zone of the West Antarctic Peninsula. Deep Sea Res. Part II Top. Stud. Oceanogr. 2017, 139, 181–194. [Google Scholar] [CrossRef]
- Shepherd, A.; Ivins, E.R.; Barletta, V.R.; Bentley, M.J.; Bettadpur, S.; Briggs, K.H.; Bromwich, D.H.; Forsberg, R.; Galin, N.; Horwath, M.; et al. A reconciled estimate of ice-sheet mass balance. Science 2012, 338, 1183–1189. [Google Scholar] [CrossRef]
- Thomas, E.R.; Hosking, J.S.; Tuckwell, R.R.; Warren, R.A.; Ludlow, E.C. Twentieth-century increase in snowfall in coastal West Antarctica. Geophys. Res. Lett. 2015, 42, 9387–9393. [Google Scholar] [CrossRef]
- Thomas, E.R.; Van Wessem, J.M.; Roberts, J.; Isaksson, E.; Schlosser, E.; Fudge, T.J.; Vallelonga, P.; Medley, B.; Lenaerts, J.; Bertler, N.; et al. Regional Antarctic snow accumulation over the past 1000 years. Clim. Past 2017, 13, 1491–1513. [Google Scholar] [CrossRef]
- Morecroft, M.D.; Duffield, S.; Harley, M.; Pearce-Higgins, J.W.; Stevens, N.; Watts, O.; Whitaker, J. Measuring the success of climate change adaptation and mitigation in terrestrial ecosystems. Science 2019, 366, eaaw9256. [Google Scholar] [CrossRef]
- Siegert, M.; Atkinson, A.; Banwell, A.; Brandon, M.; Convey, P.; Davies, B.; Downie, R.; Edwards, T.; Hubbard, B.; Marshall, G.; et al. The Antarctic Peninsula under a 1.5 C global warming scenario. Front. Mar. Sci. 2019, 7, 102. [Google Scholar] [CrossRef]
- Morley, S.A.; Abele, D.; Barnes, D.K.; Cárdenas, C.A.; Cotté, C.; Gutt, J.; Henley, S.F.; Höfer, J.; Hughes, K.A.; Martin, S.M.; et al. Global drivers on Southern Ocean ecosystems: Changing physical environments and anthropogenic pressures in an Earth system. Front. Mar. Sci. 2020, 7, 1097. [Google Scholar] [CrossRef]
- Quartino, M.L.; Deregibus, D.; Campana, G.L.; Latorre, G.E.J.; Momo, F.R. Evidence of macroalgal colonization on newly ice-free areas following glacial retreat in Potter Cove (South Shetland Islands), Antarctica. PLoS ONE 2013, 8, e58223. [Google Scholar] [CrossRef] [PubMed]
- Sahade, R.; Lagger, C.; Torre, L.; Momo, F.; Monien, P.; Schloss, I.; Barnes, D.K.A.; Servetto, N.; Tarantelli, S.; Tatián, M.; et al. Climate change and glacier retreat drive shifts in an Antarctic benthic ecosystem. Sci. Adv. 2015, 1, e1500050. [Google Scholar] [CrossRef] [PubMed]
- Lagger, C.; Servetto, N.; Torre, L.; Sahade, R. Benthic colonization in newly ice-free soft bottom areas in an Antarctic fjord. PLoS ONE 2017, 12, e0186756. [Google Scholar] [CrossRef] [PubMed]
- Lagger, C.; Nime, M.; Torre, L.; Servetto, N.; Tatián, M.; Sahade, R. Climate change, glacier retreat and a new ice-free island offer new insights on Antarctic benthic responses. Ecography 2018, 41, 579–591. [Google Scholar] [CrossRef]
- Lee, J.R.; Raymond, B.; Bracegirdle, T.J.; Chadès, I.; Fuller, R.A.; Shaw, J.D.; Terauds, A. Climate change drives expansion of Antarctic ice-free habitat. Nature 2017, 547, 49–54. [Google Scholar] [CrossRef] [PubMed]
- Cárdenas, L.; Leclerc, J.C.; Bruning, P.; Garrido, I.; Détrée, C.; Figueroa, A.; Astorga, M.; Navarro, J.M.; Johnson, L.E.; Carlton, J.T.; et al. First mussel settlement observed in Antarctica reveals the potential for future invasions. Sci. Rep. 2020, 10, 5552. [Google Scholar] [CrossRef] [PubMed]
- Abram, N.J.; Mulvaney, R.; Wolff, E.W.; Triest, J.; Kipfstuhl, S.; Trusel, L.D.; Vimeux, F.; Fleet, L.; Arrowsmith, C. Acceleration of snow melt in an Antarctic Peninsula ice core during the twentieth century. Nat. Geosci. 2013, 6, 404–411. [Google Scholar] [CrossRef]
- Paolo, F.S.; Fricker, H.A.; Padman, L. Volume loss from Antarctic ice shelves is accelerating. Science 2015, 348, 327–331. [Google Scholar] [CrossRef]
- Cook, A.J.; Holland, P.R.; Meredith, M.P.; Murray, T.; Luckamn, A.; Vaughan, D.G. Ocean forcing of glacier retreat in the western Antarctic Peninsula. Science 2016, 353, 283–286. [Google Scholar] [CrossRef]
- Turner, J.; Hosking, J.S.; Bracegirdle, T.J.; Marshall, G.J.; Phillips, T. Recent changes in Antarctic sea ice. Philos. Trans. R. Soc. 2015, 373, 20140163. [Google Scholar] [CrossRef] [PubMed]
- Masson, R.A.; Scambos, T.A.; Bennetts, L.G.; Reid, P.; Squire, V.A.; Stammerjohn, S.E. Antarctic ice shelf disintegration triggered by sea ice loss and ocean swell. Nature 2018, 558, 383–389. [Google Scholar] [CrossRef] [PubMed]
- Smale, D.A. Ecological traits of benthic assemblages in shallow Antarctic waters: Does ice scour disturbance select for small, mobile, secondary consumers with high dispersal potential? Polar Biol. 2008, 31, 1225–1231. [Google Scholar] [CrossRef]
- Smale, D.A.; Barnes, D.K.A. Likely responses of the Antarctic benthos to climate-related changes in physical disturbance during the 21st century, based primarily on evidence from the West Antarctic Peninsula region. Ecography 2008, 31, 289–305. [Google Scholar] [CrossRef]
- Barnes, D.K.A.; Souster, T. Reduced survival of Antarctic benthos linked to climate-induced iceberg scouring. Nat. Clim. Chang. 2011, 1, 365–368. [Google Scholar] [CrossRef]
- Barnes, D.K.A.; Fenton, M.; Cordingley, A. Climate-linked iceberg activity massively reduces spatial competition in Antarctic shallow waters. Curr. Biol. 2014, 24, R553–R554. [Google Scholar] [CrossRef] [PubMed]
- Barnes, D.K.A. Iceberg killing fields limit huge potential for benthic blue carbon in Antarctic shallows. Glob. Chang. Biol. 2017, 23, 2649–2659. [Google Scholar] [CrossRef] [PubMed]
- Gutt, J.; Piepenburg, D. Scale-dependent impact on diversity of Antarctic benthos caused by grounding of icebergs. Mar. Ecol. Prog. Ser. 2003, 253, 77–83. [Google Scholar] [CrossRef]
- Conlan, K.E.; Kvitek, R.G. Recolonization of soft-sediment ice scours on an exposed Arctic coast. Mar. Ecol. Prog. Ser. 2005, 286, 21–42. [Google Scholar] [CrossRef]
- Smale, D.A. Continuous benthic community change along a depth gradient in Antarctic shallows: Evidence of patchiness but not zonation. Polar Biol. 2007, 31, 189–198. [Google Scholar] [CrossRef]
- Barnes, D.K.A. Sublittoral epifaunal communities at Signy Island, Antarctica. I. The ice foot zone. Mar. Biol. 1995, 121, 555–563. [Google Scholar] [CrossRef]
- Barnes, D.K.A. Sublittoral epifaunal communities at Signy Island, Antarctica. II. Below the ice foot zone. Mar. Biol. 1995, 121, 565–572. [Google Scholar] [CrossRef]
- Gutt, J.; Barratt, I.; Domack, E.; d’Acoz, C.D.U.; Dimmler, W.; Grémare, A.; Heilmayer, O.; Isla, E.; Janussen, D.; Jorgensen, E.; et al. Biodiversity change after climate-induced ice-shelf collapse in the Antarctic. Deep Sea Res. Part II Top. Stud. Oceanogr. 2011, 58, 74–83. [Google Scholar] [CrossRef]
- Laudien, J.; Orchard, J.B. The significance of depth and substratum incline for the structure of a hard bottom sublittoral community in glacial Kongsfjorden (Svalbard, Arctic)—An underwater imagery approach. Polar Biol. 2012, 35, 1057–1072. [Google Scholar] [CrossRef]
- Cárdenas, C.A.; Newcombe, E.M.; Hajdu, E.; Gonzalez-Aravena, M.; Geange, S.W.; Bell, J.J. Sponge richness on algae-dominated rocky reefs in the Western Antarctic Peninsula and the Magellan Strait. Polar Res. 2016, 35, 30532. [Google Scholar] [CrossRef]
- Bravo, D. Análisis de Patrones de Biodiversidad, Distribución Espacial y Abundancia del Ensamble de Esponjas en Isla Doumer (Archipiélago de Palmer: Península Antártica) Licenciado en Biología Marina. Ph.D. Thesis, Universidad de Valparaíso, Valparaíso, Chile, 2017. [Google Scholar]
- Fernandez, J.C.; Bravo-Gomez, D.; Cárdenas, C.A.; Hajdu, E. Sponges from Doumer Island, Antarctic Peninsula, with description of new species of Clathria (Axosuberites) Topsent, 1893 and Hymeniacidon Bowerbank, 1858, and a re-description of H. torquata Topsent, 1916. Zootaxa 2020, 4728, 77–109. [Google Scholar] [CrossRef] [PubMed]
- Cárdenas, C.A.; Font, A.; Steinert, G.; Rondon, R.; González-Aravena, M. Temporal stability of bacterial communities in Antarctic sponges. Front. Microbiol. 2019, 10, 2699. [Google Scholar] [CrossRef]
- Happel, L.; Rondon, R.; Font, A.; González-Aravena, M.; Cárdenas, C.A. Stability of the microbiome of the sponge Mycale (Oxymycale) acerata in the Western Antarctic Peninsula. Front. Microbiol. 2022, 759, 827863. [Google Scholar] [CrossRef]
- González-Aravena, M.; Kenny, N.J.; Osorio, M.; Font, A.; Riesgo, A.; Cárdenas, C.A. Warm temperatures, cool sponges: The effect of increased temperatures on the Antarctic sponge Isodictya sp. PeerJ 2019, 7, e8088. [Google Scholar] [CrossRef]
- Rovelli, L.; Attard, K.M.; Cárdenas, C.A.; Glud, R.N. Benthic primary production and respiration of shallow rocky habitats: A case study from South Bay (Doumer Island, Western Antarctic Peninsula). Polar Biol. 2019, 42, 1459–1474. [Google Scholar] [CrossRef]
- Zamorano, J.H. Zonación y Biomasa de la Macrofauna Bentónica en Bahía South, Archipiélago de Palmer, Antártica. INACH Ser. Científica 1983, 30, 27–38. [Google Scholar]
- Zamorano, J.H.; Duarte, W.E.; Moreno, C.A. Predation upon Laternula elliptica (Bivalvia, Anatinidae): A field manipulation in South Bay, Antarctica. Polar Biol. 1986, 6, 139–143. [Google Scholar] [CrossRef]
- Villegas, N.; Málikov, I.; Cárdenas, C. An initial aproximation to the meteo-marine conditions of South Bay (Doumer island) and comparison of the meteorological behaviour between Doumer and Anvers islands, Antarctica (austral summer 2016–2017). An. Del Inst. De La Patagon. 2018, 46, 23–32. [Google Scholar] [CrossRef]
- Sentinel Hub. EO Browser. Sentinel Hub. 2020. Available online: https://apps.sentinel-hub.com/eo-browser/ (accessed on 13 March 2020).
- Kohler, K.E.; Gill, S.M. Coral Point Count with Excel extensions (CPCe): A Visual Basic program for the determination of coral and substrate coverage using random point count methodology. Comput. Geosci. 2006, 32, 1259–1269. [Google Scholar] [CrossRef]
- Di Rienzo, J.A.; Casanoves, F.; Balzarini, M.G.; Gonzalez, L.; Tablada, M.; Robledo, C.W. InfoStat, Versión 2013; Grupo InfoStat, FCA, Universidad Nacional de Córdoba: Córdoba, Argentina, 2013.
- Clarke, K.R.; Warwick, R.M. Change in marine communities. Approach Stat. Anal. Interpret. 2001, 2, 1–168. [Google Scholar]
- Cavanagh, R.D.; Melbourne-Thomas, J.; Grant, S.M.; Barnes, D.K.A.; Hughes, K.A.; Halfter, S.; Meredith, M.P.; Murphy, E.J.; Trebilco, R.; Hill, S.L. Future risk for Southern Ocean ecosystem services under climate change. Front. Mar. Sci. 2021, 7, 615214. [Google Scholar] [CrossRef]
- Sahade, R.; Tatián, M.; Kowalke, J.; Kühne, S.; Esnal, G.B. Benthic faunal associations on soft substrates at Potter Cove, King George Island, Antarctica. Polar Biol. 1998, 19, 85–91. [Google Scholar] [CrossRef]
- Lovell, L.L.; Trego, K.D. The epibenthic megafaunal and benthic infaunal invertebrates of Port Foster, Deception Island (South Shetland Islands, Antarctica). Deep Sea Res. Part II Top. Stud. Oceanogr. 2003, 50, 1799–1819. [Google Scholar] [CrossRef]
- Gutt, J. Antarctic macro-zoobenthic communities: A review and an ecological classification. Antarct. Sci. 2007, 19, 165–182. [Google Scholar] [CrossRef]
- Angulo-Preckler, C.; Figuerola, B.; Núñez-Pons, L.; Moles, J.; Martín-Martín, R.; Rull-Lluch, J.; Gómez-Garreta, A.; Avila, C. Macrobenthic patterns at the shallow marine waters in the caldera of the active volcano of Deception Island, Antarctica. Cont. Shelf Res. 2018, 157, 20–31. [Google Scholar] [CrossRef]
- Bowden, D.A. Seasonality of recruitment in Antarctic sessile marine benthos. Mar. Ecol. Prog. Ser. 2005, 297, 101–118. [Google Scholar] [CrossRef]
- White, B.A.; McClintock, J.; Amsler, C.D.; Mah, C.L.; Amsler, M.O.; White, S.; Quetin, L.B.; Ross, R.M. The abundance and distribution of echinoderms in nearshore hard-bottom habitats near Anvers Island, western Antarctic Peninsula. Antarct. Sci. 2012, 24, 554. [Google Scholar] [CrossRef]
- Amsler, C.D.; Amsler, M.O.; Klein, A.G.; Galloway, A.W.; Iken, K.; McClintock, J.B.; Heiser, S.; Lowe, A.T.; Schram, J.B.; Whippo, R. Strong correlations of sea ice cover with macroalgal cover along the Antarctic Peninsula: Ramifications for present and future benthic communities. Elementa Sci. Anthrop. 2023, 11, 00020. [Google Scholar] [CrossRef]
- Ericson, J.A.; Ho, M.A.; Miskelly, A.; King, C.K.; Virtue, P.; Tilbrook, B.; Byrne, M. Combined effects of two ocean change stressors, warming and acidification, on fertilization and early development of the Antarctic echinoid Sterechinus neumayeri. Polar Biol. 2012, 35, 1027–1034. [Google Scholar] [CrossRef]
- Suckling, C.C.; Clark, M.S.; Richard, J.; Morley, S.A.; Thorne, M.A.; Harper, E.M.; Peck, L.S. Adult acclimation to combined temperature and p H stressors significantly enhances reproductive outcomes compared to short-term exposures. J. Anim. Ecol. 2015, 84, 773–784. [Google Scholar] [CrossRef]
- Dayton, P.K.; Jarrell, S.C.; Kim, S.; Parnell, P.E.; Thrush, S.F.; Hammerstrom, K.; Leichter, J.J. Benthic responses to an Antarctic regime shift: Food particle size and recruitment biology. Ecol. Appl. 2019, 29, e01823. [Google Scholar] [CrossRef] [PubMed]
- Ahn, I.Y.; Moon, H.W.; Jeon, M.; Kang, S.H. First record of massive blooming of benthic diatoms and their association with megabenthic filter feeders on the shallow seafloor of an Antarctic Fjord: Does glacier melting fuel the bloom? Ocean Sci. J. 2016, 51, 273–279. [Google Scholar] [CrossRef]
- Pasotti, F.; Manini, E.; Giovannelli, D.; Wölfl, A.C.; Monien, D.; Verleyen, E.; Braeckman, U.; Abele, D.; Vanreusel, A. Antarctic shallow water benthos in an area of recent rapid glacier retreat. Mar. Ecol. 2015, 36, 716–733. [Google Scholar] [CrossRef]
- Campana, G.L.; Zacher, K.; Deregibus, D.; Momo, F.R.; Wiencke, C.; Quartino, M.L. Succession of Antarctic benthic algae (Potter Cove, South Shetland Islands): Structural patterns and glacial impact over a four-year period. Polar Biol. 2017, 41, 377–396. [Google Scholar] [CrossRef]
- Ha, S.Y.; Ahn, I.Y.; Moon, H.W.; Choi, B.; Shin, K.H. Tight trophic association between benthic diatom blooms and shallow-water megabenthic communities in a rapidly deglaciated Antarctic fjord. Estuar. Coast. Shelf Sci. 2019, 218, 258–267. [Google Scholar] [CrossRef]
- Zidarova, R.; Ivanov, P.; Dzhembekova, N. Diatom colonization and community development in Antarctic marine waters–a short-term experiment. Pol. Polar Res. 2020, 41, 187–212. [Google Scholar] [CrossRef]
- Bae, H.; Ahn, I.Y.; Park, J.; Song, S.J.; Noh, J.; Kim, H.; Khim, J.S. Shift in polar benthic community structure in a fast retreating glacial area of Marian Cove, West Antarctica. Sci. Rep. 2021, 11, 241. [Google Scholar] [CrossRef]
- Wright, J.T.; Benkendorff, K.; Davis, A.R. Habitat associated differences in temperate sponge assemblages: The importance of chemical defence. J. Exp. Mar. Biol. Ecol. 1997, 213, 199–213. [Google Scholar] [CrossRef]
- Ávila, E.; Blancas-Gallangos, N.I.; Riosmena-Rodríguez, R.; Paul-Chávez, L. Sponges associated with Sargassum spp. (Phaeophyceae: Fucales) from the south-western Gulf of California. J. Mar. Biolog. Assoc. UK 2010, 90, 193–202. [Google Scholar] [CrossRef]
- Cárdenas, C.A.; Davy, S.K.; Bell, J.J. Influence of canopy-forming algae on temperate sponge assemblages. J. Mar. Biolog. Assoc. UK 2016, 96, 351–362. [Google Scholar] [CrossRef]
- Dayton, P.K.; Robilliard, G.A.; Paine, R.T.; Dayton, L.B. Biological accommodation in the benthic community at McMurdo Sound, Antarctica. Ecol. Monogr. 1974, 44, 105–128. [Google Scholar] [CrossRef]
- Zenteno-Devaud, L.; Aguirre-Martinez, G.V.; Andrade, C.; Cárdenas, L.; Pardo, L.M.; González, H.E.; Garrido, I. Feeding Ecology of Odontaster validus under Different Environmental Conditions in the West Antarctic Peninsula. Biology 2022, 11, 1723. [Google Scholar] [CrossRef] [PubMed]
- Barnes, D.K.A.; Brockington, S. Zoobenthic biodiversity, biomass and abundance at Adelaide Island, Antarctica. Mar. Ecol. Prog. Ser. 2003, 249, 145–155. [Google Scholar] [CrossRef]
- Nonato, E.F.; Brito, T.A.; De Paiva, P.C.; Petti, M.A.; Corbisier, T.N. Benthic megafauna of the nearshore zone of Martel Inlet (King George Island, South Shetland Islands, Antarctica): Depth zonation and underwater observations. Polar Biol. 2000, 23, 580–588. [Google Scholar] [CrossRef]
- Jørgensen, L.L.; Gulliksen, B. Rocky bottom fauna in arctic Kongsfjord (Svalbard) studied by means of suction sampling and photography. Polar Biol. 2001, 24, 113–121. [Google Scholar] [CrossRef]
- Cárdenas, C.A.; Montiel, A. The influence of depth and substrate inclination on sessile assemblages in subantarctic rocky reefs (Magellan region). Polar Biol. 2015, 38, 1631–1644. [Google Scholar] [CrossRef]
- Leichter, J.J.; Witman, J.D. Water flow over subtidal rock walls: Relation to distributions and growth rates of sessile suspension feeders in the Gulf of Maine Water flow and growth rates. J. Exp. Mar. Biol. Ecol. 1997, 209, 293–307. [Google Scholar] [CrossRef]
- Clark, G.F.; Stark, J.S.; Palmer, A.S.; Riddle, M.J.; Johnston, E.L. The roles of sea-ice, light and sedimentation in structuring shallow Antarctic benthic communities. PLoS ONE 2017, 12, e0168391. [Google Scholar] [CrossRef]
Figure 1.
Study area: (A) Map of the location of South Bay in the Antarctic Peninsula. (B) Doumer Island with the sampled sites in South Bay: Site 1 (64°52′12.0″ S; 63°33′50.5″ W); Site 2 (64°52′32.1″ S; 63°35′04.1″ W); Site 3 (64°51′53.0″ S; 63°35′25.2″ W); Site 4 (64°51′55.9″ S; 63°33′55.7″ W).
Figure 1.
Study area: (A) Map of the location of South Bay in the Antarctic Peninsula. (B) Doumer Island with the sampled sites in South Bay: Site 1 (64°52′12.0″ S; 63°33′50.5″ W); Site 2 (64°52′32.1″ S; 63°35′04.1″ W); Site 3 (64°51′53.0″ S; 63°35′25.2″ W); Site 4 (64°51′55.9″ S; 63°33′55.7″ W).

Figure 4.
(a) Macroalgae, such as Palmaria decipiens, and mobile species, such as Nacella concinna, dominated the shallowest depths at the S4 site; (b) benthic filamentous diatoms presented the highest percentage of total coverage, especially in the shallowest depths, at the S3 site; (c) Himantothallus grandifolius was one the main contributors to the percentage of coverage at the S2 site; (d) the highest abundance and richness of fauna was found at S1, where filter-feeder animals, such as sponges and ascidians, dominated the vertical rock walls. Underwater photographs taken by Cristian Lagger.

Figure 5.
Non-metric multidimensional scaling biplot based on the Bray–Curtis similarity matrix for percentage coverage of registered taxa (square-root transformed data). Cluster analysis was obtained using the UPGMA method, classifying (A) the samples analyzed by site, showing two groups: S1–S2 and S3–S4; (B) classifying the samples analyzed by depths, showing two groups: 5–10 m and 15–20 m. 2D stress = 0.16.


Table 1.
List of taxa present at the four sites and abundance classes by depth. The faunal abundance classes are represented by: ● ≤10 ind.; ●● from 11 to 50 ind.; ●●● 51 to 100 ind.; ●●●● 101 to 200 ind.; ●●●●● 201 to 800 ind. The rest of the taxonomic entities correspond to three phyla of algae and a group of benthic diatoms (see their percentage coverage in Figure 2 and Figure 3).
| Site 1 | Site 2 | Site 3 | Site 4 | |||||||||||||||
|---|---|---|---|---|---|---|---|---|---|---|---|---|---|---|---|---|---|---|
| Phylum | Class | Taxon | 5 m | 10 m | 15 m | 20 m | 5 m | 10 m | 15 m | 20 m | 5 m | 10 m | 15 m | 20 m | 5 m | 10 m | 15 m | 20 m |
| Porifera | Demospongiae | Mycale (Oxymycale) acerata | ● | ● | ● ● | ● | ||||||||||||
| Mycale sp. | ● | ● | ● | ● | ||||||||||||||
| Sphaerotylus antarcticus | ●● | ● | ● | |||||||||||||||
| Dendrilla antarctica | ● | ● | ● | ● | ||||||||||||||
| Demospongiae sp. 1 | ● | ● | ||||||||||||||||
| Demospongiae sp. 2 | ● | |||||||||||||||||
| Haliclona sp. | ● | ● | ||||||||||||||||
| Haliclona (Soestella) sp. | ● | ● | ||||||||||||||||
| Haliclona (Rhizoniera) sp. | ● | |||||||||||||||||
| Clathria (Axosuberites) sp. | ● | |||||||||||||||||
| Tedania (Tedaniopsis) sp. | ● | |||||||||||||||||
| Hymeniacidon sp. | ● | |||||||||||||||||
| Porifera indet. 1 | ● | |||||||||||||||||
| Porifera indet. 2 | ● | |||||||||||||||||
| Porifera indet. 3 | ● | ● | ||||||||||||||||
| Cnidaria | Anthozoa | Clavularia sp. | ●● | ●●●●● | ●● | ● | ● | ● | ●● | ● | ||||||||
| Urticinopsis antarctica | ● | ● | ||||||||||||||||
| Hormosoma scotti | ● | |||||||||||||||||
| Anthozoa indet. 1 | ● | |||||||||||||||||
| Bryozoa | Bryozoan indet. 1 | ● | ||||||||||||||||
| Brachiopoda | Brachiopod indet. 1 | ● | ● | |||||||||||||||
| Nemertea | Anopla | Parbolasia corrugatus | ● | ● | ● | ● | ● | ● | ● | ● | ||||||||
| Mollusca | Gastropoda | Doris kerguelenensis | ● | ● | ||||||||||||||
| Margarella antarctica | ● | ● | ● | ● | ● | |||||||||||||
| Nacella concinna | ●● | ●● | ● | ● | ●● | ●● | ●●●● | ●● | ● | ● | ||||||||
| Gastropod indet. 1 | ● | |||||||||||||||||
| Echinodermata | Crinoidea | Promachocrinus kerguelensis | ● | |||||||||||||||
| Asteroidea | Odontaster validus | ● | ● | ● | ●● | ●● | ●● | ● | ● | ●● | ●●● | ●● | ● | ●● | ● | ● | ||
| Odontaster meridionalis | ● | ● | ● | ● | ||||||||||||||
| Granaster nutrix | ●● | ● | ● | ●● | ●● | ● | ●● | ● | ● | ● | ● | ● | ● | |||||
| Labidiaster annulatus | ● | ● | ● | ● | ||||||||||||||
| Perknaster sp. | ● | ● | ||||||||||||||||
| Asteroidea indet. 1 | ● | ● | ● | ● | ● | ● | ||||||||||||
| Asteroidea indet. 2 | ● | ● | ● | ● | ● | ● | ● | ● | ||||||||||
| Holoturoidea | Heterocucumis steineni | ● | ●● | ● | ●● | ●● | ● | ● | ●● | |||||||||
| Chordata | Ascidiacea | Cnemidocarpa verrucosa | ● | ● | ● | |||||||||||||
| Corella antarctica | ● | ● | ||||||||||||||||
| Pyura setosa | ● | ● | ● | |||||||||||||||
| Protoctista | Benthic filamentous diatoms | |||||||||||||||||
| Chlorophyta | Ulvophyceae | Green algae indet. 1 | ||||||||||||||||
| Green algae indet. 2 | ||||||||||||||||||
| Green algae indet. 3 | ||||||||||||||||||
| Monostroma hariotii | ||||||||||||||||||
| Rhodophyta | Florideophyceae | Paraglossum sp. | ||||||||||||||||
| Sarcopeltis antarcticus | ||||||||||||||||||
| Palmaria decipiens | ||||||||||||||||||
| Plocamium cartilagineum | ||||||||||||||||||
| Trematocarpus antarcticus | ||||||||||||||||||
| Pink encrusting algae | ||||||||||||||||||
| Red encrusting algae | ||||||||||||||||||
| White encrusting algae | ||||||||||||||||||
| Yellow encrusting algae | ||||||||||||||||||
| Encrusting algae indet. | ||||||||||||||||||
| Pink coralline algae indet. | ||||||||||||||||||
| Red algae indet. 1 | ||||||||||||||||||
| Red algae indet. 2 | ||||||||||||||||||
| Red algae indet. 3Morphospecie indet. | ||||||||||||||||||
| Ochrophyta | Phaeophyceae | Desmarestia sp. | ||||||||||||||||
| Himantothallus grandifolius | ||||||||||||||||||
Table 2.
Richness (S’) and Shannon index (H’) for each site and depth. Means that do not share a letter differ significantly (p ≤ 0.0001).
Table 2.
Richness (S’) and Shannon index (H’) for each site and depth. Means that do not share a letter differ significantly (p ≤ 0.0001).
| Diversity | Sites | Depth | |||||||
| S1 | S2 | S3 | S4 | 5 m | 10 m | 15 m | 20 m | ||
| S’ | 52 | 34 | 27 | 31 | 21 | 28 | 54 | 53 | |
| H’ | 1.35 b | 1.23 b | 0.58 a | 0.47 a | 0.81 bc | 0.70 c | 0.89 b | 1.24 a | |
Table 3.
Site (ANOSIM Global R = 0.25) and depth (ANOSIM Global R = 0.16) pairwise comparison of R value. The statistical significance level of the samples: 0.1%; 9999 permutations. * = p < 0.05.
Table 3.
Site (ANOSIM Global R = 0.25) and depth (ANOSIM Global R = 0.16) pairwise comparison of R value. The statistical significance level of the samples: 0.1%; 9999 permutations. * = p < 0.05.
| Sites | Depth | |||||||
| S3 | S1 | S2 | 5 m | 10 m | 15 m | |||
| S1 | 0.35 * | 10 m | 0.15 * | |||||
| S2 | 0.39 * | 0.06 * | 15 m | 0.25 * | 0.04 * | |||
| S4 | 0.06 * | 0.32 * | 0.33 * | 20 m | 0.28 * | 0.14 * | 0.08 * | |
Disclaimer/Publisher’s Note: The statements, opinions and data contained in all publications are solely those of the individual author(s) and contributor(s) and not of MDPI and/or the editor(s). MDPI and/or the editor(s) disclaim responsibility for any injury to people or property resulting from any ideas, methods, instructions or products referred to in the content. |
© 2024 by the authors. Licensee MDPI, Basel, Switzerland. This article is an open access article distributed under the terms and conditions of the Creative Commons Attribution (CC BY) license (https://creativecommons.org/licenses/by/4.0/).
Share and Cite
MDPI and ACS Style
Morales, S.; Cárdenas, C.A.; Bravo-Gómez, D.; Lagger, C. Shallow Hard-Bottom Benthic Assemblages of South Bay (Antarctic Peninsula): An Update 40 Years Later. Diversity 2024, 16, 162. https://doi.org/10.3390/d16030162
AMA Style
Morales S, Cárdenas CA, Bravo-Gómez D, Lagger C. Shallow Hard-Bottom Benthic Assemblages of South Bay (Antarctic Peninsula): An Update 40 Years Later. Diversity. 2024; 16(3):162. https://doi.org/10.3390/d16030162
Chicago/Turabian StyleMorales, Sol, César A. Cárdenas, Diego Bravo-Gómez, and Cristian Lagger. 2024. "Shallow Hard-Bottom Benthic Assemblages of South Bay (Antarctic Peninsula): An Update 40 Years Later" Diversity 16, no. 3: 162. https://doi.org/10.3390/d16030162
Note that from the first issue of 2016, this journal uses article numbers instead of page numbers. See further details here.