Article

cTBP: A Successful Intron Length Polymorphism (ILP)-Based Genotyping Method Targeted to Well Defined Experimental Needs

Institute of Agricultural Biology and Biotechnology (IBBA) -C.N.R Via Bassini 15, 20133 Milan, Italy
*
Author to whom correspondence should be addressed.
Diversity 2010, 2(4), 572-585; https://doi.org/10.3390/d2040572
Submission received: 20 February 2010 / Revised: 2 April 2010 / Accepted: 8 April 2010 / Published: 15 April 2010
(This article belongs to the Special Issue Biological Diversity Assessed by Molecular Methods)

Abstract

:
There seem to be a certain degree of reluctance in accepting ILP-based methods as part of the range of molecular markers that are classically used for plant genotyping. Indeed, since DNA polymorphism results from difference in length of fragments amplified from specific gene loci, not anonymous sequences, the number of markers that can be generated is sometime inadequate for classical phylogeny studies. Yet, ILP-based markers have many other useful advantages that should not go neglected. We support this statement by presenting a large variety of data we have been collecting for a long while regarding the use of cTBP, an ILP marker based on difference in length of the introns present within the members of the plant beta-tubulin gene family.

Graphical Abstract

1. Introduction

At the time of their discovery, in the late 1970s, eukaryotic nuclear introns were considered useless, genetically inert DNA sequences, a sort of genomic parasites. This concept gained them the definition of selfish or junk DNA [1,2]. As such, their evolution was considered under minimal selective constraints and assumed to be in accordance with the neutral theory of sequence evolution. Both these misconceptions, functional uselessness and evolution neutrality, have now been largely rectified and will be even more in the near future. Introns are not “innocent DNA” sequences. They actively participate to the control of gene expression, not only through the mechanism of alternative splicing, that represents a key mechanism allowing for the production of different RNA molecules from the same gene locus, but through a variety of other mechanisms that are now being progressively unraveled [3,4]. Introns can control level and site of gene expression through the mechanisms of Intron Mediated Enhancement (IME) and Intron Dependent Spatial Expression (IDSE) [5,6]. They can act as true enhancer sequences in cis of other regulatory elements, chiefly promoters, or they can support the production of miRNAs [7,8] and snoRNAs [9,10].
Active participation in such numerous and important molecular events exclude their supposed neutrality in the course of sequence evolution. This old hypothesis has in fact now been definitely abandoned in view of the data collected from plant genomics and eukaryote comparative genomics. First, it is shown that introns are not randomly scattered within the genomes. Rather, they conserve specific positions across the genome of many, even remarkably distant, eukaryotic lineages. Their distribution is conservative, restricted to specific sites [11]. The number of introns per gene increases with the developmental complexity of the eukaryotic species. Higher plant genomes typically contain 5–6 introns per gene, with an average length of about 250 bp [12,13]. With regard to evolutionary genomics, this observation supports the intron-gain model that suggests that introns accumulated stochastically within the eukaryotic lineages from an intron-poor ancestor. Integration may have occurred with the possible contribution of transposable elements [14]. However, the alternative idea that introns were originally present in the ancestors of prokaryotes and then dismissed through a series of losses has not been discharged yet [13]. Either ways, it is a fact that introns select sites for integration/removal within the eukaryotic genomes [15]. Comparative studies as well as confrontation between the evolutionary rate of introns and their adjoined exons sequences have also revealed that the former are less constrained in term of nucleotide sequences [16,17]. This is particularly true when analyzing the structure and the sequences of genomic regions that contain genes encoding for structural proteins such as those of the cytoskeleton. To this latter regard a well studied case is that of the tubulin genes [18]. Their genomic organization, together with the features that have been just mentioned about eukaryotic spliceosomal introns, has probably furnished the basis for the most successful, eclectic and versatile form of Intron Length Polymorphisms (ILPs), named TBP for Tubulin-Based Polymorphism [19]. ILP is a relatively novel technique capable of originating molecular markers on the basis of the structural features of the exon-intron gene boundaries [17]. At its best, ILP exploits the different rate of evolution of the two elements, exons and introns, that can result in strongly conserved exon nucleotide sequences adjoined to more relaxed and variable intron sequences. This is shown to occur at those genetic loci that encode for many housekeeping genes [20,21,22], for enzymes of the electron transport chain [23] and for different key structural proteins such as tubulins [24]. Tubulin is a dimeric globular protein that is readily assembled in a supermolecular, highly organized but very dynamic structure that is the microtubule. Microtubules (Mts) are involved in several fundamental cellular processes the most important of which is cell division [25]. In any eukaryotic cell, Mts organize the spindle and move the chromosome to the poles. This task has been conserved throughout evolution from the simple unicellular yeasts to the highest, most complex multicellular eukaryotes. This is reflected in the conservation of a significant aminoacid homology observed across tubulin of different species. In turn, this allows for the design of exon-primed oligonucleotides that can recognize the intron boundaries of several tubulin genes that may belong to either different varieties of the same species or to different species. A PCR reaction that is based on such primers will amplify the intervening sequence, that is the intron, producing bands that may be specific for a given variety or species since it reflects the polymorphism existing between the introns. This is successful because intron positions in beta-tubulin genes occur in clusters, which are regularly spaced throughout the sequence [26]. When the polymorphism is restricted to the length of the amplified fragment, this is called ILP or exon-primed intron-crossing PCR [27]. Typically, all plant beta-tubulin genes have two introns located at conserved position within the coding sequence. The only reported exceptions are ZmTUB1 and OsTUB2 genes that contain only the first intron [26].
What are the advantage of the ILP method compared to others more commonly used technique such as AFLPs, SSR, RFLPs or their combinations? Several, if one accepts the idea of balancing handiness, versatility, simplicity and rapidity with a decreased penetrability of the marker, a reduced accuracy in the measurements of genetic distances when the analysis is performed at the lowest taxonomical level. Typically an ILP marker has the following advantages, experimentally verified with the use of TBP and cTBP [28]. ILP is a convenient, reliable molecular marker with high plant interspecies transferability that can be used for the construction of genetic maps. ILP markers are neutral, co-dominant, stable and specific since they are tagged to selected genes. In turn, EPIC-PCR, that is the assay specifically tailored on ILP [29], is fast, reliable, reproducible and convenient, providing ready-to-use, clearly intelligible results. This paper provides evidences for all these statements.

2. Experimental Section

2.1. Plant Material

Twenty different genotypes of Rosa spp. and commercial cultivars were provided by the private collection of the Sergio Patrucco Nursery (Table 1 samples number 1 to 20). Pasture grasses were harvested by the authors in Central Italian Alps, north of the Lombardy Region. The harvesting mission was organized in two distinct sites, Culino Alps and Andossi Alps, kept separated by a mountain chain, in the natural ecological area of distribution of the plant species. From both harvesting sites, six random plants of each species, collected from an ecologically homogeneous area, were combined to form a uniformly representative sample. Wild herbaceous plants were collected among those of the IBBA-CNR intramural gardens and from different public parks of the city of Milan. All accessions were identified according to their morphological, botanical traits.
Table 1. List of the plant material: Rosa genotypes collected from a private breeder collection (number 1 to 20); wild plant species from pastureland (number 21 to 25) and public garden areas (number 26 to 45). Capital letter define cultivars whereas italics characters indicate botanical species.
Sample N°NameSample N°Name
1‘ABABA’24Festuca violacea Gaudin
2‘KEVIN’25Deschampsia cespitosa (L.) P. Beauv
3‘BAROQUE’26Bromus hordaceus L.
4‘RED DOT’27Poa annua L.
5‘641’28Trifolium hybridum L.
6‘MAGENTA’29Trifolium repens L.
7‘CLEOPATRA’30Trifolium pretense L.
8‘RESPECT’31Arrhenatherum elatius (L.) P. Beauv
9‘KISS’32Holcus lanatus L.
10‘MEDEO’33Phalaris arundinacea L.
11‘ORANGE’34Arrenatherum spp
12‘CORALLO H’35Dactilis glomerata L.
13‘DALLAS’36Poa trivialis L
14‘ROCKSTAR’37Crepis spp.
15‘SUSAN’38Rumex acetosa L.
16Rosa indica Thory. ‘Vera Indica Major®’39Lotus spp.
17Rosa hybrida L. ‘Natal Briar’40Veronica persica Poiret
18Rosa banksiae41Trifolium spp.
19Rosa indica Thory ‘Major’42Trifolium spp.
20Rosa inermis Mill.43Trifolium spp.
21Nardus stricta L.44Trifolium pratense ssp nivale (Sieber)
22Trifolium alpinum L45Plantago lanceolata L.
23Phleum pratense L.

2.2. DNA Extraction and PCR Conditions

DNA was extracted from 100 mg fresh leaf tissue using a GenElute™ Plant Genomic DNA Miniprep Kit (Sigma-Aldrich). The quality and concentration of the purified DNA was determined both by UV absorbance and by comparison with a known quantity of lambda DNA (clind 1 ts857 Sam 7) following electrophoresis through a 1% w/v agarose gel. DNA samples were stored at –20°C. Thirty ng of total DNA was used as the template for PCR amplification. TBP/cTBP analysis was performed according to Breviario et al. [29]. Hence, reaction conditions and primer combinations, TBPfex1/TBPrex1 for intron I and TBPfin2/TBPrin2 for intron II, were those previously reported. The amplified fragments were separated on a 2% agarose gel in 1 X TBE buffer (0.089 M Tris-Base, 0.089 M Boric acid and 0.002 M EDTA pH8) at 100 V for 1 h stained by ethidium bromide (1 μg mL-1) and photographed under UV light in a gel documentation system (UVP, UK). Moreover, 2 µl of each reaction was loaded on a sequencing sizes 6% w/v polyacrylamide native gel and run in 1X·TBE for four hours at a constant voltage 1,500 V. Amplicons were visualized by silver staining as described by [29]. After staining, the banding patterns were scanned; data collected from reproducible and successful amplification were stored. Marker sizes were estimated by comparison to molecular mass standards included in each gel. All amplifications were repeated twice at the least, to ensure consistency of the TBP-PCR amplified products. Control reactions with no primers or single primers were also run.

2.3. Data Analysis

The genetic distance between pairs of genotypes were determined by the Treecon program for Windows [30] from the matrix of presence/absence of amplified fragments, according to Nei and Li coefficient [31]. The similarity values were used to infer the cluster analyses phylogenetic trees, which was plotted as a dendrogram according to the unweighted pair group method with arithmetic average (UPGMA, [32]), implemented in the Treecon software. The statistical confidence of a particular group of accessions in the tree was evaluated by bootstrap test [33].

3. Results and Discussion

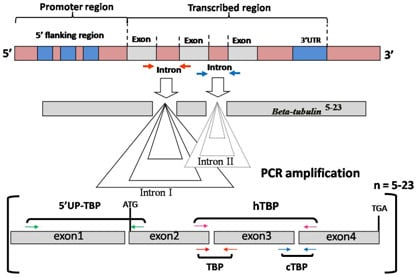
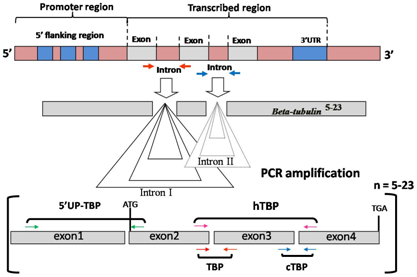
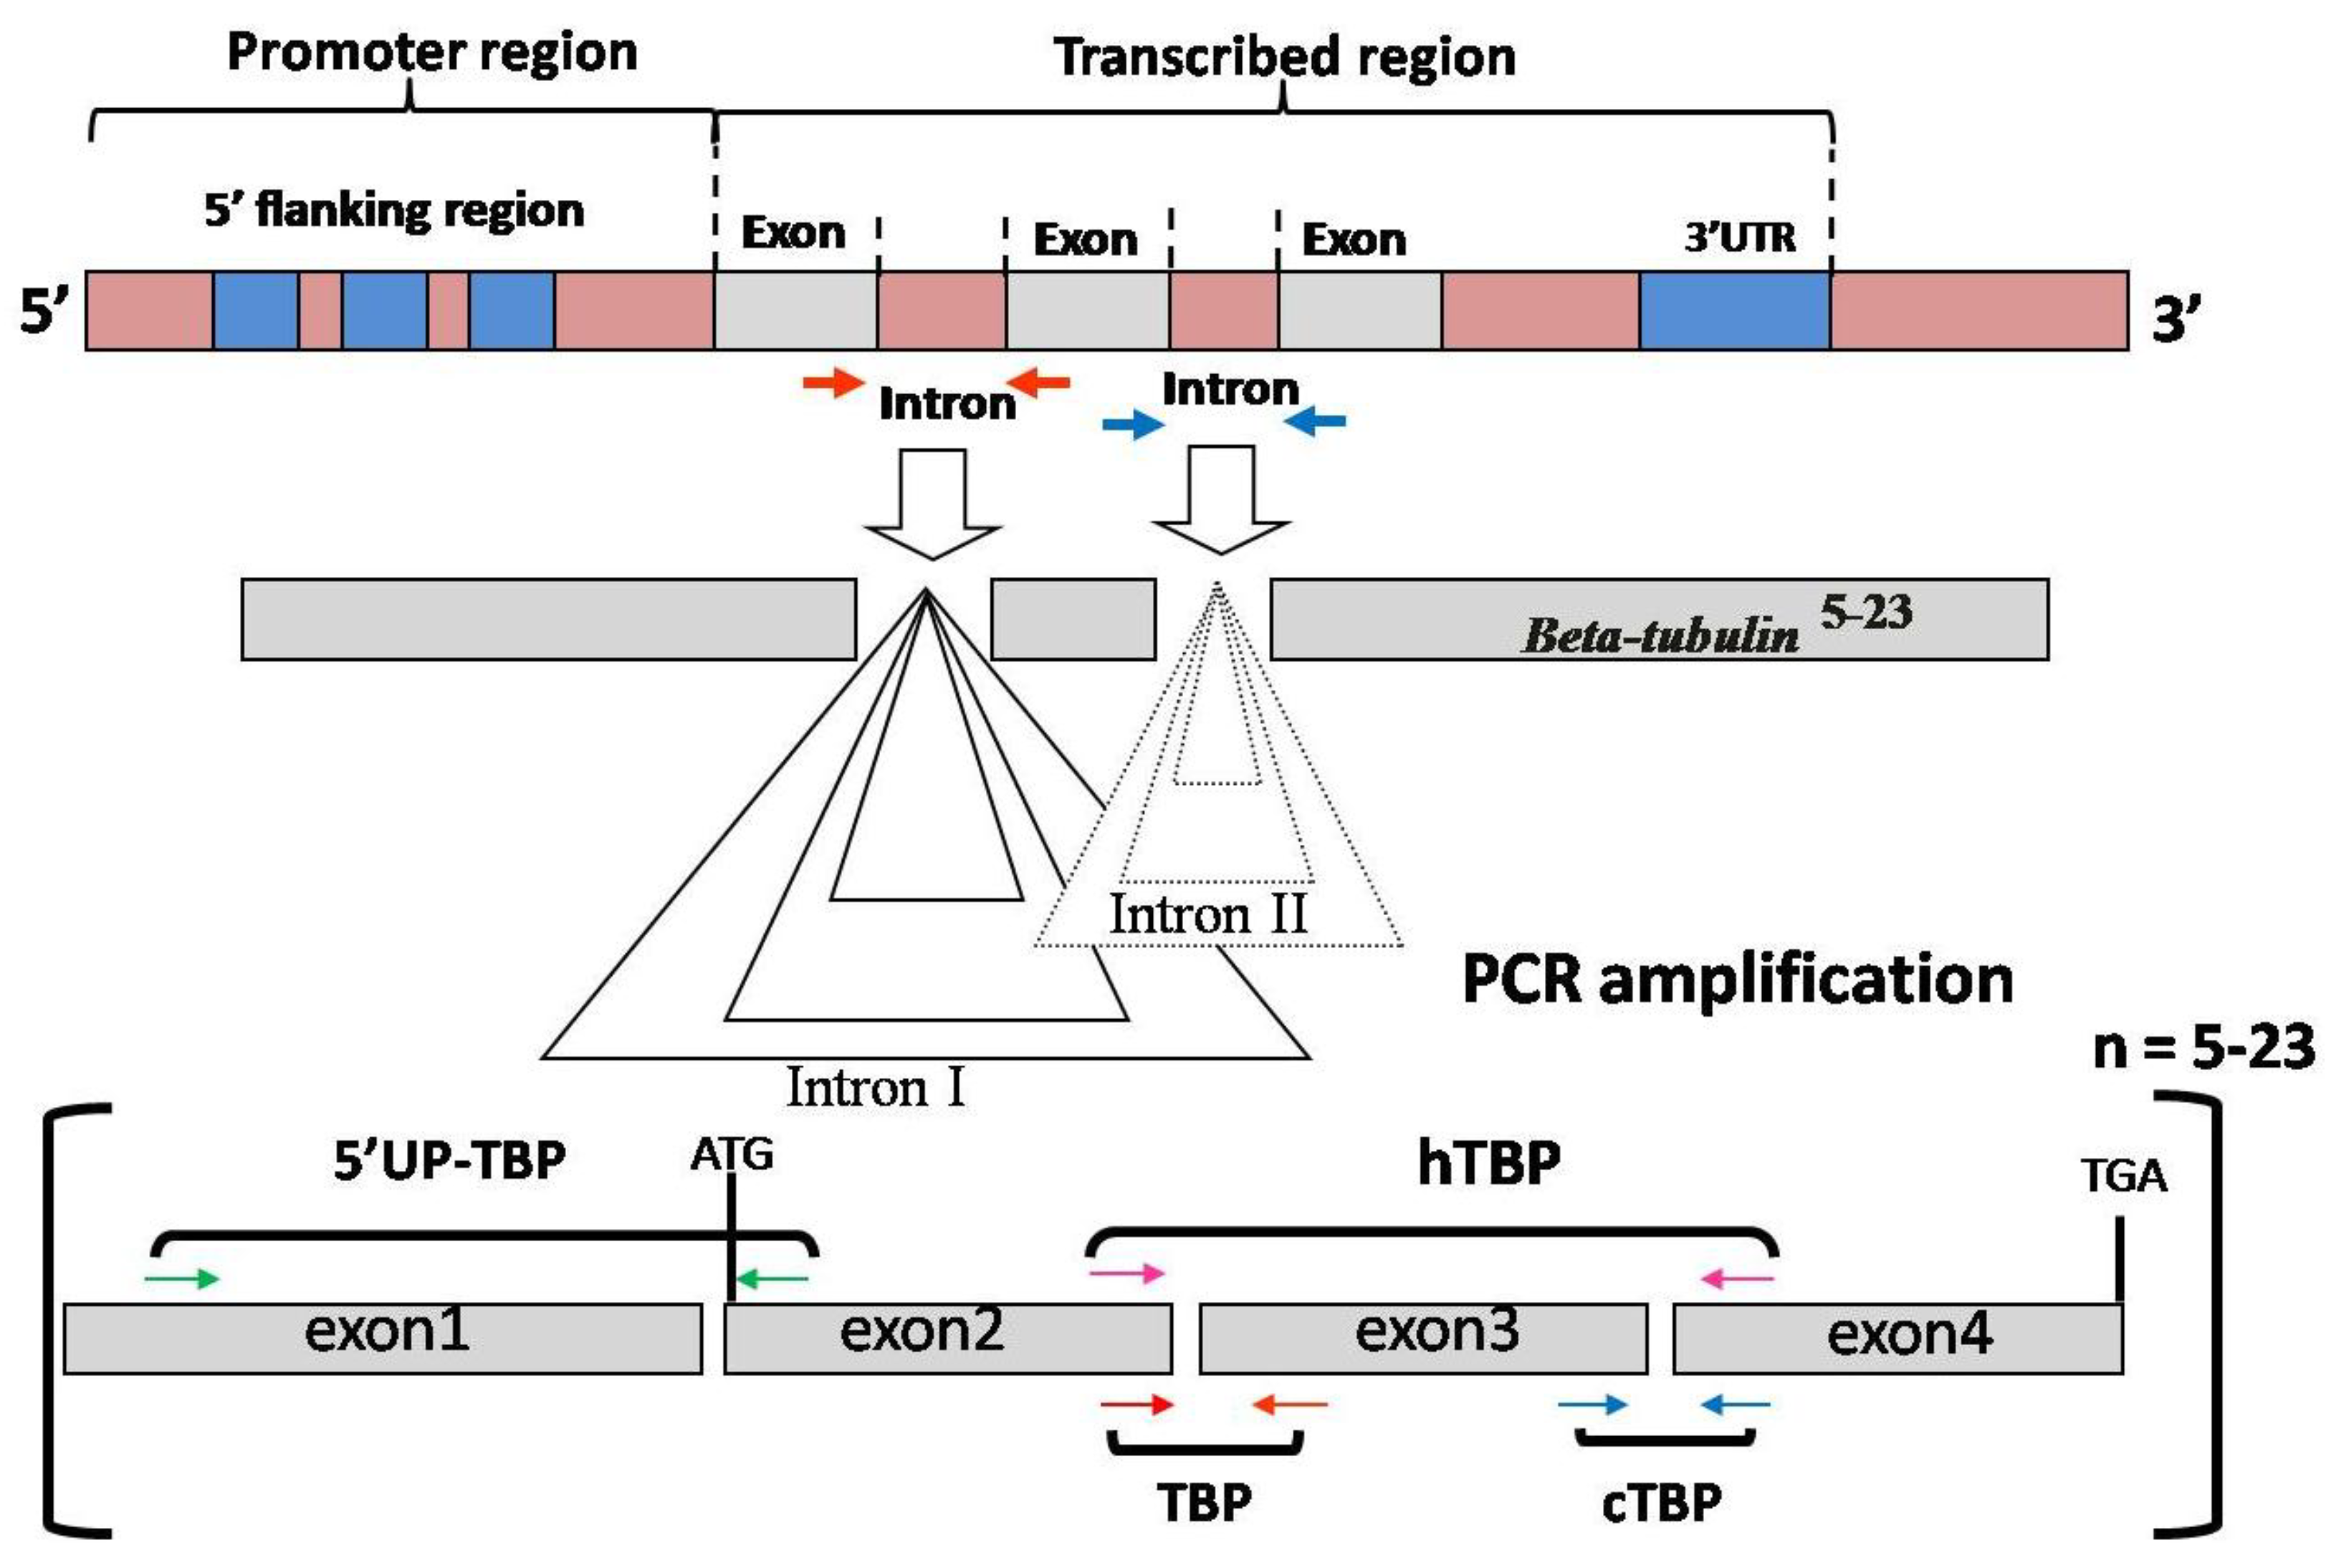
3.1. Intron Length Polymorphism Detected by the TBP/cTBP Method

The scheme in Figure 1 describes the multiple possibilities that the genomic organization and the structure of a plant beta-tubulin locus allow for the designing of an ILP-based approach. Each of the genes that in plants encode for beta-tubulin is characterized by the presence of three coding exons interrupted by two introns that are invariantly located at fixed positions [34,26]. Amplification of the two introns is obtained with the use of primer degenerated mixtures that target the exon sequences at the boundaries of the introns. The primer combinations originally devised for the selective amplification of either intron I (TBP) or intron II (cTBP) can be used together under the same experimental PCR conditions. This allows the concomitant amplification of the two introns with the generation of a larger number of markers from the same gene loci. This also allows for alternative combinations between the forward and the reverse degenerated primers. Horse TBP (hTBP) represents one of such combinations allowing for the amplification of the whole beta-tubulin genomic region that encompassed the two introns [35]. This approach may sometime provide a better resolution of DNA polymorphisms since the amplified bands are higher in sizes, up to 2 kb. The discriminatory efficacy of the TBP/cTBP method also relies on the fact that a simultaneous amplification of all the members of the beta-tubulin gene family is obtained. Members number can vary from five to 23, depending on the plant species. In addition, the degenerated primer mixtures that are commonly used account for thousands of different nucleotide combinations. This provides the base for a wide, broad-range applicability of the method. Even so, additional developments are underway based on some specificities of the 5’ region of the beta-tubulin genes that can allow for the amplification of the non coding sequence upstream of the ATG translational initiation codon, where a third intron can additionally be present in some members of the poplar, rice, and Arabidopsis β-tubulin gene family [26].
Figure 1. Schematic representation of a typical plant β-tubulin genomic locus with reference to the multiple diagnostic approaches relying on intron-length polymorphism. Colored arrows indicate different primers combination in their respective position and orientation. In the top graph, blue areas indicate regulatory elements present in the 5’upstream region and the 3’UTR. 5-23 indicate the number of the possible plant beta-tubulin genes per plant species.
Diversity 02 00572 g001

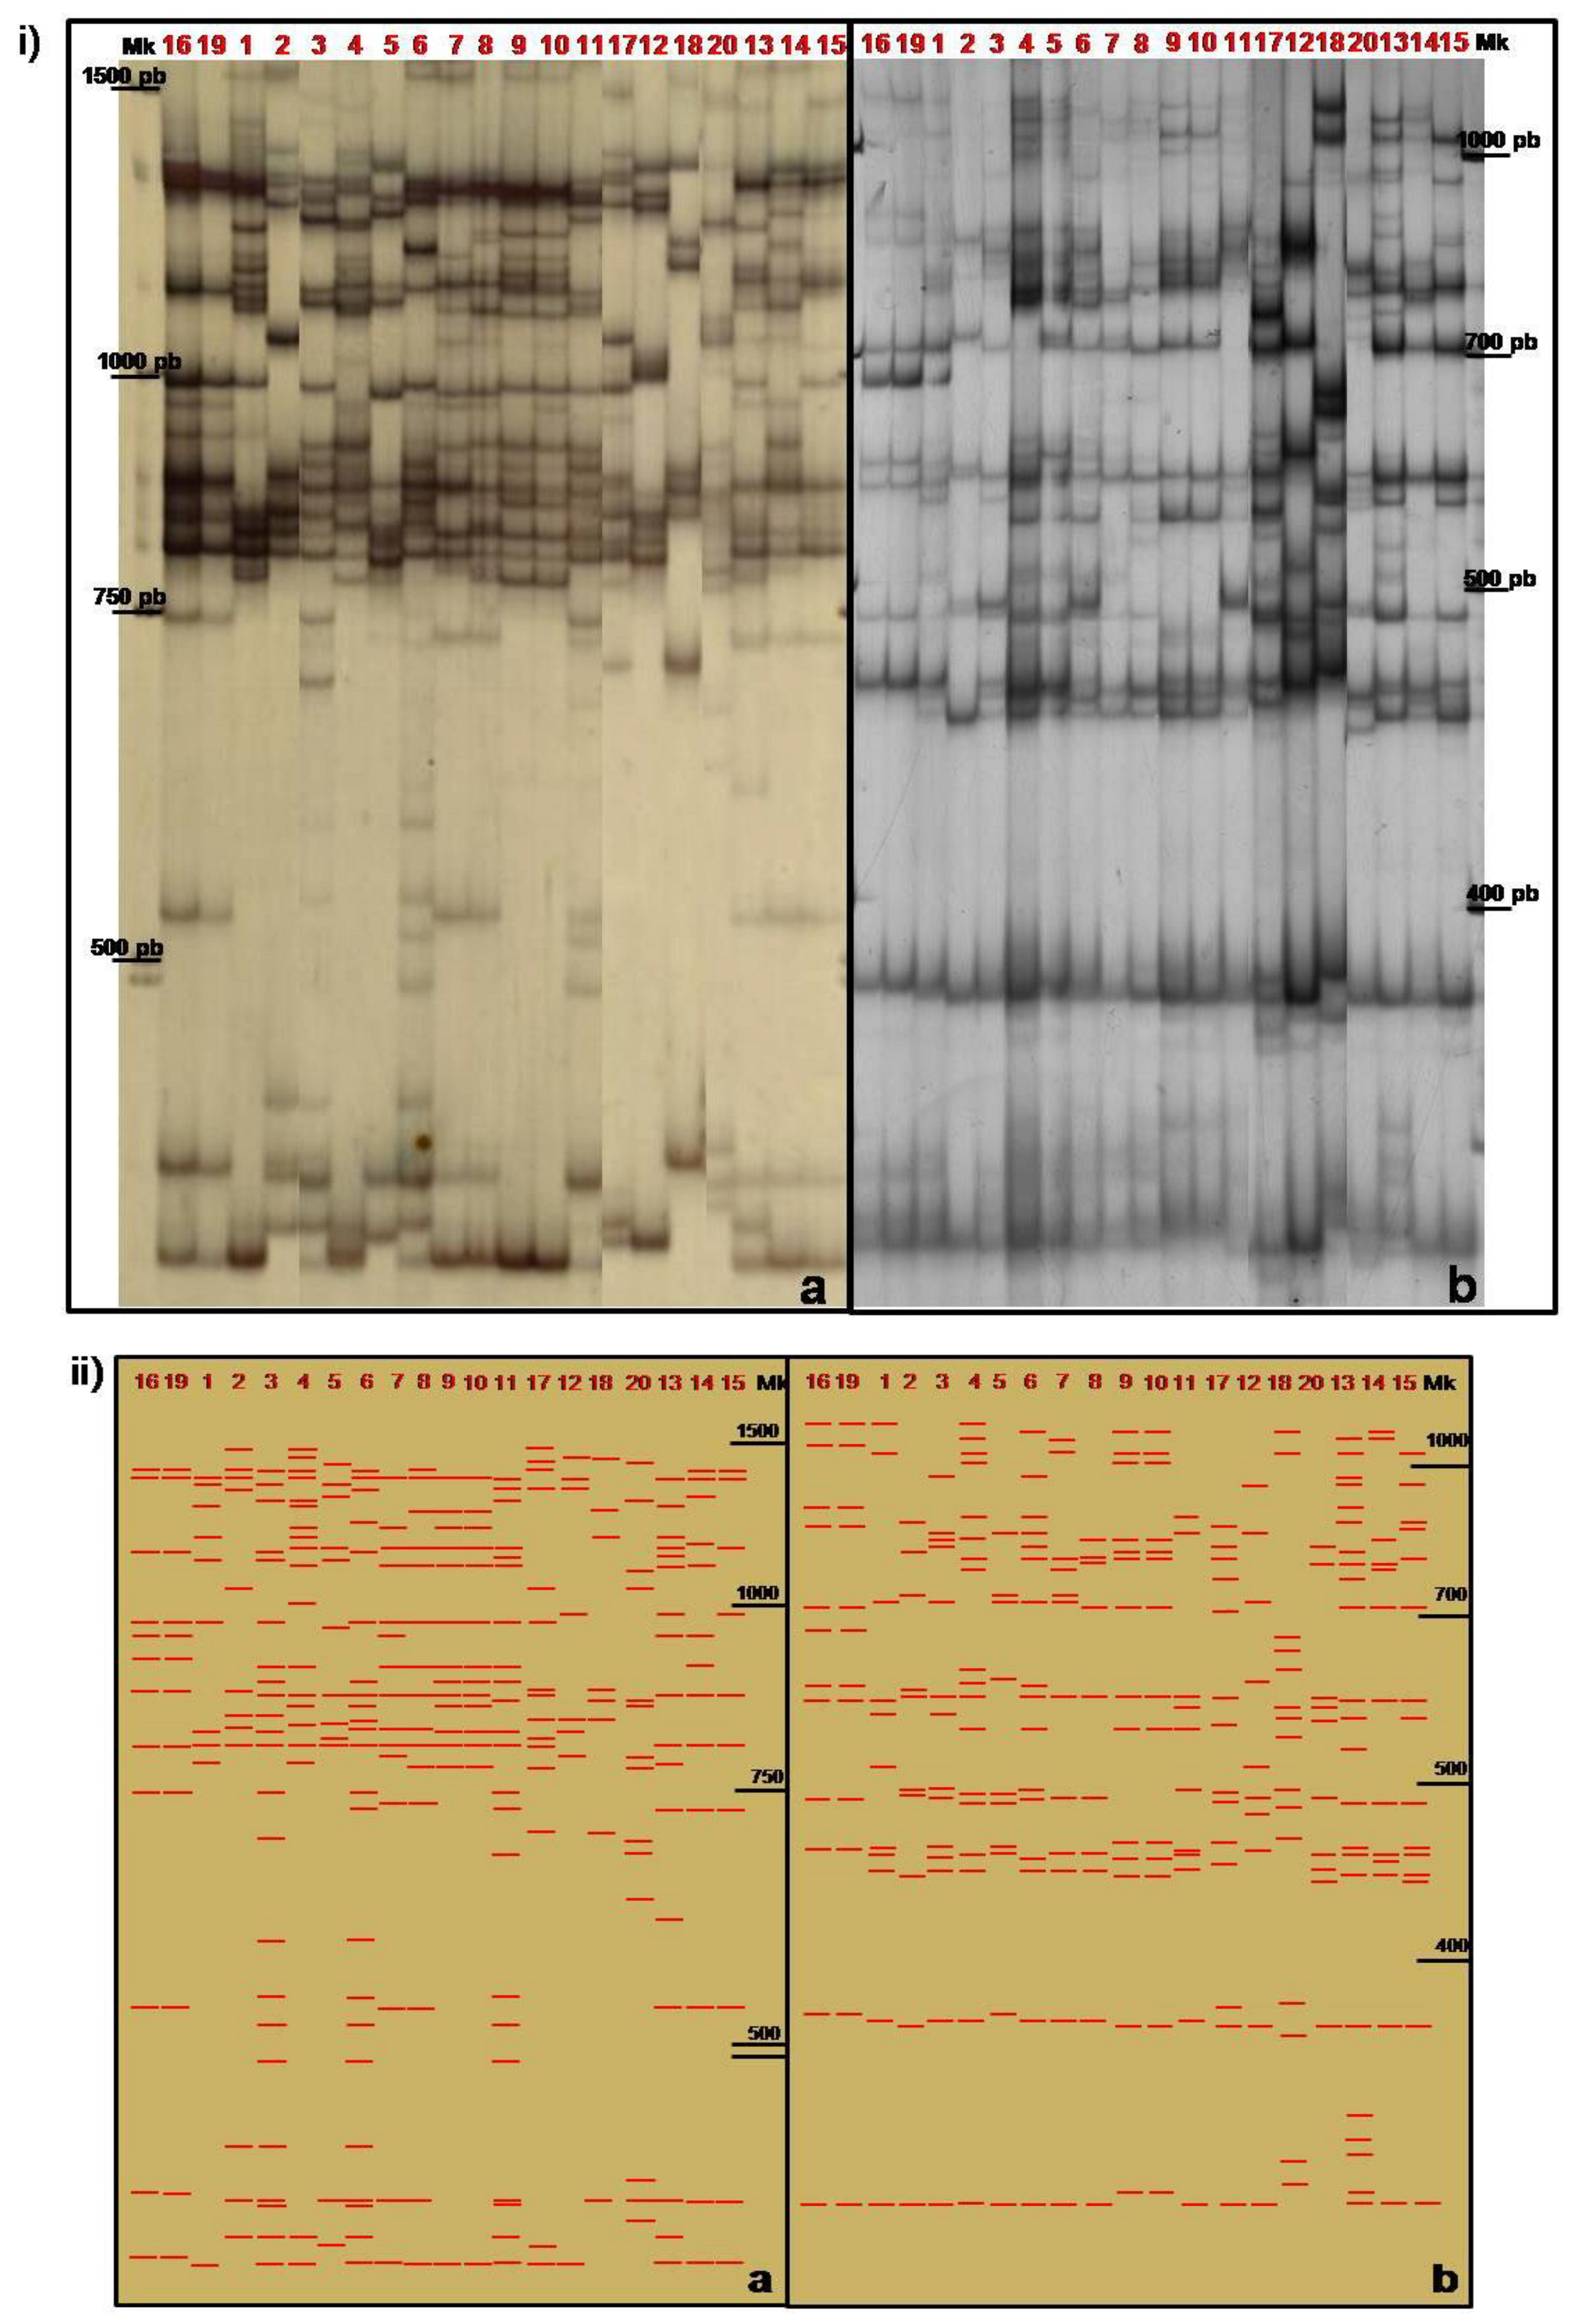
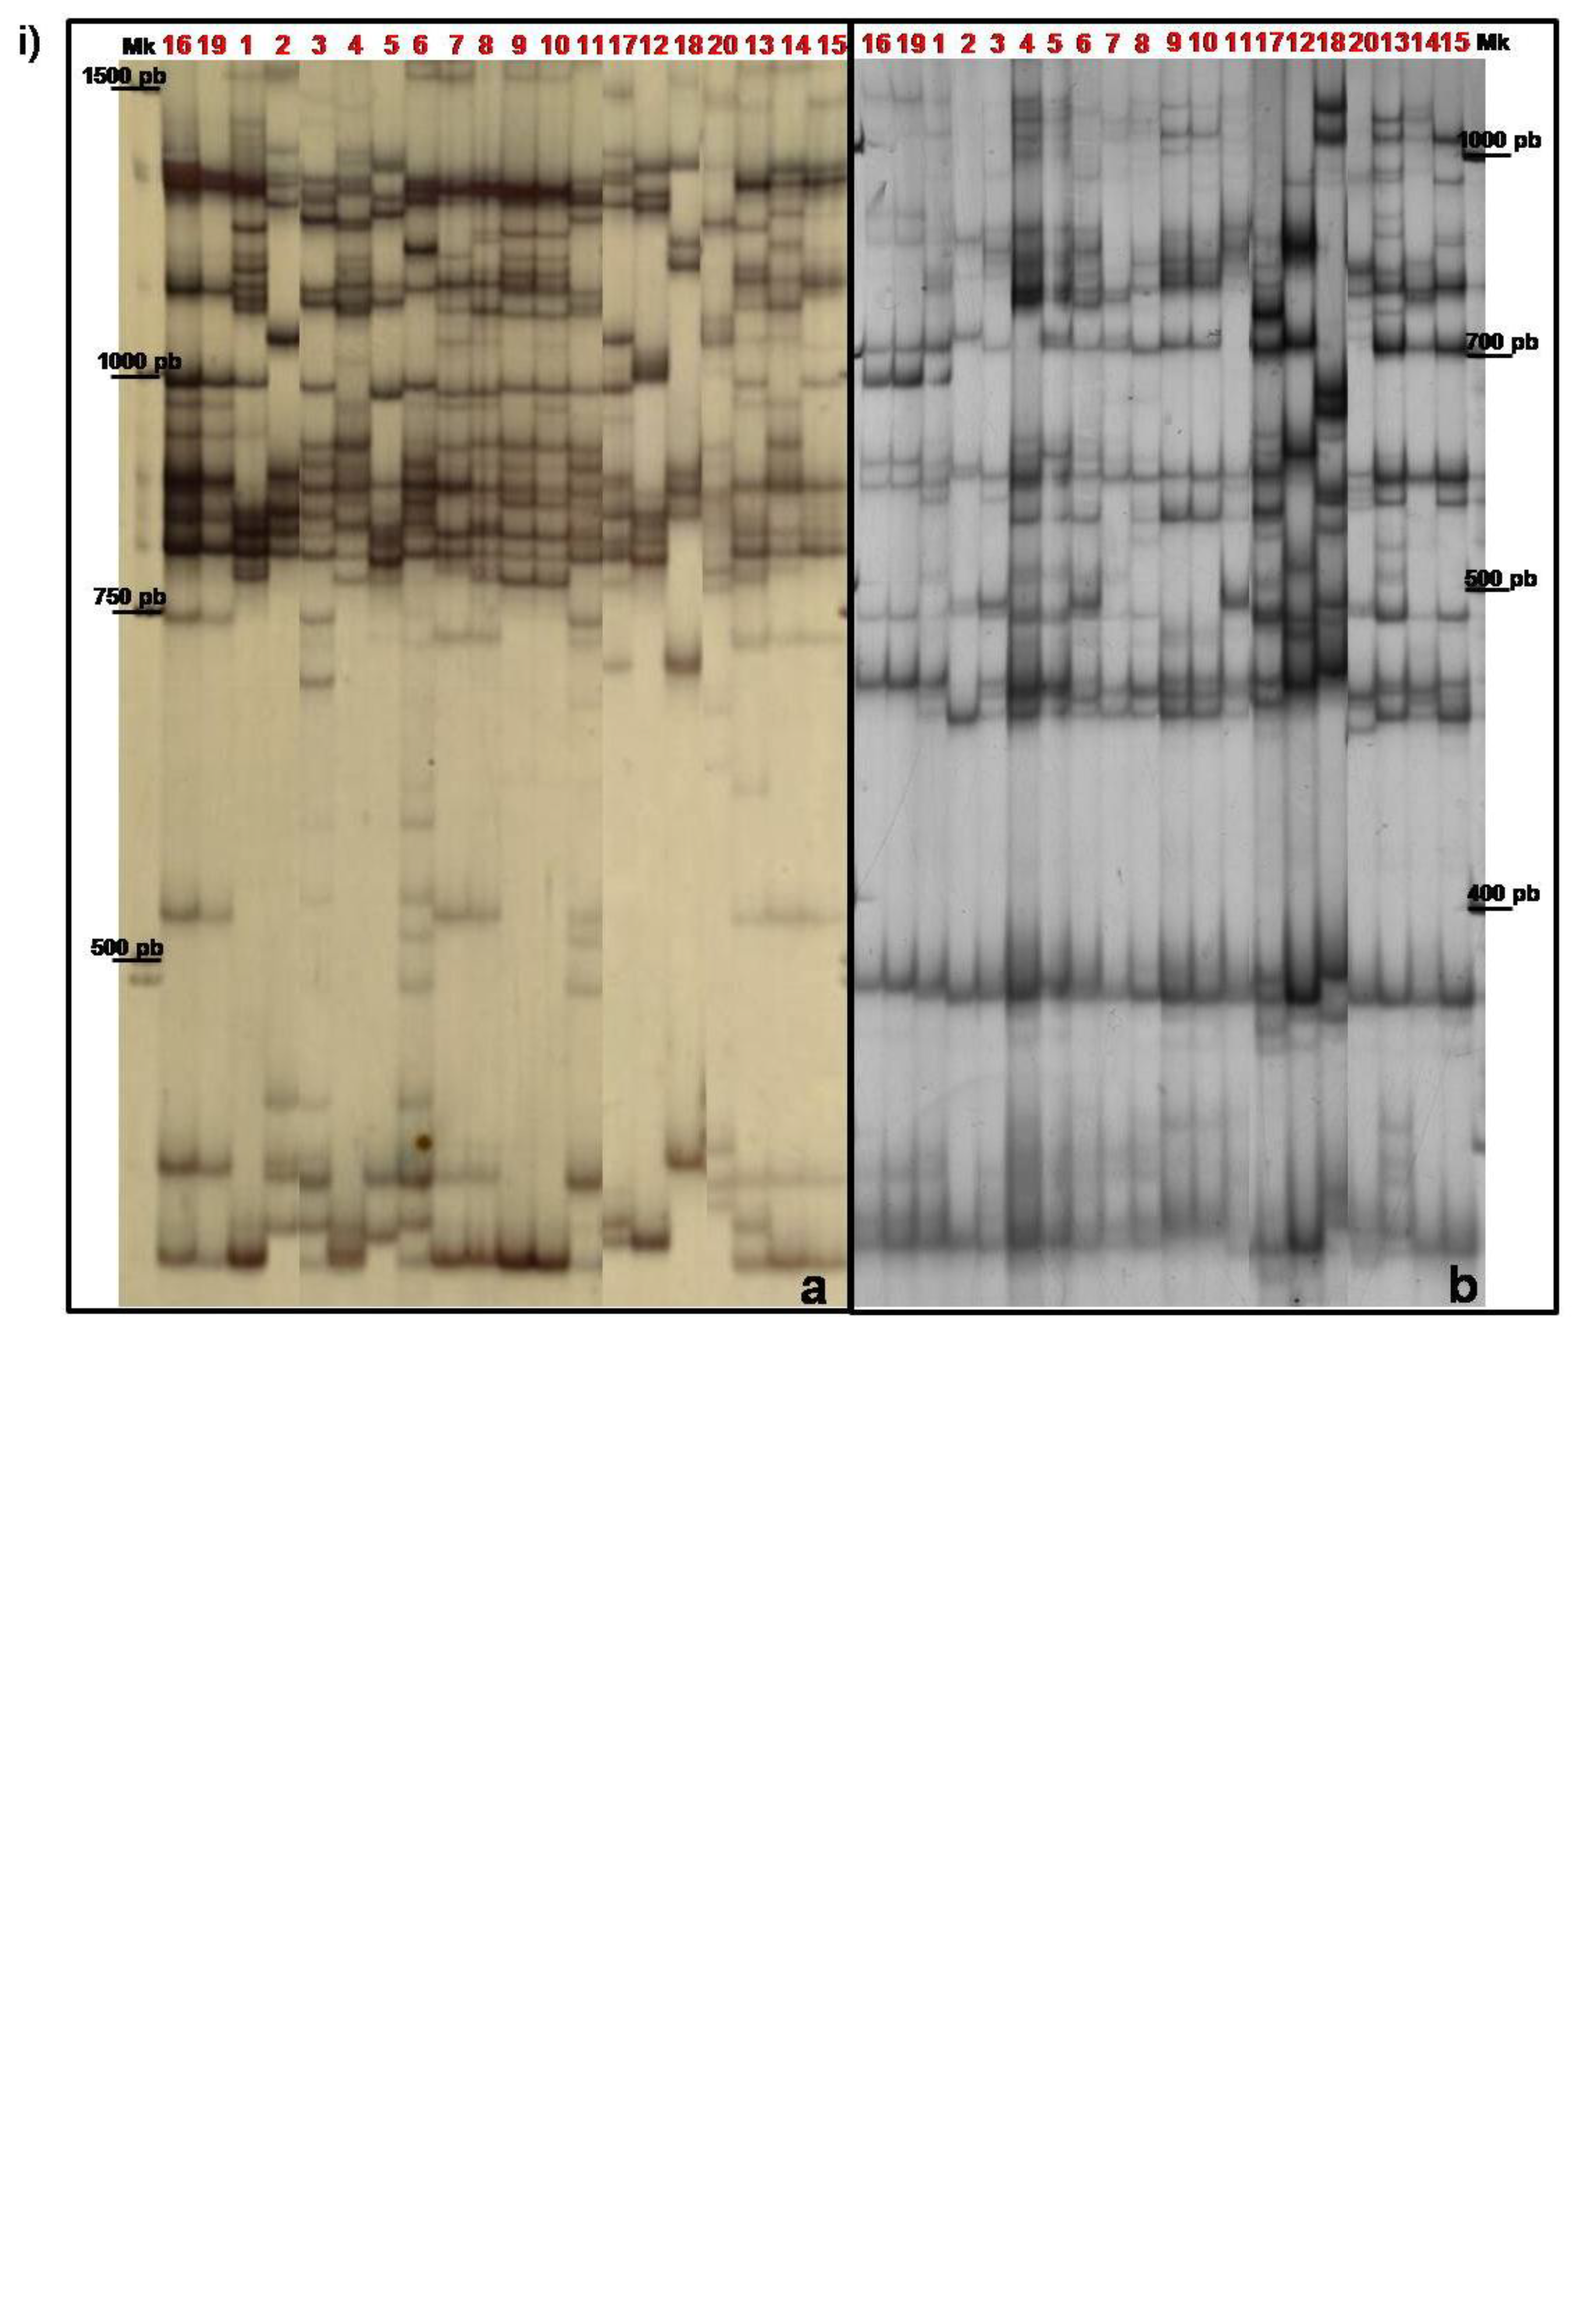
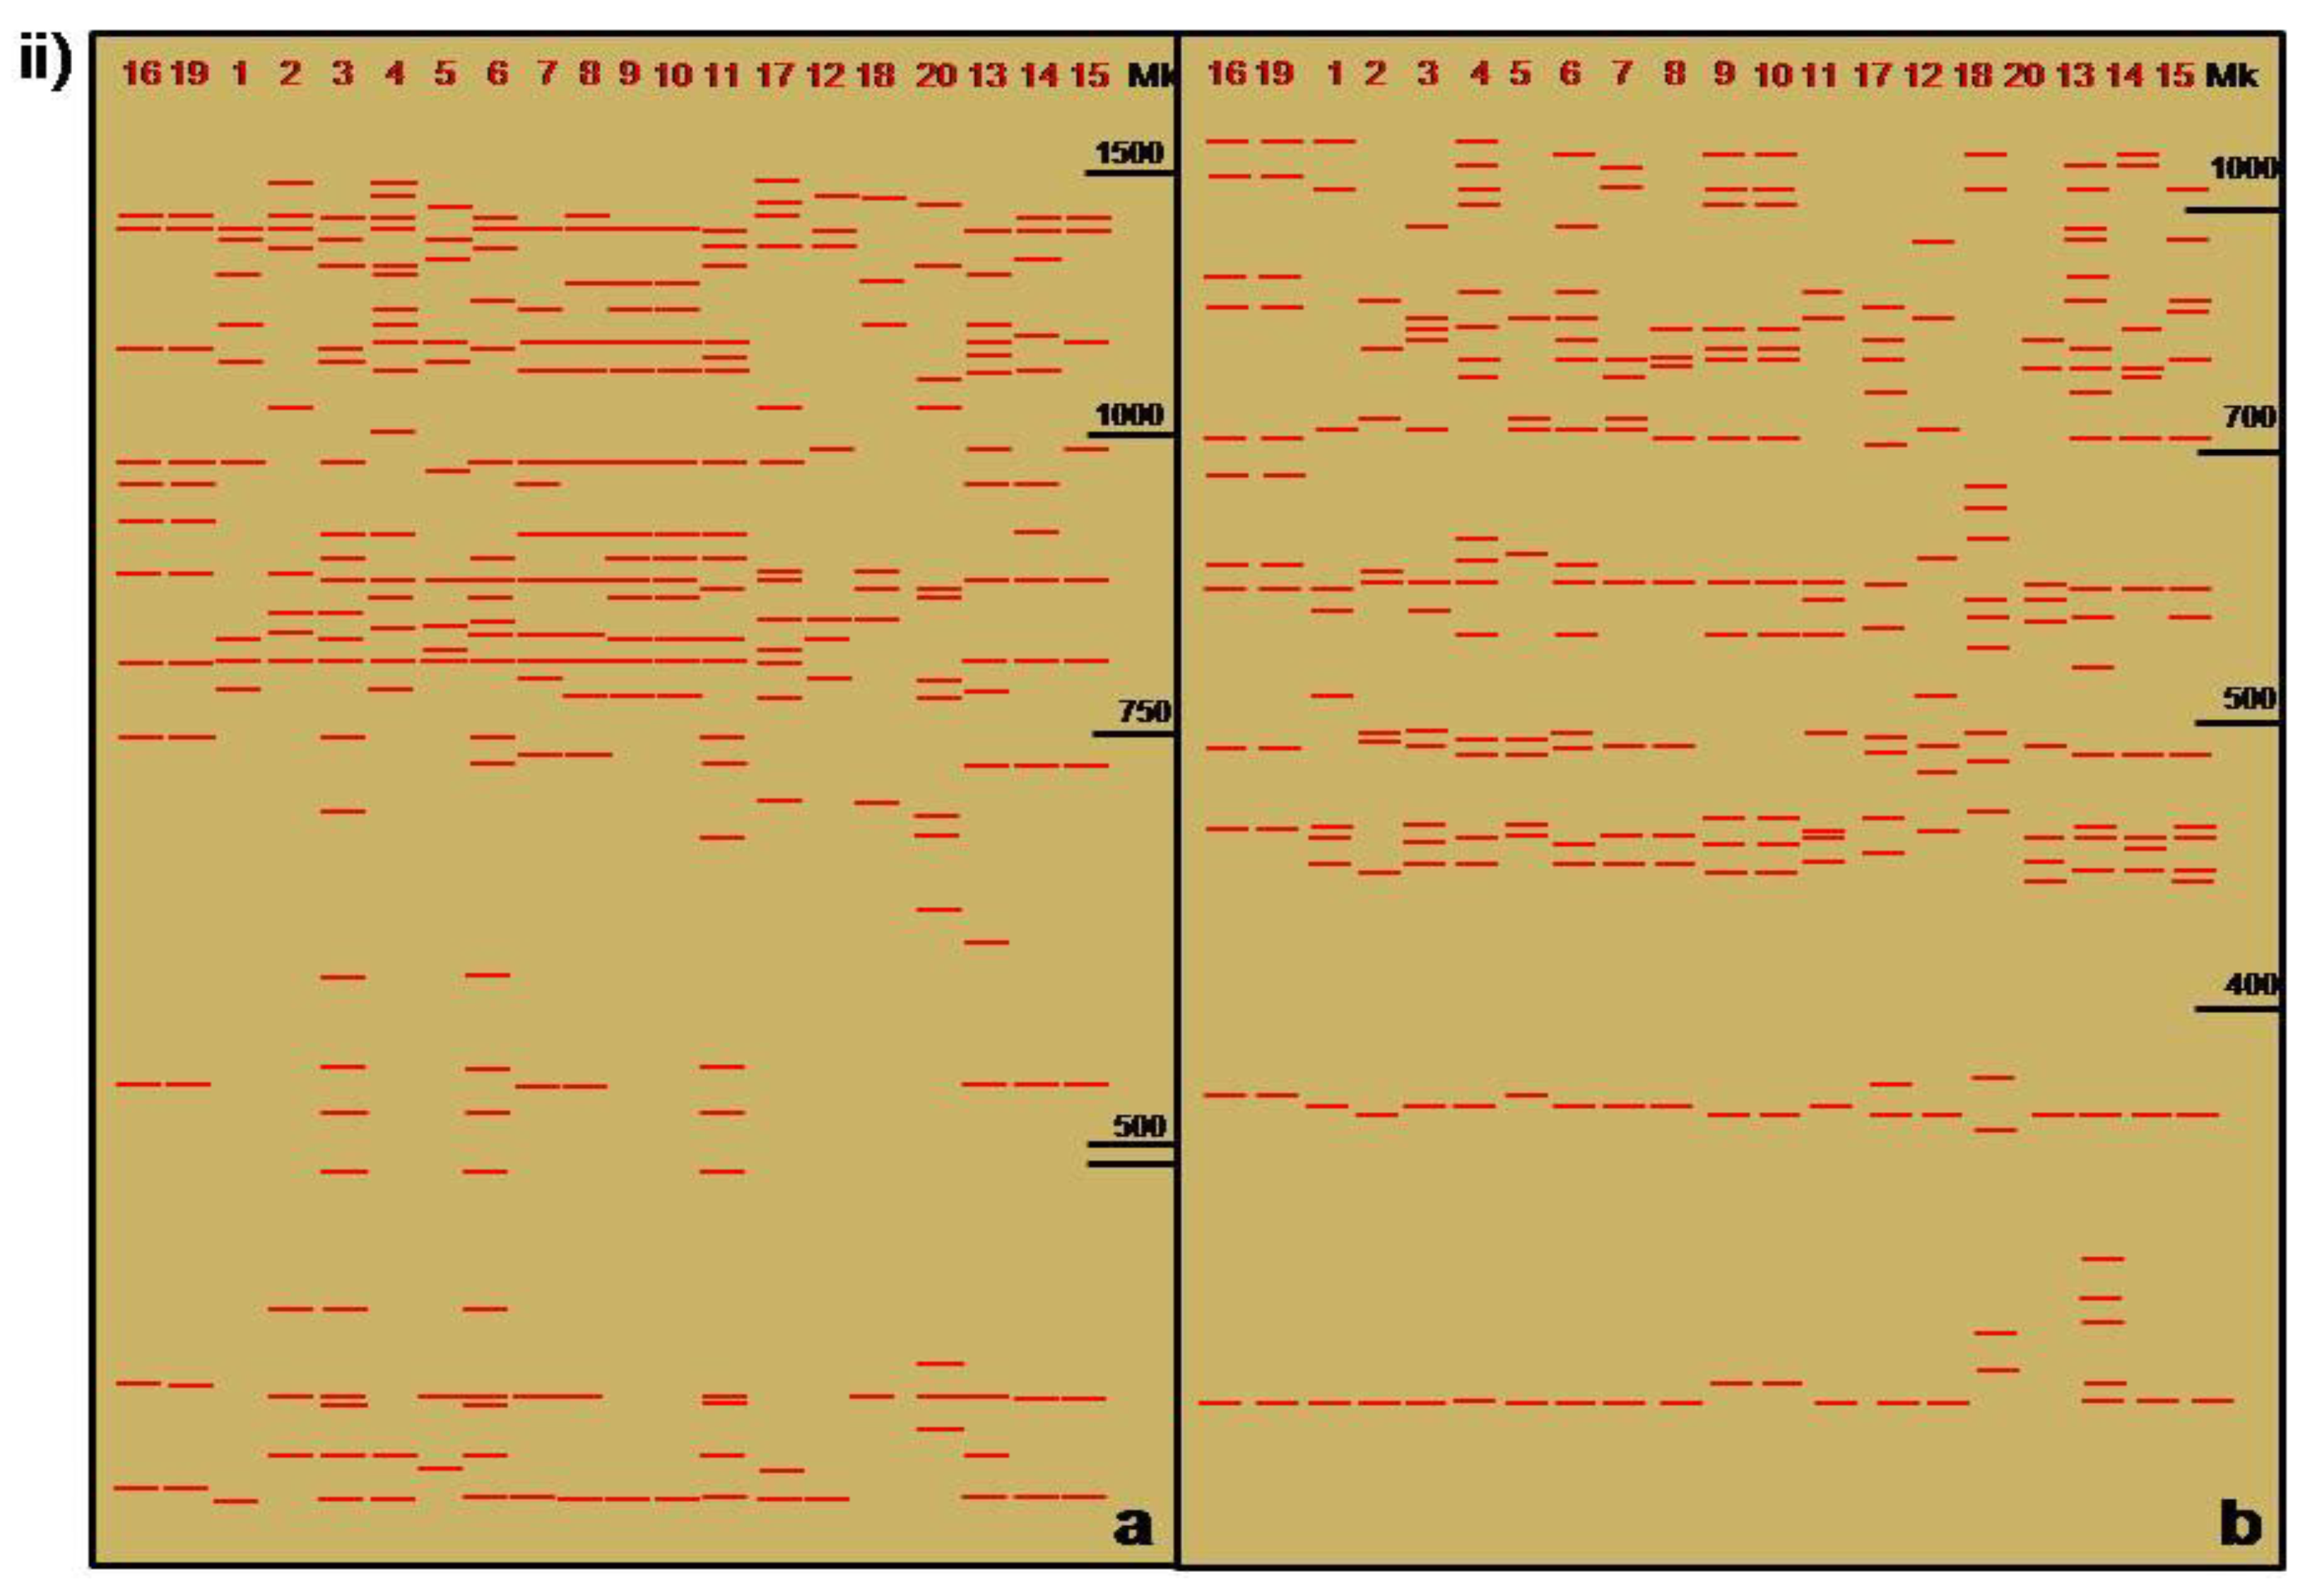
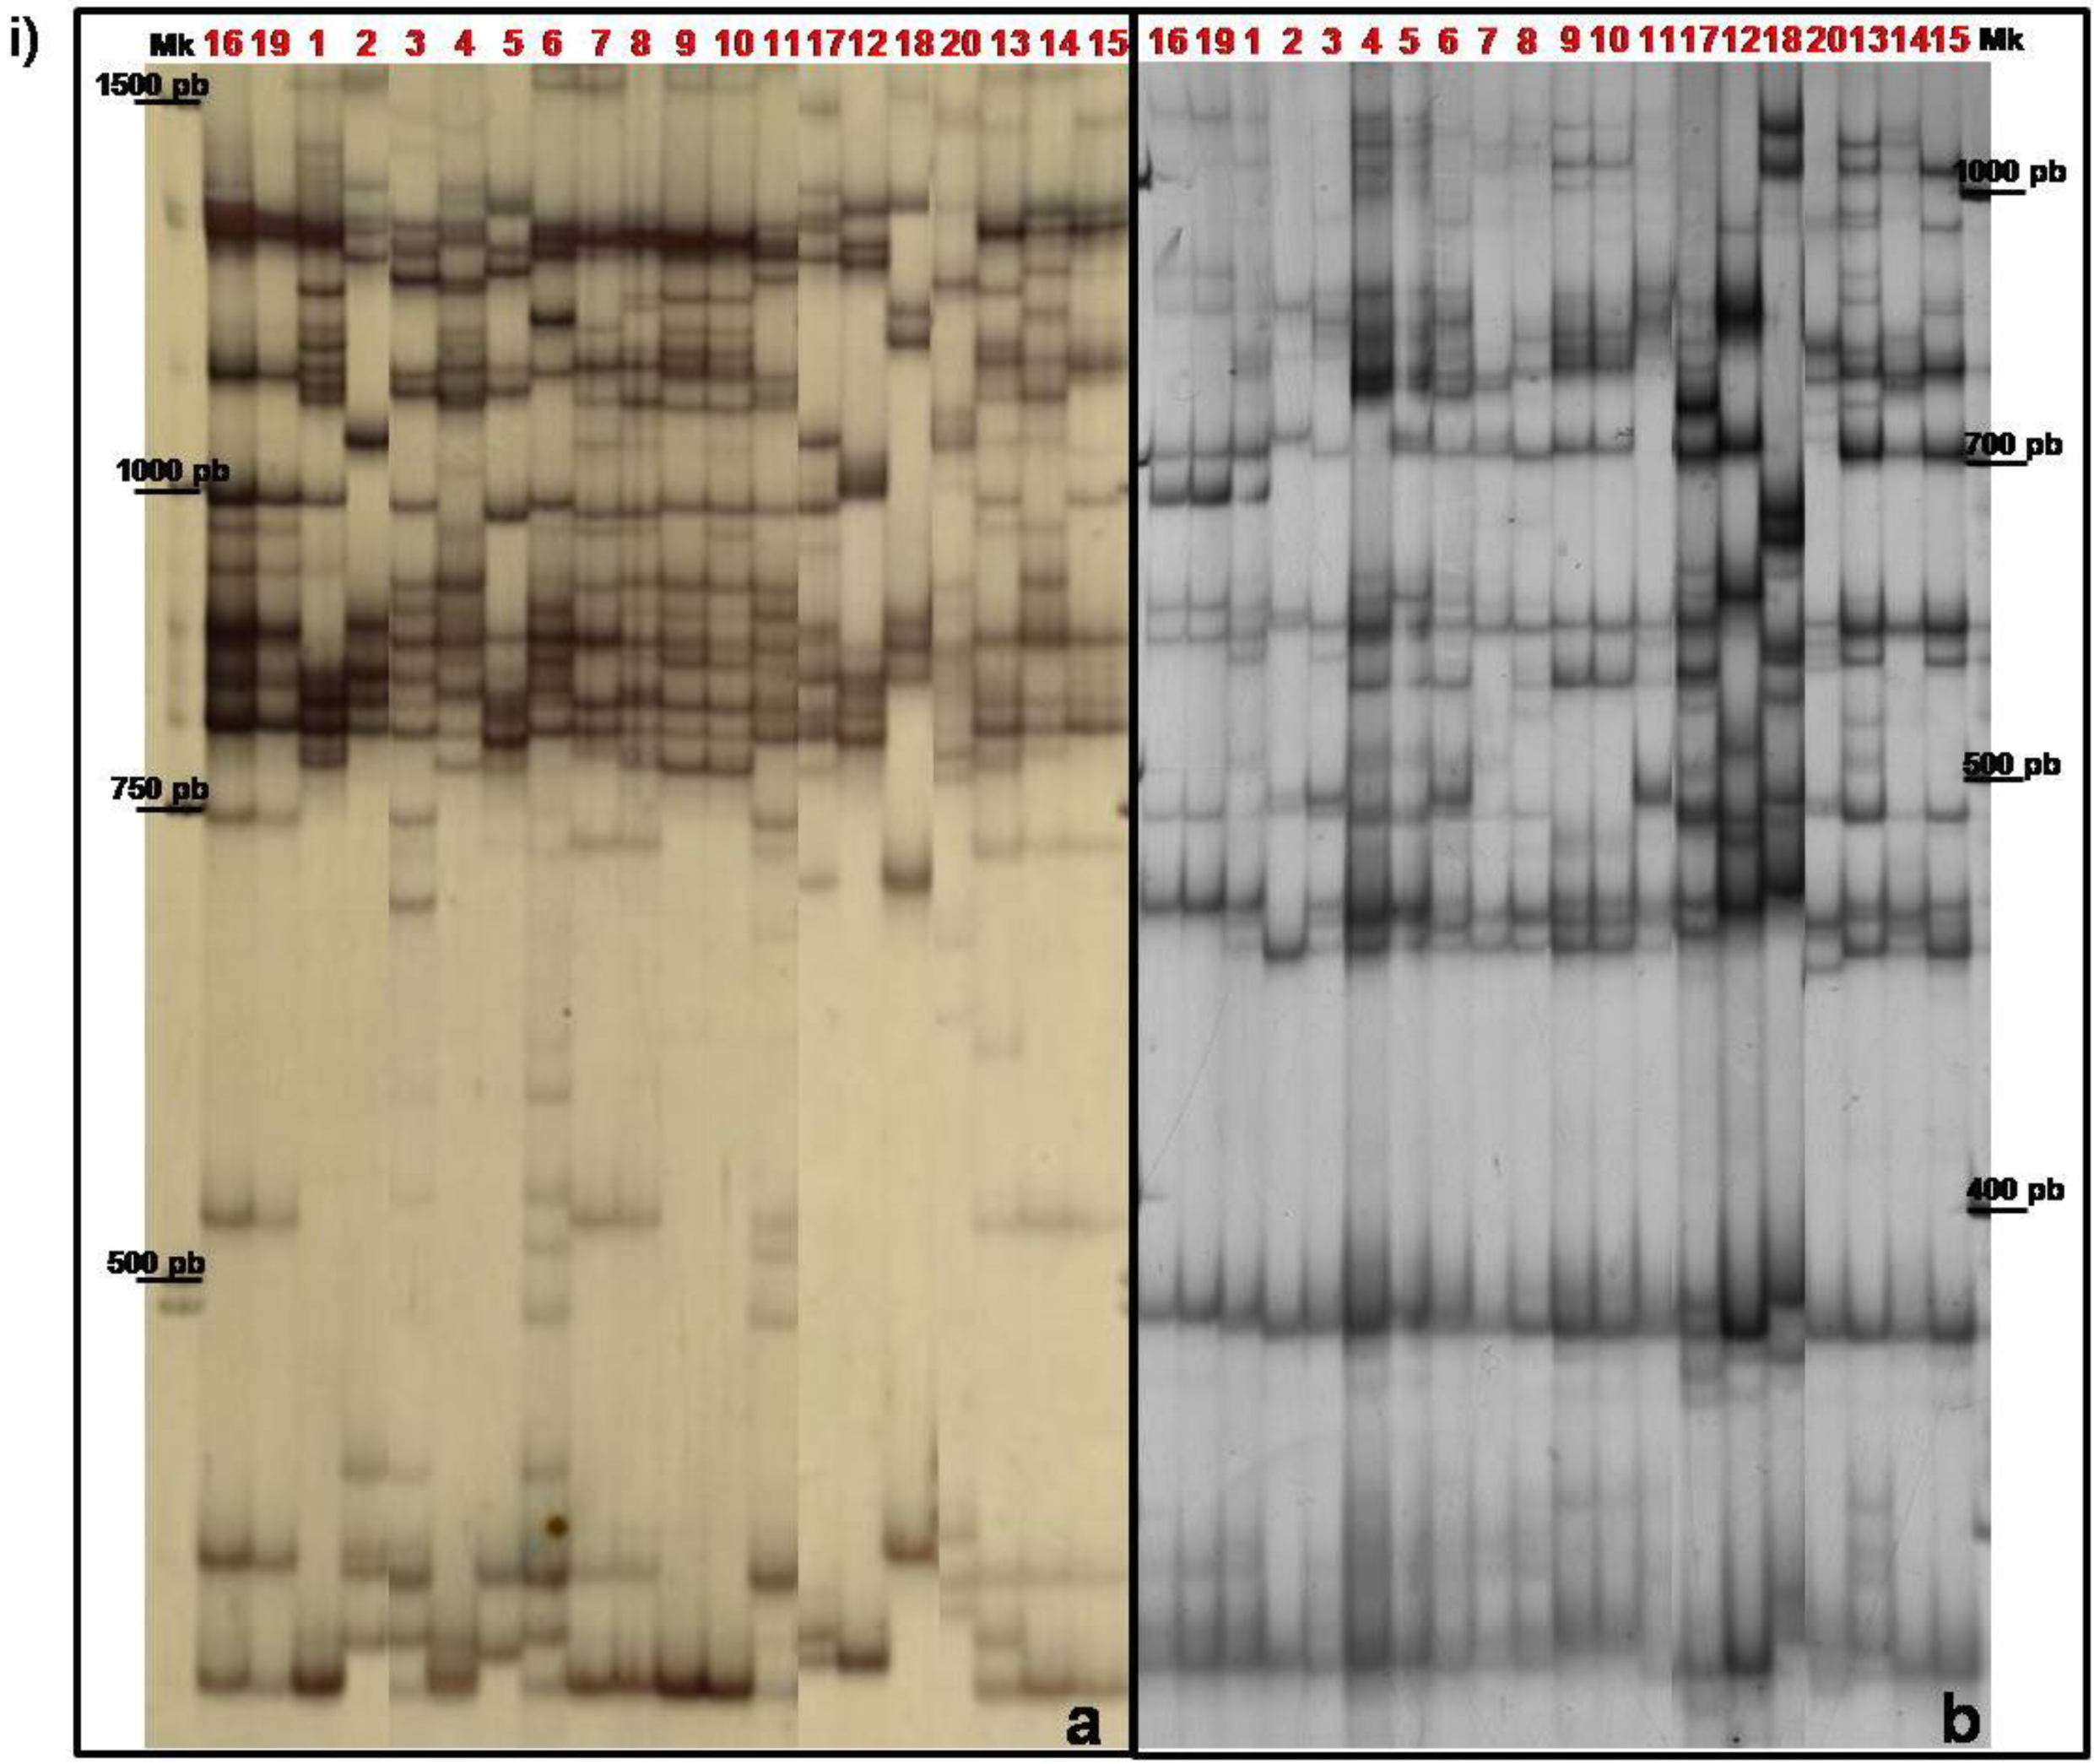
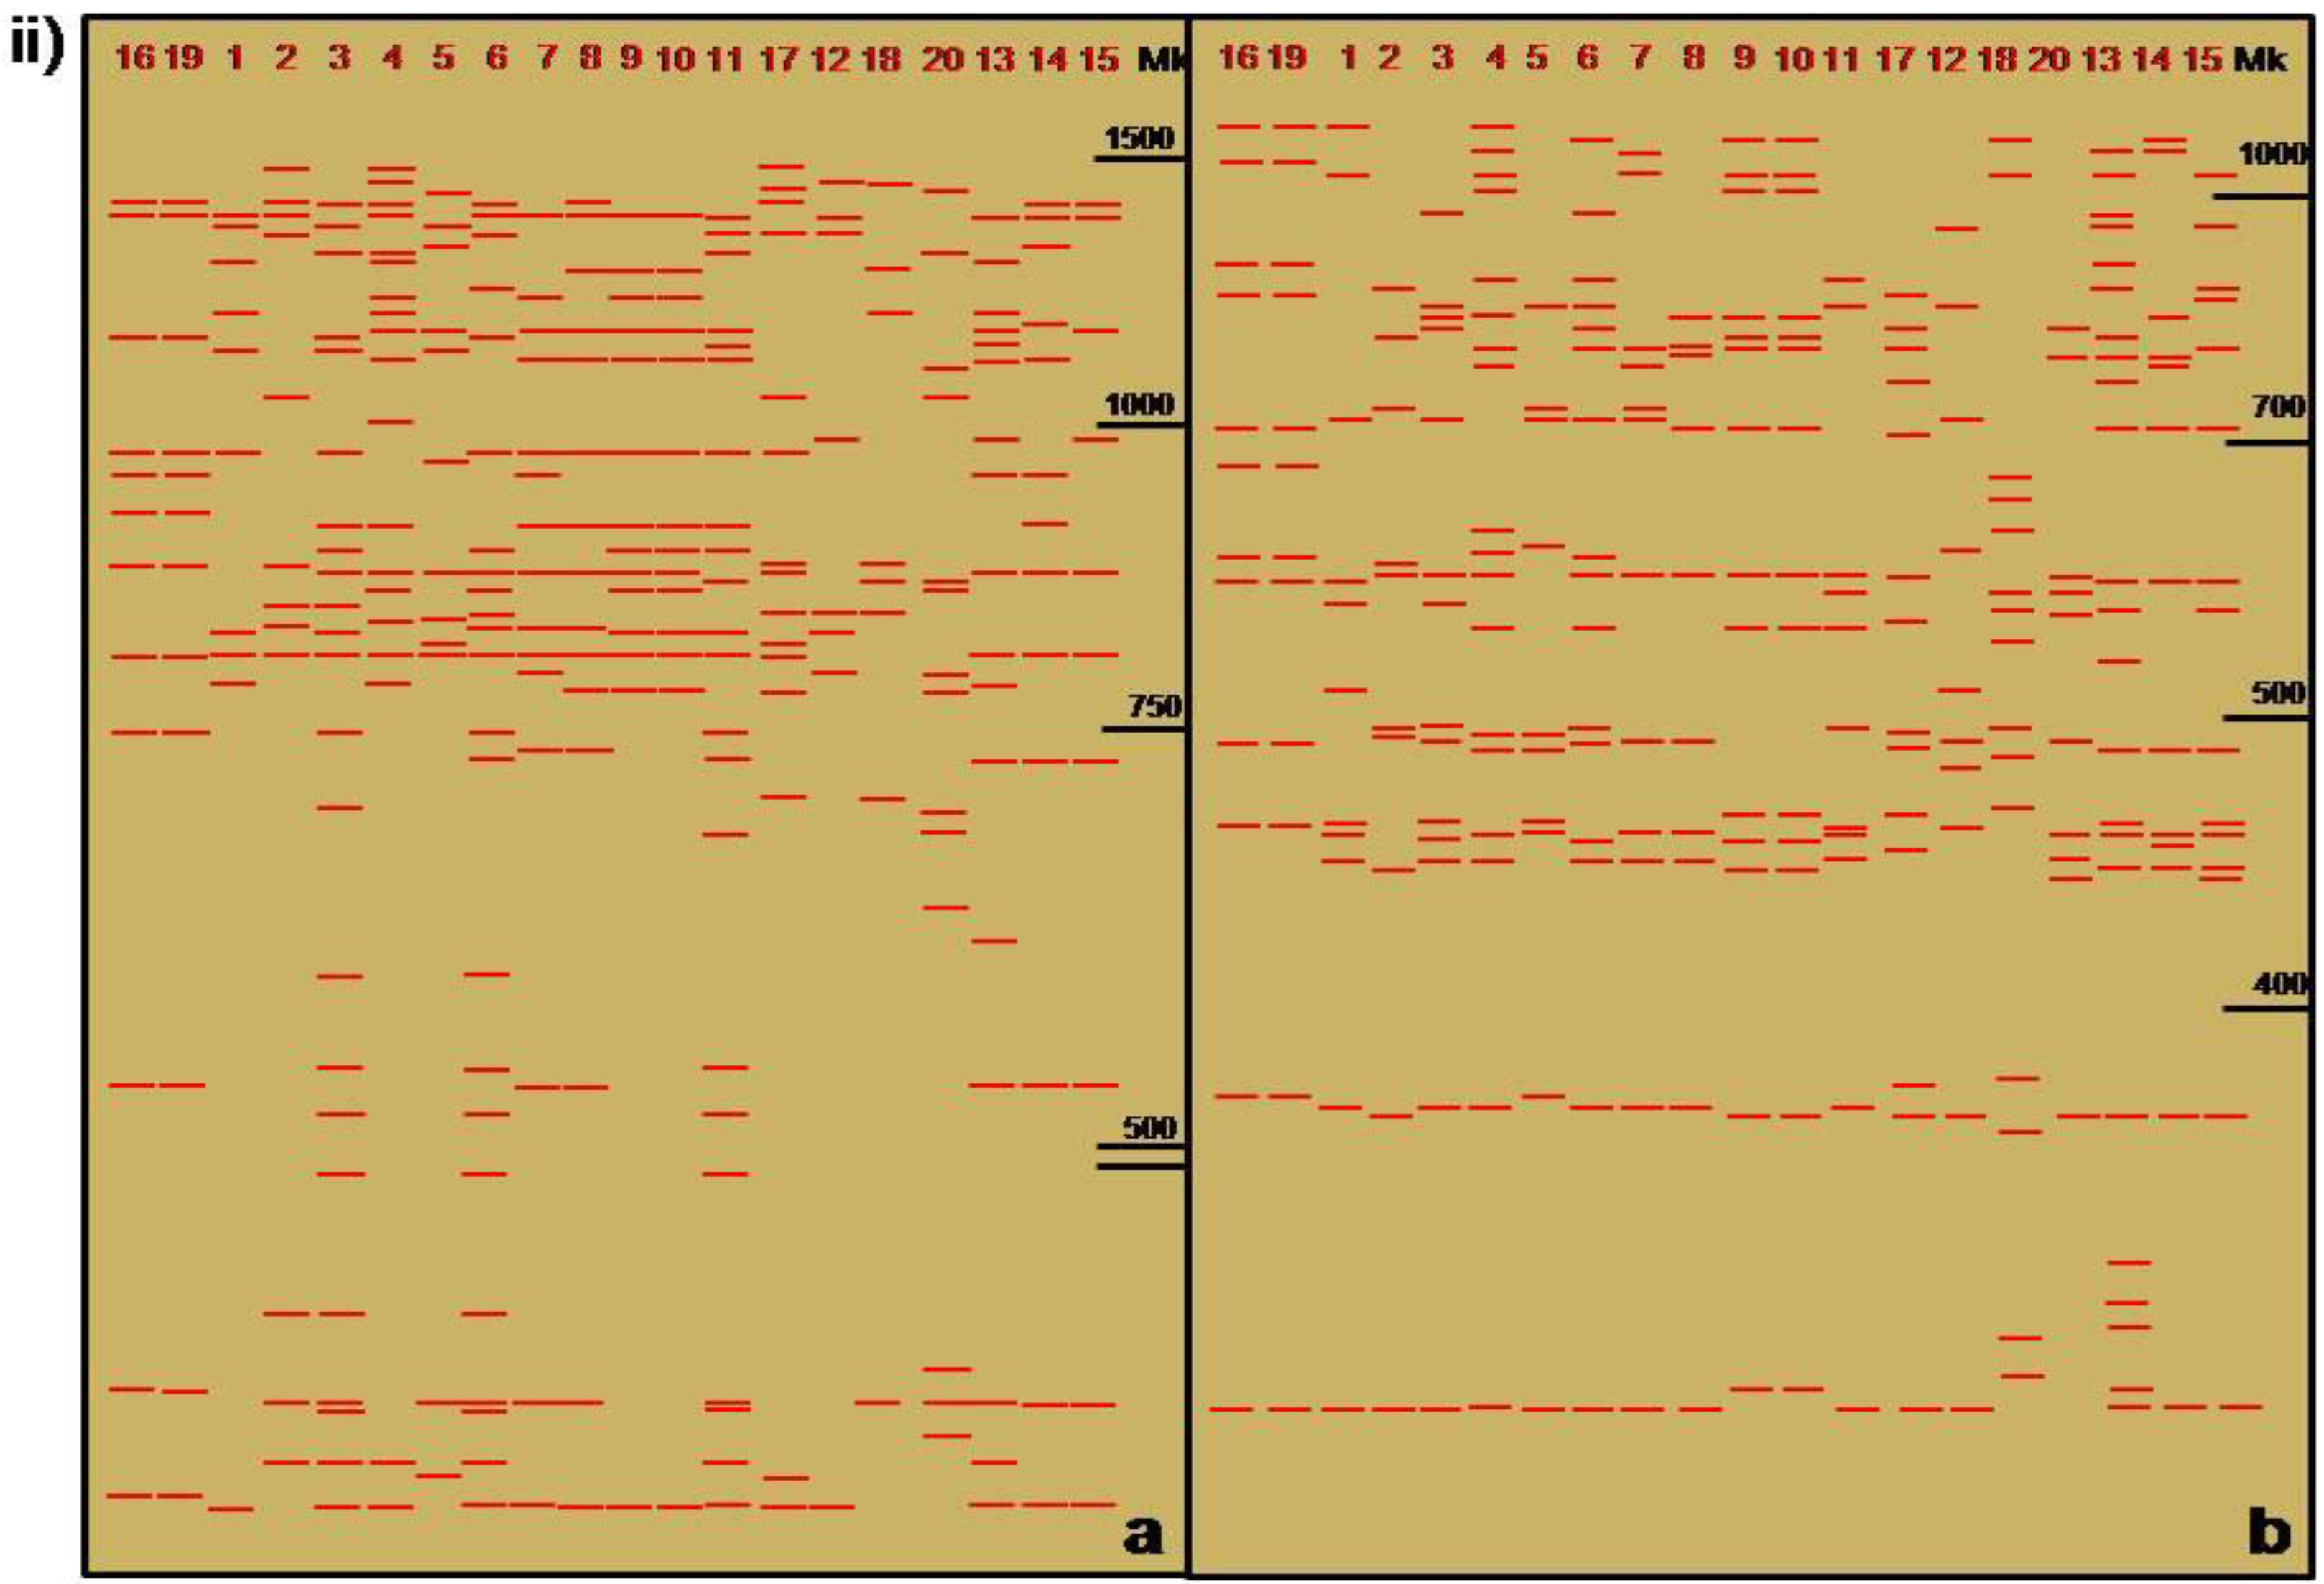
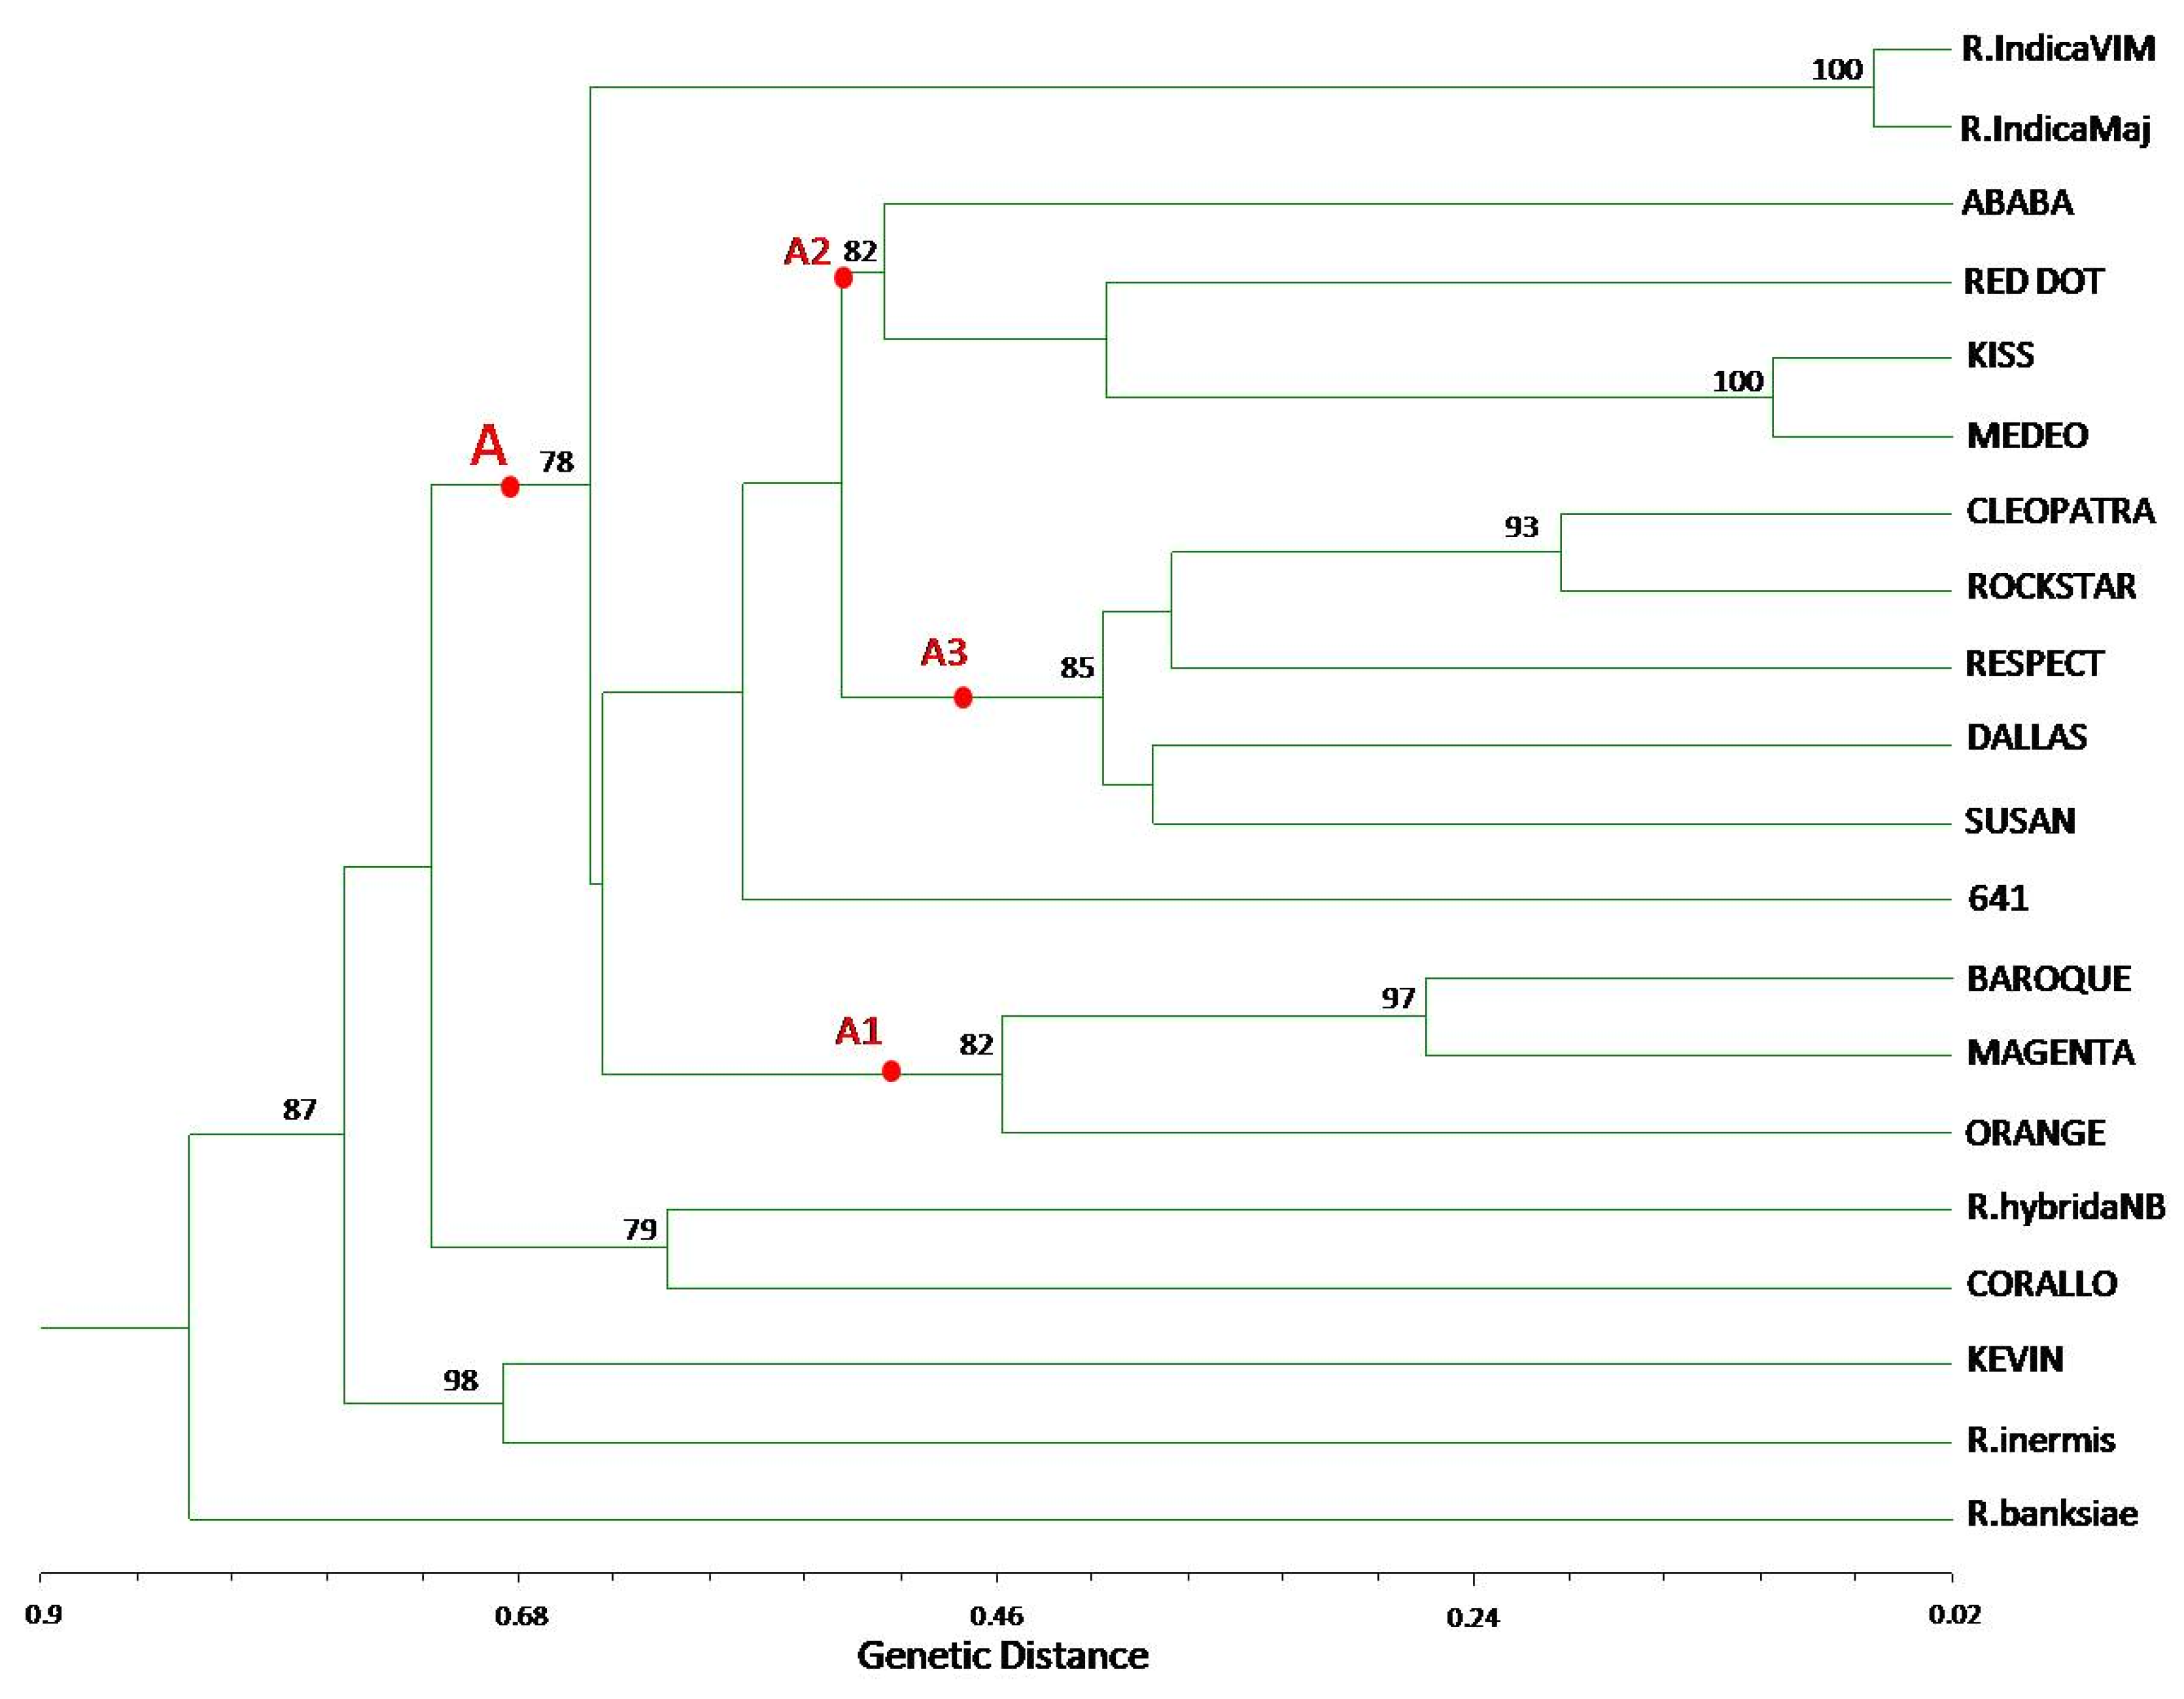
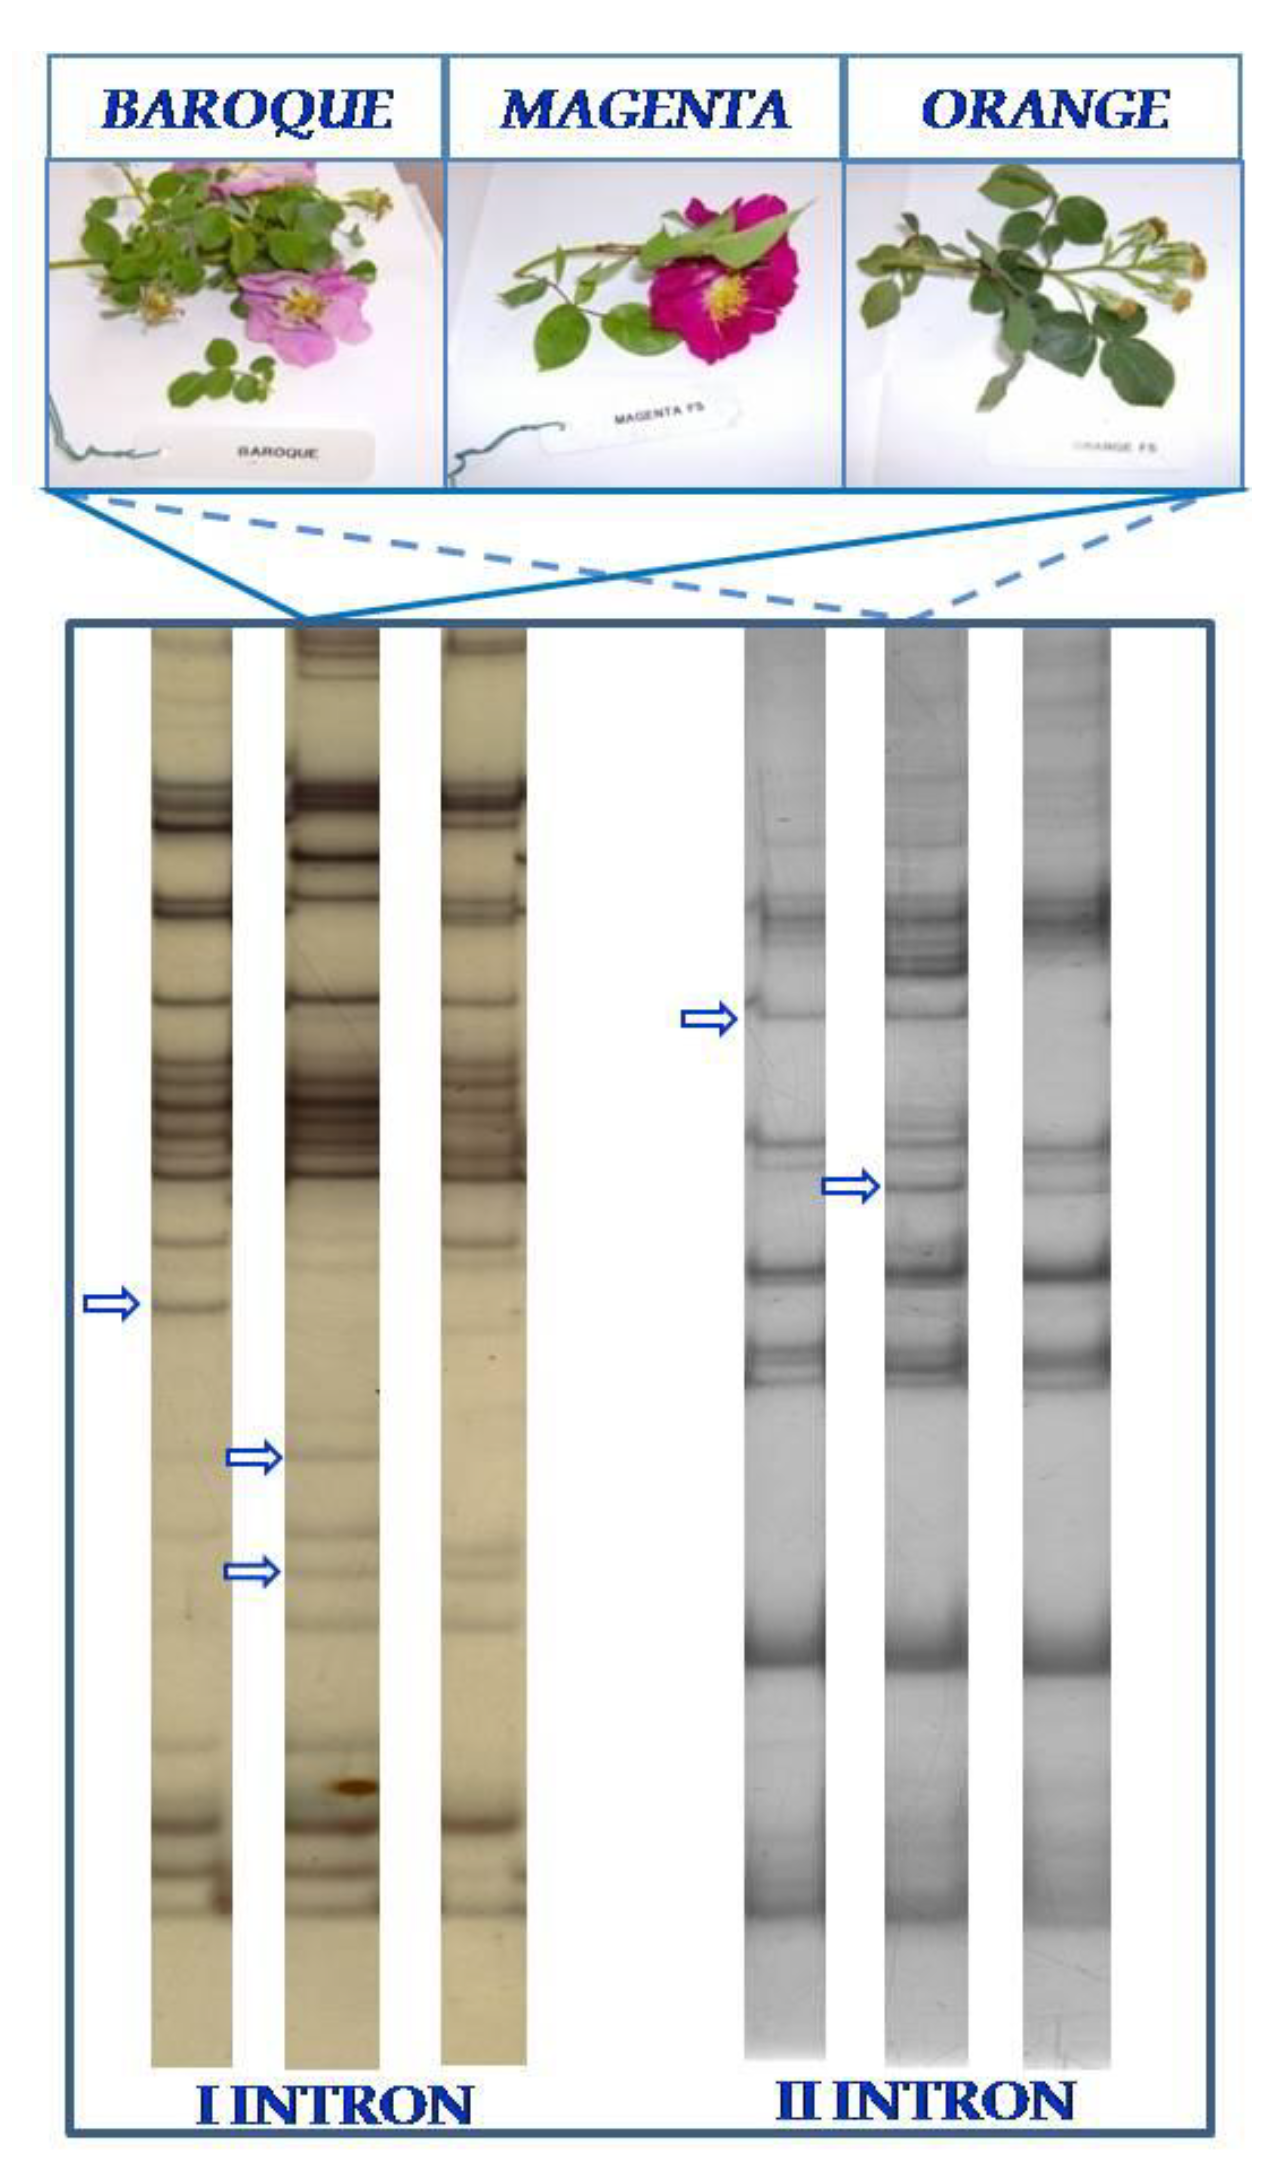
3.2. TBP/cTBP Analysis on Rosa spp.

Figure 2 reports the data and the schematic representation derived by a systematic application of the TBP (part a) and cTBP (part b) method to 20 different rose samples, five botanical species and 15 commercial cultivars, all not previously characterized at genetic level. As shown, a total of 183 intron-length polymorphic fragments were found, 90 and 93 for the first and the second intron respectively. The molecular marker sizes ranged between 250 and 1,500 base pairs, in accordance with the reported sizes of plant introns. Individually, each of the 20 analyzed rose samples is characterized by its own specific banding pattern, simple yet distinctive with few, fully explainable exceptions (see below). The number of amplified markers, from both intron I and II, for each sample may vary from eight to 23 and this is likely to reflect the high level of heterozygosity and the hybrid nature of the plant material as well as the different ploidy level, often resulting from multiple hybridization processes. Although the breeder did not provide us with any information about ploidy levels, such a possibility is in accordance with the fact that botanical species show the lower number of scorable bands, from eight to 15. Direct correspondence between the number of bands amplified by the TBP/cTBP method and the ploidy level was already observed and reported for other plant species and varieties [28]. To this regard, it should also be noted that the number of bands that are amplified from the first intron is substantially reproduced when amplifying the second intron, that is and indirect confirmation that the same gene loci, namely β-tubulin’s, are successfully and simultaneously targeted. As for the nucleotide sequence, although we have not isolated and cloned the fragments amplified from roses, we have done it for the TBP/cTBP amplification products of 20 different plant species finding no exception to the fact that each amplified band corresponded to a specific beta-tubulin isotype. As previously mentioned, few rose samples exhibit the same TBP/cTBP amplification pattern. This occurred among R. indica ‘Vera Indica Major® and R. indica ‘Major’ (lanes 1 and 2 in Figure 2) as well as among commercial cultivars ‘Kiss’ and ‘Medeo’ (lanes 11 and 12 in Figure 2). Both findings are not surprising, but actually confirm the reliability of the method since R. indica ‘Vera Indica Major® and R. indica ‘Major’ are two clones of the same species, therefore substantially isogenic to each other, whereas the cultivar ‘Medeo’ was selected as changed flower colour sports (mutation spontaneously occurred on genes involved in the flower color determination and subsequently fixed by the creation of a new cultivar) from ‘Kiss’ (personal communication from the breeder).
Figure 2. TBP/cTBP amplification profile for intron I (a) and intron II (b) of 20 different Rosa genotypes. (i) polyacrylamide gel electrophoresis (ii) schematic representation. Numbers indicate the accession name reported in Table 1. Marker sizes were estimated by comparison to molecular mass standards indicated on the right (MK).
Diversity 02 00572 g002aDiversity 02 00572 g002b
The resulting UPGMA-based clustering is shown in Figure 3. All the Rosa genotypes were clearly distinguished by their molecular fingerprints. The Nei and Li's dissimilarity distances index ranged from a minimum of 0.098 between R. indica ‘Vera Indica Major® and R. indica ‘Major’ to a maximum of 0.756 between the R. inermis and ‘641’ cultivars. As readily observable, all the botanical species group separately from the cultivars in the lower part of the dendrogram. Moreover, we indentified an A main cluster (with a bootstrap probability of 78%) that groups two botanical species and all but two commercial cultivars. The contribution of R. indica ‘Vera Indica Major® and R. indica ‘Major’ as a common rootstock in the grafting practice during the creation of varieties is also highlighted. Within cluster A, two sub-clusters could be recognized: A1 (bootstrap probability of 82%) comprises strictly related genotypes, intercrossed to each other and with minimal phenotypic variations, principally due to color changes (flower color sports); subcluster A2 (bootstrap probability of 82%) groups all accession commonly employed in the garden landscape and characterized by shrub growth habit. Among them the cultivars ‘Kiss’ and ‘Medeo’ are very closely related, as previously mentioned. Finally, subcluster A3 (bootstrap probability of 85%) groups all the cultivars referred to Tea Rose Hybrid class, that are mainly cultivated for the cut flower market. Overall, the cluster analysis based on the TBP/cTBP molecular markers shows consistency with regard to the breeding programs that led to the production of the 20 different Rosa accessions, each selected for different traits and purposes. The values of the genetic distances, although acceptable, may not be considered highly selective but this partial disadvantage is well counterbalanced by the rapidity, reproducibility and handiness of the TBP/cTBP method that grants a fast and easy recognition of each genotype. This is exemplified by the data of Figure 4 that show how the TPB/cTBP banding pattern can efficiently described the difference between very closely related species (those of subcluster A1), intercrossed to each other. The TBP/cTBP banding pattern actually provides an easily identifiable code that may be of use for the certification of the different Rosa species and registered cultivars.
Figure 3. The UPGMA dendrogram based on TBP and cTBP polymorphic fragments of the 20 Rosa genotypes. Numbers on the branches represent bootstrap values.
Diversity 02 00572 g003
Figure 4. TPB/cTBP banding pattern among closely related rose commercial varieties. Major polymorphisms are pointed by an arrow.
Diversity 02 00572 g004

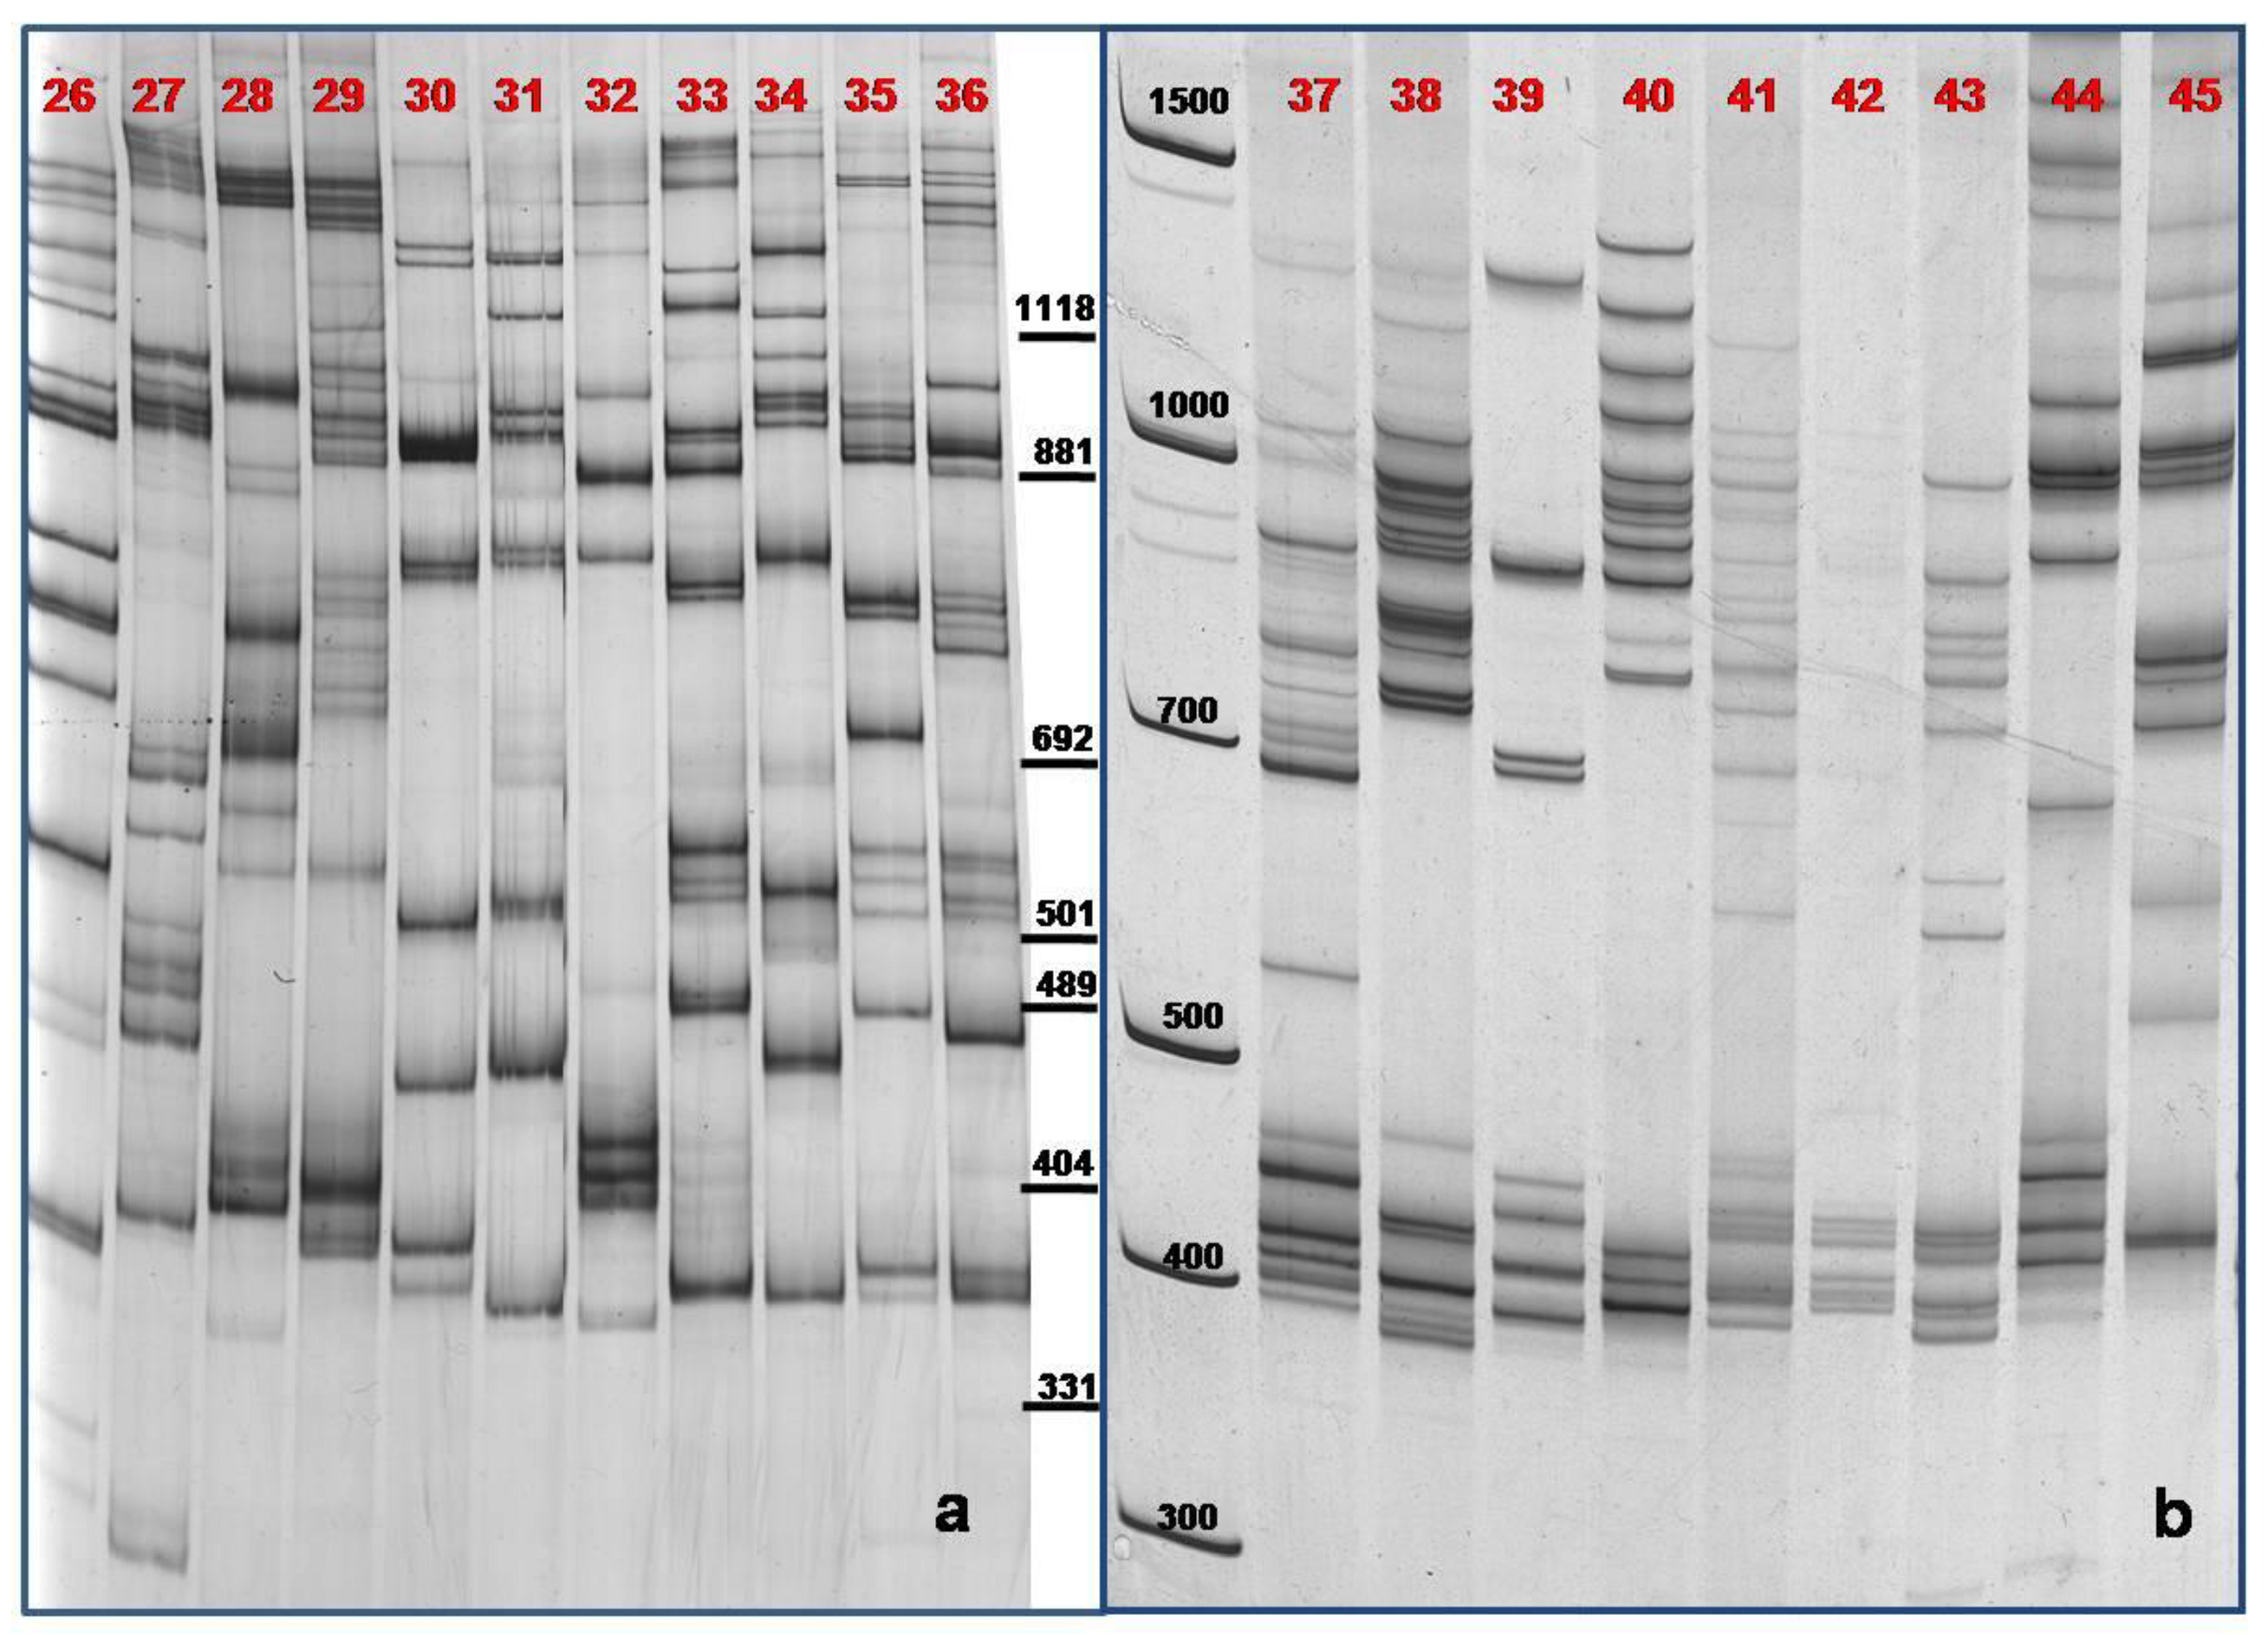
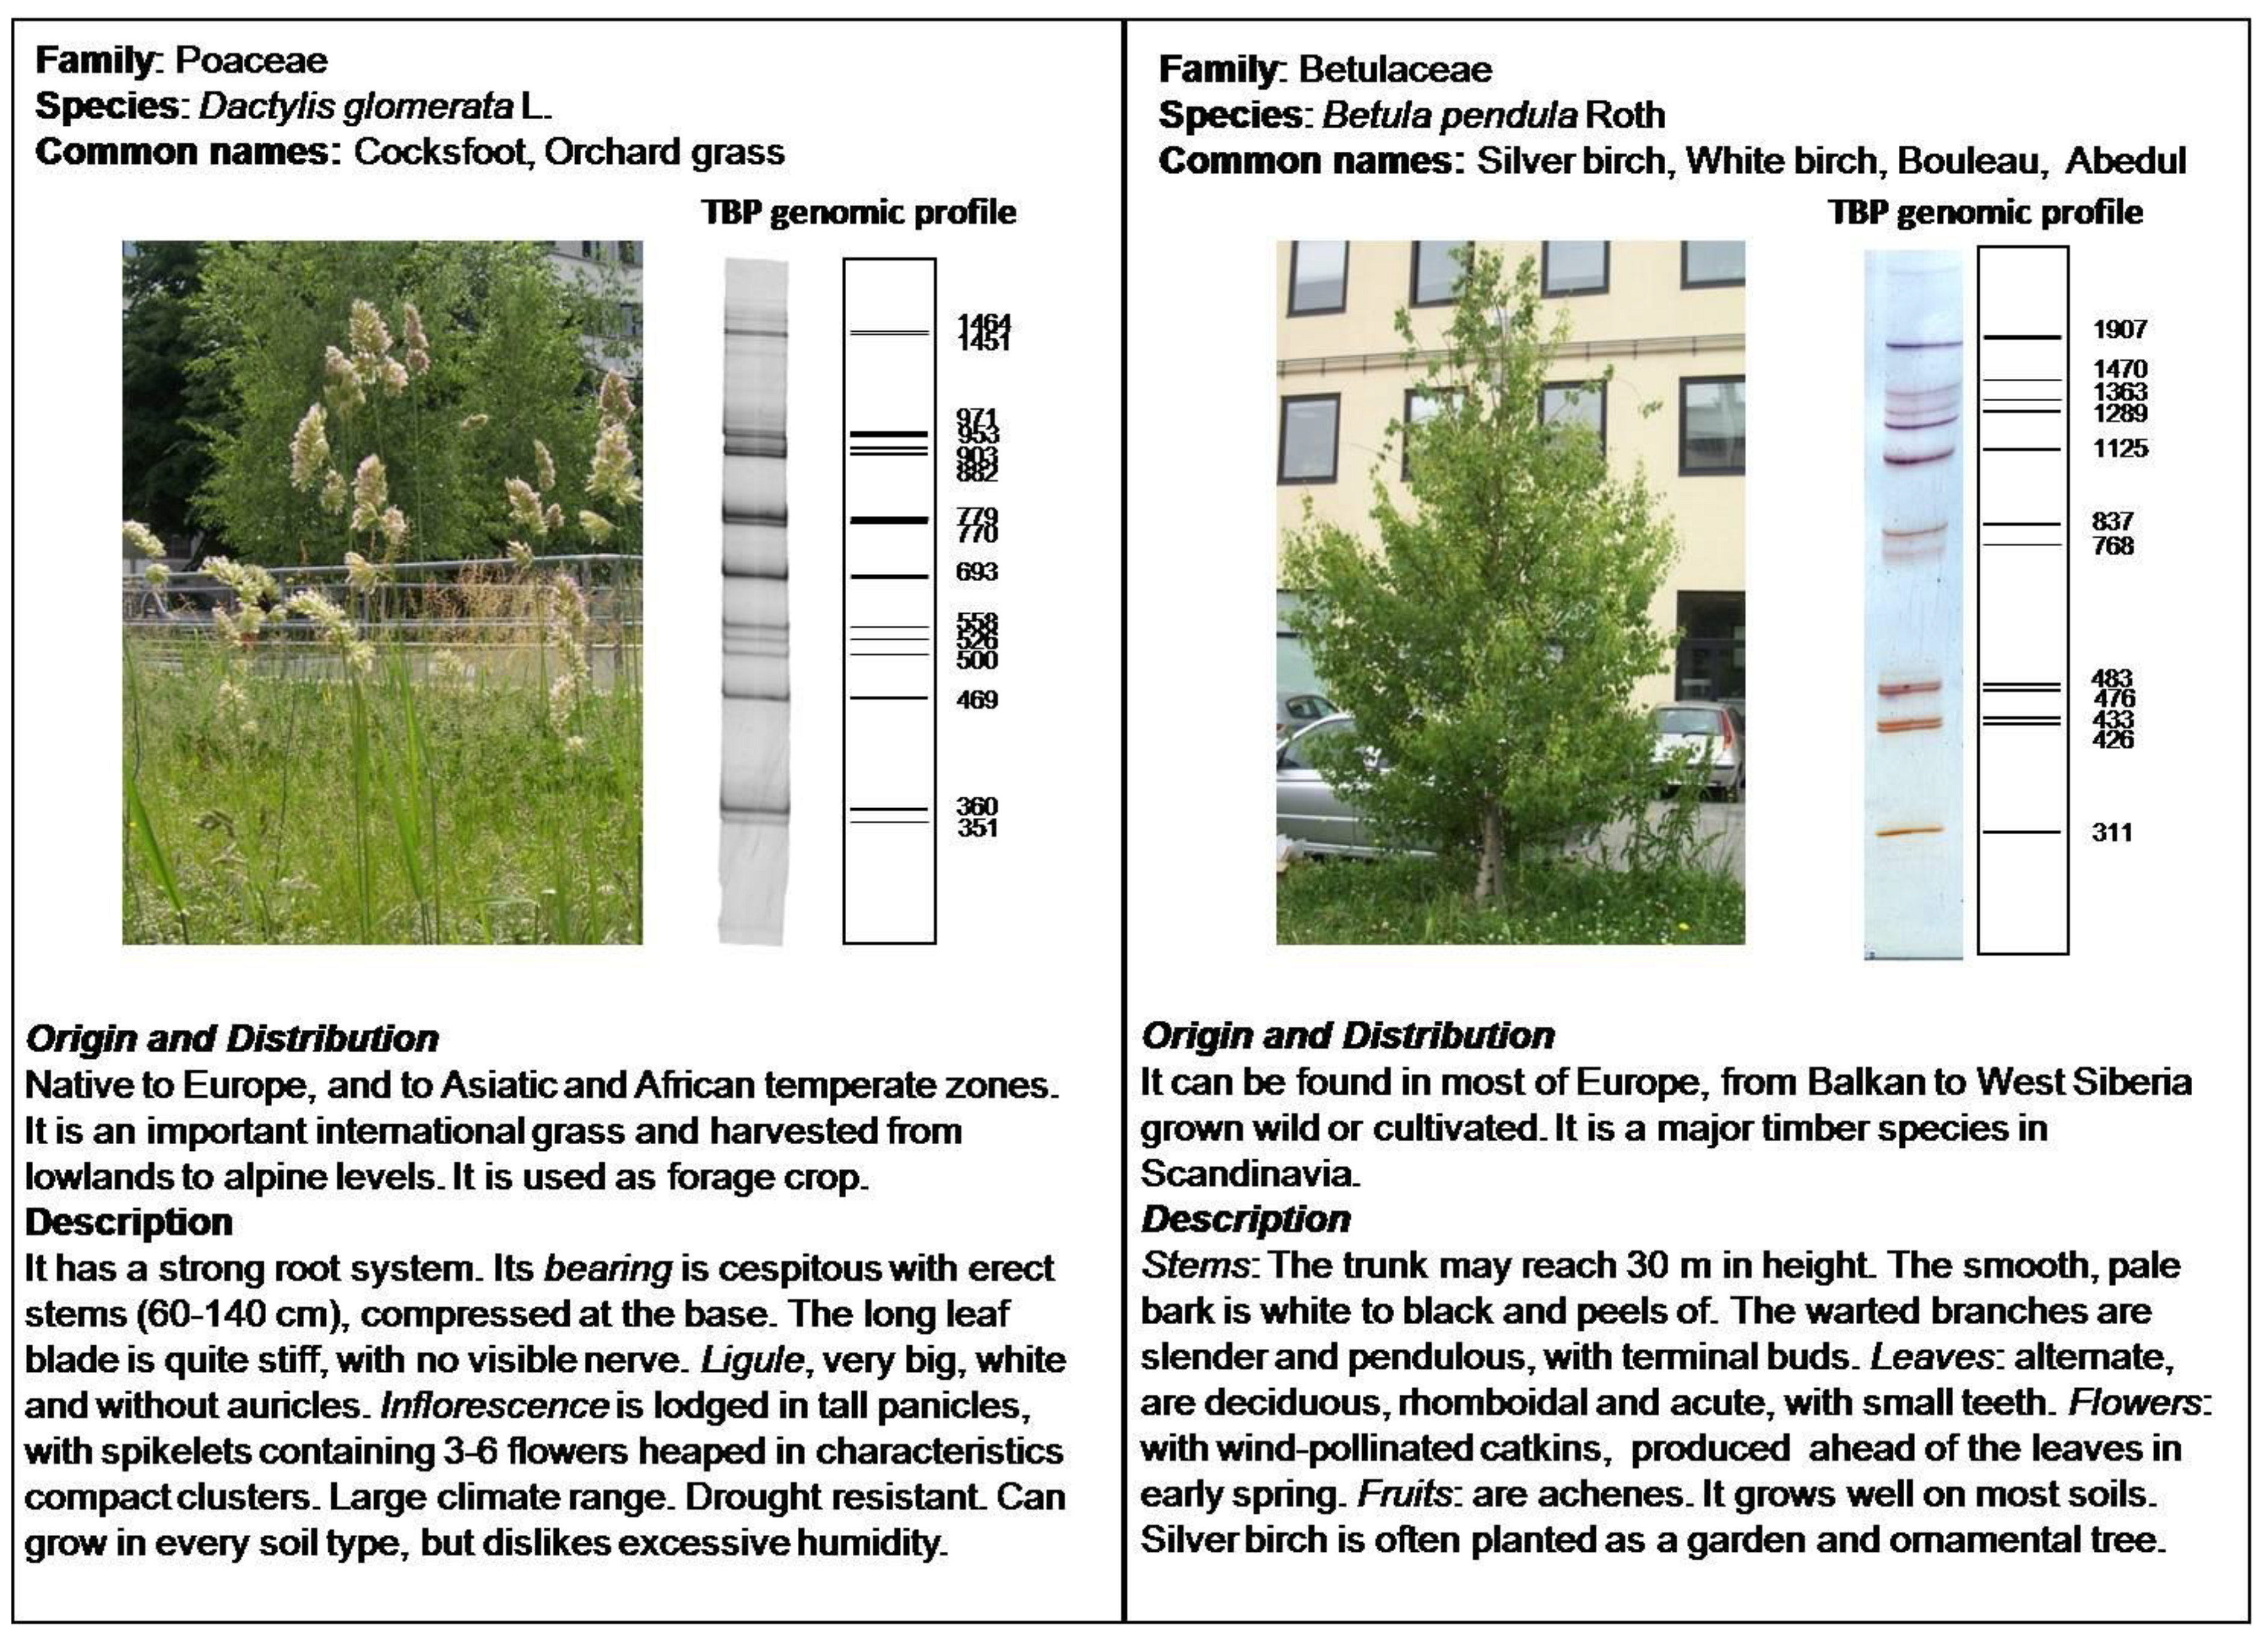
3.3. TBP/cTBP on Pasture and Garden Plants

The concept of a DNA barcode, possibly based on the TBP/cTBP plant genome profiling, is further reinforced by the data shown in Figure 5 that provide an extensive, fast and mutually distinctive characterization of 20 different monocot and eudicot herbaceous plants harvested in many areas of the city of Milan and surroundings (Table 1). Each of these species, all substantially uncharacterized at genomic level, exhibits its own specific TBP banding pattern (intron I in Figure 5) that differentiates it from the others. This information can then be used to update and to complement classical botanical description with tables like those shown in Figure 6, to be posted in proximity of parks, gardens and fields. Data of Figure 5 also provides the best of evidence for two important advantages of the TBP/cTBP method that is (1) the ability of genotyping plant species in the absence of any information about their genomes and (2) the remarkable interspecies transferability of the marker.
Figure 5. TBP amplification profile of 20 different monocot and eudicot herbaceous plants harvested in two areas of the City of Milan (a. Forlanini Park; b. IBBA- CNR garden). Numbers refer to those of Table 1.
Diversity 02 00572 g005
Figure 6. Example of botanical tables of two plants, one grass and one tree, present in the IBBA-CNR garden area in Milan: photo, classical morphological description, TBP/cTBP banding pattern.
Diversity 02 00572 g006
The combination of these two advantages also allows for a rapid and reliable comparison of the endemic herbaceous population that characterized different fields and pastures that then may become distinguishable for the presence of a distinct species, variety or ecotype of it. As reported in Figure 7, comparison between the TBP-mediated genome profiling of some accession (Table 1 from number 21 to 25) harvested in two distinct Alp pasturelands reveals several differences between ecotypes of the same species. This not only may characterize specific ecological niches, but it may be of use to associate a given pasture area with its own panel of grasses that may also associate with differences in the nutritional value.
Figure 7. TBP-mediated genome profiling for five pasture endemic herbaceous species. Different acronyms indicate distinct collection sites: Andossi Alpes (AA) and Culino Alpes (CA). Red circles indicate major DNA polimorphisms. Numbers are those of Table 1.
Diversity 02 00572 g007

4. Conclusions

Here, we have reported about the many features that characterize plant genomic fingerprinting carried out with the TBP/cTBP method, a particularly effective ILP marker. We have done it by presenting the data we have collected on a large number of rose species and hybrids, as well as a large variety of grass ecotypes. Remarkably, all the data have been obtained with the same experimental conditions and reagents providing further evidences for the handiness, the versatility and the interspecies transferability of the method. Cluster analysis performed with the molecular markers obtained with the TBP/cTBP on different rose accessions, releases a reliable map of genetic relationships largely consistent with their origin from the corresponding breeding programs. The TBP/cTBP marker can be effectively used as a DNA barcode for different plant species and ecotypes.

Acknowledgements

We wish to thank Sergio Patrucco of the Vivaio Rose Patrucco Company (www.patrucco.net) for providing us with the 20 different samples of roses. This work was partially supported by Regione Lombardia: agreement Regione/CNR, project 2 “Risorse biologiche e tecnologie innovative per lo sviluppo sostenibile del sistema agro-alimentare”.

References

  1. Orgel, L.E.; Crick, F.H. Selfish DNA: the ultimate parasite. Nature 1980, 284, 604–607. [Google Scholar] [CrossRef]
  2. Cavalier-Smith, T. Selfish DNA and the origin of introns. Nature 1985, 315, 283–284. [Google Scholar] [CrossRef]
  3. Le Hir, H.; Nott, A.; Moore, M.J. How intron influence and enhance eukaryotic gene expression. Trends Biomedical Sci. 2003, 28, 215–220. [Google Scholar] [CrossRef]
  4. Morello, L.; Breviario, D. Plant Spliceosomal Introns: not only cut and paste. Curr. Genomics 2008, 9, 227–238. [Google Scholar] [CrossRef]
  5. Mascarenhas, D.; Mettler, I.J.; Pierce, D.A.; Lowe, H.W. Intron-mediated enhancement of heterologous gene expression in maize. Plant. Mol. Biol. 1990, 15, 913–920. [Google Scholar] [CrossRef]
  6. Gianì, S.; Altana, A.; Campanoni, P.; Morello, L.; Breviario, D. In transgenic rice, α- and β-tubulin regulatory sequences control GUS amount and distribution through intron mediated enhancement and intron dependent spatial expression. Transgenic Res. 2009, 18, 151–162. [Google Scholar] [CrossRef]
  7. Li, S.C.; Tang, P.; Lin, W.C. Intronic microRNA: discovery and biological implications. DNA Cell. Biol. 2007, 26, 195–207. [Google Scholar] [CrossRef]
  8. Ruby, J.G.; Jan, C.H.; Bartel, D.P. Intronic microRNA precursors that bypass Drosha processing. Nature 2007, 448, 83–87. [Google Scholar] [CrossRef]
  9. Chanfreau, G.C.; Legrain, R.P.; Jacquier, A. Processing of a dicistronic small nucleolar RNA precursor by the RNA endonuclease Rnt1. EMBO J. 1998, 17, 3726–3737. [Google Scholar] [CrossRef]
  10. Brown, J.W.S.; Marshall, D.F.; Echeverria, M. Intronic noncoding RNAs and splicing. Trends Plant Sci. 2008, 13, 335–342. [Google Scholar] [CrossRef]
  11. Fedorov, A.; Merican, A.F.; Gilbert, W. Large-scale comparison of intron positions among animal, plants and fungal genes. Proc Natl. Acad. Sci. USA 2002, 99, 16128–16133. [Google Scholar] [CrossRef]
  12. Wendel, J.F.; Cronn, R.C.; Alvarez, I.; Liu, B.; Small, R.L.; Senchina, D.S. Intron size and genome size in plants. Mol. Biol. Evol. 2002, 19, 2346–2352. [Google Scholar] [CrossRef]
  13. Roy, S.W.; Gilbert, W. The evolution of spliceosomal introns: patterns, puzzles and progress. Nature Rev. Genet. 2006, 7, 211–221. [Google Scholar]
  14. Rodriguez-Trelles, F.; Tarrio, R.; Ayala, F.J. Origins and evolutionof spliceosomal introns. Annu. Rev. Genet. 2006, 40, 47–76. [Google Scholar] [CrossRef]
  15. Jeffares, D.C.; Mourier, T.; Penny, D. The biology of intron gain and loss. Trends Genet. 2006, 22, 16–22. [Google Scholar] [CrossRef]
  16. Gingeras, T.R. Origin of phenotypes: genes and transcripts. Genome Res. 2007, 17, 682–690. [Google Scholar] [CrossRef]
  17. Wang, X.; Zhao, X.; Zhu, J.; Wu, W. Genome-wide investigation of Intron-Length Polymorphisms and their potential as molecular markers in rice (Oryza sativa L.). DNA Res. 2005, 12, 417–427. [Google Scholar] [CrossRef]
  18. Breviario, D. Plant tubulin genes: regulatory and evolutionary aspects. In Plant Microtubules, 2nd ed.; Nick, P., Ed.; Springer-Verlag: Berlin, Heidelberg, Germany, 2008; pp. 207–232. [Google Scholar]
  19. Bardini, M.; Lee, D.; Donini, P.; Mariani, A.; Gianì, S.; Toschi, M.; Lowe, C.; Breviario, B. TBP, a new tool for testing genetic diversity in plant species based on functionally relevant sequences. Genome 2004, 247, 281–291. [Google Scholar]
  20. Inada, D.C.; Bashir, A.; Lee, C.; Thomas, B.C.; Ko, C.; Goff, S.A. Conserved noncoding sequences in the grasses. Genome Res. 2003, 13, 2030–2041. [Google Scholar] [CrossRef]
  21. Thomas, B.C.; Rapaka, L.; Lyons, E.; Pedersen, B.; Freeling, M. Arabidopsis intragenomic conserved noncoding sequence. Proc. Natl. Acad. Sci. USA 2007, 104, 3348–3353. [Google Scholar] [CrossRef]
  22. Li, X.; Tan, L.; Wang, L.; Hu, S.; Sun, C. Isolation and characterization of conserved non-coding sequences among rice (Oryza sativa L.) paralogous regions. Mol. Genet. Genomics 2009, 281, 11–18. [Google Scholar] [CrossRef]
  23. Ferreira, A.O.; Cardoso, H.G.; Macedo, E.S.; Breviario, D.; Arnholdt-Schmitt, B. Intron polymorphism pattern in AOX1b of wild St John’s wort (Hipericum perforatum) allows discrimination between individual plants. Physiol. Plantarum 2009, 137, 520–531. [Google Scholar] [CrossRef]
  24. Perumal, B.S.; Sakharkar, K.R.; Tak Kwong Chow, V.; Kangueane, P.; Sakharkar, M.K. Intron position conservation across eukaryotic lineages in tubulin genes. Front. Biosci. 2005, 10, 2412–2419. [Google Scholar] [CrossRef]
  25. Dhonukshe, P.; Mathur, J.; Hulskamp, M.; Gadella, T.W., Jr. Microtubule plus-ends reveal essential links between intracellular polarization and localized modulation of endocytosis during division-plate establishment in plant cells. BMC Biol 2005, 14, 3–11. [Google Scholar]
  26. Oakley, R.V.; Wang, Y.S.; Ramakrishna, W.; Harding, S.A.; Tsai, C.J. Differential expansion and expression of α- and β-tubulin gene families in Populus. Plant. Physiol. 2007, 145, 961–973. [Google Scholar] [CrossRef]
  27. Bierne, N.; Lenhert, S.A.; Bedier, E. Screening for intron-length polymorphism in penacid shrimps using exon-primed intron-crossing (EPIC)-PCR. Mol. Ecol. 2000, 9, 233–235. [Google Scholar] [CrossRef]
  28. Breviario, D.; Baird, W.V.; Sangoi, S.; Hilu, K.; Blumetti, P.; Gianì, S. High polymorphism and resolution in targeted fingerprinting with combined beta-tubulin introns. Mol. Breed. 2007, 20, 249–259. [Google Scholar] [CrossRef]
  29. Bassam, B.J.; Anollés, G.C.; Gresshoff, P.M. Fast and sensitive silver staining of DNA in polyacrylamide gels. Anal. Biochem. 1991, 196, 80–83. [Google Scholar]
  30. Van de Peer, Y.; De Wachter, R. Treecon for Windows: a software package for the construction and drawing of evolutionary trees for the Microsoft Windows environment. Comput. Appl. Biosci. 1994, 10, 569–570. [Google Scholar]
  31. Nei, M.; Li, W.H. Mathematical model for studying genetic variation in terms of restriction endonucleases. Proc. Natl. Acad. Sci. 1979, 76, 5269–5273. [Google Scholar] [CrossRef]
  32. Sneath, P.H.A; Sokal, R.R. Numerical Taxonomy; Freeman, W.H. Co.: San Francisco, CA, USA, 1973; p. 573. [Google Scholar]
  33. Hillis, D.M.; Bull, J.J. An empirical test of bootstrapping as a method for assessing confidence in phylogenetic analysis. Syst. Biol. 1993, 42, 182–192. [Google Scholar] [CrossRef]
  34. Liaud, M.F.; Brinkmann, H.; Cerff, R. The β-tubulin gene family of pea: primary structure genomic organization and intron-dependent evolution of genes. Plant Mol. Biol. 1992, 18, 639–651. [Google Scholar] [CrossRef]
  35. Casazza, A.P.; Gavazzi, F.; Mastromauro, F.; Gianì, S.; Breviario, D. Certifying the feed to guarantee the quality of traditional food: an easy way to trace plant species in complex mixtures. Food Chem. 2010. in review, manuscript ID FOODCHEM-D-09-02959. [Google Scholar]

