Article

Expressed Sequence Tag-Simple Sequence Repeat (EST-SSR) Marker Resources for Diversity Analysis of Mango (Mangifera indica L.)

1
Queensland Government Department of Agriculture, Fisheries and Forestry (DAFF), Agri-Science Queensland, Horticulture and Forestry Science, 28 Peters Street, Mareeba, QLD 4880, Australia
2
Queensland Government Department of Agriculture, Fisheries and Forestry (DAFF), Agri-Science Queensland, Crop and Food Science, Block 10, Level 1, Health and Food Sciences Precinct, 39 Kessels Road, Coopers Plains, QLD 4108, Australia
3
Queensland Government Department of Agriculture, Fisheries and Forestry (DAFF), Queensland Agricultural Biotechnology Centre, The University of Queensland, St. Lucia, QLD 4067, Australia
4
Queensland Alliance for Agriculture and Food Innovation (QAAFI), The University of Queensland, St. Lucia, QLD 4067, Australia
*
Author to whom correspondence should be addressed.
Current address: Translational Research Institute, 37 Kent St, Woolloongabba, QLD 4102, Australia;
Diversity 2014, 6(1), 72-87; https://doi.org/10.3390/d6010072
Submission received: 28 November 2013 / Revised: 7 January 2014 / Accepted: 7 January 2014 / Published: 20 January 2014
(This article belongs to the Special Issue Use of Molecular Markers in Genetic Diversity Research)

Abstract

:
In this study, a collection of 24,840 expressed sequence tags (ESTs) generated from five mango (Mangifera indica L.) cDNA libraries was mined for EST-based simple sequence repeat (SSR) markers. Over 1,000 ESTs with SSR motifs were detected from more than 24,000 EST sequences with di- and tri-nucleotide repeat motifs the most abundant. Of these, 25 EST-SSRs in genes involved in plant development, stress response, and fruit color and flavor development pathways were selected, developed into PCR markers and characterized in a population of 32 mango selections including M. indica varieties, and related Mangifera species. Twenty-four of the 25 EST-SSR markers exhibited polymorphisms, identifying a total of 86 alleles with an average of 5.38 alleles per locus, and distinguished between all Mangifera selections. Private alleles were identified for Mangifera species. These newly developed EST-SSR markers enhance the current 11 SSR mango genetic identity panel utilized by the Australian Mango Breeding Program. The current panel has been used to identify progeny and parents for selection and the application of this extended panel will further improve and help to design mango hybridization strategies for increased breeding efficiency.

Graphical Abstract

1. Introduction

The genus Mangifera belongs to the Anacardiaceae family and comprises 69 species [1], with the best known being the common mango (Mangifera indica L.). Mangoes are regarded among the five most important fruit commodities traded worldwide, along with, bananas, apples, grapes and oranges [2]. The estimated extent of Australian commercial mango production for local and overseas markets is on average 45,000 tons per annum from around 9,000 hectares (data from 2005–2011) [2].
“Kensington Pride” has dominated commercial production in Australia with its unique flavor and low fiber. However, its shortfalls have long been recognized [3,4,5], and include excessive vigor, irregular bearing and disease susceptibility. The dominance of “Kensington Pride” has narrowed the genetic base of mango production in Australia [6]. Since the 1960s, Australian breeders have been systematically attempting to widen the genetic base of the mango industry by identifying alternative varieties suited to Australian growing conditions through various selection and traditional breeding programs [7]. The progressive release of new cultivars, including “Delta R2E2” in 1991 [8], “B74” (Calypso™) in 2000 [9], “Honeygold” in 2002 [10], and “NMBP 1243”, “NMBP 1201” and “NMBP 4069” in 2009 [11] have helped develop and diversify the Australian mango industry. However, breeders have recognized the need for the continual development of new cultivars to keep the Australian industry competitive in domestic and international markets.
Breeding mangoes is a long term activity complicated by a heterozygous genome, polyembryony, juvenility, low fruit set and retention rates, long evaluation periods, and out-crossing behavior. These factors make genetic improvement through conventional parental selection and breeding slow and unpredictable. Adoption of molecular markers and genomics-based breeding strategies will likely improve predictability and breeding efficiency. Currently, the lack of basic genome sequence and DNA marker information limits the practical application and adoption of molecular technologies in mango breeding. Molecular markers linked to important phenotypic traits are especially useful when the traits are difficult, costly and time consuming to observe. Markers indicating DNA polymorphisms within a specific target gene are preferable as there is minimal risk in losing linkage due to recombination. Such markers are allele-specific and remain informative whatever the genetic background, and are therefore more likely to be transferable across taxonomic boundaries.
The initial low coverage genetic maps of M. indica developed by Kashkush et al. [12] and Chunwongse et al. [13] have only limited information on molecular markers and patterns of genetic diversity that reflect the evolutionary relationships of individual varieties and that may assist in identifying groups of varieties that are related by common ancestry [14].
In recent years, Mangifera germplasm has been collected and analyzed using simple sequence repeat (SSR) markers by Duval et al. [15], Schnell et al. [16] and more recently by Dillon et al. [6]. The traditional techniques of developing SSR markers are usually time consuming, labor intensive and of low efficiency [17]. However, alternative strategies to identify SSR markers have been developed that use comparative genomics tools such as expressed sequence tags (ESTs) [18,19,20]. A key advantage of EST-SSRs is that they are often more transferable across closely related genera compared to anonymous SSRs from untranslated regions (UTRs) or non-coding sequences e.g., [21,22]. This is due to the primer target sequences residing in the expressed DNA regions expected to be relatively well conserved, thereby increasing the chance of marker transferability across species boundaries [23,24]. Despite their potential to represent selectively deleterious frame-shift mutations in coding regions, EST-SSRs appear to reveal equivalent levels of polymorphisms compared to SSRs located in UTRs, most likely due to an evolutionary trend towards tri-nucleotide repeats in these coding regions [17]. EST-SSRs are physically linked to expressed genes and therefore represent potentially functional markers.
An estimated 2%–5% of all plant-derived ESTs are thought to harbor SSRs [25], although the actual frequency of SSR-bearing ESTs in any particular analysis is highly dependent on the search parameters. Moreover, 80%–90% of EST-SSRs are typically found to be polymorphic [26,27]. Taking into account typical marker development attrition rates, it is likely that EST databases containing as few as 1,000 sequences could provide sufficient markers to facilitate population genetic analyses [17]. EST–derived SSRs have been well documented in some plant species including Arabidopsis thaliana [28], sugarcane [29], and cacao [30]. Putative functions can be deduced for the SSRs using homology searches and thereby provide a new resource that can further aid in genetic and evolutionary studies [31]. As the numbers of cloned mango genes and available EST sequences from diverse tissues slowly increase [32] large-scale searches for SSR motifs and design of SSR primers using computational methods are becoming feasible.
In this study we present the identification and validation of 25 mango EST-SSRs linked to candidate genes involved in plant development, stress response, fruit color and flavor development pathways. The EST-SSRs were tested for the extent of PCR amplification, polymorphism and heterozygosity across a diverse selection of varieties of M. indica and related Mangifera species held at the Australian National Mango Genebank (ANMG).

2. Experimental Section

2.1. Plant Material

Thirty-two mango (M. indica) varieties and Mangifera species maintained at the ANMG at Southedge Research Station, Mareeba (16°45′S, 145°16′E) and at Ayr Research Station (19°31′S, 147°22′E), Queensland, Australia, were used in this study (Table 1). All varieties were grafted onto the uniform polyembryonic rootstock of the cultivar “Kensington Pride”.
Table 1. Country of origin of 32 Mangifera varieties used in the evaluation of mango expressed sequence tag-simple sequence repeat (EST-SSR) microsatellite markers.
Mangifera VarietySpeciesOriginMangifera VarietySpeciesOrigin
Banana CalloM. indicaAustraliaNam Doc MaiM. indicaThailand
Kensington PrideM. indicaAustraliaIrwinM. indicaUSA (Florida)
AlphonsoM. indicaIndiaKeittM. indicaUSA (Florida)
CreepingM. indicaIndiaKentM. indicaUSA (Florida)
Hybrid 17M. indicaIndiaLippensM. indicaUSA (Florida)
NeelumM. indicaIndiaPalmerM. indicaUSA (Florida)
PadiriM. indicaIndiaTommy AtkinsM. indicaUSA (Florida)
S.B. ChausaM. indicaIndiaVan DykeM. indicaUSA (Florida)
SuvarnarekhaM. indicaIndiaSapaM. indica (sens. let.)Vietnam
AppleM. indicaMalaysiaXoài Cat ChuM. indicaVietnam
ArumanisM. indicaMalesiaJulieM. indicaWest Indies
Tung ChiM. indica (sens. let.)MalesiaBinjaiM. caesiaIndonesia
Carabao LamaoM. indicaPhilippinesBogor 2M. foetidaIndonesia
WillardM. indicaSri LankaLombocM. laurinaIndonesia
FalanM. indicaThailandUnknownMangifera sp.Malaysia
Maha ChanookM. indicaThailandKweniM. odorataMalesia
EST libraries were constructed from “Kensington Pride” red leaves, flowers, fruit pulp and skin, and roots and “Irwin” red leaves. “Kensington Pride” was selected as it is the predominant variety grown in Australia. “Irwin” was selected for its high fruit color, high productivity, semi-dwarf characteristics and as a parent of a breeding population of the Australian Mango Breeding Program (AMBP).

2.2. Phenotypic Evaluation of Mango Fruit

Pulp color, background skin color and blush color were evaluated on the majority of the varieties analyzed. At harvest, 10 fruit from each variety were sampled evenly from all quadrants of each tree. Fruits were transported to the laboratory within two hours of harvest, where they were dipped in 1 mL·L−1 of the fungicide carbendazim at 52 °C for 5 min and subsequently held between 22 °C and 24 °C to ripen. All color evaluations were undertaken on fruit at the eating ripe stage. Color was evaluated categorically and electronically using the Hunter L. a. b. color scale [33].

2.3. Genomic DNA Extraction

Genomic DNA extractions were performed according to the method described by Dillon et al. [6].

2.4. RNA Extraction

RNA was extracted from “Kensington Pride” red leaf, fruit skin, fruit flesh, flower and root tissues, and from “Irwin” red leaf tissue using the Spectrum™ Plant Total RNA Kit (Sigma-Aldrich, Sydney, Australia) according to the manufacturer’s instructions.

2.5. EST Library Construction, Sequencing and Annotation

The SuperScript Plasmid System for cDNA Synthesis and Cloning (Invitrogen) was used to construct the cDNA libraries in accordance with the manufacturer’s protocols. Single pass, 5' end sequencing was performed at the Australian Genome Research Facility (AGRF) using Applied Biosystems 3730 capillary sequencers. The raw chromatogram files were quality clipped using phred [34,35] and vector sequences were removed using CrossMatch within the Staden package [36]. The Staden output files were parsed using Perl scripts prior to assembly using CAP3 [37]. Putative functions of resulting contig and singleton sequences were assigned on the basis of similarity to A. thaliana amino acid sequences (TAIR8) [38] using BLASTx [39]. Bioinformatics analysis was performed at the Queensland Facility for Advanced Bioinformatics (QFAB).

2.6. EST Data Mining

EST sequences were mined for SSRs using Perl scripts with thresholds of six repeat units for di-nucleotide repeats and four repeat units for tri-, tetra-, penta-, and hexa-nucleotide repeat motifs. Sequences with putative SSRs were passed to Primer3 [40] and PCR primers were designed where sequence context permitted.
A set of 25 EST-SSRs was further analyzed (Table 2). These markers were selected based on their placement within putative genes involved in plant development, stress response, and fruit ripening and color development. Primer pairs were synthesized by Applied Biosystems (Foster City, CA, USA) and forward primers were labeled at the 5' end with fluorescent dyes 6FAM, VIC, PET or NED.
Table 2. EST-SSR nucleotide repeat motifs in mango DNA.
VarietyTissueNumber of ReadsAverage Length (nt)DiTriTetraPentaHexaTotal
Kensington PrideRed Leaf6,304473843471238454
Kensington PrideFruit4,695623602101918296
Kensington PrideFlower4,500550512459912326
Kensington PrideRoot5,3027043935522220438
IrwinRed Leaf4,03956462210842286
Total 24,840 2961,3677019501,802

2.7. DNA Amplification and Capillary Electrophoresis

EST-SSR polymerase chain reaction (PCR) amplifications were carried out in a Veriti® Thermal Cycler (Applied Biosystems: Foster City, CA, USA). The amplifications were conducted in a total of 6 μl containing 1x ImmoBuffer (Bioline Pty Ltd.: Alexandria, Australia) 1.5 mM MgCl2, 1.25 mM dNTPs, 0.33 μM of each primer and 0.2 units Immolase™ DNA polymerase (Bioline Pty Ltd.: Alexandria, Australia). Thermal cycling conditions included an initial denaturation at 95 °C for 15 min followed by 40 cycles of 30 s at 94 °C, 30 s at 55 °C, and 60 s at 72 °C with 10 min at 72 °C for a final extension.
PCR amplicons were separated by capillary electrophoresis on a 3730 DNA Analyzer (Applied Biosystems: Foster City, CA, USA). Samples were prepared by adding 1 mL of PCR product mixed with 10.4 mL of HiDi formamide and 0.06 mL of the size standard LIZ 500 (Applied Biosystems: Foster City, CA, USA) prior to a 60 min separation at 230 V, 32 amp.

2.8. Data Analysis

Allele data analysis was performed using the GeneMapper software version 3.7 (Applied Biosystems: Foster City, CA, USA) for internal standard and fragment size determination and for allelic designations. Automated allele calling was performed initially and flagged data then called manually.
The genetic similarities between the genotypes were calculated from allele frequency data using three genetic distance methods: Cavalli-Sforza’s chord distance [41], Reynolds distance [42], and Nei’s genetic distance [43,44]. Evaluation of the three analysis methods was based on the degree of congruence among tree topologies as well as the ability to detect geographical groupings. The best results were obtained with Cavalli-Sforza’s chord distance, a measure that assumes no mutation, that all gene frequency changes are caused by genetic drift alone, is independent of samples size and number of loci and is not strongly affected by null alleles [45]. The Cavalli-Sforza chord distance uses the geometric distance between multi-dimensional points on a hyper-sphere (a sphere with >3 dimensions) [46].
Dendrograms were constructed only using the Cavalli-Sforza chord distance, with the neighbour-joining (NJ) method and rooted on the mid-point [47]. The robustness of the dendrograms was assessed by creating 1,000 bootstrap replicates of the data and then generating a majority rule consensus tree. Distance calculations, tree construction and bootstrapping were all performed in PowerMarker V3.0 [48].
Expected and observed heterozygosity were calculated using CERVUS© 3.0.3 [49]. Polymorphism information content (PIC) values for diversity analysis were calculated (CERVUS© 3.0.3) for each locus according to the formula: PIC = 1 – Σ Pi2, where Pi is the frequency of the ith allele in examined genotypes [50]. EST-SSR and phenotypic data (background skin color, blush color, pulp color of fruit) were evaluated by estimating cophenetic correlation using Mantel’s matrix correspondence test with 10,000 permutations [51]. The Euclidean distance or simple-matching distance was used for the phenotypic data.

3. Results

3.1. Analysis of Mango EST-SSR Sequences

A total of 24,840 EST sequences were generated from five M. indica cDNA libraries prepared from “Kensington Pride” red leaf, fruit, flower and root and “Irwin” red leaf. BLASTx analysis of the quality clipped and trimmed ESTs identified 22,726 sequences (93%) with matches to A. thaliana amino acid sequences at e values less than 1 × 10⁻¹⁰. These libraries contained approximately 14.5 × 10⁶ nucleotides of mango sequence with an average length of EST sequences of 578 nucleotides. Using strict threshold criteria, 1,802 SSRs were identified from over 1,100 EST sequences (4%). Assembly of the SSR-containing ESTs produced 174 contigs and 582 singletons with an average length of 781 nucleotides and 647 nucleotides, respectively. Based on this assembly, 10 contigs showed evidence of in silico SSR variability. A single SSR each was present in 866 ESTs, whereas 116 ESTs contained two SSRs and 29 ESTs contained three or more SSRs. Fifty-seven different SSR motif types were represented. Repeat numbers ranged from four to 42 with an average repeat length of 15.6 nucleotides. The most common repeat motif found within all mango EST-SSRs were the tri-nucleotide repeats with 1,367 EST-SSRs, almost 76% of the total EST-SSRs identified (Table 2). The next most common EST-SSRs were the di-nucleotide repeats with 296 identified (16.4%), followed by tetra- (3.8%), hexa- (2.8%) and the least common penta-nucleotide repeats with just 1% found. The most frequent EST-SSR tri-nucleotide repeat motif was (AAG)n and di-nucleotide repeat motif (AG)n. “Kensington Pride” red leaf (n = 454) and root (n = 438) cDNA libraries showed the highest number of EST-SSR sequences. The lowest number of EST-SSR sequences were identified in “Irwin” red leaf (n = 286) and “Kensington Pride” fruit skin and flesh (n = 296) cDNA libraries.

3.2. Marker Development and Polymorphism of Mango EST-SSRs within Mangifera indica

Only di-, tri-, tetra-, penta- and hexa-nucleotide repeats were considered as potential candidates for EST-SSR marker development (Table 3). Primer pairs were designed for 36 mined EST sequences and PCR was successful for 25 with a single distinct PCR product generated across a selection of 27 M. indica varieties and five related Mangifera species. Only two alleles were detected in any individual marker combination but not all loci produced allele sizes that conformed to the repeat unit length indicated. Thirteen EST-SSR markers produced allele sizes that were shorter than the repeat length of the locus (QGMi001, QGMi002, QGMi004, QGMi008, QGMi009, QGMi010, QGMi011, QGMi014, QGMi015, QGMi016, QGMi019, QGMi024 and QGMi025). Of the 25 EST-SSR loci assessed only one marker (QGMi017) showed no polymorphism within any of the Mangifera species analyzed. This marker was discounted in any further analyses. A further five EST-SSR loci (QGMi006, QGMi008, QGMi019, QGMi022 and QGMi023) failed to show polymorphism at the intra species level within M. indica varieties. Discounting all six monomorphic EST-SSR loci, a total of 83 alleles were detected across the 27 M. indica varieties assessed (Table 3). The number of alleles detected per locus varied from two to 13 with an average of 4.37 alleles per locus. Seven EST-SSR loci had a PIC value higher than 0.5. The highest number of alleles (13) was determined for QGMi009, with a PIC value of 0.843 and the lowest number of alleles (two) was determined for QGMi007, QGMi012, QGMi014 and QGMi025. The least polymorphic was SSR locus QGMi014 with a PIC value of 0.036. The average observed heterozygosity (HO) was below the average expected heterozygosity (HE), indicating a tendency towards inbreeding, most likely due to population isolation.

3.3. Cross-Species Amplification

Cross-species amplification of M. indica EST-SSR loci in five Mangifera species, including Mangifera caesia Jack, Mangifera foetida Lour., Mangifera laurina Blume, Mangifera odorata Griff., and an unidentified Mangifera species, was evaluated. All EST-SSR makers showed a high transferability. M. caesia showed the greatest EST-SSR loci polymorphism among analyzed Mangifera varieties with eleven markers showing private allele sizes in this species (Table 4), while three EST-SSR loci (QGMi010, QGMi020, and QGMi024) repeatedly failed to amplify a PCR product.
M. foetida demonstrated a private allele for QGMi002 (268 bp), QGMi004 (233 bp) and QGMi025 (298 bp). Private alleles were also present within M. laurina for QGMi009 (212 bp) and the unidentified Mangifera species for QGMi001 (228 bp), QGMi002 (252 bp) and QGMi011 (258 bp).
Discounting the two monomorphic EST-SSR loci (QGMi007 and QGMi017) a total of 75 alleles were detected across the five Mangifera species assessed (Table 3). The number of alleles detected per locus varied from two (QGMi006, QGMi008, QGMi014, QGMi015, QGMi018, QGMi019, QGMi020, QGMi021, and QGMi022) to seven (QGMi004) with an average of 3.26 alleles per locus.
Table 3. Characteristics of 25 EST-SSR markers screened across 27 varieties of M. indica and five Mangifera species.
LocusGenBank Accession No.Repeat MotifHomologye-valuePrimer Sequence (5'-3')M. indicaMangifera Species
Size RangeNo. AllelesHEHOPICSize RangeNo. Alleles
QGMi001JZ532296(CCTTT)5Short vegetative phase
(controlling flowering time)
4.00e − 51GAAAGGCTTGCAGAGACAGG171–22770.6900.6670.633171–2286
(floral development) GTTTCTTCTGTTCGGTGATGGAGGAGT
QGMi002JZ532297(CTT)4Lacerata (CYP86A8) 2.00e − 49GCTCAACCTCTTTCCTGCTC241–25930.4400.3700.382245–2685
(plant development) GTTTCTTCAATCCCCAGAAGAAAACCA
QGMi003JZ532319(CTT)6TIR-NBS-LRR disease resistance gene3.00e − 24CAGGAATCTTCCCAAACGAA157–16940.5160.5560.445157–1694
(defence response) GTTTCTTTGCCAGTGTCTTCACCTTCA
QGMi004JZ532302(AAG)59-cis epoxycarotenoid dioxygenase 52.00e − 44TTCACAACGAGAAGACATGGA236–24470.7840.5930.732233–2457
(abscisic acid biosynthesis; stress response) GTTTCTTGGGACCTATTCGATCCCACT
QGMi005JZ532303(AAC)8WRKY40 2.00e − 53TGGAGGAATTGAACCGATTG303–31860.7520.5190.691303–3244
(transcription factor; defence response) GTTTCTTCAGTATCGGAGGCGTCAGTC
QGMi006JZ532304(AAG)4Squalene monooxygenase 7.00e − 58GCTTGCTTCGAGTTTTTGGT2381NDNDND238–2412
(isoprenoid biosynthesis) GTTTCTTCGAGGAATGATCTCCGTTGT
QGMi007JZ532306(ATC)5KNAT1 (Brevipedicellus 1) 3.00e − 37GCCTGAAGTAGTGGCTCGAC307–31320.0730.0740.0693071
(plant development) GTTTCTTGAAATCCATGGCCTCCTGTA
QGMi008JZ532307(ATC)4WRKY7 9.00e − 13TCCAGCAATTTCCACCTTTC1771NDNDND177–1792
(transcription factor; stress response) GTTTCTTTCACCATCACCAGTCAAGGA
QGMi009JZ532308(AT)29LRR transmembrane protein kinase1.00e + 00GGGTTAGCAAAACTGGTGGA156–228130.8720.5560.843156–2124
(cell signalling) GTTTCTTCCCCAAGGATATACAGTAACCAG
QGMi010JZ532309(AGG)4Carotenoid cleavage dioxygenase 13.00e − 95GGTTTGAGCTTCCAAATTGC236–24740.5200.6540.415236–2474
(carotenoid biosynthesis) GTTTCTTCCTGGGAAAGTCAACAGCAG
QGMi011JZ532312(CCGGCT)4Isopentenyl diphosphate isomerase 12.00e + 000CAACTTCCGAAAGCTAGAGGAG248–29060.5260.3460.487248–2773
(isoprenoid biosynthesis) GTTTCTTCGTGGCACTCATTACCACAC
QGMi012JZ532313(AAG)5UDP glucosyltransferase 4.00e − 77GGCTGAACTCAAAGGAACCA221–22420.2570.2960.221218–2243
(flavone biosynthesis) GTTTCTTATAAGCCCTCTGCCTTCCAT
QGMi013JZ532314(AAG)6Ethylene responsive element binding factor 41.00e − 19ATCACGGTTCGGAGAGGTC200–20630.4230.5190.375197–2063
(transcription factor; stress response) GTTTCTTGCAAAAACACGAGGACCAAT
QGMi014JZ532320(AAG)4Pectin methylesterase 39.00e − 78GCTTGCTTCGAGTTTTTGGT214–21520.0370.0370.036215–2162
(plant development; adventitious rooting) GTTTCTTCGAGGAATGATCTCCGTTGT
QGMi015JZ532315(AAC)7KNAT3 (knotted1like homeobox gene 3)5.00e − 45CAACCACACTTCACGGACAC236–24730.2340.2590.211236–2442
(plant development) GTTTCTTCATGTTTTCGCTGTTGCTGT
QGMi016JZ532316(ATCT)4Ultrapetala 1 6.00e − 52ACCAACGGCAACACCTACA257–26640.6660.6670.585251–2584
(plant development) GTTTCTTCGGCAAATCAAAGGAAAGAA
QGMi017JZ532298(CTT)6Jasmonate insensitive 15.00e − 35GGAGAGAGTGCAGTGTCATGG1101NDNDND1101
(RNA transcription factor; stress response) GTTTCTTATTGAAGGCGTTGTTGAAGC
QGMi018JZ532299(AATT)5MYB family transcription factor5.00e − 07GCTCTCTCTGTAACCTTCTTGTTT179–19530.4770.3330.375183–1912
(transcription factor) GTTTCTTAGTTGTGTCCGTTGTTGCTG
QGMi019JZ532300(GCT)4Elongated hypocotyl 5 4.00e + 00CATGAAAAGAGATGAGGGAAA2641NDNDND262-2642
(plant development) GTTTCTTCGGAGGCTCCAATGTAAAAC
QGMi020JZ532301(CT)7IAA-leucine resistant 32.00e − 51GCTCTGACGCGGAGATTC101–10740.6940.6670.630103–1072
(transcription factor) GTTTCTTGTTGTTTTCCTGGCTGCAAT
QGMi021JZ532305(ATC)4WRKY DNA-binding protein 159.00e − 26GCAAGAACCAAGGTGGTGTT2911NDNDND291–2942
(transcription factor) GTTTCTTCCGCTGAAGAAACCTGAGAC
QGMi022JZ532310(AAC)4MYB60 1.00e − 29CGTCTTCTCGAAGGATGGAT1571NDNDND154–1572
(transcription factor; stress response) GTTTCTTCCTCCTTGTTTCTCCTCTTTCA
QGMi023JZ532311(AAC)7Phytochrome-associated protein 24.00e − 09TCAATGCAAAGAAGCTCTGAAA133–14550.7340.9260.676139–1453
(plant development) GTTTCTTGCCTCAGCTCAGTCTCCTTG
QGMi024JZ532317(GATT)4MYB family transcription factor2.00e − 65CGCTTTCATCTGCTCAACTG245–24930.2370.1110.217246–2503
(transcription factor) GTTTCTTACACCGCCGCAGCTC
QGMi025JZ532318(AGC)4WRKY DNA-binding protein 339.00e − 06TAGGGAAGCACAACCACGAT300–30320.4650.3330.352298–3034
(defence response) GTTTCTTGTTCATCCTTGGCTCTCGAC
HE = expected heterozygosity; HO = observed heterozygosity; PIC = polymorphic information content; ND = Not Determined.
Table 4. Private alleles within the five Mangifera species analyzed.
LocusUnique Allele Size (bp)Mangifera species
QGMi001228Mangifera sp.
QGMi002245*, 252#, 268^M. caesia*; Mangifera sp.#; M. foetida^
QGMi004233^, 245*M. foetida^; M. caesia*
QGMi005324M. caesia
QGMi006241M. caesia
QGMi008179M. caesia
QGMi009212M. laurina
QGMi011258Mangifera sp.
QGMi012218M. caesia
QGMi013197M. caesia
QGMi016251M. caesia
QGMi019262M. caesia
QGMi020nilFailed to amplify in M. caesia
QGMi021294M. caesia
QGMi022154M. caesia
QGMi024nilFailed to amplify in M. caesia
QGMi025298M. foetida

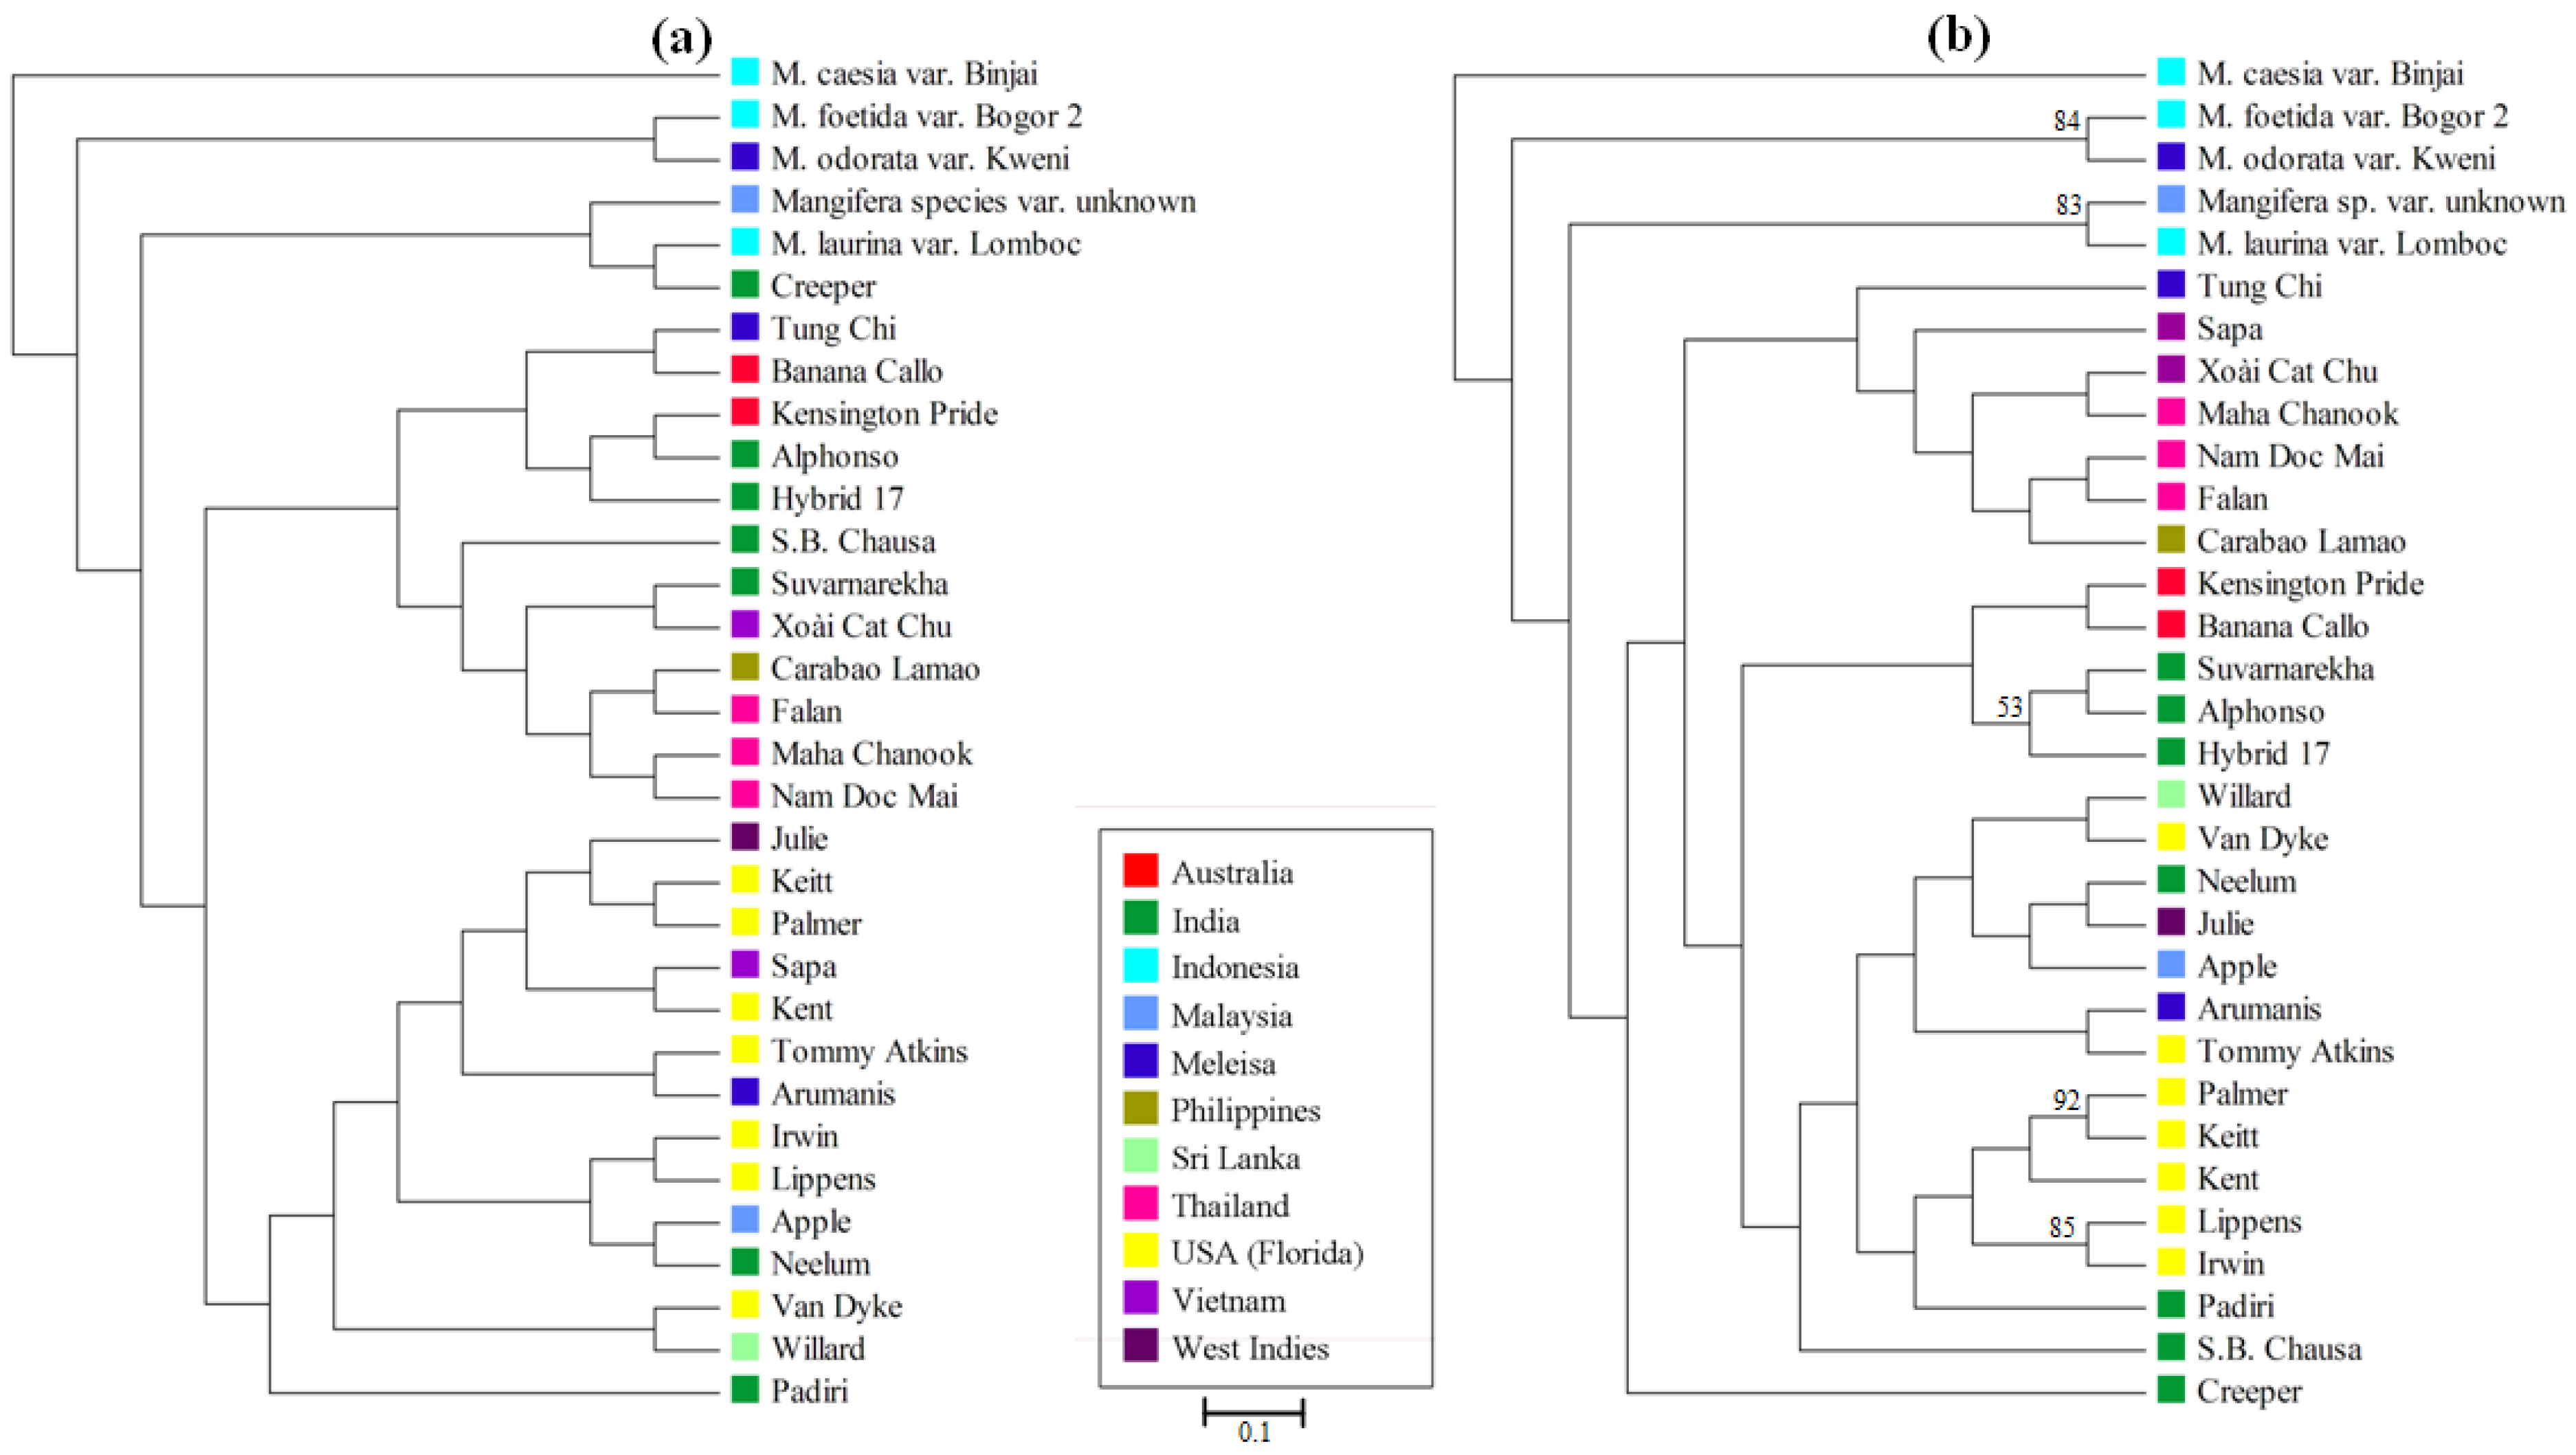
3.4. Mangifera Diversity Analysis

The SSR marker allele data from the 25 EST-SSR markers was used to generate a bootstrapped Cavalli-Sforza distance neighbor-joining dendrogram for the 32 M. indica and related Mangifera varieties (Figure 1a). Cluster analysis revealed that the 32 varieties showed a high level of genetic diversity.
Figure 1. Neighbor-joining dendrogram, rooted on the mid-point, using Cavalli-Sforza distance based on (a) 25 EST-SSR markers and (b) 25 EST-SSR plus 11 SSR markers. Scale bar indicates branch length. Bootstrap values greater than 50% are indicated.
Diversity 06 00072 g001
Pooling the information of these 25 EST-SSR markers with data from 11 SSR markers from a previous analysis [6] we were able to generate a bootstrapped Cavalli-Sforza distance neighbor-joining dendrogram for the 32 varieties with a total of 36 markers (Figure 1b). Even with the extra 11 markers, cluster analysis continues to show a high level of diversity among the Mangifera varieties. The rate of polymorphism between varieties is indicative of the genetic distance among wild germplasm and commercial mango varieties in this study.
The correlation of the phenotypic data with the overall Cavalli-Sforza distance for all EST-SSR was not evident for categorical background skin, blush and pulp colors of fruit (data not shown).

4. Discussion

High quality genetic analyses of crops such as mango require large numbers of informative polymorphic markers for genetic or comparative mapping and quantitative trait loci identification. Identification of markers that are tightly linked to target genes and monitoring their patterns of introgression for broadening the genetic base of mango varieties, are equally important. In mango, genetic analysis has been hampered due to the lack of sufficiently informative markers creating the need to discover high quality markers before useful genetic mapping can be undertaken. In other crops, EST-SSRs have increasingly become the marker of choice for these sorts of analyses. In comparison to other crop plants like rice (~15,200), A. thaliana (8,253), Brassica (5,923), and potato (4,820) [52], there were no publically available EST-SSR markers for mango identified prior to the commencement of this study.
The polymorphic EST-SSR markers developed in this study significantly increase the number of informative microsatellite markers available for genetic analysis of Mangifera species. These markers have been shown to be useful for determining the genetic relationships, exploring potential pedigrees and estimating the genetic background of cultivated accessions of M. indica.
A total of approximately 1,000 ESTs with SSR motifs were identified from over 24,000 EST sequences, a total of 4%. This number is within the predicted 2%–5% of plant-derived SSR-bearing ESTs [25]. The frequency range of monocots is between 1.5% to 4.7% [25], while a frequency range of 2.65% to 16.82% has been reported in 49 dicot species [53]. Frequency of EST-SSRs in various plant genomes is significantly influenced by the repeat length and the criteria used for mining the SSRs in the database [54].
In our study tri-nucleotide repeats were the predominant repeat motif present in all EST sequences identified, comprising 76% of all the EST-SSRs. These findings are in agreement with the situation in watermelon [20], safflower [22], and citrus [55], where tri-nucleotide repeats were also the most prevalent repeat motif detected. Tri-nucleotide repeats generally prevail in coding regions, which is usually attributed to selection against frame-shift mutations caused by length variation in non-trimetric repeats [56]. Di-nucleotide repeats are typically more frequent in untranslated regions, but occasionally occur in coding regions as well. The most frequent EST-SSR tri-nucleotide repeat motif identified was (AAG)n and di-nucleotide repeat motif (AG)n. This is similar to that of EST-SSRs found in coffee [54]. Differences in the repeat type abundance in various plant taxa can also be attributed to the differences in the SSR search criteria used for EST database mining in different studies.
The extent of cross transferability of EST-SSR markers determines their suitability in comparative genome mapping and phylogenetics. The EST-SSR markers showed a high level of polymorphism and high transferability across the five Mangifera species analyzed. The study also identified a number of private alleles within the Mangifera species. M. caesia showed the greatest EST-SSR loci polymorphism among analyzed Mangifera varieties with eleven markers showing private allele sizes within this species, while three EST-SSR loci (QGMi010, QGMi020, and QGMi024) repeatedly failed to generate a PCR product. Private alleles were also identified in M. foetida, M. laurina and the unidentified Mangifera species (Table 4).
The five Mangifera species analyzed in this study clustered together in both of the diversity dendrograms generated from the 25 EST-SSRs and the pooled 36 EST-SSR plus SSR markers. A strong relationship between M. foetida var. “Bogor 2” and M. odorata var. “Kweni”, supported by a bootstrap value of 83%, was seen with the diversity analysis using all 36 microsatellite markers. Ding Hou [57] suggested a hybrid origin for M. odorata, which was later verified as a cross between M. indica and M. foetida [58,59]. Based on phylogenetic relationships of the internal transcribed spacer (ITS) sequences of these species, M. odorata is more closely related to M. foetida than to M. indica [60]. However, more recently Hidayat et al. [61] placed M. odorata closer to M. indica than to M. foetida based on variation of the chloroplast matK sequences.
A strong link between “Lippens” and “Irwin” (85%) in this study indicates the close relationship between these two Florida accessions. Parentage analysis has identified “Lippens” as the maternal parent of “Irwin” [62]. “Haden” is also identified as the paternal parent of “Irwin” and the maternal parent of “Lippens” [63]. While the parents of “Palmer” are unknown, the strong link between Palmer and “Keitt” (92%) suggest a common ancestry for these two accessions. The genetic similarity of the Florida accessions arises from their common heritage that can be traced back to as few as four Indian accessions and the “Terpentine” land race [63]. A close relationship between the Indian accession “Hybrid 17” and “Alphonso” again indicates a common heritage. “Hybrid 17” is a seedling of the maternal parent “Alphonso” (pers. comm. C.P.A. Iyer).

5. Conclusions

In conclusion the results of this study demonstrate that genotyping Mangifera accessions with microsatellite markers can quickly reveal the genetic diversity among accessions. Understanding the diversity and relatedness of accessions can assist breeders to better select parents with the potential to contribute desired genes to progeny and for developing new commercial cultivars. Genetic diversity within a breeding program is highly desirable to enable new cultivars to be produced with novel productivity and fruit quality traits necessary for sustainable productivity and market competitiveness. The development of a comprehensive mango SSR catalogue facilitates characterization of potential genetic markers in the progeny of polymorphic cultivars, and is essential in an important crop species such as mango that is virtually devoid of linkage associations.

Acknowledgments

We acknowledge funding for this work as part of the Mango Fruit Genomics Initiative supported by Agri-Science Queensland, a division of the former Department of Employment, Economic Development and Innovation (DEEDI) and Horticulture Australia Limited (HAL) project MG09003 “Mango Breeding Support”. We acknowledge the assistance of Cheryldene Maddox with the maintenance of the mango genepool collection at SRS and phenotypic data collection.
© State of Queensland, Department of Agriculture, Fisheries and Forestry, 2013.
The Queensland Government supports and encourages the dissemination and exchange of its information. The copyright in this publication is licensed under a Creative Commons Attribution 3.0 Australia (CC BY) licence.
Diversity 06 00072 i001
Under this licence you are free, without having to seek our permission, to use this publication in accordance with the licence terms. You must keep intact the copyright notice and attribute the State of Queensland as the source of the publication. For more information on this licence, visit http://creativecommons.org/licenses/by/3.0/au/deed.en

Conflicts of Interest

The authors declare no conflict of interest.

References

  1. Kostermans, A.J.G.H.; Bompard, J.M. The Mangoes, Their Botany, Nomenclature, Horticulture and Utilisation; Academic Press: London, UK, 1993. [Google Scholar]
  2. FAOSTAT. Available online: http://faostat.fao.org/ (accessed on 15 November 2013).
  3. Stephens, S.E. Mango Varieties in Tropical Queensland; vol. 732, Queensland Department of Agriculture and Stock: Brisbane, Australia, 1963; pp. 1–4. [Google Scholar]
  4. Beal, P.R. New mango varieties. Qld. Agric. J. 1976, 120, 583–588. [Google Scholar]
  5. Catchpoole, D.; Bally, I.S.E. Search for Queensland’s top mango. Mango Care Newslett. 1990, 1, 6. [Google Scholar]
  6. Dillon, N.L.; Bally, I.S.E.; Wright, C.L.; Hucks, L.; Innes, D.J.; Dietzgen, R.G. Genetic diversity of the Australian National Mango Genebank. Scientia Hort. 2013, 150, 213–226. [Google Scholar] [CrossRef]
  7. Bally, I.S.E.; Lu, P.; Johnson, P.; Muller, W.J.; González, A. Past, Current and Future Approaches to Mango Genetic Improvement in Australia. In Proceedings of the 8th International Mango Symposium, Sun City, South Africa, 6–10 February 2006.
  8. Bally, I.S.E. Delta R2E2. New Mango for the Dry Tropics. HortNews, 31 October 1991; 12. [Google Scholar]
  9. Whiley, A.W. New Mango Variety Released. Mango Care Newslett. 2000, 29, 1. [Google Scholar]
  10. Holmes, R. Update on new mango varieties. Mango Care Newslett. 2002, 35, 10–11. [Google Scholar]
  11. Bally, I.S.E. New hybrids highlighted from National Mango Breeding Program. Mango Matters 2008, Summer, 8–14. [Google Scholar]
  12. Kashkush, K.; Jinggui, F.; Tomer, E.; Hillel, J.; Lavi, U. Cultivar identification and genetic map of mango (Mangifera indica). Euphytica 2001, 122, 129–136. [Google Scholar] [CrossRef]
  13. Chunwongse, J.; Phumichai, C.; Barbrasert, C.; Chunwongse, C.; Sukonsawan, S.; Boonreungrawd, R. Molecular mapping of mango cultivars “Alphonso” and “Palmar”. Acta Hortic. 2000, 509, 193–206. [Google Scholar]
  14. Gepts, P. Genetic markers and core collections. In Core Collections of Plant Genetic Resources; Hodgkin, T., Brown, A.H.D., van Hintum, T.J.L., Morales, E.A.V., Eds.; International Plant Genetic Institute (IPGRI)-John Wiley & Son: Chichester, UK, 1995; pp. 127–146. [Google Scholar]
  15. Duval, M.F.; Bunel, J.; Sitbon, C.; Risterucci, A.M.; Calabre, C.; Le Bellec, F. Genetic diversity of Caribbean mangoes (Mangifera indica L.) using microsatellite markers. Acta Hortic. 2006, 802, 183–188. [Google Scholar]
  16. Schnell, R.J.; Brown, J.S.; Olano, C.T.; Meerow, A.W.; Campbell, R.J.; Kuhn, D.N. Mango genetic diversity analysis and pedigree inferences for Florida cultivars using microsatellite markers. J. Am. Soc. Hortic. Sci. 2006, 131, 214–224. [Google Scholar]
  17. Ellis, J.R.; Burke, J.M. EST-SSRs as a resource for population genetic analyses. Heredity 2007, 99, 125–132. [Google Scholar] [CrossRef]
  18. Wöhrmann, T.; Weising, K. In silico mining for simple sequence repeat loci in pineapple expressed sequence tag database and cross-species amplification of EST-SSR markers across Bromeliaceae. Theor. Appl. Genet. 2011, 123, 635–647. [Google Scholar] [CrossRef]
  19. Huang, H.; Lu, J.; Ren, Z.; Hunter, W.; Dowd, S.E.; Dang, P. Minining and vaildating grape (Vitis. L.) ESTs to develop EST-SSR markers for genotyping and mapping. Mol. Breed. 2011, 28, 241–252. [Google Scholar]
  20. Hwang, J.H.; Ahn, S.G.; Oh, J.Y.; Choi, Y.W.; Kang, J.S.; Park, Y.H. Functional characterization of watermelon (Citrullus lanatus L.) EST-SSR by gel electrophoresis and high resolution melting analysis. Scientia Hort. 2011, 130, 715–724. [Google Scholar] [CrossRef]
  21. Pashley, C.H.; Ellis, J.R.; McCauley, D.E.; Burke, J.M. EST databases as a source for molecular markers: Lessons from Helianthus. J. Hered. 2006, 97, 381–388. [Google Scholar] [CrossRef]
  22. Chapman, M.A.; Hvala, J.; Strever, J.; Matvienko, M.; Kozik, A.; Michelmore, R.W.; Tang, S.; Knapp, S.J.; Burke, J.M. Development, polymorphism, and cross-taxon utility of EST-SSR markers from safflower (Carthamus tinctorius L.). Theor. Appl. Genet. 2009, 120, 85–91. [Google Scholar] [CrossRef]
  23. Varshney, R.K.; Graner, A.; Sorrells, M.E. Genic microsatellite markers in plants: Features and applications. Trends Biotechnol. 2005, 23, 48–55. [Google Scholar] [CrossRef]
  24. Chabane, K.; Ablett, G.; Cordeiro, G.; Valkoun, J.; Henry, R. EST versus genomic derived microsatellite markers for genotyping wild and cultivated barley. Genet. Res. Crop. Evol. 2005, 52, 903–909. [Google Scholar] [CrossRef]
  25. Kantety, R.V.; La Rota, M.; Matthews, D.E.; Sorrells, M.E. Data mining for simple sequence repeats in expressed sequence tags from barley, maize, rice, sorghum and wheat. Plant Mol. Biol. 2002, 48, 501–510. [Google Scholar] [CrossRef]
  26. Bandopadhyay, R.; Sharma, S.; Rustgi, S.; Singh, R.; Kumar, A.; Balyan, H.S.; Gupta, P.K. DNA polymorphism among 18 species of Triticum–Aegilops complex using wheat EST-SSRs. Plant Sci. 2004, 166, 349–356. [Google Scholar] [CrossRef]
  27. Fraser, L.G.; Harvey, C.F.; Crowhurst, R.N.; de Silva, H.N. EST-derived microsatellites from Actinidia species and their potential for mapping. Theor. Appl. Genet. 2004, 108, 1010–1016. [Google Scholar] [CrossRef]
  28. Depeiges, A.; Goubely, C.; Lenoir, A.; Cocherel, S.; Picard, G.; Raynal, M.; Grellet, F.; Delseny, M. Identification of the most represented repeated motifs in Arabidopsis thaliana microsatellite loci. Theor. Appl. Genet. 1995, 91, 160–168. [Google Scholar]
  29. Cordeiro, G.M.; Casu, R.; Mcintyre, C.L.; Manners, J.M.; Henry, R.J. Microsatellite markers from sugarcane Saccharum spp. ESTs cross transferable to Erianthus and sorghum. Plant Sci. 2001, 160, 1115–1123. [Google Scholar] [CrossRef]
  30. Lima, L.S.; Gramacho, K.P.; Gesteira, A.S.; Lopes, U.V.; Gaiotto, F.A.; Zaidan, H.A.; Pires, J.L.; Cascardo, J.C.M.; Micheli, F. Characterization of microsatellites from cacao-Moniliophthora perniciosa interaction expressed sequence tags. Mol. Breed. 2008, 22, 315–318. [Google Scholar] [CrossRef]
  31. De Keyser, E.; de Rick, J.; van Bockstaele, E. Discovery of species-wide EST-derived markers in Rhododendron by intron-flanking primer design. Mol. Breed. 2009, 23, 171–178. [Google Scholar] [CrossRef]
  32. Dietzgen, R.G.; Bally, I.S.E.; Devitt, L.C.; Dillon, N.L.; Fanning, K.; Gidley, M.; Holton, T.A.; Innes, D.J.; Karan, M.; Sheik-Jabbari, J.; et al. Mango Genetics Underpin Efficient Breeding for Variety Improvement. In Proceedings of the Seventh Australian Mango Conference, Cairns, Australia, 25–28 May 2009; pp. 10–12.
  33. Hunter, R.S. Minutes of the thirty-first meeting of the board of directors of the optical society of America, incorporated. J. Optical Soc. Amer. 1948, 38, 651. [Google Scholar]
  34. Ewing, B.; Green, P. Basecalling of automated sequencer traces using phred. II. Error probabilities. Genome Res. 1998, 8, 186–194. [Google Scholar]
  35. Ewing, B.; Hillier, L.; Wendl, M.; Green, P. Base-calling of automated sequencer traces using phred. I. Accuracy assessment. Genome Res. 1998, 8, 175–185. [Google Scholar] [CrossRef]
  36. Staden, R.; Beal, K.F.; Bonfield, J.K. The Staden package, 1998. Methods Mol. Biol. 2000, 132, 115–130. [Google Scholar]
  37. Huang, X.; Madan, A. CAP3: A DNA sequence assembly program. Genome Res. 1999, 9, 868–877. [Google Scholar] [CrossRef]
  38. Swarbreck, D.; Wilks, C.; Lamesch, P.; Berardini, T.Z.; Garcia-Hernandez, M.; Foerster, H.; Li, D.; Meyer, T.; Muller, R.; Ploetz, L.; et al. The Arabidopsis Information Resource (TAIR): Gene structure and function annotation. Nucleic Acids Res. 2008, 36, D1009–D1014. [Google Scholar]
  39. Altschul, S.F.; Madden, T.L.; Schäffer, A.A.; Zhang, J.; Zhang, Z.; Miller, W.; Lipman, D.J. Gapped BLAST and PSI_BLAST: A new generation of protein database programs. Nucleic Acids Res. 1997, 25, 22893402. [Google Scholar]
  40. Rozen, S.; Skaletsky, H. Primer3 on the WWW for general users and for biologist programmers. In Bioinformatics Methods and Protocols in the series Methods in Molecular Biology; Krawetz, S., Misener, S., Eds.; Humana Press: Totowa, NJ, USA, 2000; pp. 365–386. [Google Scholar]
  41. Cavalli-Sforza, L.L.; Edwards, A.W.F. Phylogenetic analysis: Models and estimation procedures. Am. J. Human Genet. 1967, 19, 233–257. [Google Scholar]
  42. Reynolds, J.; Weir, B.; Cockerham, C.C. Estimation of the coancestry coefficient: Basis for a short term genetic distance. Genetics 1983, 105, 767–779. [Google Scholar]
  43. Nei, M. Genetic distance between populations. Am. Nat. 1972, 106, 283–292. [Google Scholar]
  44. Nei, M.; Tajima, F.; Tateno, Y. Accuracy of estimated phylogenetic trees from molecular data. J. Mol. Evol. 1983, 19, 153–170. [Google Scholar] [CrossRef]
  45. Chapuis, M.P.; Estoup, A. Microsatellite null alleles and estimation of population differentiation. Mol. Biol. Evol. 2007, 24, 621–623. [Google Scholar] [CrossRef]
  46. Felsenstein, J. Phylogenies from gene frequencies: A statistical problem. Sys. Zool. 1985, 34, 300–311. [Google Scholar] [CrossRef]
  47. Saitou, N.; Nei, M. The neighbour-joining method: A new method for reconstructing phylogenetic trees. Mol. Biol. Evol. 1987, 4, 406–425. [Google Scholar]
  48. Liu, K.; Muse, S.V. PowerMarker: Integrated analysis environment for genetic marker data. Bioinformatics 2005, 21, 2128–2129. [Google Scholar] [CrossRef]
  49. Kalinowski, S.T.; Taper, M.L.; Marshall, T.C. Revising how the computer program CERVUS accommodates genotyping error increases success in paternity assignment. Mol. Ecol. 2007, 16, 1099–1106. [Google Scholar] [CrossRef]
  50. Liu, B.H. Statistical Genomics. LINKAGE, Mapping and QTL Analysis; CRC Press: Boca Raton, FL, USA, 1998. [Google Scholar]
  51. Mantel, N. The detection of disease clustering and a generalized regression approach. Cancer Res. 1967, 27, 209–220. [Google Scholar]
  52. Polymorphic SSRs Mining for EST Data. Available online: http://www.bioinformatics.nl/tools/polyssr/ (accessed on 22 November 2013).
  53. Kumpatla, S.P.; Mukhopadhyay, S. Mining and survey of simple sequence repeats in expressed sequence tags of dicotyledonous species. Genome 2005, 48, 985–998. [Google Scholar] [CrossRef]
  54. Poncet, V.; Rondeau, M.; Tranchant, C.; Cayrel, A.; Hamon, S.; de Kochko, A.; Hamon, P. SSR mining in coffee tree EST databases: Potential use of EST-SSRs as markers for the Coffea genus. Mol. Gen. Genomics 2006, 276, 436–449. [Google Scholar] [CrossRef]
  55. Chen, C.; Zhou, P.; Choi, Y.A.; Huang, S.; Gmitter, F.G., Jr. Mining and characterizing microsatellites from citrus ESTs. Theor. Appl. Genet. 2006, 112, 1248–1257. [Google Scholar] [CrossRef]
  56. Metzgar, D.; Bytof, J.; Wills, C. Selection against frameshift mutations limits microsatellite expansion in coding DNA. Genome Res. 2000, 10, 72–80. [Google Scholar]
  57. Hou, D. Anacardiaceae, 4. Mangifera. In Flora Malesiana; Series I; vol. 8, van Steenis, C.G.G.J., Ed.; Rijksherbarium: Leiden, The Netherlands, 1978; pp. 395–440. [Google Scholar]
  58. Teo, L.L.; Kiew, R.; Set, O.; Lee, S.K.; Gan, Y.Y. Hybrid status of kuwini, Mangifera odorata (Anacardiaceae) verified by amplified fragment polymorphism. Mol. Ecol. 2002, 11, 1465–1469. [Google Scholar] [CrossRef]
  59. Kiew, R.; Teo, L.L.; Gan, Y.Y. Assessment of the hybrid status of some Malesian plants using Amplified Fragment Length Polymorphism. Telopea 2003, 10, 225–233. [Google Scholar]
  60. Yonemori, K.; Honsho, C.; Kanzaki, S.; Eiadthong, W.; Sugiura, A. Phylogenetic relationships of Mangifera species revealed by ITS sequences of nuclear ribosomal DNA and a possibility of their hybrid origin. Plant Syst. Evol. 2002, 231, 59–75. [Google Scholar] [CrossRef]
  61. Hidayat, T.; Pancoro, A.; Kusumawaty, D.; Eiadthong, W. Molecular diversification and phylogeny of Mangifera (Anacardiaceae) in Indonesia and Thailand. Int. J. Adv. Sci. Eng. Inf. Technol. 2011, 1, 88–91. [Google Scholar]
  62. Campbell, R.J. A Guide to Mangos in Florida, 1st ed.; Fairchild Tropical Garden: Miami, FL, USA, 1992. [Google Scholar]
  63. Olano, C.T.; Schnell, R.J.; Quintanilla, W.E.; Campbell, R.J. Pedigree analysis of Florida mango cultivars. Proc. Fla. State Hort. Soc. 2005, 118, 192–197. [Google Scholar]

