Article

Assessment of Genetic Diversity in Faba Bean Based on Single Nucleotide Polymorphism

1
Department of Environment and Primary Industries, Biosciences Research Division, AgriBio, Centre for AgriBioscience, 5 Ring Road, La Trobe University, Bundoora, Victoria 3083, Australia
2
La Trobe University, Bundoora, Victoria 3086, Australia
3
School of Agriculture, Food and Wine, The University of Adelaide, Waite Campus, Glen Osmond, SA 5064, Australia
*
Author to whom correspondence should be addressed.
Diversity 2014, 6(1), 88-101; https://doi.org/10.3390/d6010088
Submission received: 26 November 2013 / Revised: 16 January 2014 / Accepted: 17 January 2014 / Published: 24 January 2014
(This article belongs to the Special Issue Use of Molecular Markers in Genetic Diversity Research)

Abstract

:
Detection of genetic diversity is important for characterisation of crop plant collections in order to detect the presence of valuable trait variation for use in breeding programs. A collection of faba bean (Vicia faba L.) genotypes was evaluated for intra- and inter-population diversity using a set of 768 genome-wide distributed single nucleotide polymorphism (SNP) markers, of which 657 obtained successful amplification and detected polymorphisms. Gene diversity and polymorphism information content (PIC) values varied between 0.022–0.500 and 0.023–1.00, with averages of 0.363 and 0.287, respectively. The genetic structure of the germplasm collection was analysed and a neighbour-joining (NJ) dendrogram was constructed. The faba bean accessions grouped into two major groups, with several additional smaller sub-groups, predominantly on the basis of geographical origin. These results were further supported by principal co-ordinate analysis (PCoA), deriving two major groupings which were differentiated on the basis of site of origin and pedigree relationships. In general, high levels of heterozygosity were observed, presumably due to the partially allogamous nature of the species. The results will facilitate targeted crossing strategies in future faba bean breeding programs in order to achieve genetic gain.

1. Introduction

Faba bean (Vicia faba L.) is a major grain legume crop, grown for high seed protein content (approximately 25%–30%) and superior biomass, ranking as the fourth most internationally important cool-season legume after peas, chickpeas and lentils [1]. Although the exact origin is unknown, it is generally accepted that faba bean was one of the earliest food legumes to be domesticated, and has probably been cultivated since the Neolithic period [2]. Both botanical and molecular genetic data suggest that the wild progenitor of contemporary faba bean is yet to be discovered, or has become extinct [3]. As for other legume crops, faba bean plays a critical role in crop rotations and effective nitrogen fixation for the purpose of soil improvement [4]. Faba bean (Vicia faba L.) is a diploid (2n = 2x = 12), partially allogamous plant species [5], with a very large nuclear genome (c. 13 Gbp diploid [6,7]). Large genomes pose substantial challenges to effective development and implementation of molecular genetic markers for genomics-assisted breeding.
More than 43,500 faba bean accessions are conserved within 37 global collections [1,8]. The largest collection of faba bean accessions (>9,000 accessions) is located at the International Center for Agricultural Research in the Dry Areas (ICARDA) in Syria, followed by the Chinese Academy of Agricultural Sciences (CAAS) in China (>5,200 accessions). Faba bean has long attracted the interests of numerous taxonomists and evolutionists due to many unknown evolutionary aspects [9]. The species is divided into distinct groups based on seed size, ranging from small-seeded minor beans (0.2–0.8 g per seed) to medium-seeded equina beans and the large-seeded major beans (greater than approximately 1.0 g and up to 2.6 g per seed), that have become known as distinct botanical groups [10].
The key factor for successful crop improvement is a continued supply of genetic diversity in breeding programs, including new or improved variability for target traits. Plant genetic resources have always played a major role in providing sources of resistance to biotic and abiotic stresses, and it is therefore critical to manage, conserve and evaluate such materials. Although management and utilisation of large-scale diversity in collections provide major challenges to germplasm curators and crop breeders, it is equally important to characterise and understand genetic diversity among plant resources for effective use in breeding programs [11].
Molecular genetic markers represent a powerful tool for characterisation of germplasm collections. Different types of marker systems have been used to characterise genetic diversity in various crop species, including faba bean. Genetic diversity among 28 inbred lines (European and Mediterranean lines) was assessed using random amplified polymorphic DNA (RAPD) markers [9], identifying three major clusters comprised of European large-seeded, European small-seeded and Mediterranean germplasm. Amplified fragment length polymorphism (AFLP) analysis was used to determine genetic diversity among inbred lines derived from elite cultivars in some earlier studies [10,12], while in another study the authors used target region amplification polymorphism (TRAP) markers to assess genetic diversity and relationships between faba bean germplasm entries [13]. Mediterranean landraces that were highly diverse for morpho-agronomic traits were analysed using inter-simple sequence repeat (ISSR) markers, revealing substantial diversity. ISSR markers were also used to assess genetic diversity and relationships within globally distributed faba bean germplasm [14]. The authors concluded that accessions from North China showed the highest genetic diversity, while accessions from central China displayed a low level of diversity, and accessions from Europe were genetically closer to those from North Africa. Recently, large numbers of simple sequence repeat (SSR) markers have been identified and characterized from faba bean [15,16,17], and those derived from expressed sequence tags (ESTs) were used to understand the genetic relationships between 32 genotypes, permitting definition of four distinct clusters based on geographical origins [17].
Until recently, SSRs have been considered as the marker system of choice for the majority of applications. However, recent advances in sequencing and genotyping technologies now permit generation of large sets of single nucleotide polymorphism (SNP) markers from relatively understudied crop species such as faba bean at an acceptable level of cost. As a consequence, SNPs have become more widely used due to high abundance and capacity to be multiplex-formatted for high-throughput genotyping. In addition, SNP discovery from transcribed regions of the genome provides the basis to establish a direct link between sequence polymorphism and putative functional variation.
In the present study, a selection was made of 45 faba bean lines from North Africa, China, Ecuador, Europe and Australia that represent Australian cultivars, as well as the major parents of the Australian faba bean breeding program. Multiple genotypes from each of the faba bean lines were genotyped with EST-derived SNP markers to assess genetic diversity, which was then related to geographical location of origin and pedigree structure, providing a support for design of future breeding populations.

2. Experimental Section

2.1. Plant Material and DNA Extraction

A total of 45 accessions of faba bean (Vicia faba L.) that originated from different geographical locations and represented major Australian cultivars and donors of major traits of interest to the breeding program, were obtained from the Pulse Breeding Australia faba bean breeding program, University of Adelaide, New South Wales Department of Primary Industries and University of Sydney, Australia (Table 1). Two seeds from each accession were sown into potting mix and young leaf tissue was harvested from each plant and stored immediately in 96-well microtube plate. Total genomic DNA was isolated after grinding with the MM 300 Mixer Mill system (Retsch, Germany). DNA extraction was performed using the DNeasy 96 plant mini kit (QIAGEN, Hilden, Germany). DNA was suspended in 1 × TE buffer and further diluted to approximately 50 ng/μL prior to SNP genotyping.

2.2. SNP Genotyping

A sub-set of 768 SNPs was selected on the basis of informative data from previous SNP discovery and genetic linkage mapping experiments [18]. All of these SNPs met the criteria of possessing sufficient sequence information both 5’ and 3’ to the target locus, and absence of other known sequence variants in their vicinity. The designability score calculated for each SNP locus by Illumina Inc. (San Diego, CA, USA) was higher than 0.6, predicting high assay conversion rates. A total of 250 ng of genomic DNA from each plant genotype was used for amplification, after which PCR products were hybridised to bead chips via the address sequence for detection on an Illumina iSCAN Reader. On the basis of obtained fluorescence, data for allele calls were viewed graphically as a scatter plot for each marker assay using GenomeStudio software v2011.1 with a GeneCall threshold of 0.20.
Table 1. Details of breeding history, major characteristic traits and origin of the cultivars and germplasm evaluated in the diversity study. The countries listed in the origin of the source germplasm are listed in decreasing order of contribution to the pedigree of the test genotype. The origin of source germplasm reflects the original source, when known, rather than the location of the donor.
GenotypeBreeding HistorySeed Size (g/100 sd)Major TraitOrigin of Source Germplasm
Cultivars
AquadulceIntroduced variety, reselected in Aust130Broad beanSpain
AscotSeln ex Fiord 45Asco resGreece
CairoSeln ex open pollinated ILB 228265AdaptationCyprus
DozaAcc 157 × STW50Rust resEngland, Sudan
FarahSeln ex Fiesta65Asco resSpain
FiestaSeln ex BPL 1196 B881765AdaptationSpain
FiordSeln ex landrace45AdaptationGreece
IcarusSeln ex BPL 71080Choc spot resEcuador
ManafestSeln ex ILB 302680Choc spot resEcuador
NuraIcarus × Ascot60Asco resEcuador, Greece
PBA KareemaSeln ex Aquadulce 140Broad beanSpain
PBA RanaManafest × (Acc 611 × Manafest) (breeding line AF01006-1)75Asco resEcuador, Lebanon
PBA WardaSP99046 × SP9908160Rust resEcuador, Greece, Ethiopia
DivineEuropean variety, not cultivated in Australia50Low v/cvEurope
Australian Breeding Lines
1269*483/6-1BPL 710 × Farah70Cerco resEcuador, Spain
AF03063-1(Icarus × Acc286) × Farah70Asco resSpain, Ecuador, Greece
AF04053(Acc 735 × Acc 683) × Farah65Asco resSpain, Syria, Ecuador, Turkey
AF05069(Acc 611 × Acc 722) x ((Icarus × Ascot) × Farah)70Asco resLebanon, UK, Spain, Ecuador, Greece
AF05095Acc 920 × Farah80Asco resMorocco, Spain
IX220d/2-5IX38 × IX465BLRV resChina, Sudan, Italy
Germplasm Accessions
Acc 278Seln ex BPL 11275Asco resUK
Acc 286Seln ex landrace110Early floweringCrete
Acc 391#5188Seln ex ILB 14255Rust resMorocco
Germplasm Accessions
Acc 611Seln ex BPL 47280Asco resLebanon
Acc 624#8103Seln ex ILB 39745Rust resTunisia
Acc 683ILB 938 × BPL 1390100Choc spot Ecuador, Turkey
Acc 737Seln ex ILB 3033 B 88176120Choc spot Ecuador
Acc 805#4912Seln ex ILB 44535BLRV resYemen
Acc 868ILB 68 × Fiord65Zero tanninUK, Greece
Acc 920/3Seln ex landrace90Asco resMorocco
Acc 970Seln ex ILB 752100Asco resSweden (Donor)
Acc 973Seln ex ILB 302555Rust resEcuador
Acc 1107/2Seln ex ILB 2582100Cerco resMorocco
Acc 1108/1Seln ex ILB 258380Cerco resMorocco
Acc 1129/2Seln ex ILB 336290Salt tolChina (Zhejiang)
Acc 1206#4919Seln ex ILB 5220110BLRV resChina (Yunnan)
Acc 1248/4Seln ex ILB 533390Choc spot resEcuador
Acc 1257-3Seln ex ILB 535380Choc spot resEcuador
Acc 1322/2L 82003 B8833 (BPL 472 × BPL 261)75Cerco resLebanon, Greece
Acc 1430/3Seln ex BPL 217150Asco resMorocco
Acc 1477/4Seln ex landrace70Asco resCrete
Acc 1487/7Seln ex ILB 91770Salt tolAlgeria
Acc 1604#6108Seln ex BPL 524770BYMV resAfghanistan
Acc 1714/1Seln ex ILB 5561140Choc spot resChina (Gansu)
Acc 1727Seln ex landrace100Early floweringChina (Guangxi)
Acc: Accession number in The University of Adelaide faba bean collection; ILB (International Legume Bean) and BPL (Bean Pure Line): Accession number in International Center for Agricultural Research in the Dry Areas (ICARDA) collections; Seed size: approximate weight per 100 seeds when grown in field plots southern Australia; Adaptation: good adaptation in specific regions of Australia; Asco res: Ascochyta blight resistant; Choc spot res: Chocolate spot resistant; Cero res: Cercospora leaf spot resistant; BLRV res: Bean leaf roll virus resistant; BYMV res: Bean Yellow Mosaic Virus resistant; Salt tol: Salt tolerant; Low v/cv: Low vicine/convicine.

2.3. Genetic Diversity and Population Structure Analysis

SNP scoring data was analysed using the NTSYSpc 2.1 package [19]. Basic statistics were calculated using the genetic analysis package PowerMarker (ver. 3.23; [20]) for diversity measurements at each locus, including the total number of alleles (NA), allele frequency, major allele frequency (MAF) (allele with the highest frequency), accession-specific alleles, gene diversity (GD), and polymorphism information content (PIC). Genetic distance between each pair of accessions was calculated using the equation from Nei [21]. Based on genetic similarity, a dendrogram was constructed by application of the unweighted pair group method with arithmetic average (UPGMA) cluster analysis using DARwin v5 [22].
Genetic structure of the germplasm collection was first analysed by performing principal component analysis (PCoA) implemented in the GenAlex 6.41 package [23], based on standardised covariance of genetic distance calculated for codominant markers.

3. Results and Discussion

3.1. SNP Polymorphism

A sub-set of 768 genome-wide distributed SNPs was used to assess genetic diversity both within and between faba bean accessions. Two individual plants from each accession were genotyped in order to assess levels of intra-population genetic diversity. Of the total, 657 SNPs (85.4%) obtained successful amplification and detected polymorphisms, while the remaining 112 assays either failed or produced inconsistent results. Only a small percentage (~ 3%) of the marker data was missing for any individual accession. These results are comparable to a similar study of diversity analysis in faba bean based on use of 80 SNP markers, of which 67 (83.5%) obtained successful amplification [24]. However, similar SNP-based studies of germplasm characterisation in other crop species obtained comparable results for amplification efficiency (91% in grape [25]; 74% in winter wheat [26]).
In order to define both intra- and inter-population diversity, SNP polymorphism was measured in terms of the gene diversity and PIC value, values ranging from 0.022 (SNP_50000835) to 0.500 (SNP_50001459) and from 0.023 (SNP_50000835) to 1.000 (SNP_50001459), with averages of 0.363 and 0.287, respectively. Major allele frequencies ranged up to 0.989 (SNP_50000835) with an average of 0.716. A total of 15% of the SNP markers exhibited MAFs greater than 0.900. The highest level of heterozygosity (0.989) was detected at SNP_50000841 and SNP_50000709 followed by SNP_50002454, SNP_50002393, SNP_50001315, SNP_50000803, SNP_50000804, SNP_50000805, SNP_50000270, SNP_50000396, SNP_50000114 and SNP_50000129 (0.978). Despite the high levels of heterozygosity obtained for some of the SNPs, these markers were found to be highly informative in the current study, as well as to segregate in an associated linkage mapping study [18]. Heterozygosity was lowest at locus SNP_50000835 (0.023), followed by SNP_5000029 (0.025) and SNP 50000669 and SNP_50002436 (0.033) (Supplementary 1). A high level of heterozygosity was observed within faba bean accession in most of cases, as predicted by the partially allogamous nature of the species [27,28,29].

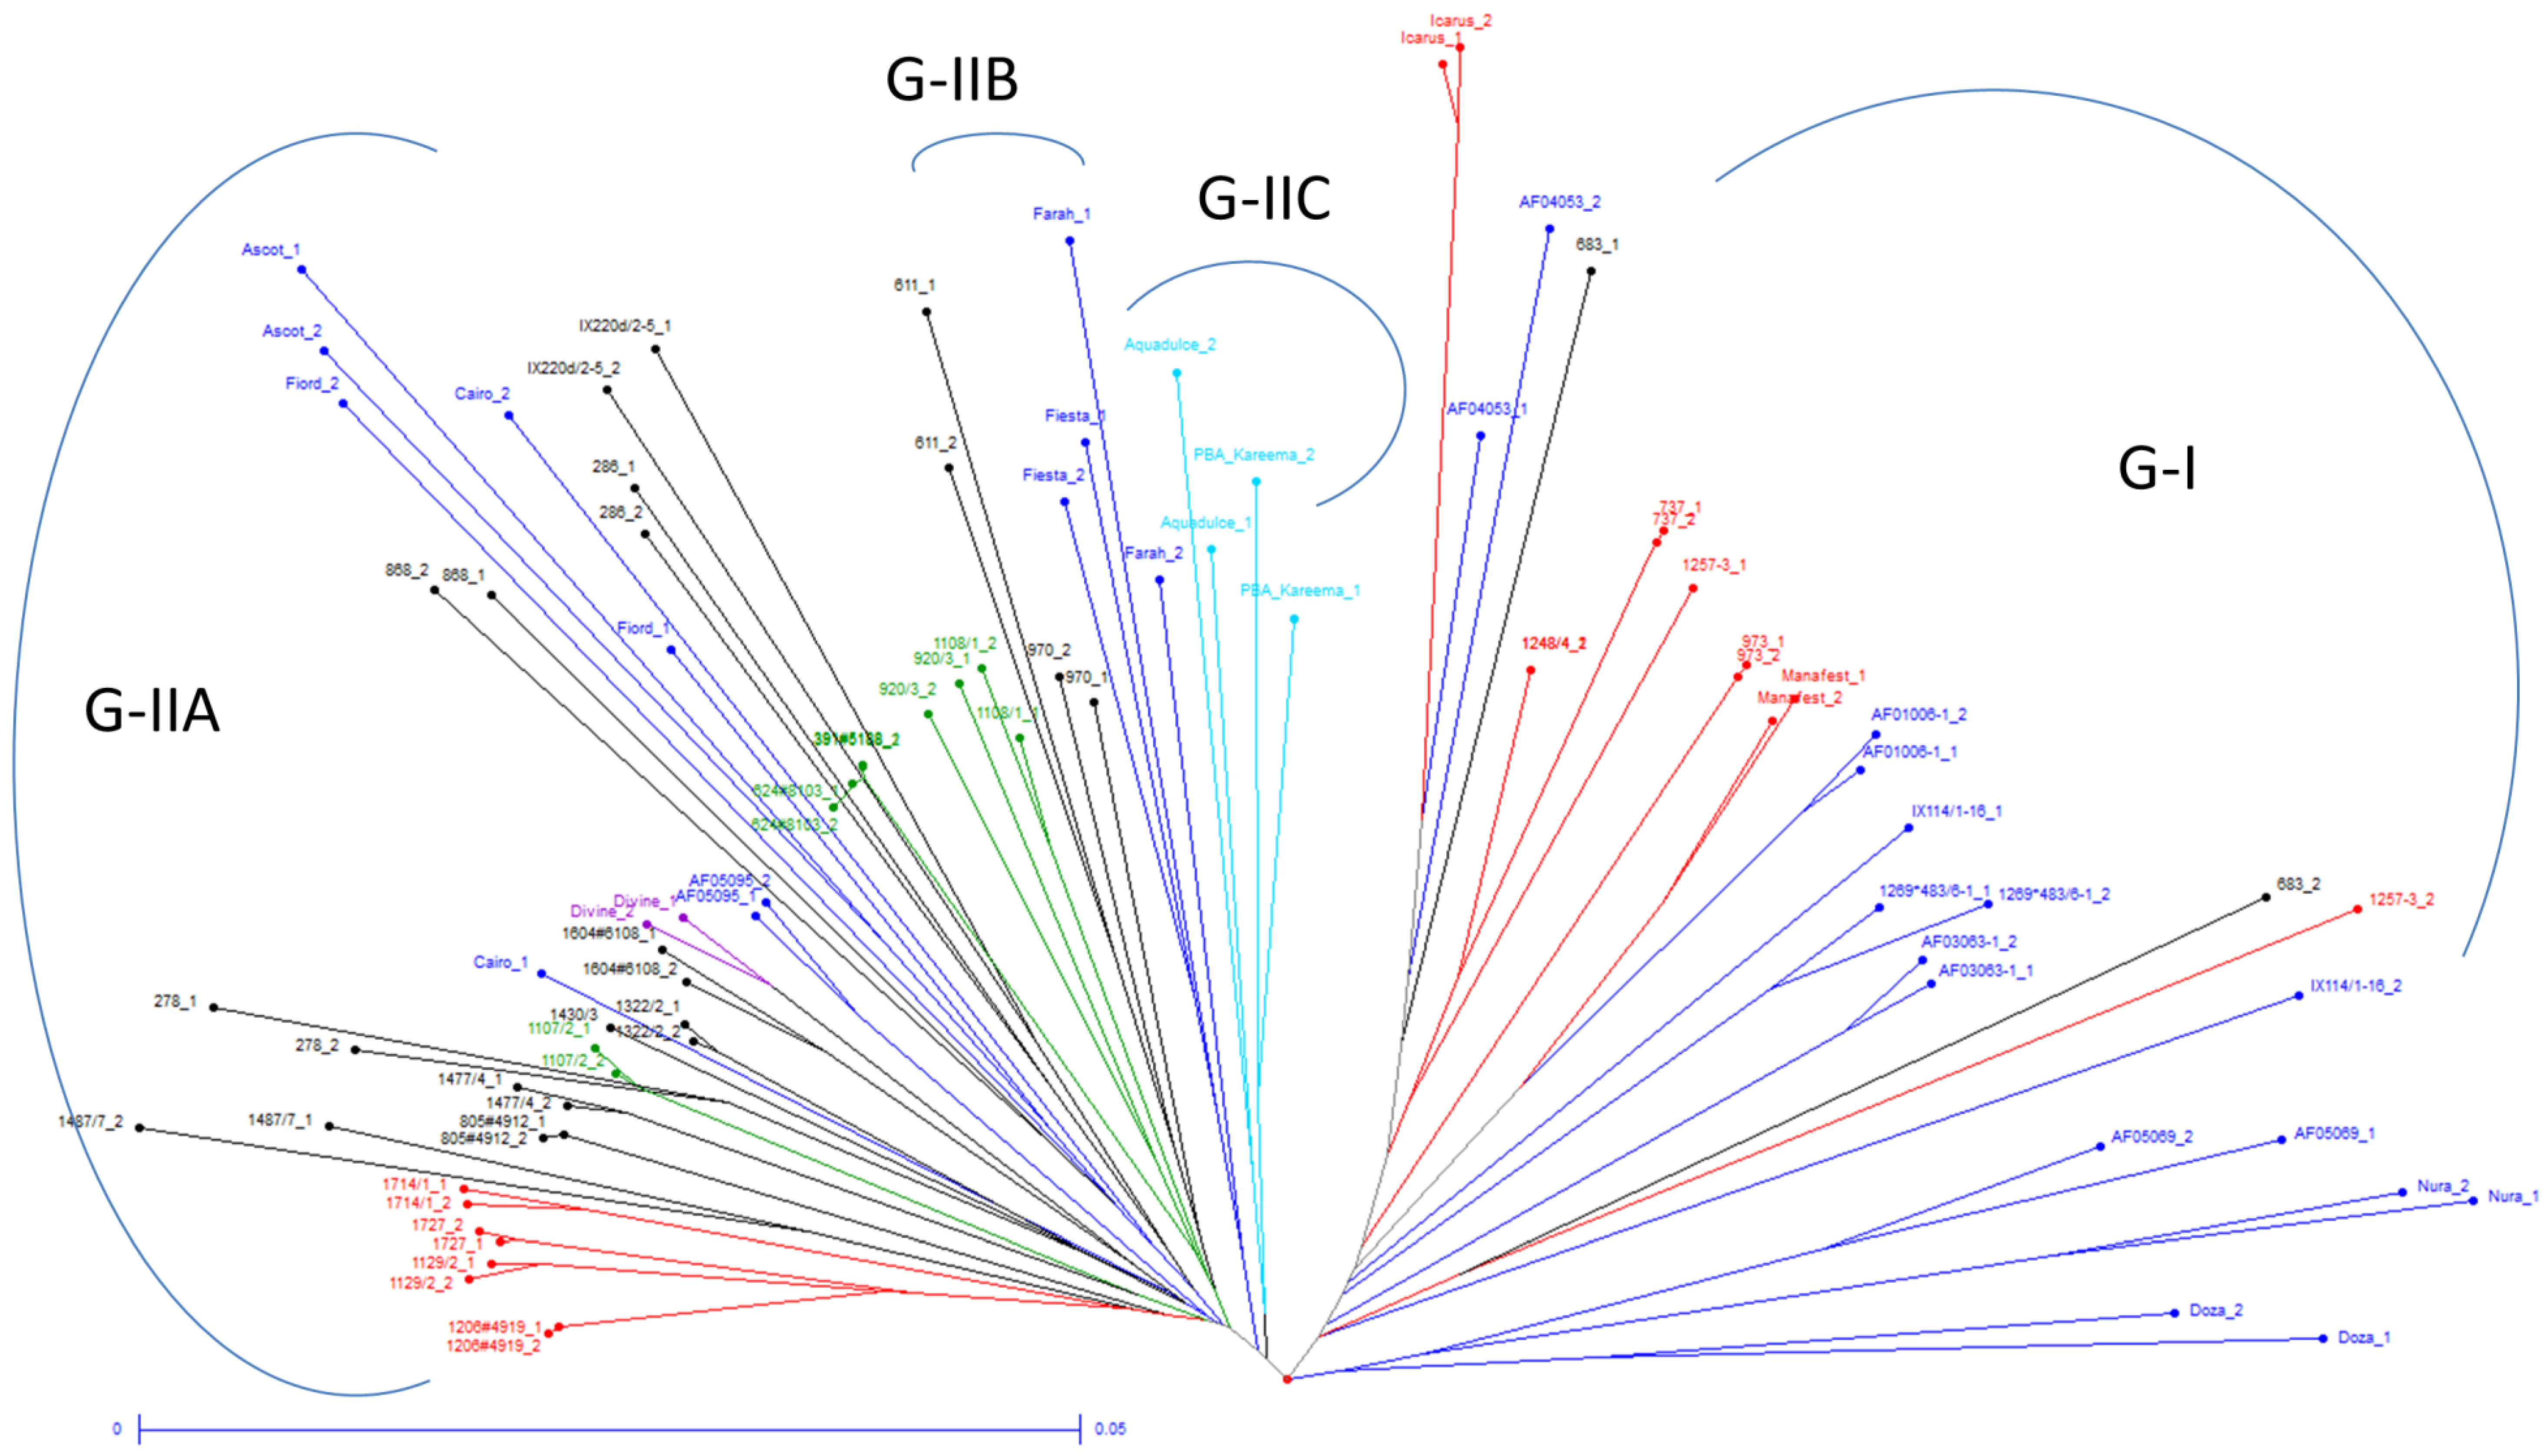
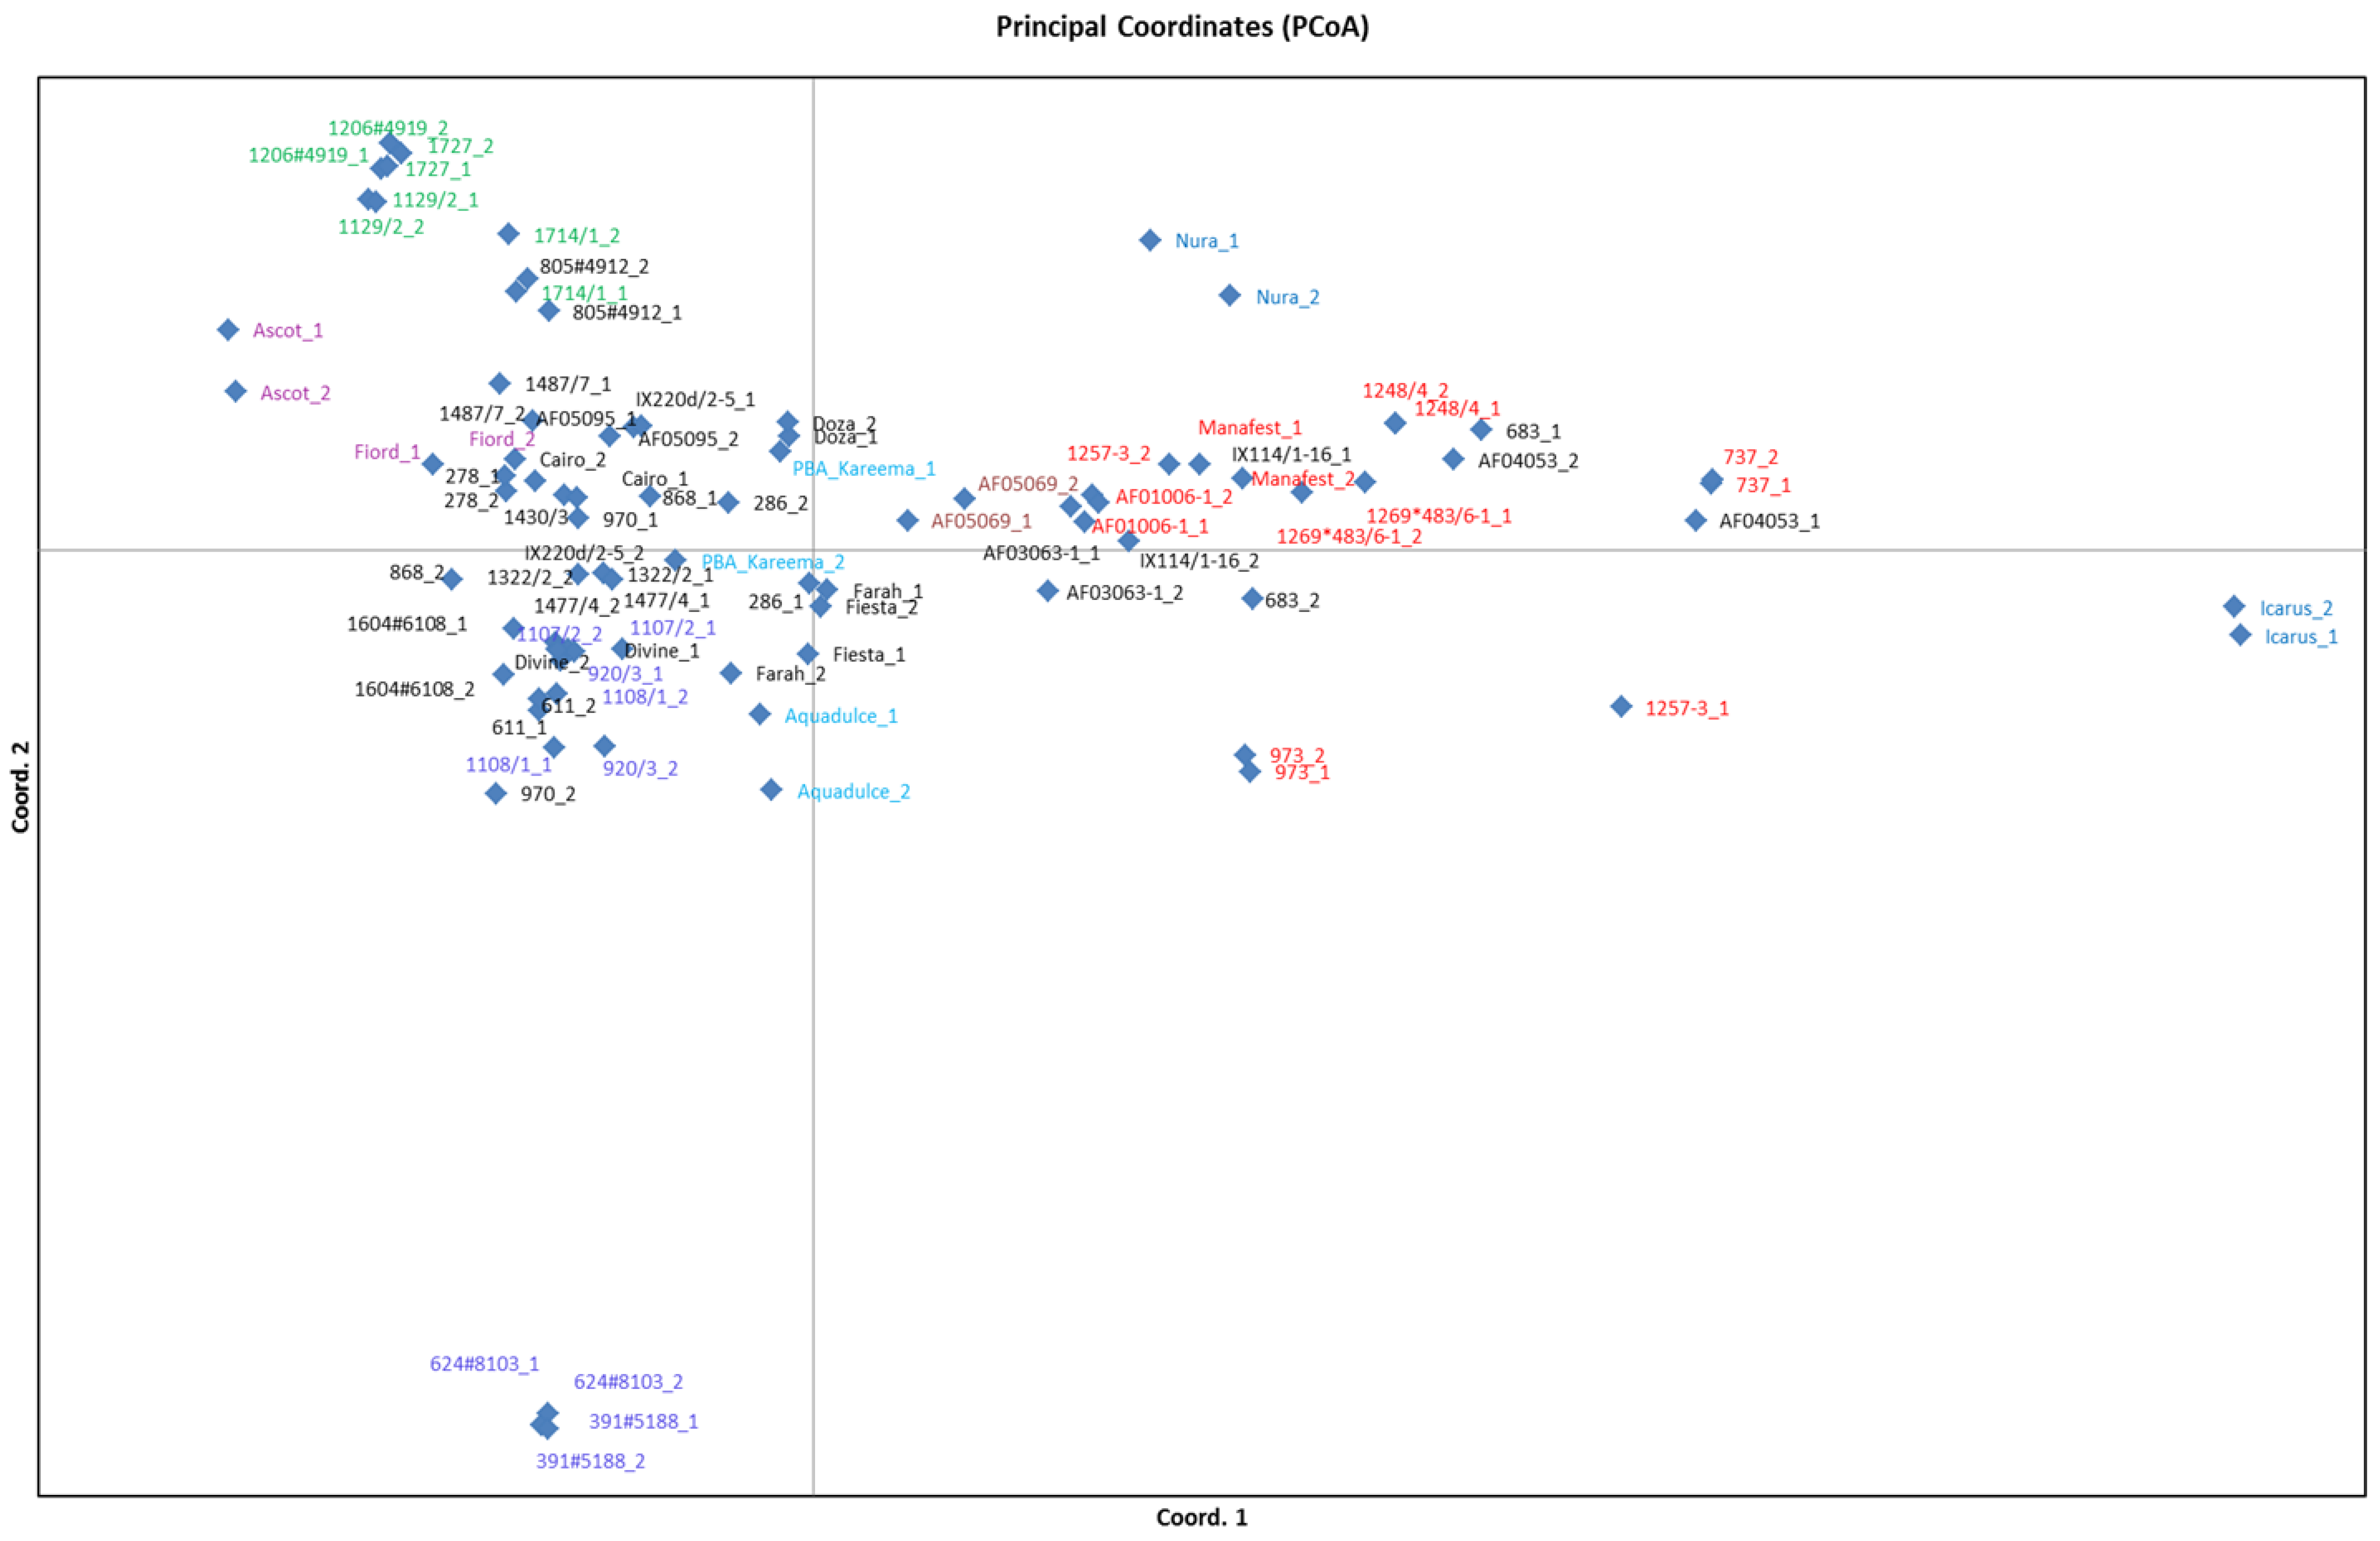
3.2. Genetic Diversity Analysis

Genetic distance between studied genotypes was quantified using Nei’s metric [20]. The appropriateness of use for specific similarity coefficients has been often debated [30]. In the present study, in which two genotypic samples were obtained from each accession under study, the Nei GD metric (in which pair-wise comparisons are made and a similarity matrix is constructed) was selected, (Supplementary 2). The highest value of GD was recorded between genotypes Ascot_2 and Icarus_1 (0.176). The closest pair of genotypes was 624#8103 and 391#5148 (Nei’s coefficient = 0.00133), both of which are rust-resistant selections undertaken in Australia [31] from accessions that originate from the Maghreb in north-western Africa. A large amount of intra-population variation was also observed for the majority of the accessions, the exception being 1248-4 for which the value of Nei’s coefficient between the two samples was 0.0 (genetic distance), both biological replicates obtained from this accession hence being genetically similar. A neighbour joining phylogram was generated (Figure 1, Supplementary 3) based on UPGMA-derived data. The faba bean accessions grouped into two main groups (G-I and G-II). G-I consisted of 16 accessions (6 accessions from Ecuador; 8 from Australia; and one accession that originated from the ICARDA breeding program). G-II consisted of 29 accessions and could be further sub-divided into three sub-groups (G-II-A, G-II-B and G-II-C). G-II-A consisted of 4 accessions that originated from China, 7 accessions from North Africa, 4 from Australia and one from Europe. G-II-B consisted of 2 accessions from Australia, and G-II-C consisted of another two accessions from Australia. The large number of sub-clusters identified in this study indicates high genetic variability related to diversity collection sites and may prove useful for exploitation of trait variability in faba bean improvement.
All of the Australian cultivars and breeding lines in G-I, with the exception of Doza, were either selected from germplasm derived from Ecuador, or include Ecuadorean germplasm in their pedigrees. In addition, Acc 683 (which was obtained from ICARDA) has Ecuadorean parentage. Germplasm from Ecuador, and in particular the BPL 710 population from which Icarus was selected, has been reported to displayed superior level of resistance to chocolate spot (Botrytis fabae Sardiña) [32,33,34], and has consequently been used extensively in the Australian faba bean breeding program. A number of diversity studies have been reported for faba bean, for example comparing European and Mediterranean germplasm [9], Chinese and globally distributed germplasm [27,35], and European, North African and Asian germplasm [10], but none have included germplasm from Ecuador. The present study indicates a significant divergence from other accessions of both Ecuadorean germplasm and breeding lines that include a significant contribution from this germplasm. This observation suggests that more intensive utilisation of Ecuadorean germplasm could allow broadening of diversity in faba bean breeding programs. Faba bean is of Old World origin, and was introduced to Latin America post-Columbus. Consequently, the apparent divergence observed here warrants further investigation, both of other Latin American faba bean populations to establish the extent of variation in this region, and comparisons between Latin American and Western European faba bean accessions, the latter presumably being the source of Latin American introductions.
Figure 1. Unweighted pair group method with arithmetic average (UPGMA) neighbour-joining (NJ) dendrogram generated based on genetic distance calculations from NTSYS v2.1. Group-I (Ecuador (red), Australia (blue), ICARDA breeding program (black)), Group-II-A (China (red), North Africa (green), Australia (blue) and Europe (purple), Group-II-B (Australia (blue)) and Group-II-C (Australia (light blue)).
Diversity 06 00088 g001
The majority of G-II germplasm originated from the Mediterranean Basin or Middle East, the major exception being a sub-cluster within G-IIA, comprising four accessions from China. Acc 1714/1, which originated from the spring-sown cultivation region of Gansu, was separated from the other three lines which originated from the sub-tropical and temperate regions of southern China. Chinese germplasm has been reported to be highly distinct from other germplasm [14,27,35], consistent with the result for G-II when considered in isolation. However, when G-I is also taken into account, considerably greater diversity among faba bean germplasm is apparent than implied by the prior comparisons of Chinese and global germplasm.

3.3. Relationships between Genetic Diversity and Breeding History

The progression in Australian faba bean breeding, and relationship between cultivars, is apparent in the dendrogram structure depicted in Figure 1. The breeding program has progressed through three phases. The initial phase consisted of introduction and evaluation, and resulted in the release of the first cultivar (Fiord) in 1980, while Icarus, Manafest and Aquadulce also fit in this category. Faba bean cultivars and accessions are generally heterogeneous for many traits, a consequence of the partially allogamous mating system, and this enabled a second phase based on selection within populations. Considerable heterogeneity has been observed within many populations for reaction to ascochyta blight (Ascochyta fabae) [36] and selection within cultivars has resulted in resistant cultivars such as Ascot (selected from Fiord), Farah (selected from Fiesta) and PBA Kareema (selected from Aquadulce) [37,38,39]. In all cases, original and derived cultivars are grouped together in the dendrogram. The third phase of breeding activities has been based on hybridisation followed by selection in segregating populations. PBA Rana (breeding line AF01006-1) resulted from a single backcross between Manafest as the recurrent parent and Acc 611 as the donor of resistance to ascochyta blight, and, as expected, PBA Rana is grouped with Manafest. The progeny of more complex or diverse crosses generally occupy positions intermediate to the parents in the dendrogram.
A high level of genetic diversity in breeders’ germplasm is a key to successful crop improvement. An earlier study concluded that genetically diverse parents improve the efficiency of linkage map construction and identification of linked markers for traits of interest [40]. Molecular genetic marker analysis has clarified the structure of genetic diversity in a broad range of crops. Recent technological developments have made whole-genome sequence polymorphism and gene-targeted surveys possible, casting light on population dynamics and the impact of selection during domestication. Germplasm description has hence conferred analytical power for resolution of the genetic basis of trait variation and adaptation in major crops such as cereals, chickpea, grapevine, cacao, or banana [41].

3.4. Population Structure Analysis

The genetic structure of the entire germplasm collection was analysed using PCoA. PCoA based on SNP allele frequencies revealed a clear differentiation between faba bean genotypes. The first and second axes explained 31.85% and 16.16% of the total variance, and predominantly separated faba bean genotypes on the basis of geographical origin and pedigree relationships (Figure 2). Two major clusters were identified; cluster 1 only contained Icarus, while cluster 2 contained all other genotypes. Cluster 2 further contained small sub-clusters grouping according to geographical origin or pedigree relationships. PCoA also confirmed the results obtained from Nei’s GD estimates, Ascot and Icarus being most divergent. Nura, which is the progeny of an Icarus × Ascot cross, was at the mid-point between the two parents on the first axis.
Figure 2. Principal component analysis (PCoA) bi-plot generated from genetic distance calculations obtained using the GENALEX package.
Diversity 06 00088 g002

4. Conclusions

Faba bean accessions revealed clear patterns of clustering based on geographical origin and pedigree relationships. A high level of heterozygosity was observed within most of the tested accessions, presumably due to the partially allogamous nature of the species. Due to the presence of adequate numbers of varietal-specific alleles, SNP markers are a valuable tool for detecting genetic diversity within and between faba bean populations, and for varietal identification and discrimination. Assessment of DNA-based diversity hence provides a valuable counterpart to phenotypic assessment for the faba bean breeder. In addition, SNP-based evaluation of sequence polymorphism in complex germplasm collections can support the development and implementation of genome-wide association studies (GWAS) for the identification and exploitation of superior allelic content at agronomically important genes.

Supplementary Materials

Supplementary 1: Basic statistics data obtained from SNPs used in the current study using PowerMarker. This file contains all information on basic statistics for SNP loci including major allele frequency, gene diversity, PIC value and heterozygosity value.
Supplementary 2: Nei’s coefficient data for faba bean accessions cultivars and landraces. This file contains genetic distance data between individual faba bean genotypes calculated using NTSYS software.
Supplementary 3: Unweighted pair group method with arithmetic average (UPGMA) neighbor-joining (NJ) dendrogram generated based on genetic distance calculations from NTSYS v2.1. Group-I (Ecuador (red), Australia (blue), ICARDA breeding program (black)), Group-II-A (China (red), North Africa (green), Australia (blue) and Europe (purple), Group-II-B (Australia (blue)) and Group-II-C (Australia (light blue)).
Supplementary materials can be accessed at: https://www.mdpi.com/1424-2818/6/1/88/s1.

Acknowledgments

This work was supported by funding from the Victorian Department of Environment and Primary Industries and the Grains Research and Development Council, Australia. We would like to also thank Kedar Adhikari (University of Sydney) and Joop van Leur (NSW-DPI) for providing seeds for some of the genotypes used in the current study.

Conflicts of Interest

The authors declare no conflict of interest.

References and Notes

  1. FAOSTAT. Crops. Available online: http://faostat.fao.org/site/567/default.aspx#ancor/ (accessed on 17 January 2014).
  2. Cubero, J. On the evolution of Vicia faba L. Theor. Appl. Genet. 1974, 45, 47–51. [Google Scholar] [CrossRef]
  3. Alghamdi, S.; Al-Faifi, S.A.; Migdadi, H.M.; Ammar, M.H.; Siddique, K.H.M. Inter-simple sequence repeat (ISSR)-based diversity assessment among faba bean genotypes. Crop Pasture Sci. 2013, 62, 755–760. [Google Scholar]
  4. Ye, Y.; Lang, L.; Xia, M.; Tu, J. Faba beans in China; (in Chinese). China Agriculture Press: Beijing, China, 2003; pp. 1–15. [Google Scholar]
  5. Raina, S.; Ogihara, Y. Ribosomal DNA repeat unit polymorphism in 49 Vicia species. Theor. Appl. Genet. 1995, 90, 477–486. [Google Scholar]
  6. Bennett, M.; Smith, J.B. Nuclear DNA amounts in angiosperms. Proc. Royal Soc. B: Biol. Sci. 1982, 216, 179–199. [Google Scholar] [CrossRef]
  7. Johnston, J.; Bennett, M.D.; Rayburn, A.L.; Galbraith, D.W.; Price, H.J. Reference standards for determination of DNA content of plant nuclei. Am. J Bot. 1999, 86, 609–613. [Google Scholar] [CrossRef]
  8. Duc, G.; Bao, S.Y.; Baum, M.; Redden, B.; Sadiki, M.; Suso, M.J.; Vishniakova, M.; Zong, X.X. Diversity maintenance and use of Vicia faba L. genetic resources. Field Crops Res. 2010, 115, 270–278. [Google Scholar] [CrossRef]
  9. Link, W.; Dixkens, C.; Singh, M.; Schwall, M.; Melchinger, A.E. Genetic diversity in European and Mediterranean faba bean germplasm revealed by RAPD markers. Theor. Appl. Genet. 1995, 90, 27–32. [Google Scholar]
  10. Zeid, M.; Schon, C.C.; Link, W. Genetic diversity in recent elite faba bean lines using AFLP markers. Theor. Appl. Genet. 2003, 107, 1304–1314. [Google Scholar] [CrossRef]
  11. Upadhyaya, H.; Dwivedi, S.L.; Ambrose, M.; Ellis, N.; Berger, J.; Smykal, P.; Debouck, D.; Duc, G.; Dumet, D.; Flavell, A.; Sharma, S.K.; et al. Legume genetic resources: Management, diversity assessment, and utilization in crop improvement. Euphytica 2011, 180, 27–47. [Google Scholar] [CrossRef]
  12. Zeid, M.; Schon, C.C.; Link, W. Genetic diversity in a group of recent elite faba bean lines. Czech J. Genet. Plant Breed. 2001, 37, 34–40. [Google Scholar]
  13. Kwon, S.; Hu, J.; Coyne, C.J. Genetic diversity and relationship among faba bean (Vicia faba L.) germplasm entries as revealed by TRAP markers. Plant Genet. Resour. Char. Util. 2010, 8, 204–213. [Google Scholar] [CrossRef]
  14. Wang, H.; Zong, X.; Guan, J.; Yang, T.; Sun, X.; Ma, Y.; Redden, R. Genetic diversity and relationship of global faba bean (Vicia faba L.) germplasm revealed by ISSR markers. Theor. Appl. Genet. 2012, 124, 789–797. [Google Scholar] [CrossRef]
  15. Kaur, S.; Pembleton, L.; Cogan, N.; Savin, K.; Leonforte, T.; Paull, J.; Materne, M.; Forster, J. Transcriptome sequencing of field pea and faba bean for discovery and validation of SSR genetic markers. BMC Genom. 2012, 13, 104. [Google Scholar] [CrossRef]
  16. Akash, M.; Myers, G.O. The development of faba bean expressed sequence tag—simple sequence repeats (ESTSSRs) and their validity in diversity analysis. Plant Breed. 2012, 131, 522–530. [Google Scholar] [CrossRef]
  17. Yang, T.; Bao, S.; Ford, R.; Jia, T.; Guan, J.; He, Y.; Sun, X.; Jiang, J.; Hao, J.; Zhang, X.; et al. High-throughput novel microsatellite marker of faba bean via next generation sequencing. BMC Genom. 2012, 13, 602. [Google Scholar] [CrossRef]
  18. Kaur, S.; Kimber, R.B.E.; Cogan, N.O.I.; Materne, M.; Forster, J.W.; Paull, J.G. SNP discovery and high-density genetic mapping in faba bean (Vicia faba L.) permits identification of QTLs for ascochyta blight resistance. Plant Sci. 2014, 217-218, 47–55. [Google Scholar] [CrossRef]
  19. Rohlf, F. NTSYS-pc Numerical Taxonomy and Multivariate Analysis System, version 2.1; Stony Brook: New York, NY, USA, 2000. [Google Scholar]
  20. Liu, K.; Muse, S.V. PowerMarker: Integrated analysis environment for genetic marker data. Bioinformatics 2005, 21, 2128–2129. [Google Scholar] [CrossRef]
  21. Nei, M. Genetic distance between populations. Am. Nat. 1972, 106, 283–292. [Google Scholar]
  22. Perrier, X.; Flori, A.; Bonnot, F. Data analysis methods. In Genetic Diversity of Cultivated Tropical Plants; Hamon, P., Seguin, M., Perrier, X., Glaszmann, J.C., Eds.; Enfield Science Publishers: Montpellier, France, 2003; pp. 43–76. [Google Scholar]
  23. Peakell, R.; Smouse, P.E. GENALEX 6: genetic analysis in Excel. Population genetic software for teaching and research. Mol. Ecol. Notes 2006, 6, 288–295. [Google Scholar] [CrossRef]
  24. Cottage, A.; Gostkiewicz, K.; Thomas, J.E.; Borrows, R.; Torres, A.M.; O’Sullivan, D.M. Heterozygosity and diversity analysis using mapped SNPs in a faba bean inbreeding programme. Mol. Breed. 2012, 30, 1799–1809. [Google Scholar] [CrossRef]
  25. Emanuelli, F.; Lorenzi, S.; Grzeskowiak, L.; Catalano, V.; Stefanini, M.; Troggio, M.; Myles, S.; Martinez-Zapater, J.M.; Zyprian, E.; Moreira, F.M.; et al. Genetic diversity and population structure assessed by SSR and SNP markers in a large germplasm collection of grape. BMC Plant Biol. 2013, 13, 39. [Google Scholar] [CrossRef] [Green Version]
  26. Wurschum, T.; Langer, S.M.; Friedrich, C.; Longin, H.; Korzun, V.; Akhunov, E.; Ebmeyer, E.; Schachschneider, R.; Schacht, J.; Kazman, E.; et al. Population structure, genetic diversity and linkage disequilibrium in elite winter wheat assessed with SNP and SSR markers. Theor. Appl. Genet. 2013, 126, 1477–1486. [Google Scholar] [CrossRef]
  27. Zong, X.; Ren, J.; Guan, J.; Wang, S.; Liu, Q.; Paull, J.G.; Redden, R. Molecular variation among Chinese and global germplasm in spring faba bean areas. Plant Breeding 2010, 129, 508–513. [Google Scholar]
  28. Ouji, A.; Suso, M.J.; Rouaissi, M.; Abdellaoui, R.; Gazzah, M.E. Genetic diversity of nine faba bean (Vicia faba L.) populations revealed by isozyme markers. Genes Genom. 2011, 33, 31–38. [Google Scholar] [CrossRef]
  29. Gnanasambandam, A.; Paull, J.; Torres, A.; Kaur, S.; Leonforte, T.; Li, H.; Zong, X.; Yang, T.; Materne, M. Impact of molecular technologies on faba bean (Vicia faba L.) breeding strategies. Agronomy 2012, 2, 132–166. [Google Scholar] [CrossRef]
  30. Piepho, H.; Laidig, F. A Review of Methods for Cluster Analysis of Marker Data  . In proceedings of the UPOV—Working Group on Biochemical & Molecular Techniques & DNA-Profiling in Particular, Cambridge, UK, 11–13 March 1997.
  31. Van Leur, J.A.G. New South Wales Department of Primary Industries, Tamworth, Australia. Personnal communication, 2013. [Google Scholar]
  32. Hanounik, S.B.; Maliha, N. Horizontal and vertical resistance in Vicia faba to chocolate spot caused by Botrytis fabae. Plant Dis. 1986, 70, 770–773. [Google Scholar] [CrossRef]
  33. Hanounik, S.B.; Robertson, L.D. New sources of resistance in Vicia faba to chocolate spot caused by Botrytis fabae. Plant Dis. 1988, 72, 696–698. [Google Scholar] [CrossRef]
  34. Bond, D.A.; Jellis, G.J.; Rowland, G.G.; Le Guen, J.; Robertson, L.D.; Khalil, S.A.; Li-Juan, L. Present status and future strategy in breeding faba beans (Vicia faba L.) for resistance to biotic and abiotic stresses. Euphytica 1994, 73, 151–166. [Google Scholar] [CrossRef]
  35. Zong, X.; Liu, X.; Guan, J.; Wang, S.; Liu, Q.; Paull, J.G.; Redden, R. Molecular variation among Chinese and global winter faba bean germplasm. Theor.Appl. Genet. 2009, 118, 971–978. [Google Scholar] [CrossRef]
  36. Kimber, R.B.E.; Davidson, J.A.; Paull, J.G. Using Genetic Diversity within Faba Bean Germplasm to Develop Resistance to Ascochyta Blight. In Proceedings of the 1st International Ascochyta Workshop on Grain Legumes, Le Tronchet, France, 2006.
  37. Knight, R. Ascot VF. Plant Var. J. 1997, 10, 33. [Google Scholar]
  38. Paull, J. Farah. Plant Var. J. 2003, 16, 64. [Google Scholar]
  39. Paull, J. PBA Kareema. Plant Var. J. 2010, 23, 51. [Google Scholar]
  40. Van de Ven, M.; Powell, W.; Ramsay, G.; Waugh, R. Restriction fragment length polymorphisms as genetic markers in Vicia. Heredity 1990, 65, 329–342. [Google Scholar] [CrossRef]
  41. Glaszmann, J.; Kilian, B.; Upadhyaya, H.D.; Varshney, R.K. Accessing genetic diversity for crop improvement. Curr. Opin. Plant Biol. 2010, 13, 167–173. [Google Scholar] [CrossRef]

