Article

Phytoplankton Communities in Green Bay, Lake Michigan after Invasion by Dreissenid Mussels: Increased Dominance by Cyanobacteria

by
Bart T. De Stasio
1,*,
Michael B. Schrimpf
1,2 and
Brendan H. Cornwell
1,3
1
Department of Biology, Lawrence University, 711 E. Boldt Way, Appleton, WI 54911, USA
2
Department of Ecology and Evolution, Stony Brook University, 650 LSB, Stony Brook, NY 11794-5245, USA
3
Center for Population Biology, University of California Davis, One Shields Ave, Davis, CA 95616, USA
*
Author to whom correspondence should be addressed.
Diversity 2014, 6(4), 681-704; https://doi.org/10.3390/d6040681
Submission received: 1 September 2014 / Revised: 10 October 2014 / Accepted: 28 October 2014 / Published: 6 November 2014
(This article belongs to the Special Issue Biological Invasions)

Abstract

:
Biological invasions of aquatic systems disrupt ecological communities, and cause major changes in diversity and ecosystem function. The Laurentian Great Lakes of North America have been dramatically altered by such invasions, especially zebra (Dreissena polymorpha) and quagga (D. rostriformis bugensis) mussels. Responses to mussel invasions have included increased water clarity, and decreased chlorophyll and phytoplankton abundance. Although not all systems have responded similarly, in general, mussels have changed nutrient dynamics and physical habitat conditions. Therefore examination of different impacts can help us further understand mechanisms that underlie ecosystem responses to biological invasions. To aid our understanding of ecosystem impacts, we sampled established locations along a well-studied trophic gradient in Green Bay, Lake Michigan, after the 1993 zebra mussel invasion. A strong trophic gradient remained during the period sampled after the mussel invasion (2000–2012). However, mean summer chlorophyll increased and other measures of phytoplankton biomass (microscope and electronic cell counting) did not change significantly. Multivariate analyses of phytoplankton community structure demonstrate a significant community shift after the invasion. Cyanobacteria increased in dominance, with Microcystis becoming the major summer taxon in lower Green Bay. Diatom diversity and abundance also increased and Chlorophyta became rare. Phytoplankton responses along the trophic gradient of Green Bay to zebra mussel invasion highlight the importance of mussel effects on nutrient dynamics and phytoplankton diversity and function.

1. Introduction

Biological invasions of aquatic systems have increased in frequency over the past 50 years and have led to major disruptions of ecological communities, thereby causing major changes in biological diversity and ecosystem function [1,2]. Invasions of the Laurentian Great Lakes of North America have been common, in large part due to extensive human activities that transport non-native species across natural dispersal barriers [3,4]. Some of the most well-studied examples include the major changes that occurred after invasions by zebra (Dreissena polymorpha) and quagga (D. rostriformis bugensis) mussels [5]. Dreissenid mussels quickly spread throughout the Great Lakes and nearby inland lakes in the 1980s, and dramatically changed most of the invaded systems e.g., [6]. Dreissenids typically achieved extremely high abundances and filtered large volumes of water [7,8]. This resulted in changes in water clarity and decreases in abundance of algae [9,10,11,12,13]. High consumption rates of particulate matter by mussels also increased nutrient release and caused shifts in nutrient ratios in some lakes [14,15]. Because dreissenids live on the bottom, shifts in energy and biomass from the plankton to the benthos have been documented, leading to “benthification” of invaded lakes [16,17,18,19].
Not all aquatic systems have responded to invasion by dreissenid mussels in this same manner. Recent meta-analyses of responses of lakes to invasion by dreissenids show that some lakes exhibited increased chlorophyll and total phosphorus concentrations [18,20,21], as well as increased frequency of blooms of cyanobacteria [2,9,13]. Most of these studies have been conducted using easily measured aggregate variables like chlorophyll and total phosphorus, with relatively few providing taxonomic level analyses of changes in pelagic primary producers (e.g., phytoplankton). However, recent studies such as that in Saginaw Bay, Lake Huron [13] documented persistent shifts in phytoplankton community composition after mussel invasion. More detailed studies of lakes exhibiting such responses can provide an opportunity to better understand the mechanisms driving ecosystem change following invasion.
Green Bay is the largest embayment of Lake Michigan and is one of the most productive ecosystems in the Laurentian Great Lakes [22,23]. Extensive studies prior to invasion of the system by zebra mussels in 1993 documented a strong trophic gradient due to nutrient loading from the Fox River and subsequent dilution with distance from the river [24,25,26]. The inner bay near the mouth of the river was shown to be highly eutrophic, with abundant phytoplankton growth, while the middle and upper bay areas were meso-oligotrophic. Studies of the system following the invasion demonstrated the persistence of the trophic gradient but varying responses depending on location along the gradient and level of analysis. Water clarity, as measured by Secchi depth, did not change significantly along the trophic gradient, and total phosphorus increased [8,27,28]. While analysis of chlorophyll concentrations just before and after invasion resulted in significant decreases [27], comparisons spanning a longer time range demonstrated significantly increased chlorophyll abundance at both lower and middle bay regions following invasion [28,29]. In addition, phytoplankton community composition shifted, with decreased proportions of Chlorophyta and increased dominance by cyanobacteria and diatoms [28]. Given that these responses to the invasion by zebra mussels differ from those observed in many other studies, further details of changes in phytoplankton communities may be instructive. Our previous reports on Green Bay documented changes in water clarity, chlorophyll abundance during part of the invasion period, and shifts in higher level taxonomic categories of phytoplankton. Here we provide results from a more extensive analysis of phytoplankton communities and further evidence of a clear regime shift in diversity and structure following invasion of the Green Bay ecosystem by dreissenid mussels.

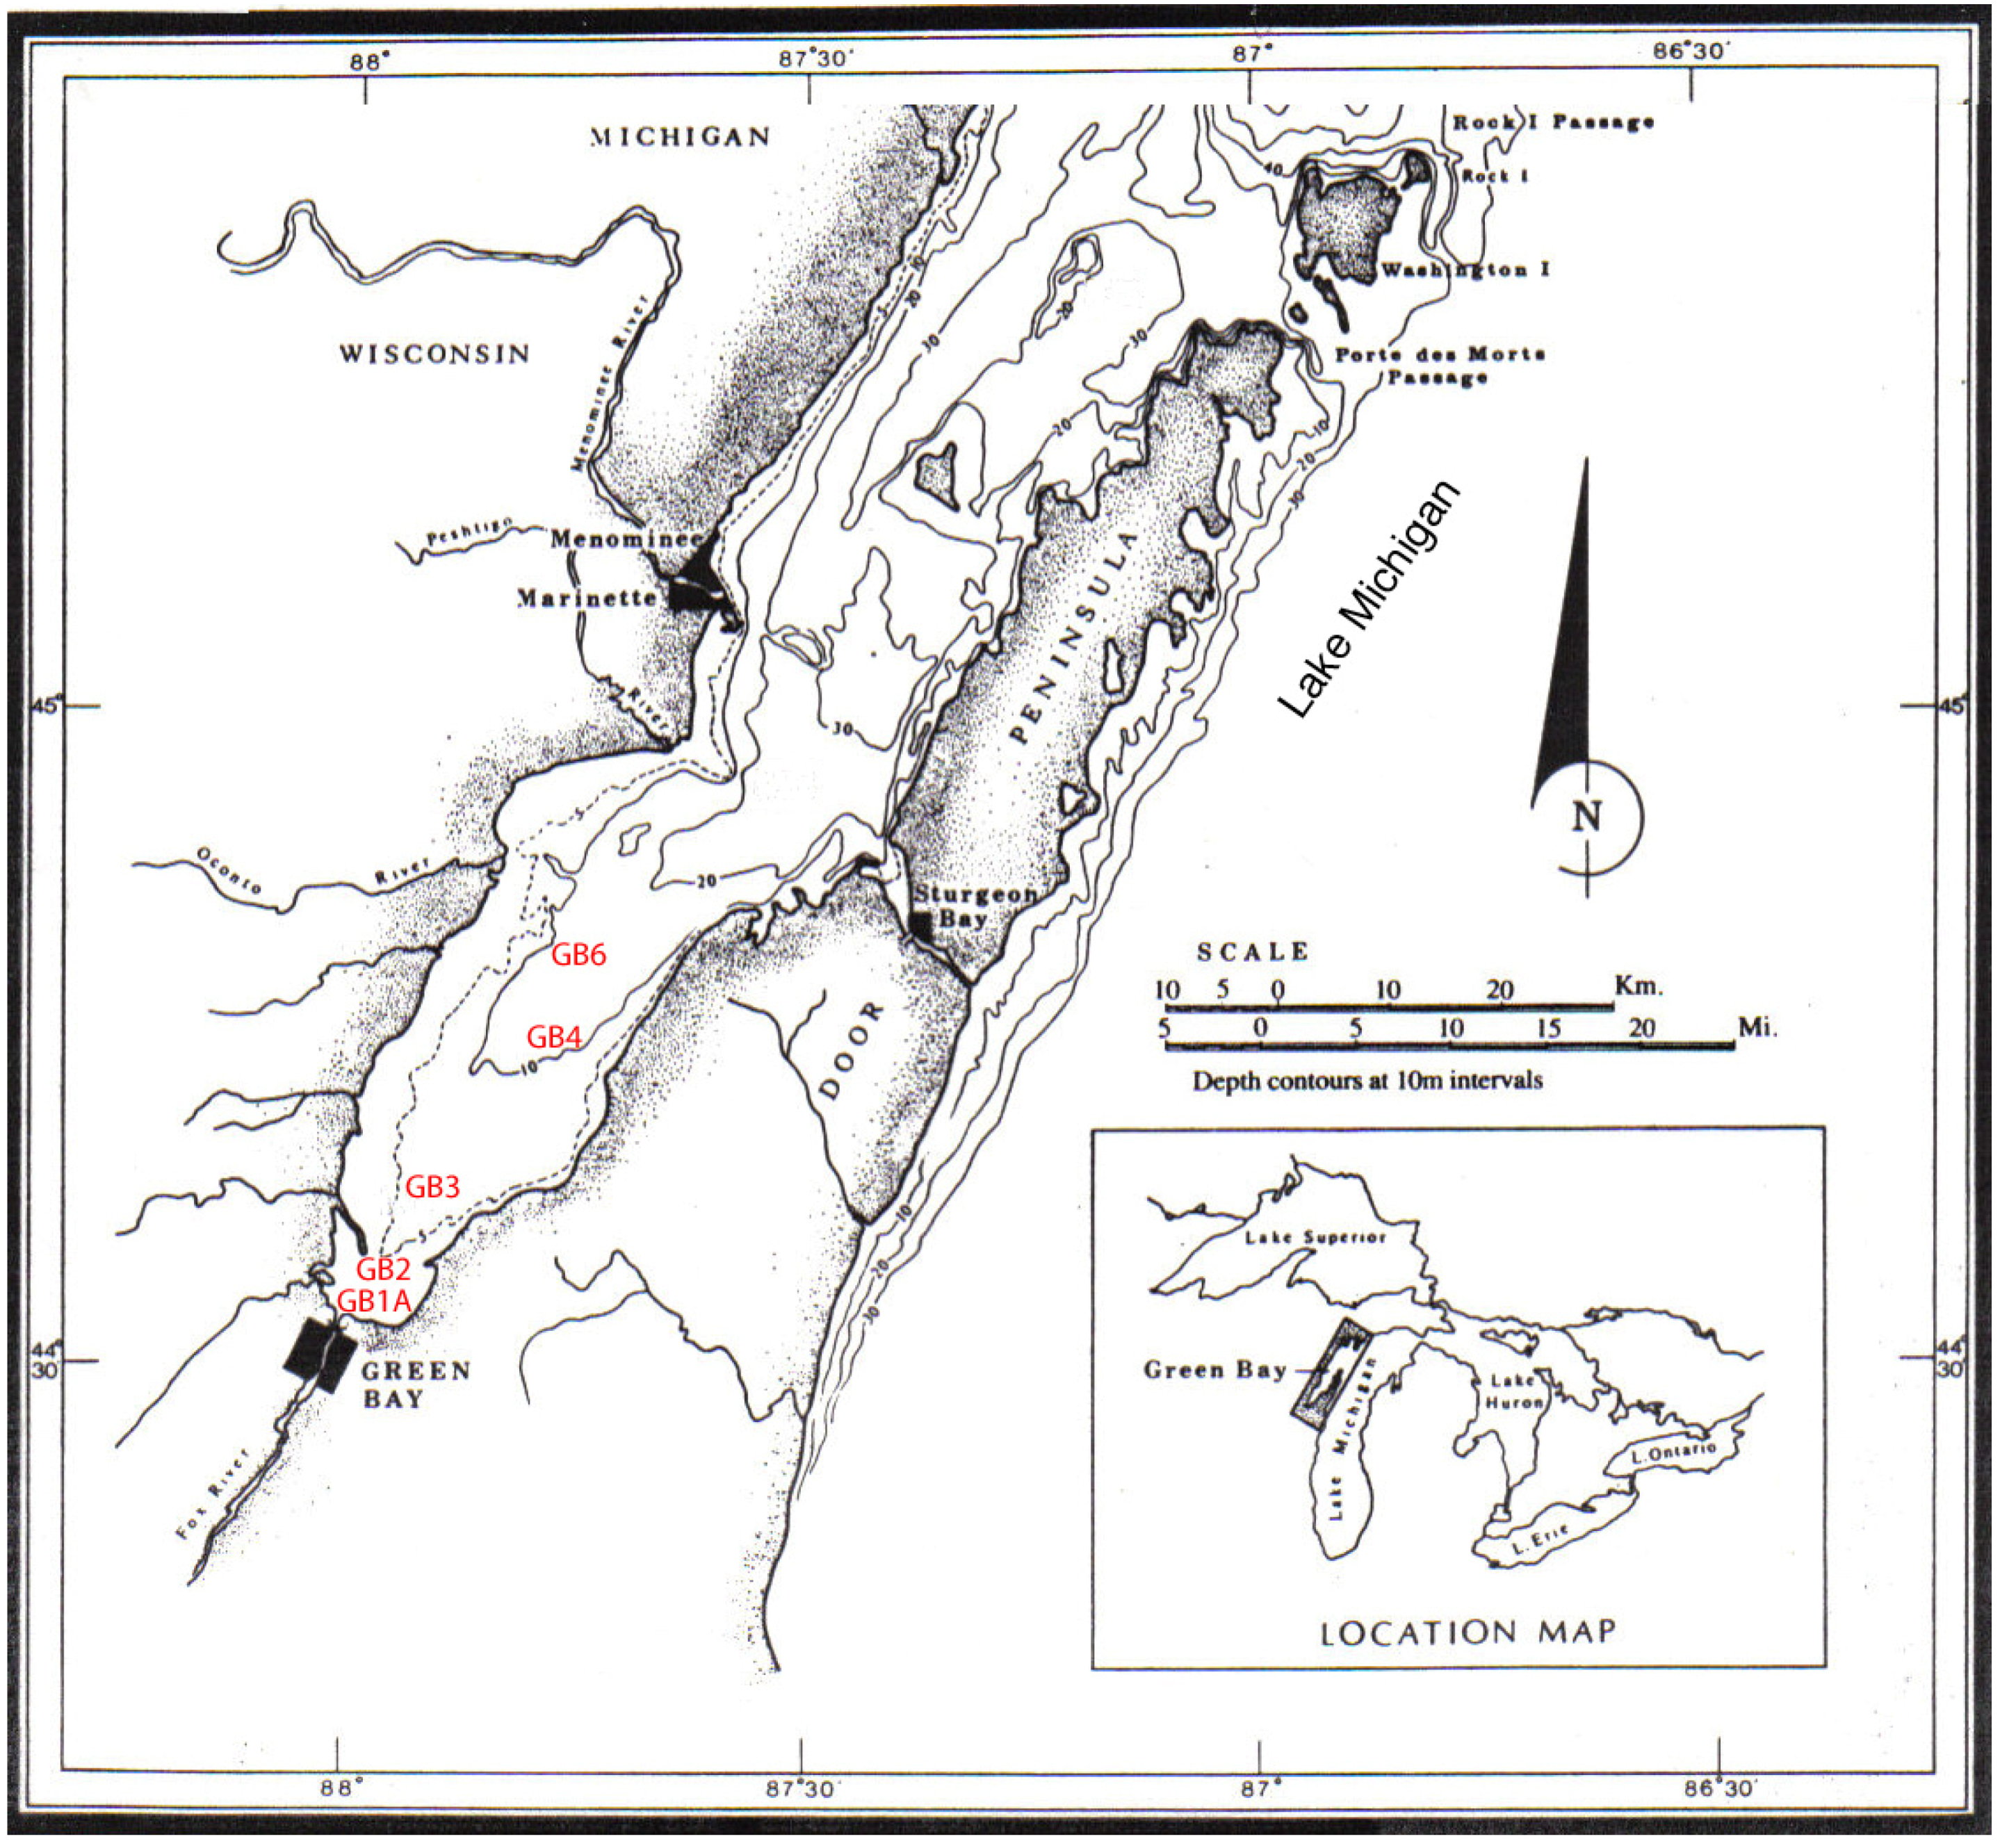
2. Materials and Methods

Previously published and unpublished data were combined with data from the present study, spanning a time period from 1982 to 2012. This study employed the same methods as earlier work to ensure reliable comparisons across time. In our investigations, Green Bay was sampled from 2000 until 2012 at locations established during previous studies along a strong trophic gradient in the bay [24,25,28]. The phytoplankton community analysis focused on microscope counts of samples from two locations in the lower-bay region (i.e., inner bay; GB1A and GB2 in Figure 1). Unpublished data on total phytoplankton biovolume and species composition from 1990 to 1992 was available for an additional site in the eastern area of the inner bay near the University of Wisconsin–Green Bay University Outing Club. Comparisons of chlorophyll were possible for site GB2 spanning the entire period from 1982 until 2012. Additional limited data (total phosphorus, chlorophyll and Secchi depth) were available for all stations along the trophic gradient for select years. Sites GB1A and GB2 are representative of the shallow (less than 3 m depth), well-mixed conditions typically occurring in the inner bay, while other stations along the gradient become progressively deeper until reaching a depth of 15 m at GB6, which stratifies each summer.
Samples were collected approximately biweekly each year from June through August. Samples for Chlorophyll a (Chl-a), nutrients, and phytoplankton analysis were duplicate-integrated samples collected from the surface to approximately 0.5 m above the bottom, or from the top 4 m at deeper sites (GB3, GB4, GB6). Water for Chl-a and nutrient determinations was stored on ice in the dark until returned to the laboratory and phytoplankton samples were preserved in 1% Lugol’s solution.
In the laboratory, Chl-a concentration was determined using the acetone extraction protocol [30]. Replicate samples of water were filtered under dim light conditions onto GF/C filter paper, ground in a tissue grinder and extracted in 90% alkaline acetone. Extracts were centrifuged to remove particulate matter, followed by determination of absorbance at the Chl-a wavelength. Extracts were subsequently acidified to correct for phaeophytin interference. Soluble reactive phosphorus (SRP) was measured using the standard method employing ammonium molybdate and ascorbic acid. Digestion with potassium persulfate was used to determine total phosphorus (TP) concentrations [30].
Duplicate subsamples (15–50 mL) for identification and enumeration of phytoplankton were examined using settling chambers viewed on an inverted Zeiss microscope or on permanent slides made by filtering subsamples onto membrane filters (0.45 µm pore size) under low vacuum (<50 mm Hg). Filters were cleared with immersion oil, sealed with Permount and enumerated at 100–500× magnification. Linear cell dimensions were determined with an ocular micrometer and used to estimate cell biovolume based on published relationships between linear dimensions and volume [30].
Figure 1. Map of lower Green Bay, Lake Michigan indicating sampling sites (GB1A-GB6) included in this study.
Diversity 06 00681 g001
Total phytoplankton biovolume was also determined from the phytoplankton samples using electronic particle counting. Biovolumes were measured with a Model B Coulter Counter from 1981 to 1992 [26] and with a Model 282PC Elzone counter from 2005 to 2007 (Particle Data, Inc., Elmhurst, IL, USA). Particles ranging in biovolume from 30 to 300,000 um3, equivalent to 4–90 um spherical equivalent diameter, were counted using a combination of multiple aperture tubes from 38 to 200 um diameter. Separate biovolume distributions determined using each aperture tube were meshed to provide estimates of total phytoplankton biovolume per unit of lake water in each sample.
Multivariate analysis of phytoplankton composition and abundance were conducted using principal component analysis (PCA) followed by agglomerative hierarchical clustering and Regime Shift Detection (RSD) procedures following the recommendations of Nicholls [31]. Data on phytoplankton community composition were analyzed at two levels of taxonomic resolution, using either genus-level identity or higher-level taxonomic categories. For higher-level groupings, cell counts for each genus were aggregated into these categories: cyanobacteria, non-desmid green algae (including the Chlorophyta and non-desmid Charophyta), desmids, diatoms (class Bacillariophyta), non-diatom Chrysophyta, dinoflagellates, and “other.” Using data at these two levels of taxonomic specificity reduced problems with changes in resolution of identifications across time. Data were transformed with the 4th root transformation prior to analysis [31]. Bray–Curtis similarity indices were calculated from a transformed-data matrix and analyzed with PCA, AHC and RSD procedures.
Examination for heteroscedasticity and normality, data transformations, tests of significance (e.g., Mann–Whitney U and t-tests) and post hoc tests were performed using SPSS® (Statistical Package for the Social Sciences, version 15.0). Principal components analysis, cluster analysis and analysis of similarities (ANOSIM) were completed with the PAleontological STatistics (PAST) program [32]. Regime Shift Detection was computed using the Excel spreadsheet procedures of Rodionov [33] followed by ANOSIM permutation tests using the PAST software.

3. Results

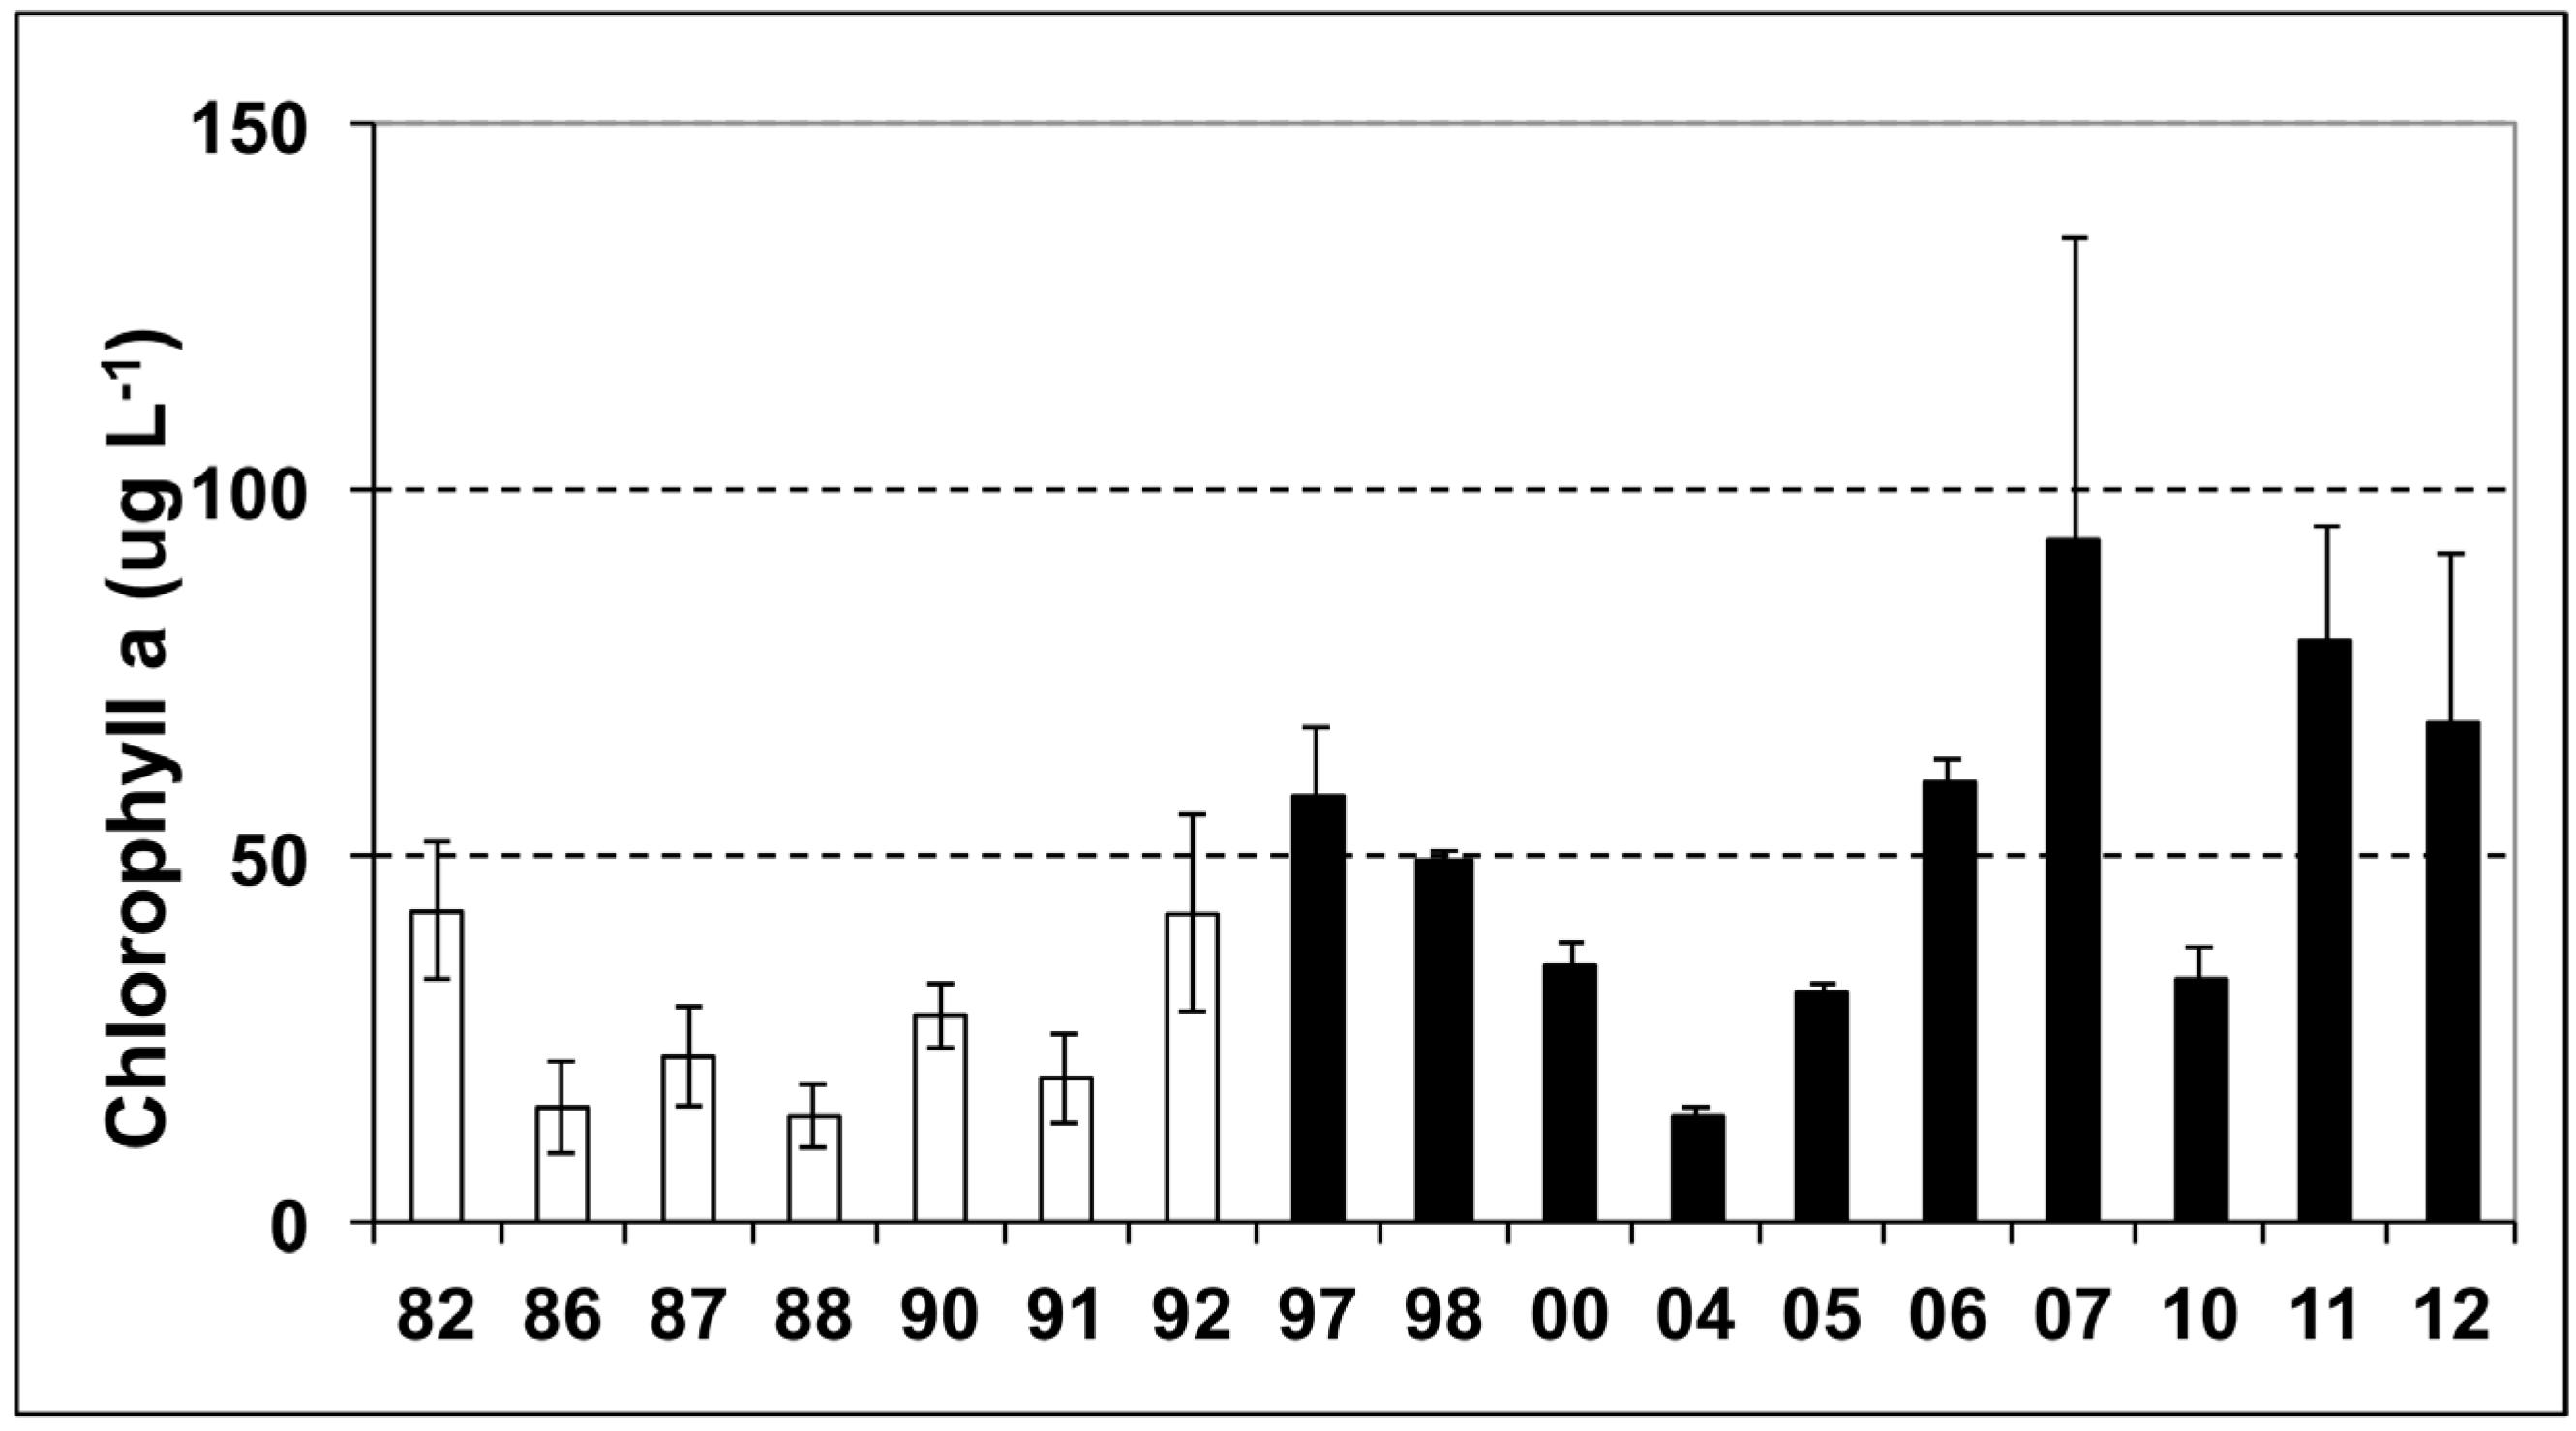
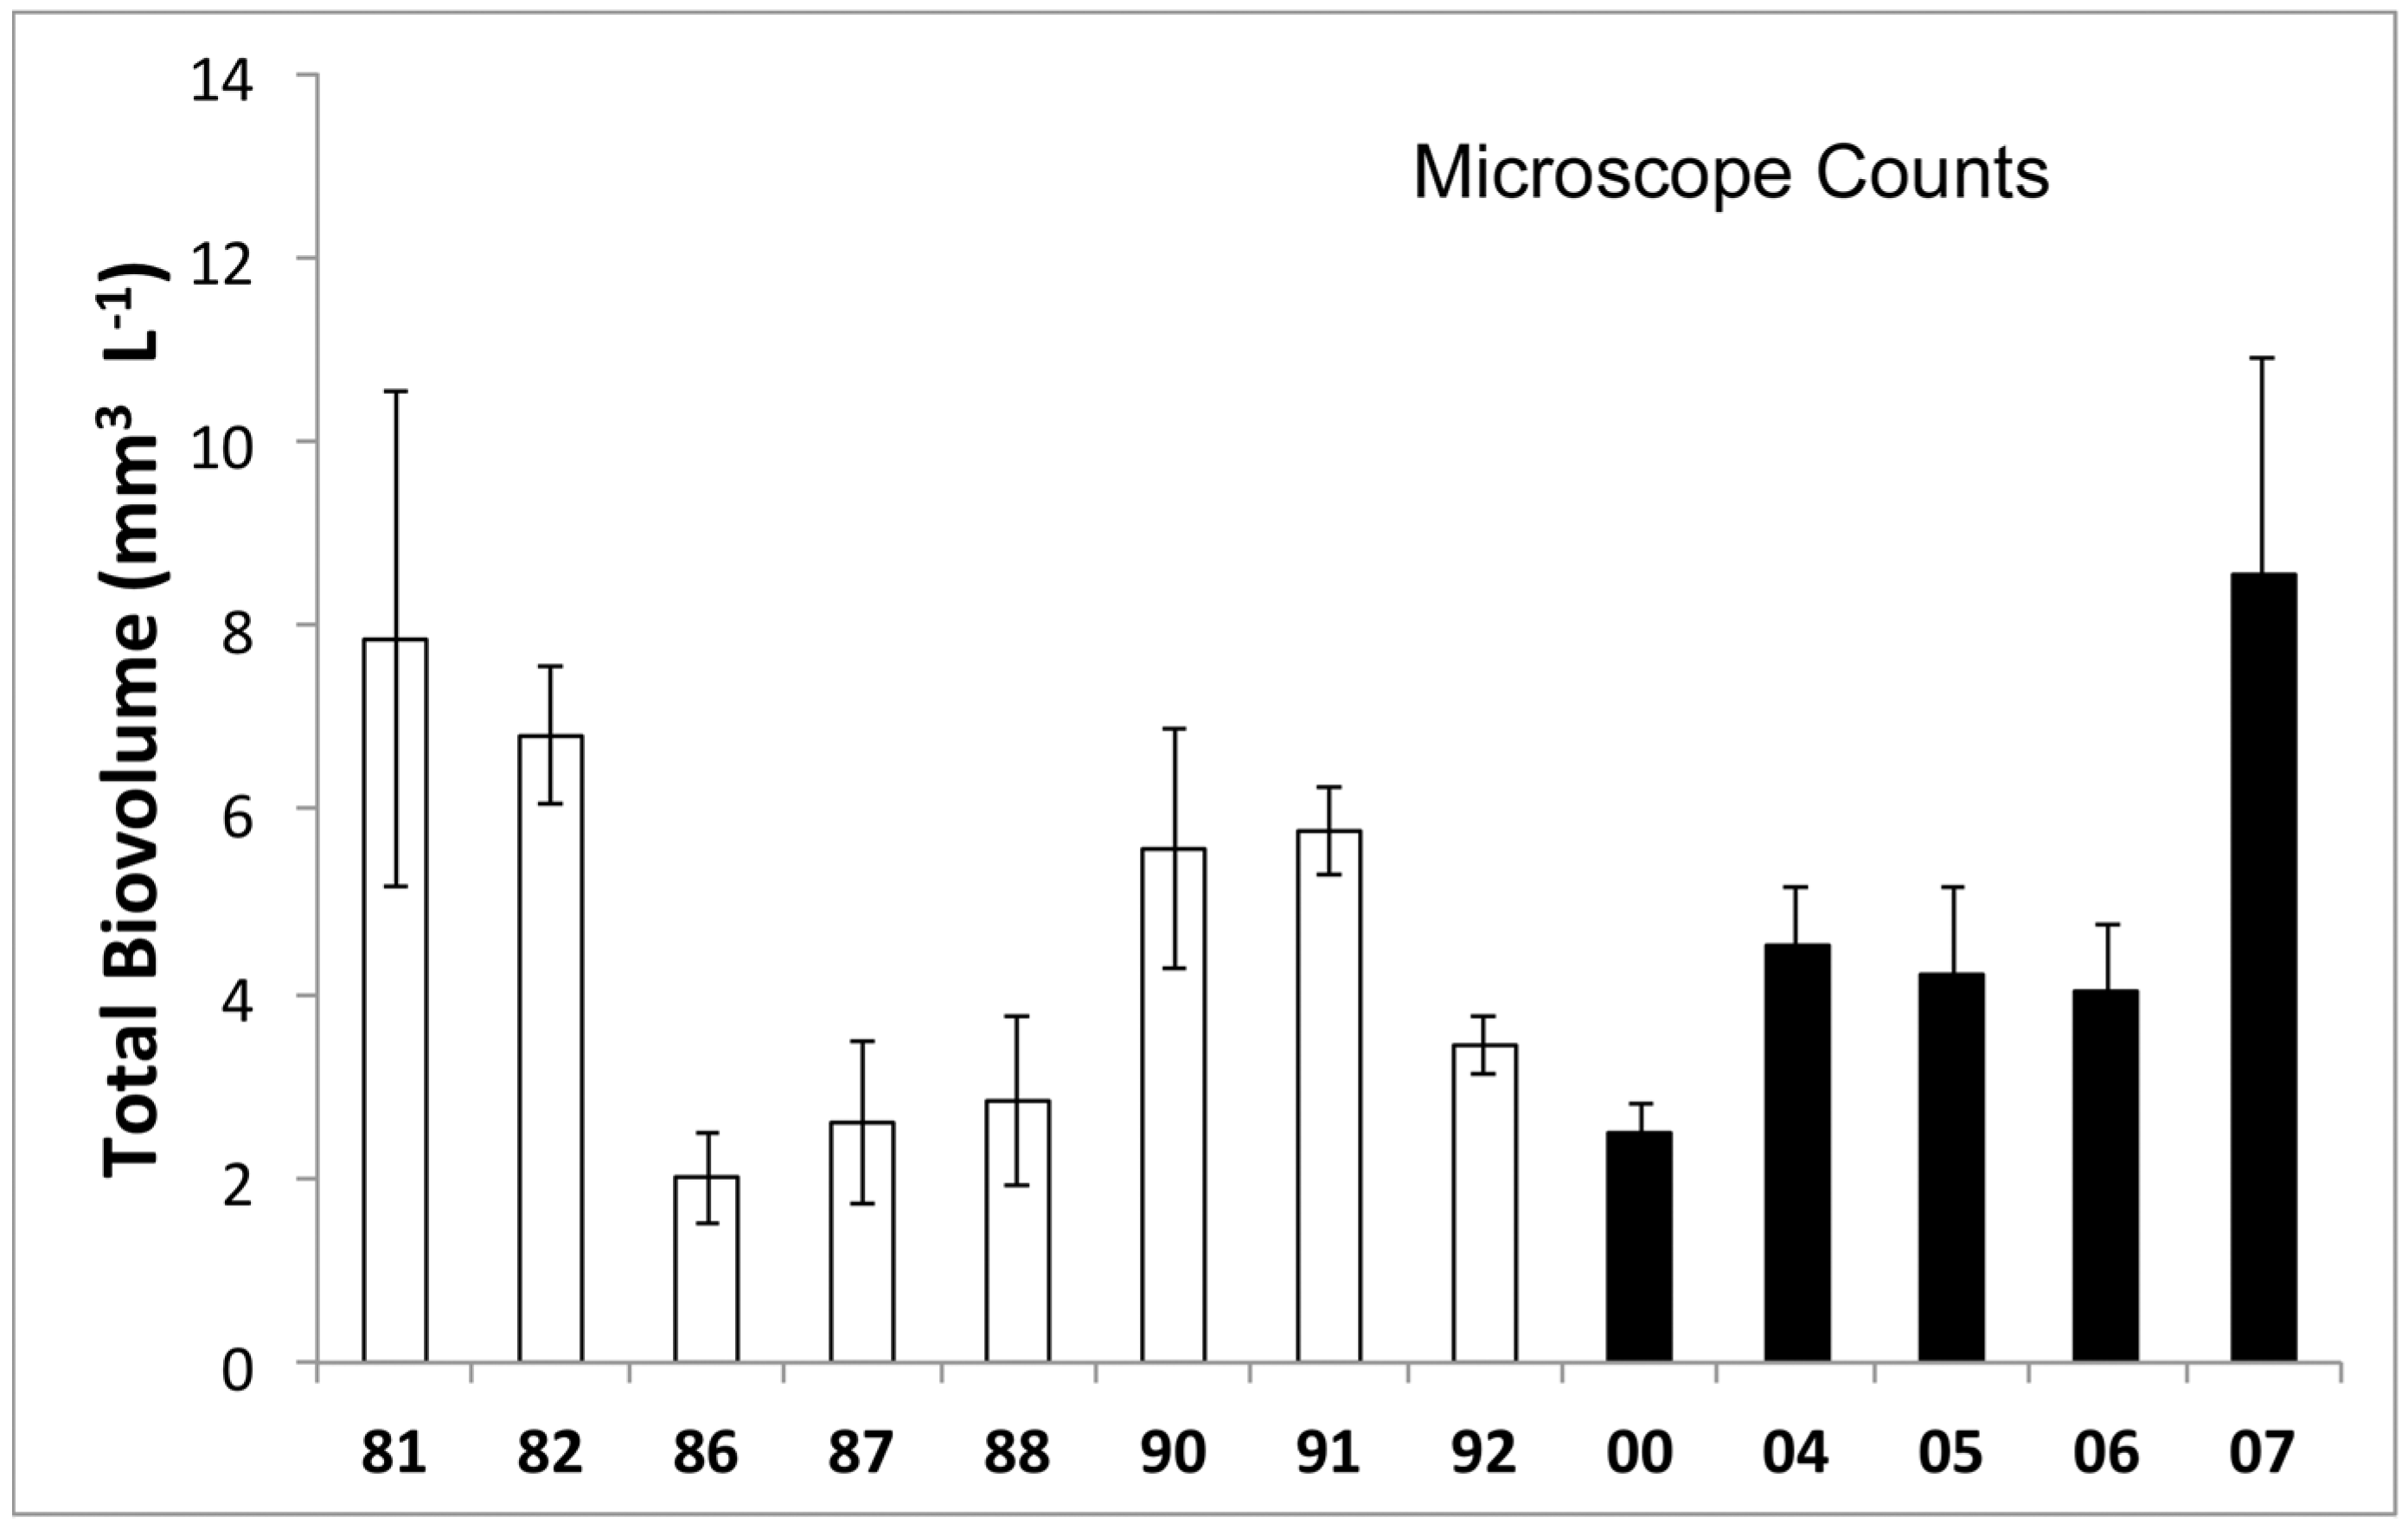
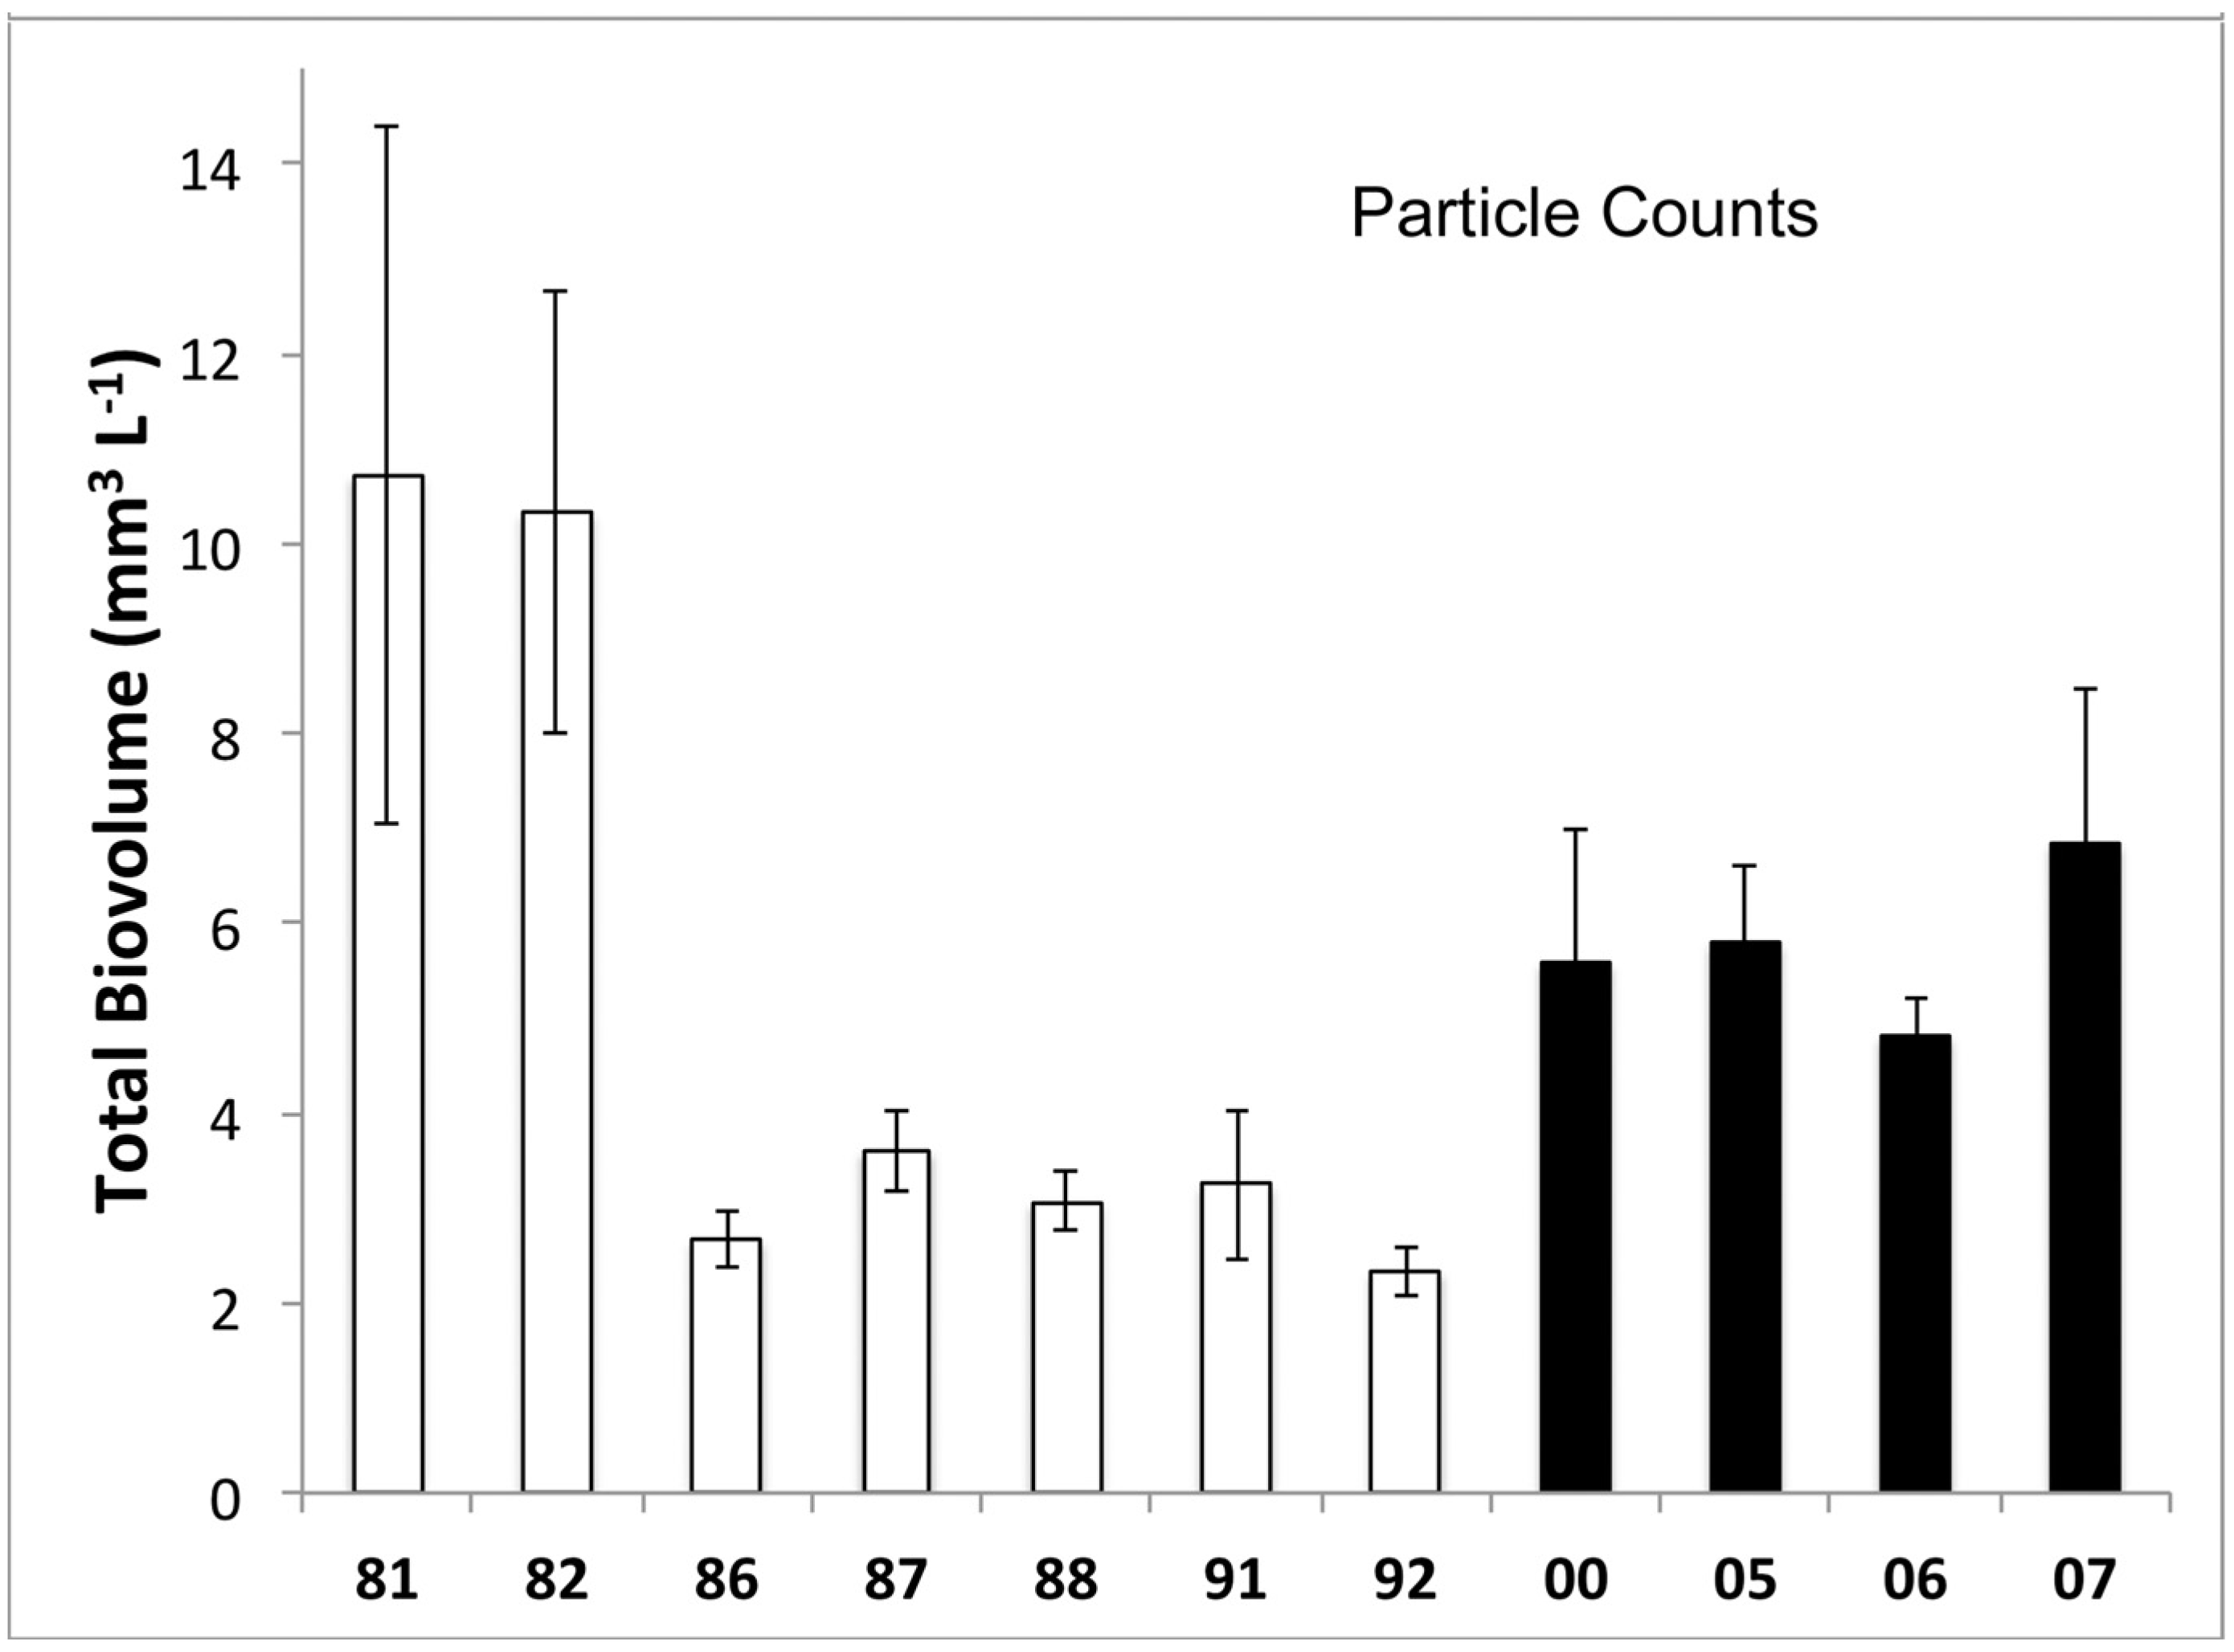
3.1. Phytoplankton Biomass

Summer Chl-a concentration varied across time in the inner bay of Green Bay, and there were significantly greater mean summer abundances during the post-invasion period (1997–2012 in Figure 2; Mann–Whitney U test adjusted H′ = 5.04, df = 1, p = 0.025). Average chlorophyll levels before invasion were all less than 50 ug L−1, whereas concentrations after invasion approached 100 ug L−1 in some years. Within the pre-invasion time period mean summer values during 1986–1988 were lower than those before or after this period. Chlorophyll abundances routinely increased throughout the summer with peaks during August, in some years exceeding 250 ug L−1 during these late summer blooms (e.g., 2007) compared to peak values below 100 ug L−1 before the invasion. We have shown elsewhere significant increases in chlorophyll at the GB6 site following the invasion, indicating that similar responses occurred at both ends of the trophic gradient [28].
Figure 2. Mean summer Chlorophyll a concentration (±1 SEM) for lower bay site GB2 in Green Bay. Open bars are pre-invasion years, black bars are post-invasion years.
Diversity 06 00681 g002
Total phytoplankton biovolume in the inner bay of Green Bay varied over time but there was no clear pattern related to invasion by zebra mussels based on microscope counts (Figure 3, top). Phytoplankton biovolumes during 1986–1988 were lower than other pre-invasion years, consistent with the pattern observed in the chlorophyll data. Comparison of all pre-invasion years vs. post-invasion years showed there was not a significant difference between the two time periods (H′ = 0.021, df = 1, p = 0.884). Phytoplankton biovolume determined with electronic particle counting methods showed changes over time that mimicked those observed in the microscope analysis (Figure 3, bottom), although this may be attributable to different methods of measuring phytoplankton abundance often yielding varying results on the same samples [34]. Using electronic particle counting data, there was no significant difference between the pre-invasion and post-invasion years (H′ = 1.29, df = 1, p = 0.257). It is notable that after 1986, the pre-invasion values were lower than 1981 and 1982 values (H′ = 3.75, df = 1, p = 0.053), perhaps reflecting nutrient control efforts during the 1980s [23]. Restricting the analysis to these later pre-invasion values for comparison with post-invasion years indicates a significant increase in phytoplankton biovolume following the invasion (H′ = 6.0, df = 1, p = 0.014), consistent with results from the chlorophyll analysis. Although count data are not available for 2010–2012, late summer algal bloom conditions in each year were similar to those observed in 2007, thus indicating that high concentrations and late summer blooms of phytoplankton have continued to occur through 2012, consistent with the high chlorophyll values observed for those years (Figure 2). Although fewer data are available for station GB6 based on microscope counts, our previous analysis [28] demonstrated significant increases in total phytoplankton biovolume based on microscopic analysis after mussel invasion, which is consistent with increased chlorophyll observed at station GB6.
Figure 3. Total phytoplankton biovolume (summer mean ±1 SEM) based on microscope counts (top panel) and from electronic particle counts (bottom panel) from all inner bay sites of Green Bay. Open bars are pre-invasion years, black bars are post-invasion years.
Diversity 06 00681 g003aDiversity 06 00681 g003b

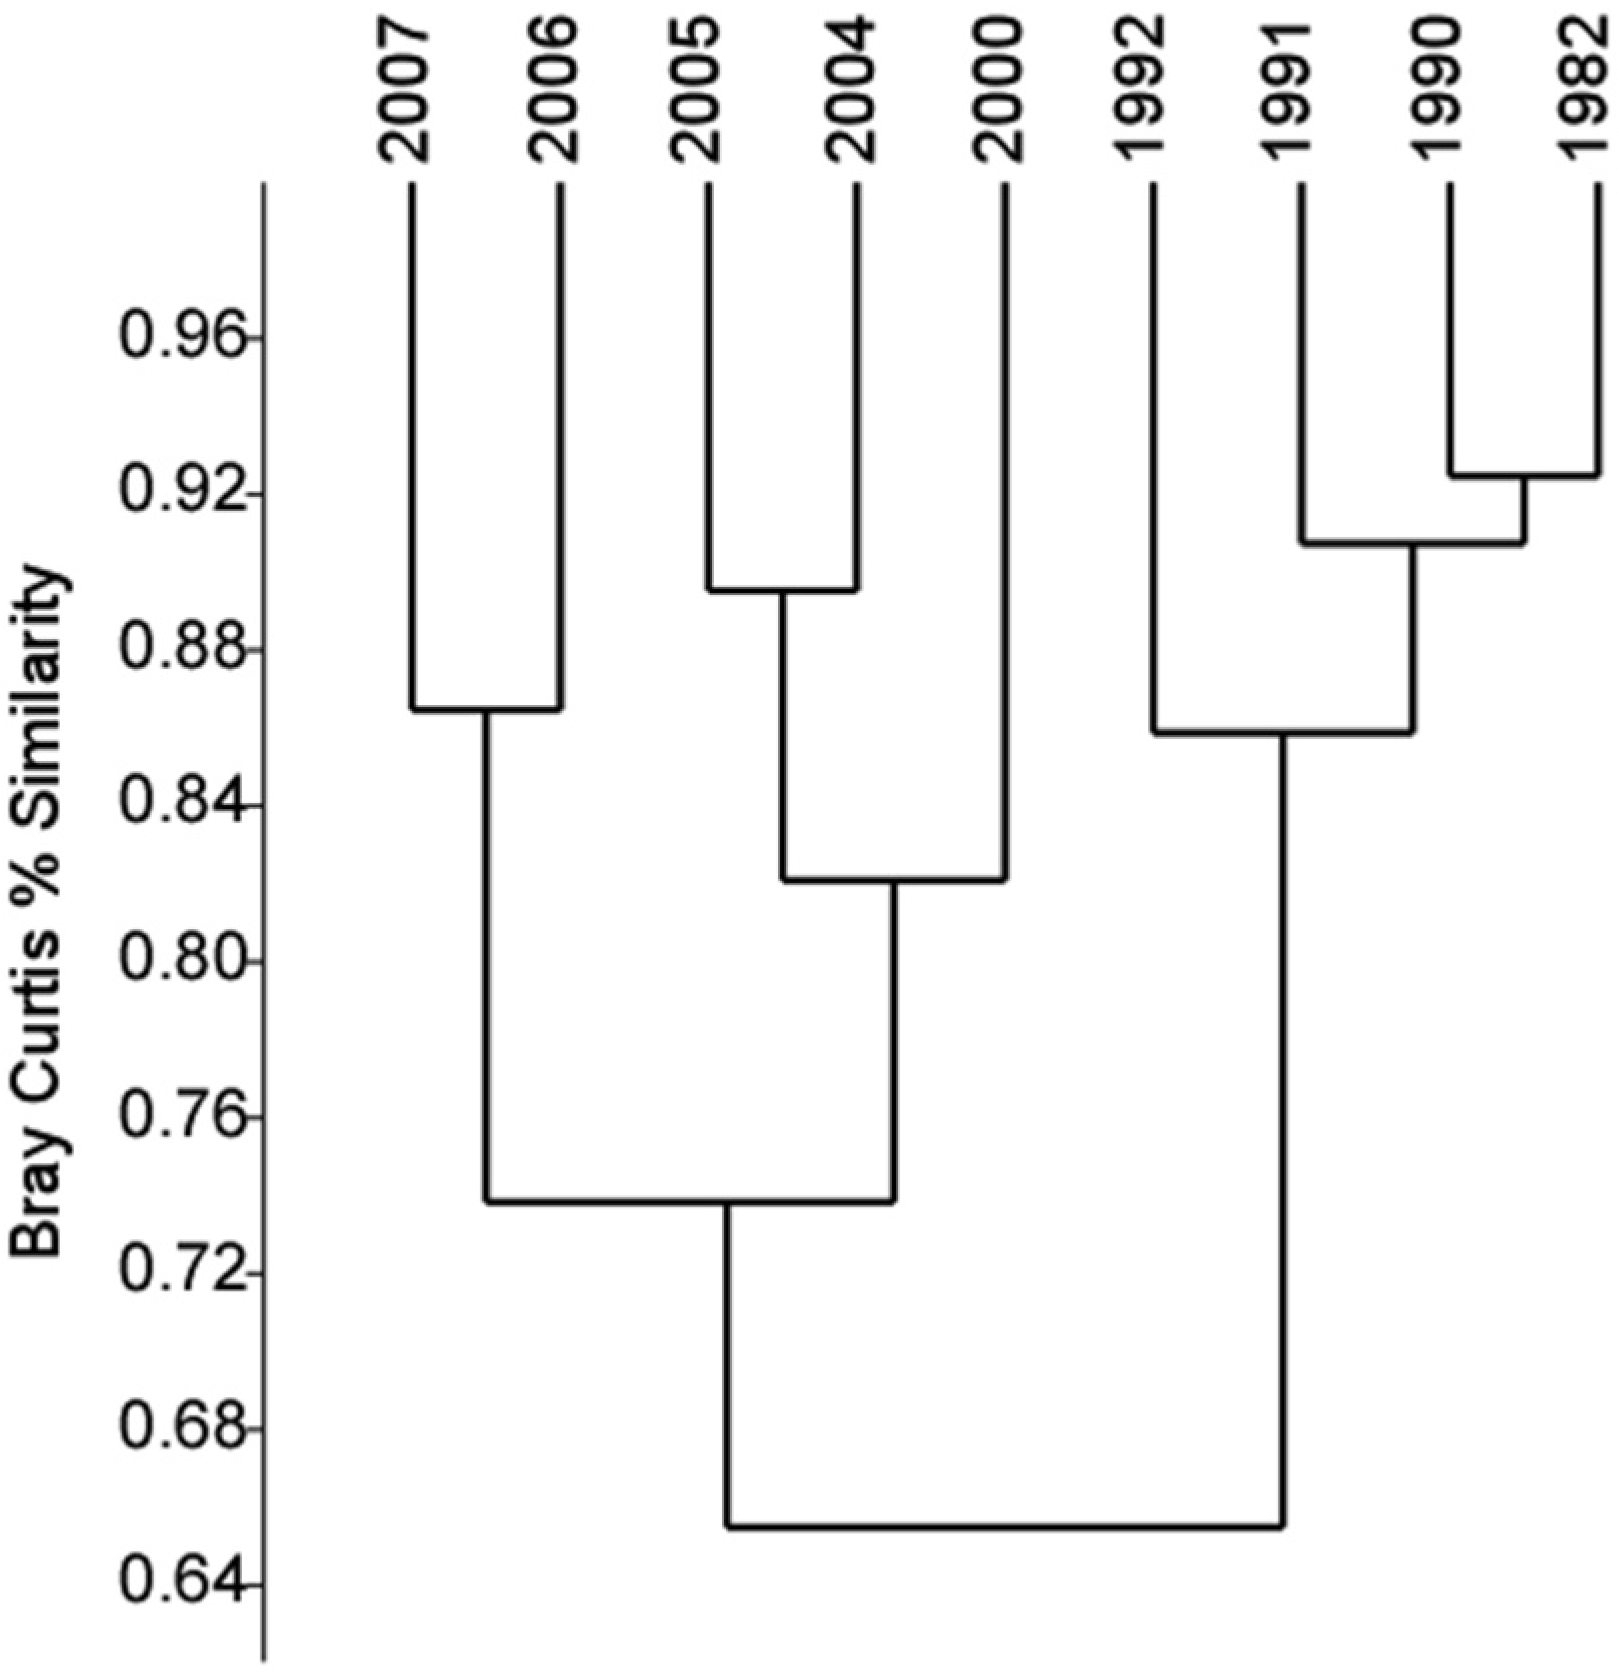
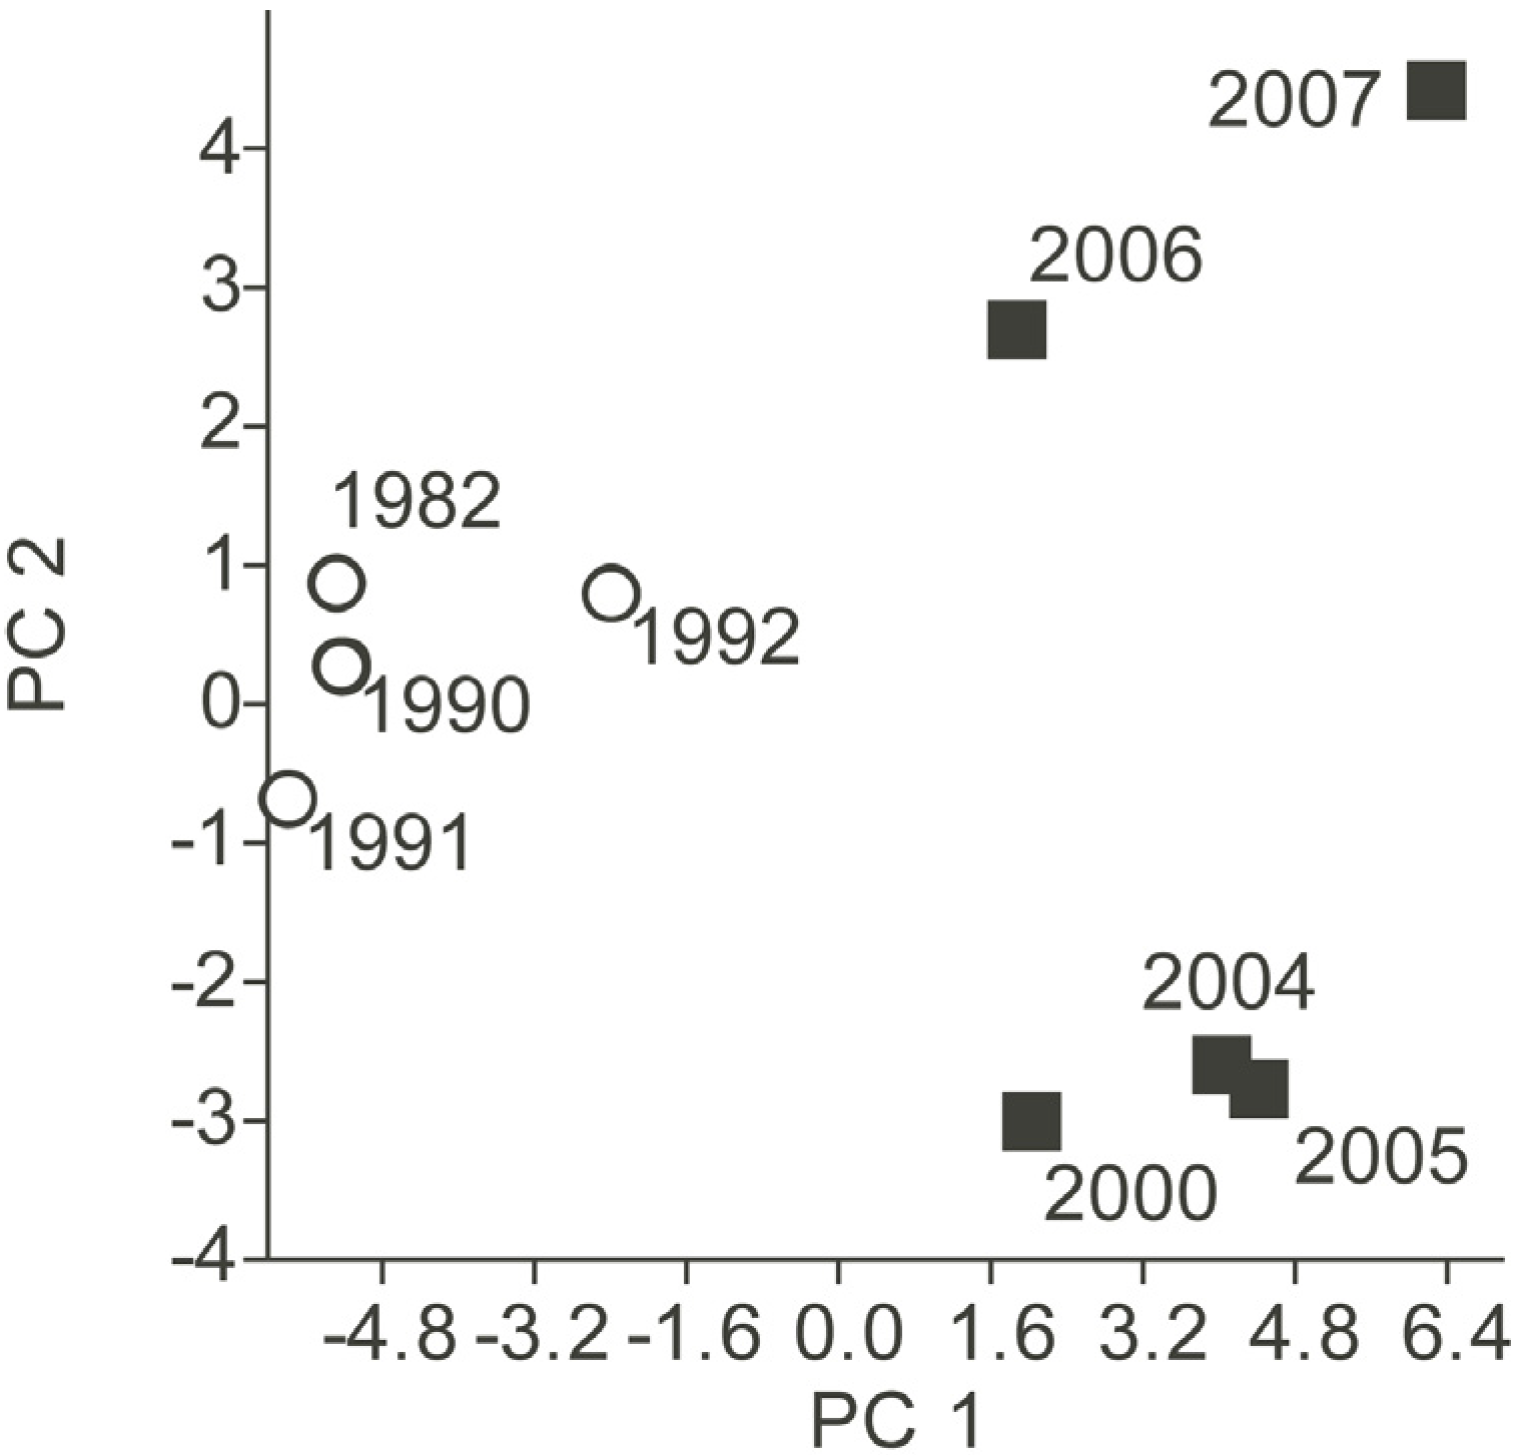
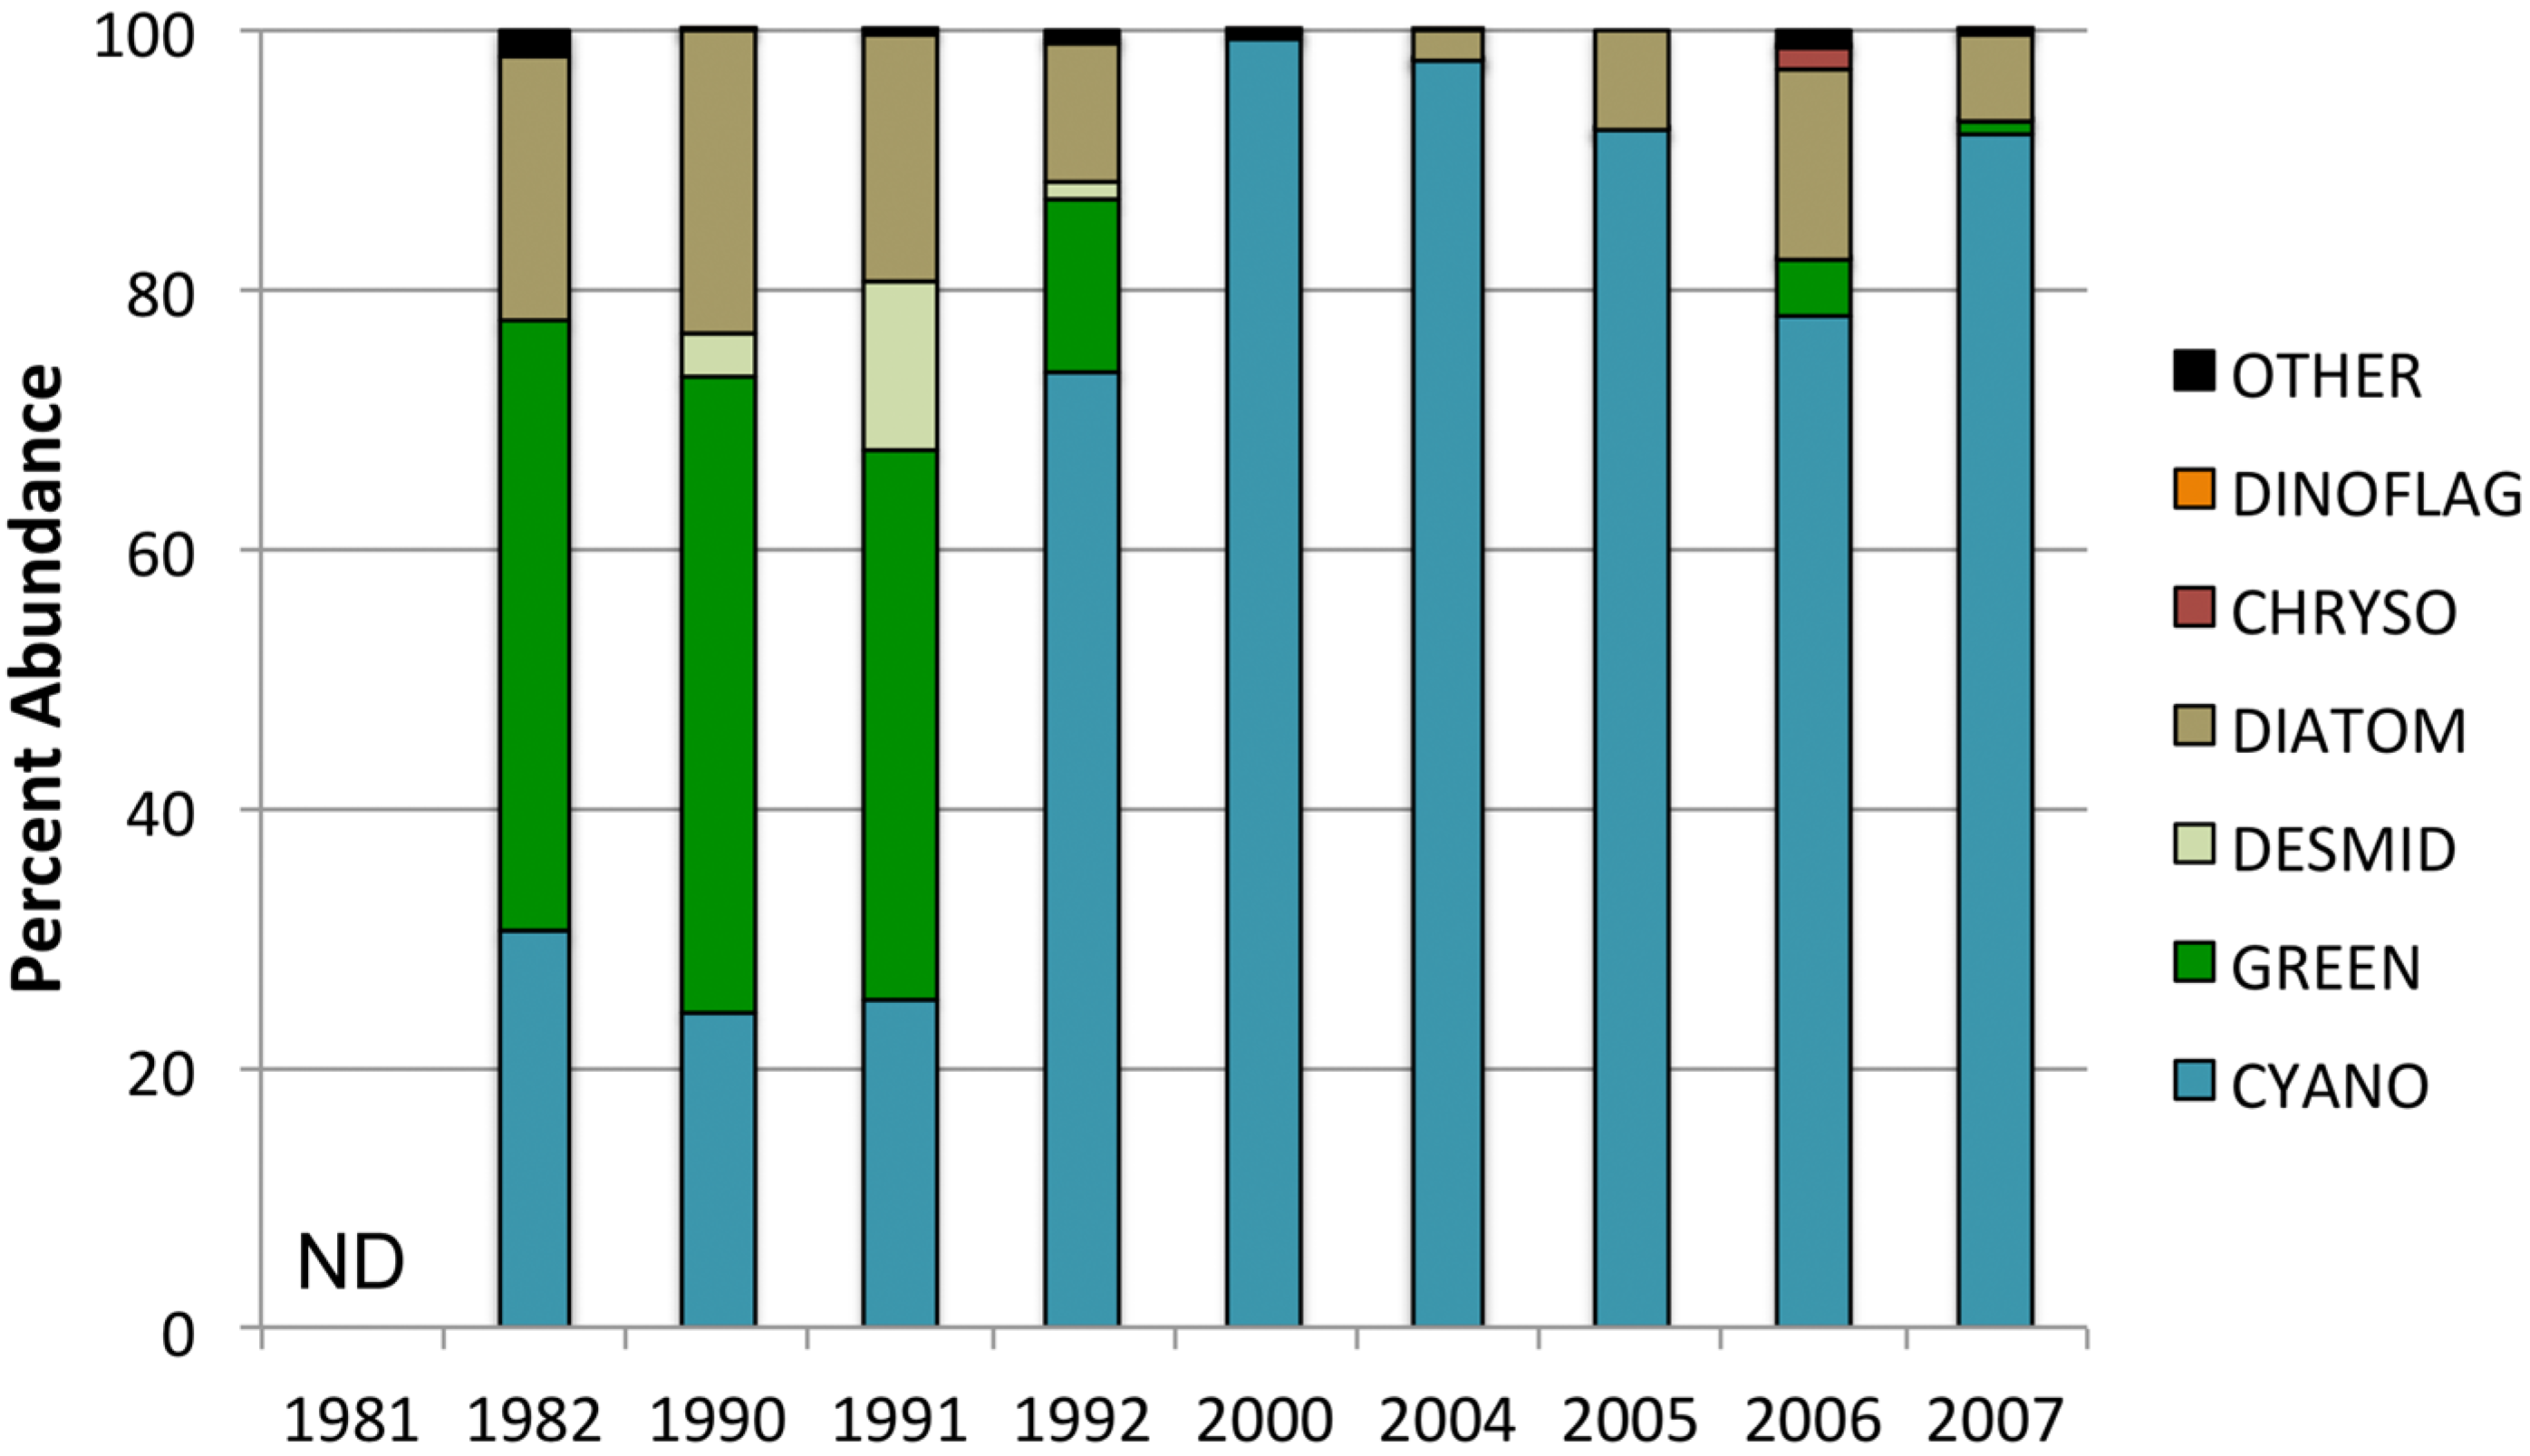
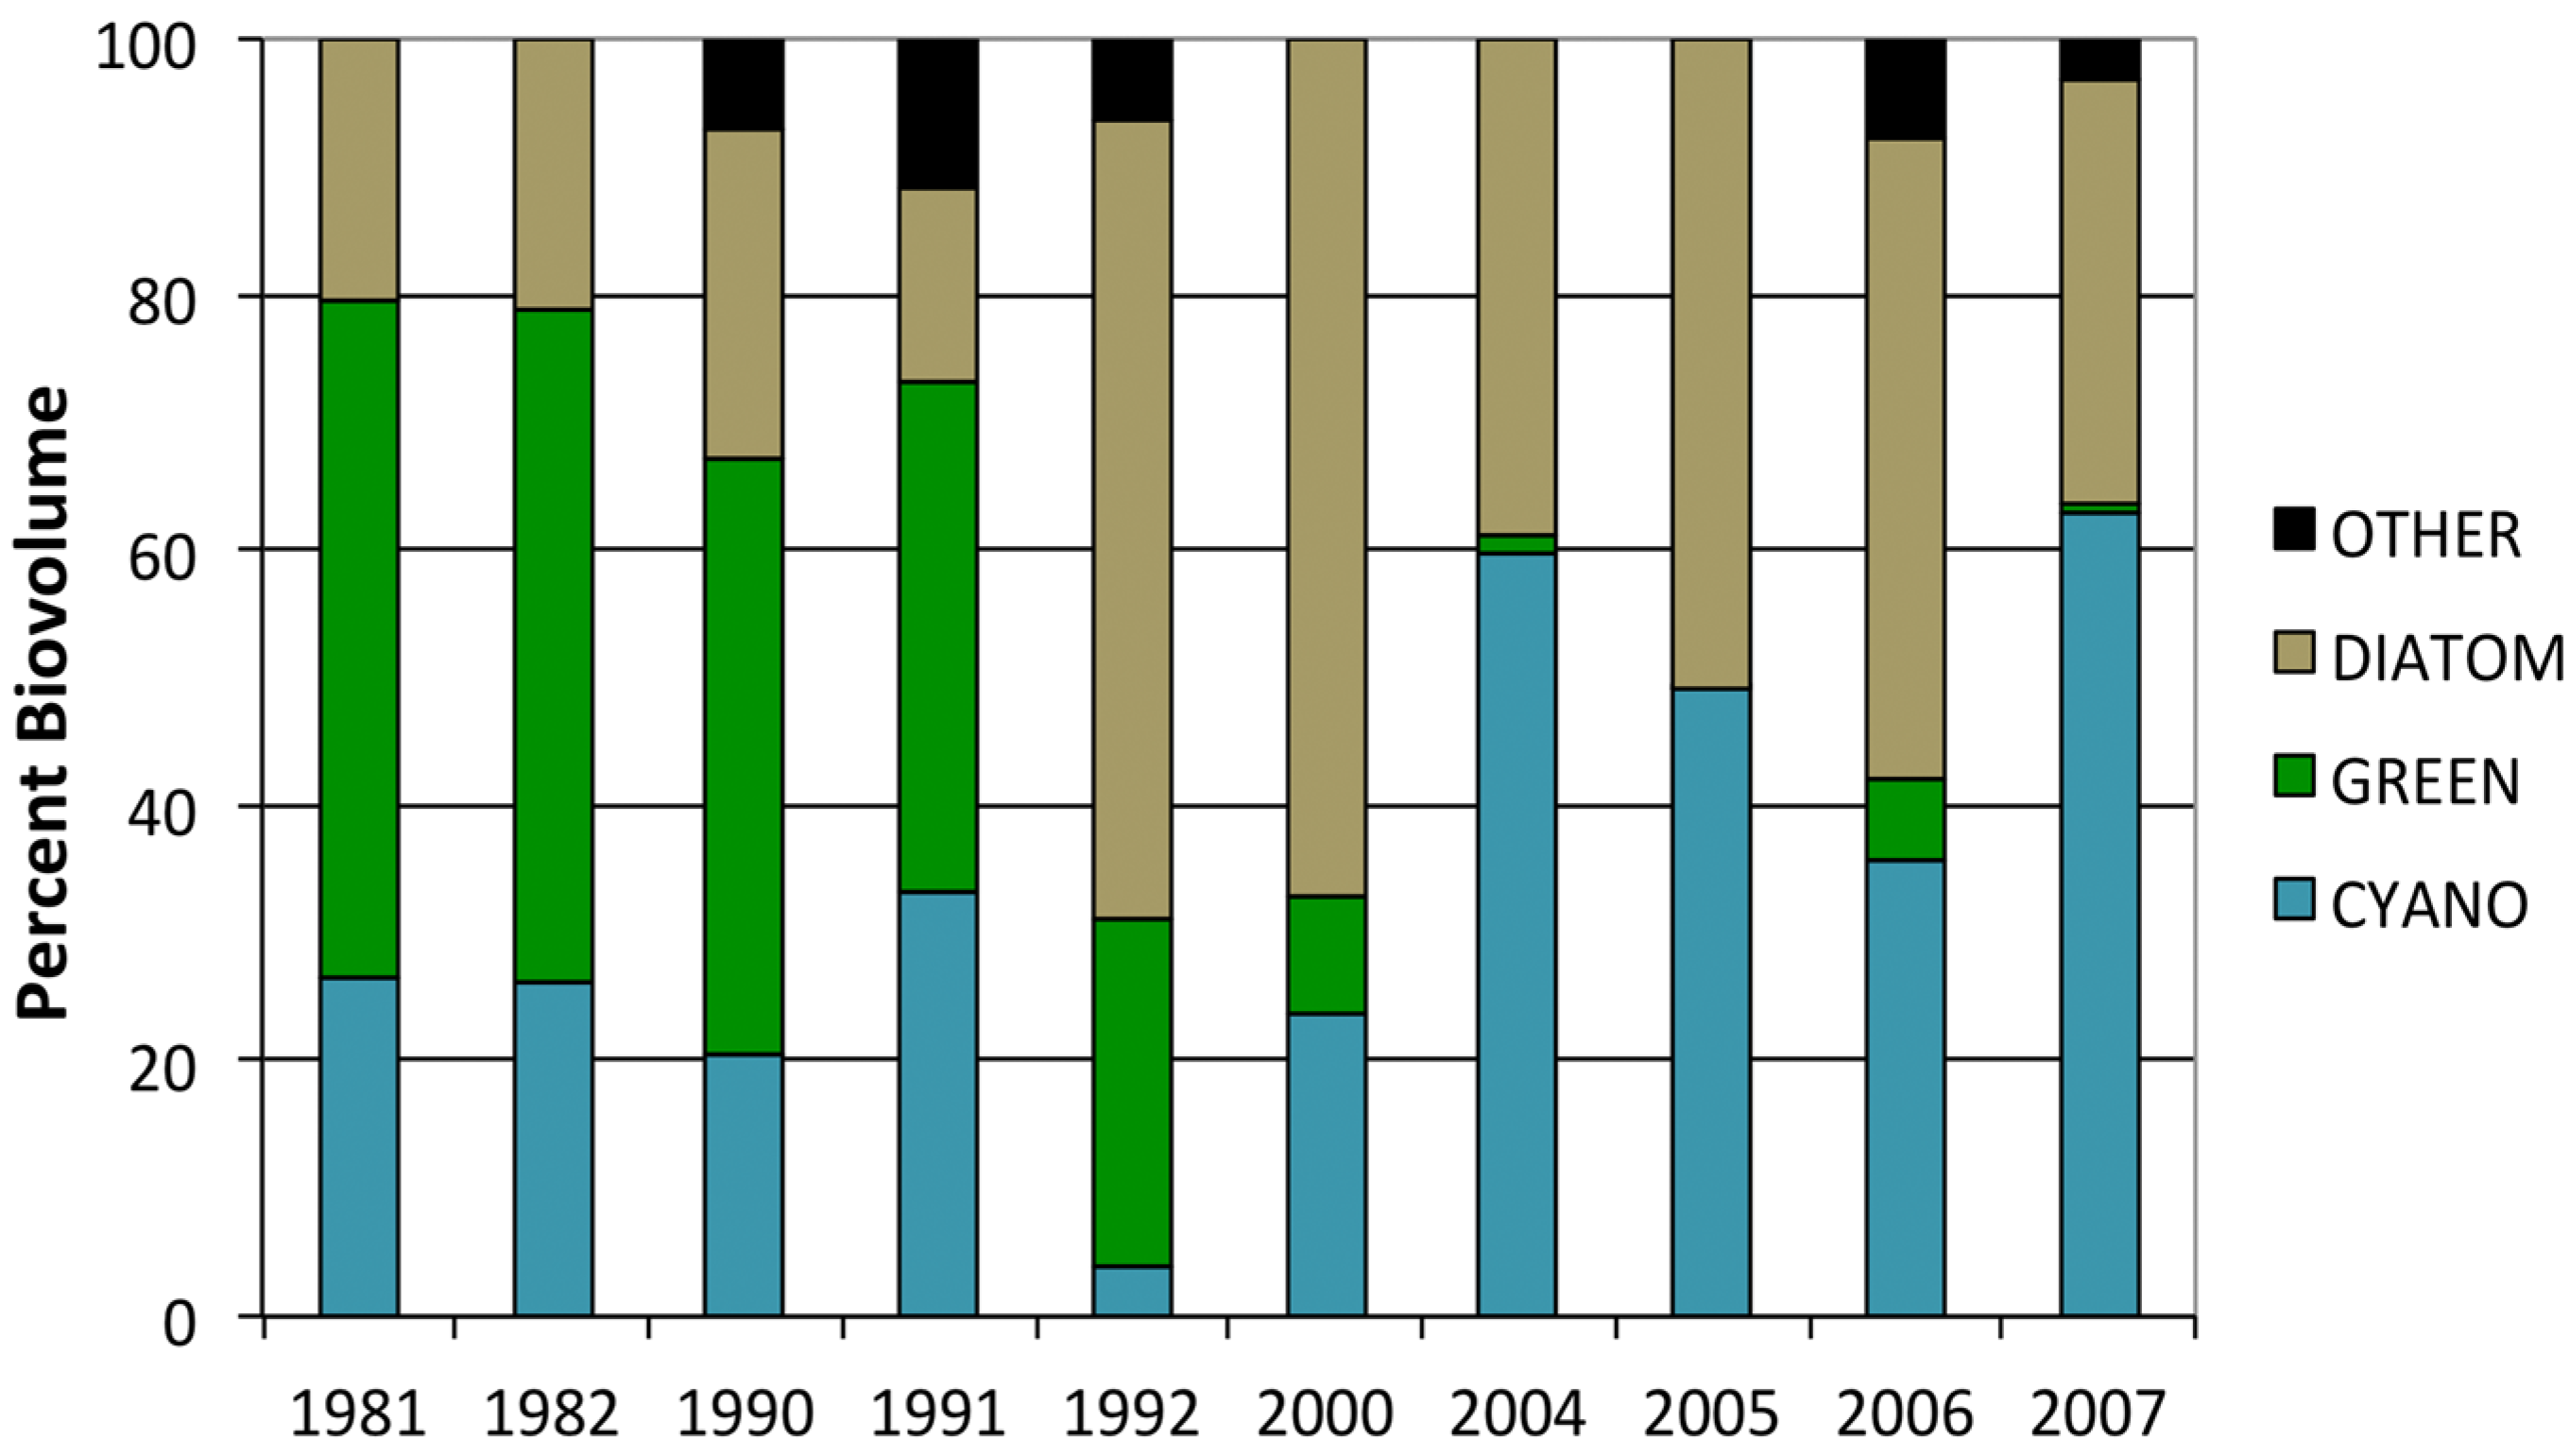
3.2. Phytoplankton Community Composition

There were evident changes in phytoplankton-community composition and biodiversity over time. Analysis of phytoplankton-community count data from the inner bay grouped in seven higher-level taxonomic categories resulted in identification of two distinct time periods in the time series (Figure 4). These periods correspond to years prior to establishment of dreissenids (before 1993), and years after mussel invasion (2000 through 2007). There is also a separation between years of 2000–2005 and 2006–2007 at a similarity level of approximately 75%. The low similarity between the pre- and post-invasion time periods indicates a clear shift in community composition after mussel invasion.
Figure 4. Dendrogram derived from cluster analysis of percent similarity values for the seven-taxa matrix of average summer phytoplankton community counts in the inner bay locations of Green Bay.
Diversity 06 00681 g004
Principal component analysis of the same data highlights clear changes in phytoplankton community composition and abundance over time (Figure 5). The first two principal components accounted for 90.4% of community variation, and ordination results indicate obvious separations of pre- and post-invasion years. The first component is positively and strongly influenced by cyanobacteria and negatively by non-desmid and desmid green algae (Table 1). Post-invasion years showed increased dominance of cyanobacteria and decreases in the importance of green algae. Separation of the two time periods is also evident from changes in PC scores of the first component across time, where a significant shift occurred in 2000 (Figure 6). This shift was statistically significant based on the ANOSIM analysis with 9999 permutations (p = 0.0089), further indicating a change from importance of green algae before invasion to dominance by cyanobacteria after invasion. The second principal component separates the years based primarily on chrysophyte, non-desmid green algae and diatom abundance (Table 1), which provides further insight into differences observed in cluster analysis between post-invasion years (i.e., 2000–2005 vs. 2006 and 2007).
Figure 5. Principal component analysis ordination of Bray–Curtis community similarities based on the 7-taxon matrix of average summer phytoplankton counts for the inner bay of Green Bay. The first two principal components account for 90.4% of the total variation of the community similarities. Open circles indicate the pre-invasion years (1982–1992), filled squares show post-invasion years (2000–2007).
Diversity 06 00681 g005
Table 1. Principal component analysis loading values for the 7-taxon matrix of phytoplankton counts for inner bay sites in Green Bay.
TaxonAxis 1Axis 2
Cyanobacteria0.8950.091
Non-desmid green algae−0.2810.473
Desmids−0.2370.211
Diatoms0.1720.425
Non-diatom Chrysophyta0.1190.641
Dinoflagellates−0.1050.165
Other−0.0940.326
Figure 6. First principal component axis scores for the 7-taxon matrix of phytoplankton in the inner bay of Green Bay. Open bars are pre-invasion years, black bars are post-invasion years. Dashed line indicates mean scores and shift using Regime Shift Detection (RSD) procedures, with significance confirmed by permutation testing with ANOSIM (p = 0.008).
Diversity 06 00681 g006
Changes in relative abundance of higher-level taxonomic categories over time clearly show increased dominance of cyanobacteria after invasion by dreissenid mussels (Figure 7, top panel). The pre-invasion phytoplankton community was characterized by relatively similar proportions of cyanobacteria, green algae and diatoms. Beginning in 1992, the year just prior to the date of successful establishment of the zebra mussel [27], there was a decrease in the relative abundance of green algae and diatoms. Both desmid and non-desmid green algae occurred in very low abundances from 2000 onwards. Phytoplankton communities in 2006 and 2007 included more non-desmid green algae and chrysophytes than earlier years (2000–2005), which supports separation of these years in the cluster analysis and PCA. Conversion of count data into biovolume units also shows shifts in community composition (Figure 7, bottom panel). Diatoms became a more important component of the phytoplankton total biovolume during post-invasion years compared to earlier years and cyanobacteria increased in importance.
Figure 7. Mean summer phytoplankton community composition as percent of cell abundance (top panel) and percent of total biovolume (bottom panel) for the inner bay of Green Bay. Post-invasion years are 2000–2007.
Diversity 06 00681 g007aDiversity 06 00681 g007b
Phytoplankton counts for station GB6 are more limited, but also demonstrate an increased abundance of cyanobacteria after mussel invasion. Total cyanobacteria abundance was significantly greater than pre-invasion abundance in all years for which data are available (Table 2). Cyanobacteria abundance was low at station GB6 prior to mussel invasion, which reflects the meso-oligotrophic condition at this location.
Table 2. Total cell abundance of cyanobacteria at station GB6 in Green Bay. Post-invasion years are 2000–2007. Summer means and 95% confidence limits were back-transformed from log-transformed values. Significance values for post-invasion years were compared to 1982 with t-tests using the log-transformed data.
YearNMean Abundance (Cells mL−1)Lower 95% LimitUpper 95% LimitSignificance (p-Value)
1982616.913.121.9-
200032,129.61,925.62,355.20.000001
200435,732.12,974.311,046.90.0059
200652,384.11,223.74,644.90.0008
200752,978.81,753.05,061.70.0001
The observed changes in dominance by cyanobacteria were not as predicted based on differences in total phosphorus among years (Figure 8). Percent dominance by cyanobacteria in pre-invasion years was well below the predicted levels based on published relationships [35,36]. Cyanobacteria contribution to total phytoplankton biovolume as a function of TP was higher in most years following the invasion, suggesting a change in factors determining phytoplankton community composition.
There were significant changes in genus-level richness following invasion by dreissenid mussels (Table 3). Green algae richness decreased significantly following invasion (H′ = 5.06, df = 1, p = 0.024), while number of diatom genera increased significantly (H′ = 5.122, df = 1, p = 0.024). Richness of the other important genera did not change significantly between the two time periods. Taken together, multivariate analyses of the phytoplankton community in lower Green Bay indicate a clear regime shift over the past 30 years, consistent with the timing of the invasion by dreissenid mussels.
Figure 8. Relative contribution of cyanobacteria to total phytoplankton biovolume as a function of total phosphorus in the inner bay of Green Bay. Black dots indicate mean summer values for pre-invasion years while green triangles show post-invasion years. Lines are predicted relationships based on comparison of a cyanobacteria (blue green algae) index to TP where BG Index = ln (%B/(100%BG) (from [35]). The plotted lines are from published equations from [35]: BG Index = −5.00 + 2.62 log10 * (TP) and [36]: BG Index = −4.16 + 1.88 log10 * (TP).
Diversity 06 00681 g008
Table 3. Total number of phytoplankton genera observed throughout the year (i.e., genus-level richness) for major taxonomic groups at inner bay sites in Green Bay. Post-invasion years were 2000–2007.
YearCyanoGreenDiatomDinoflagChryso
1990620912
1991619810
1992721922
20006161011
20046111810
2005431610
20066161621
20076121512

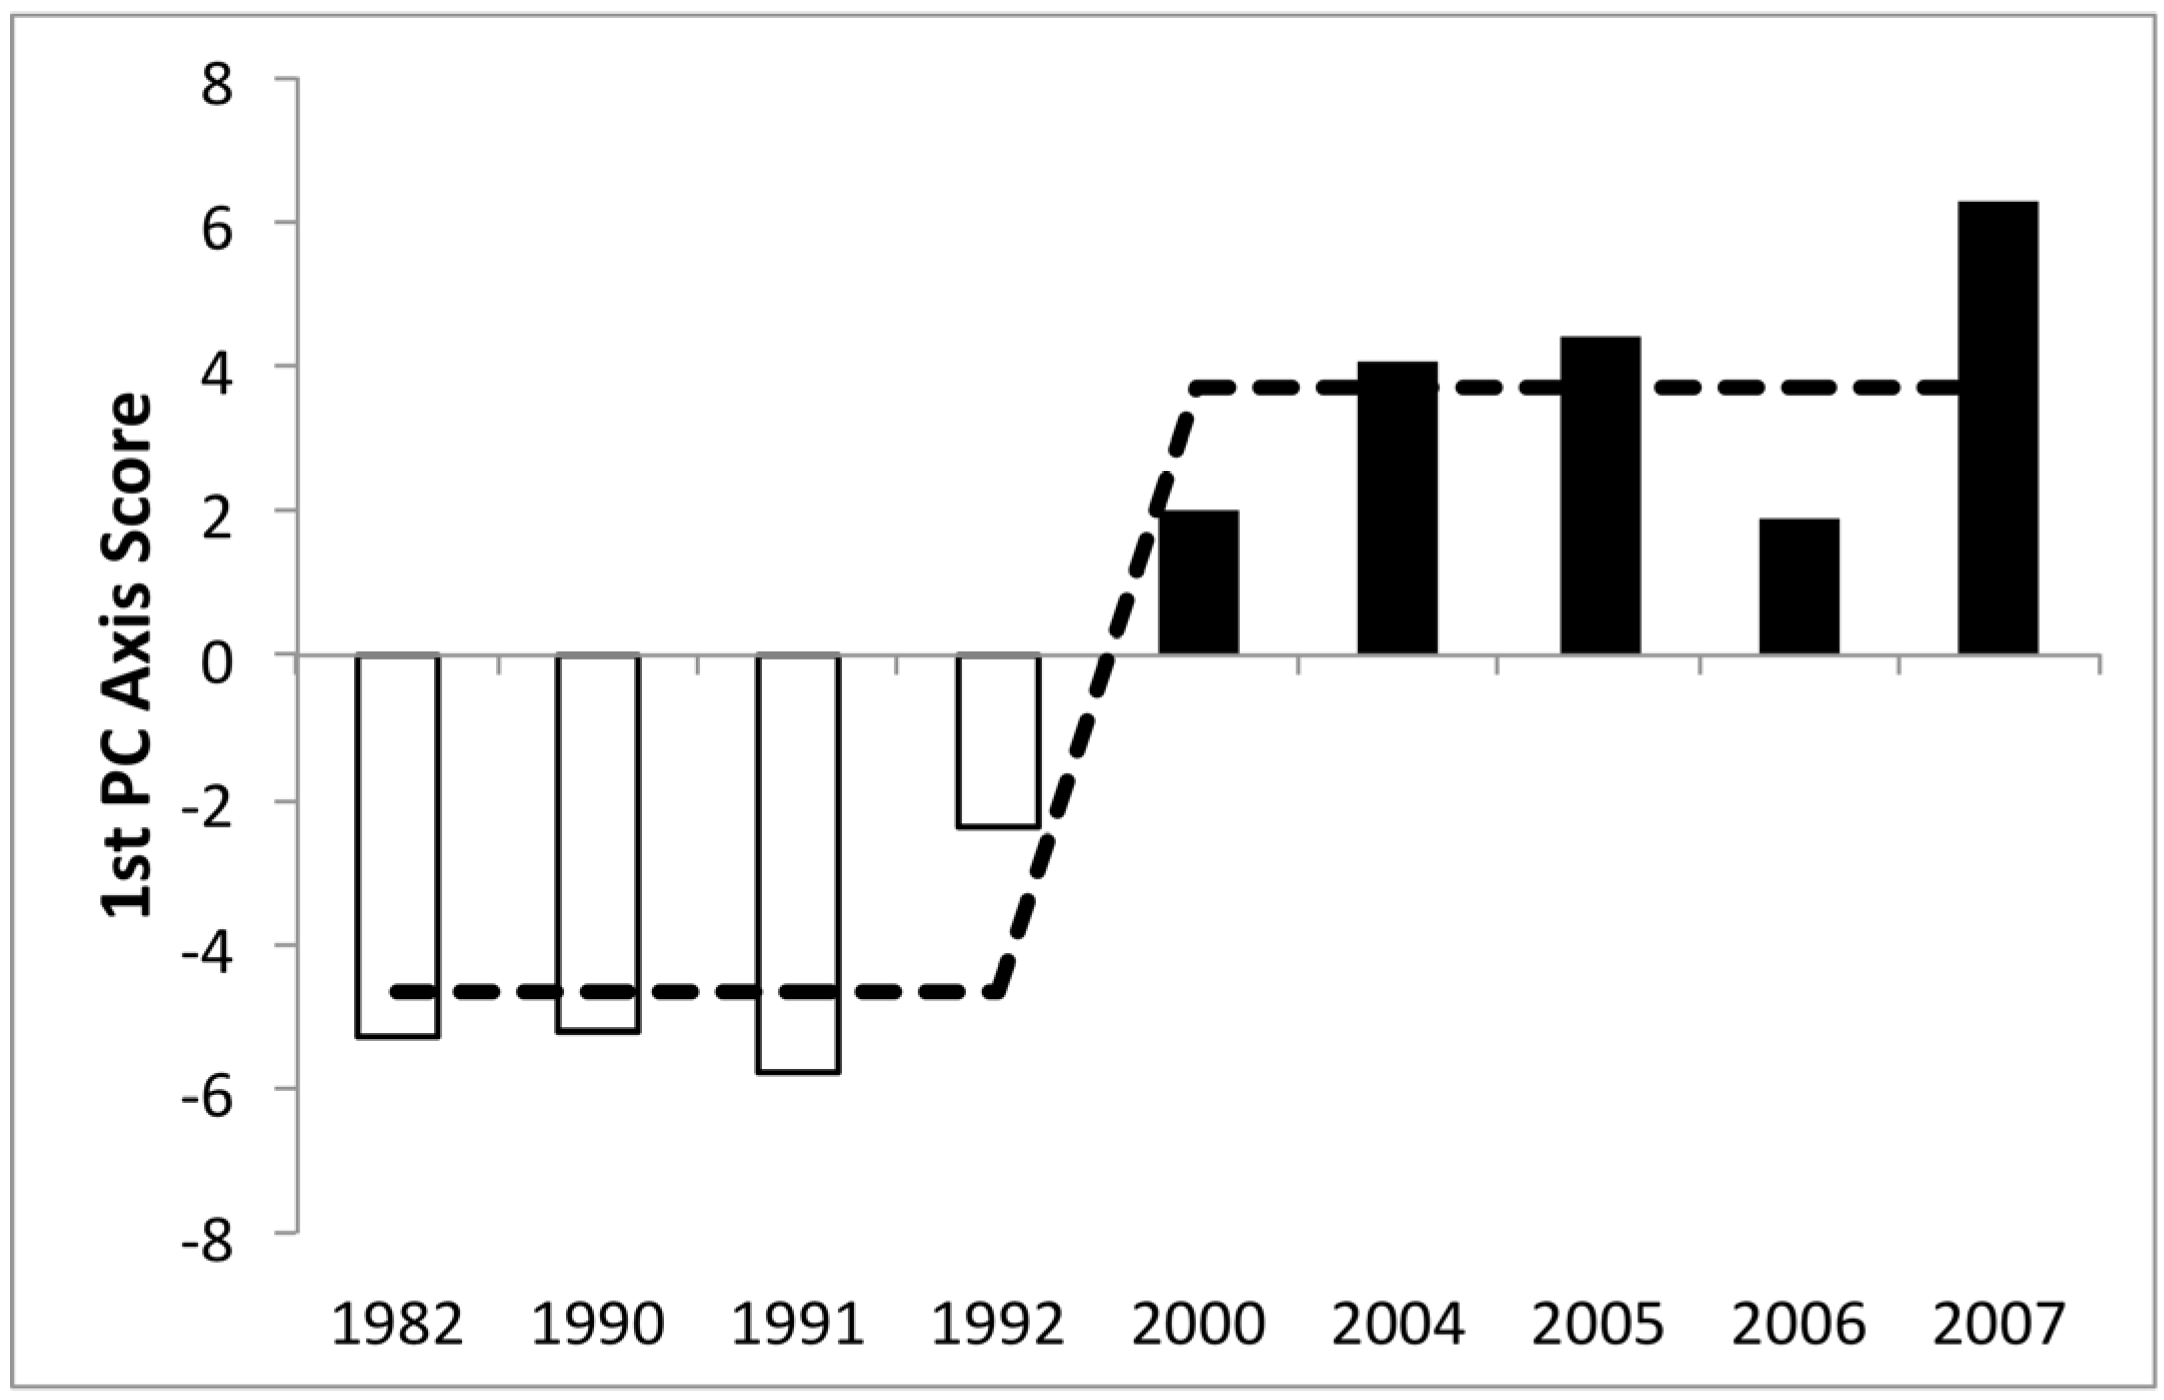
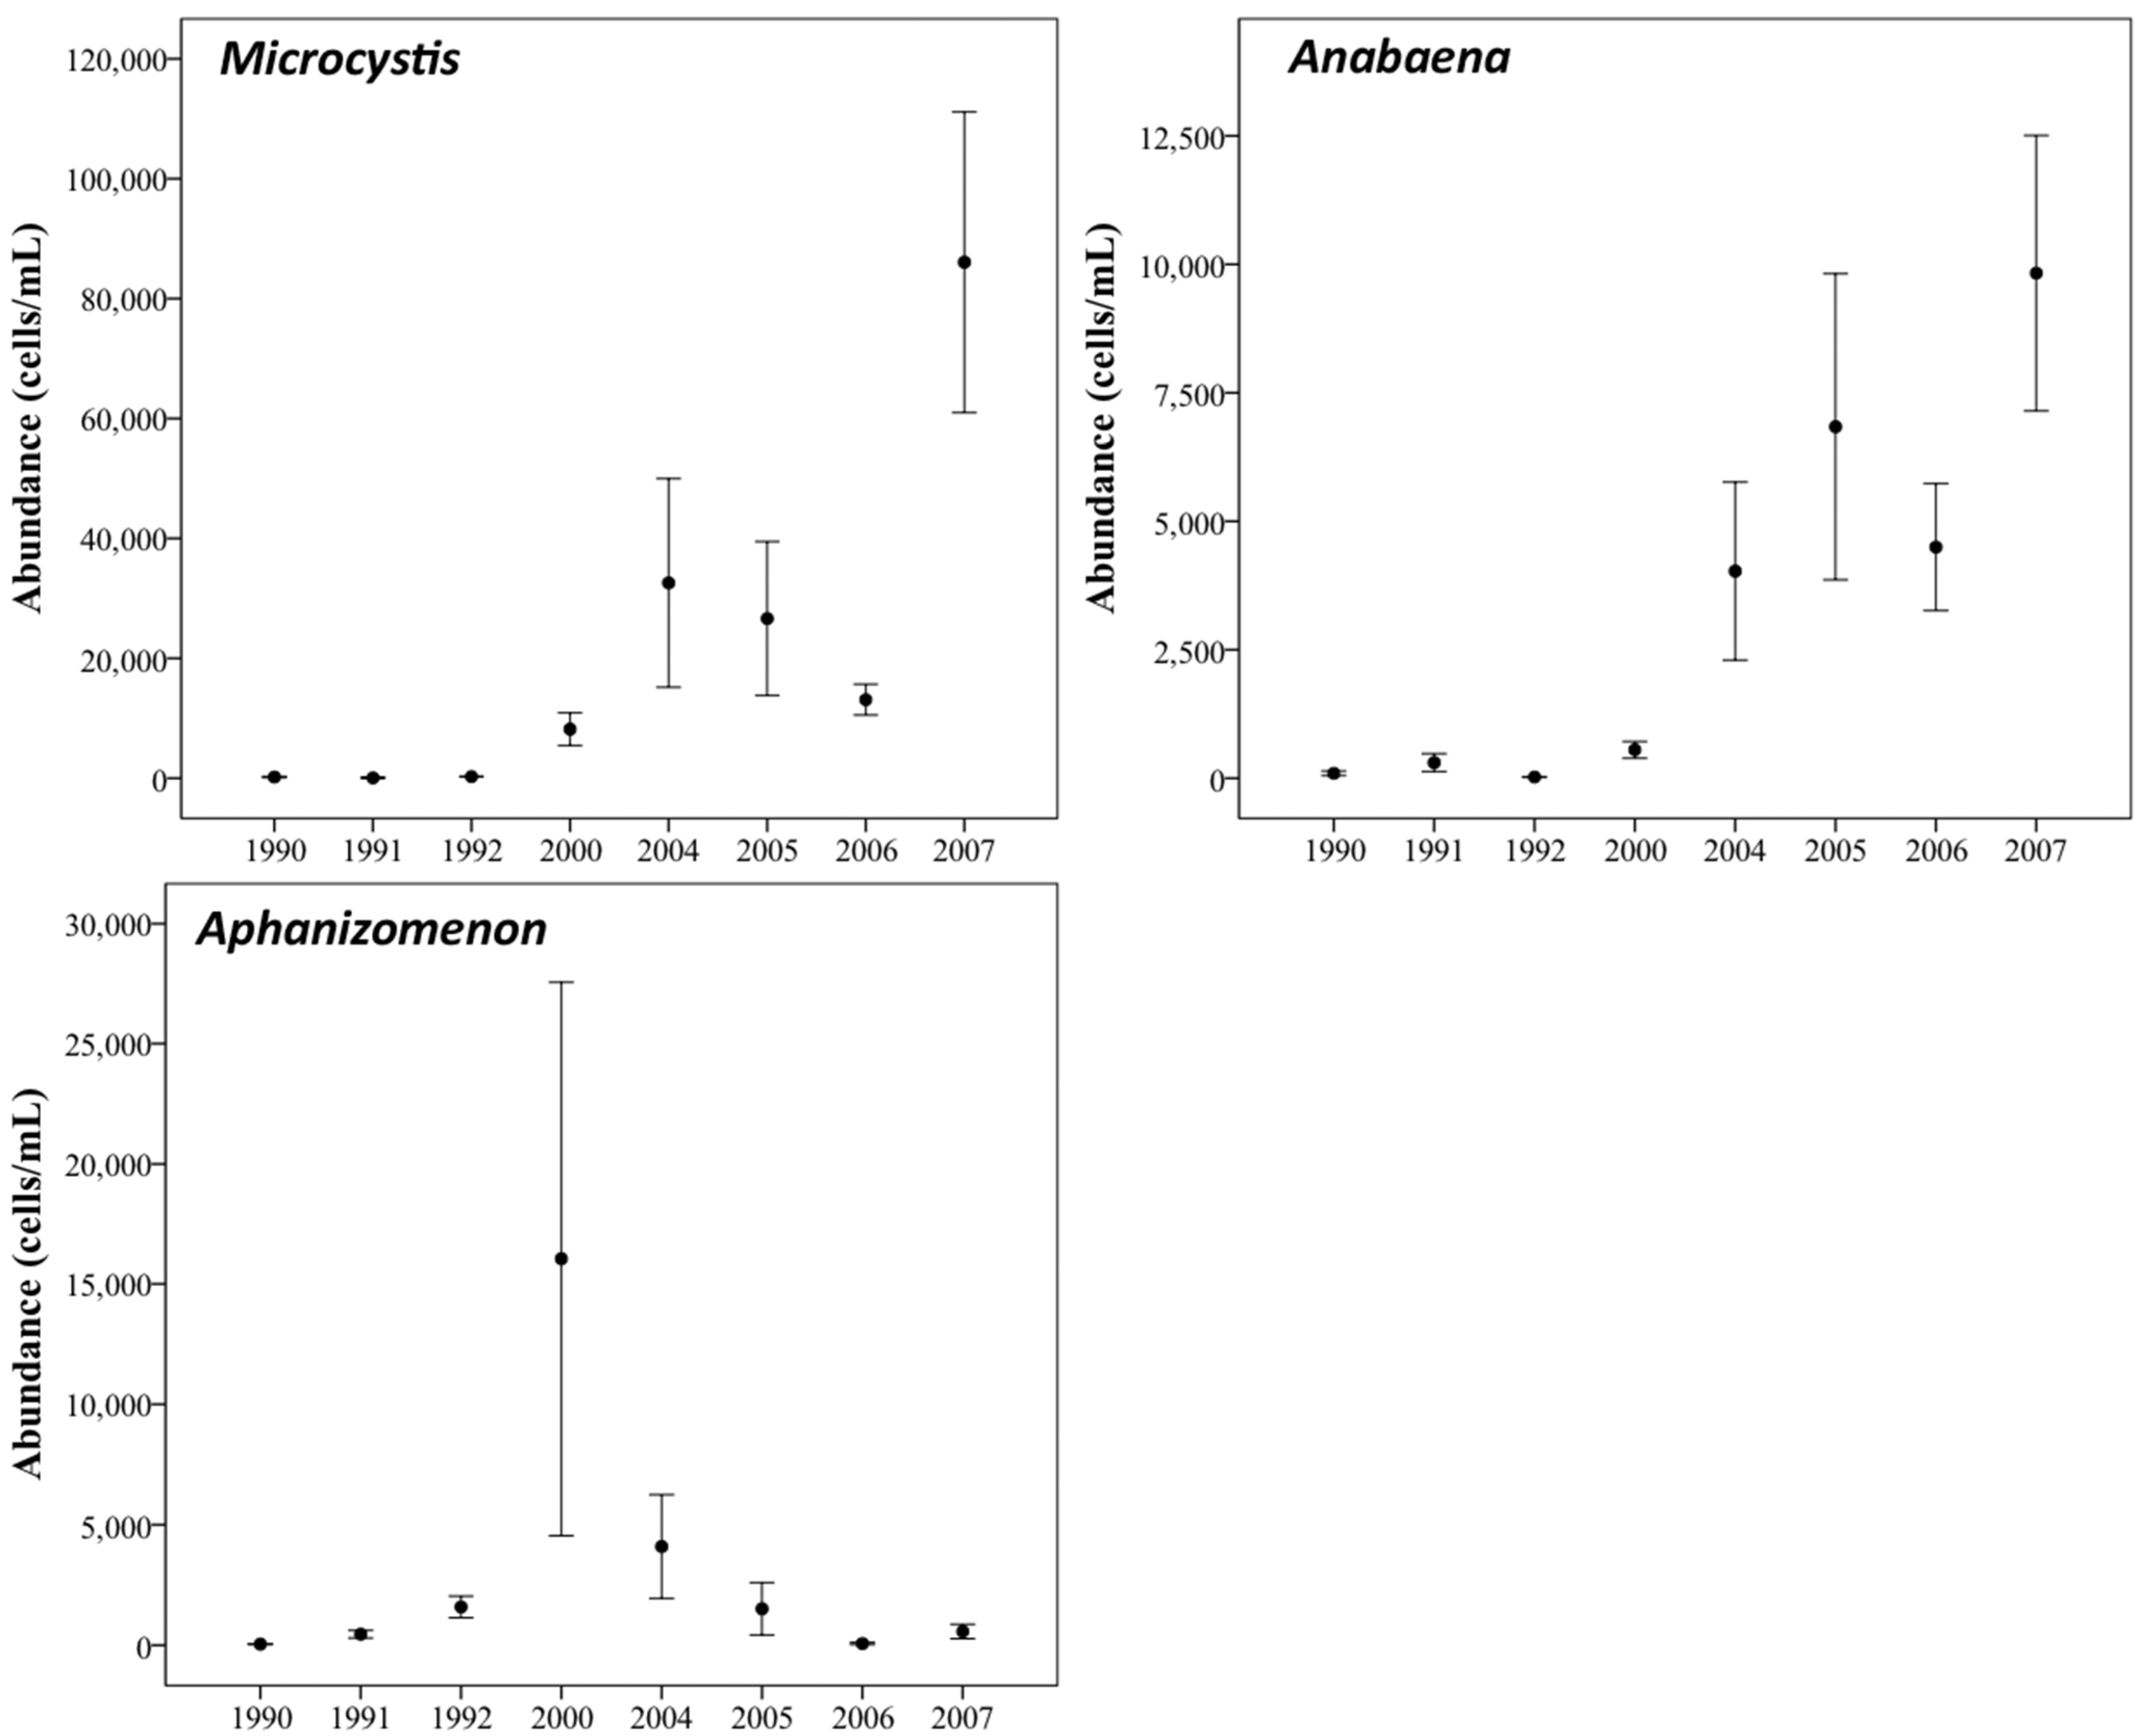
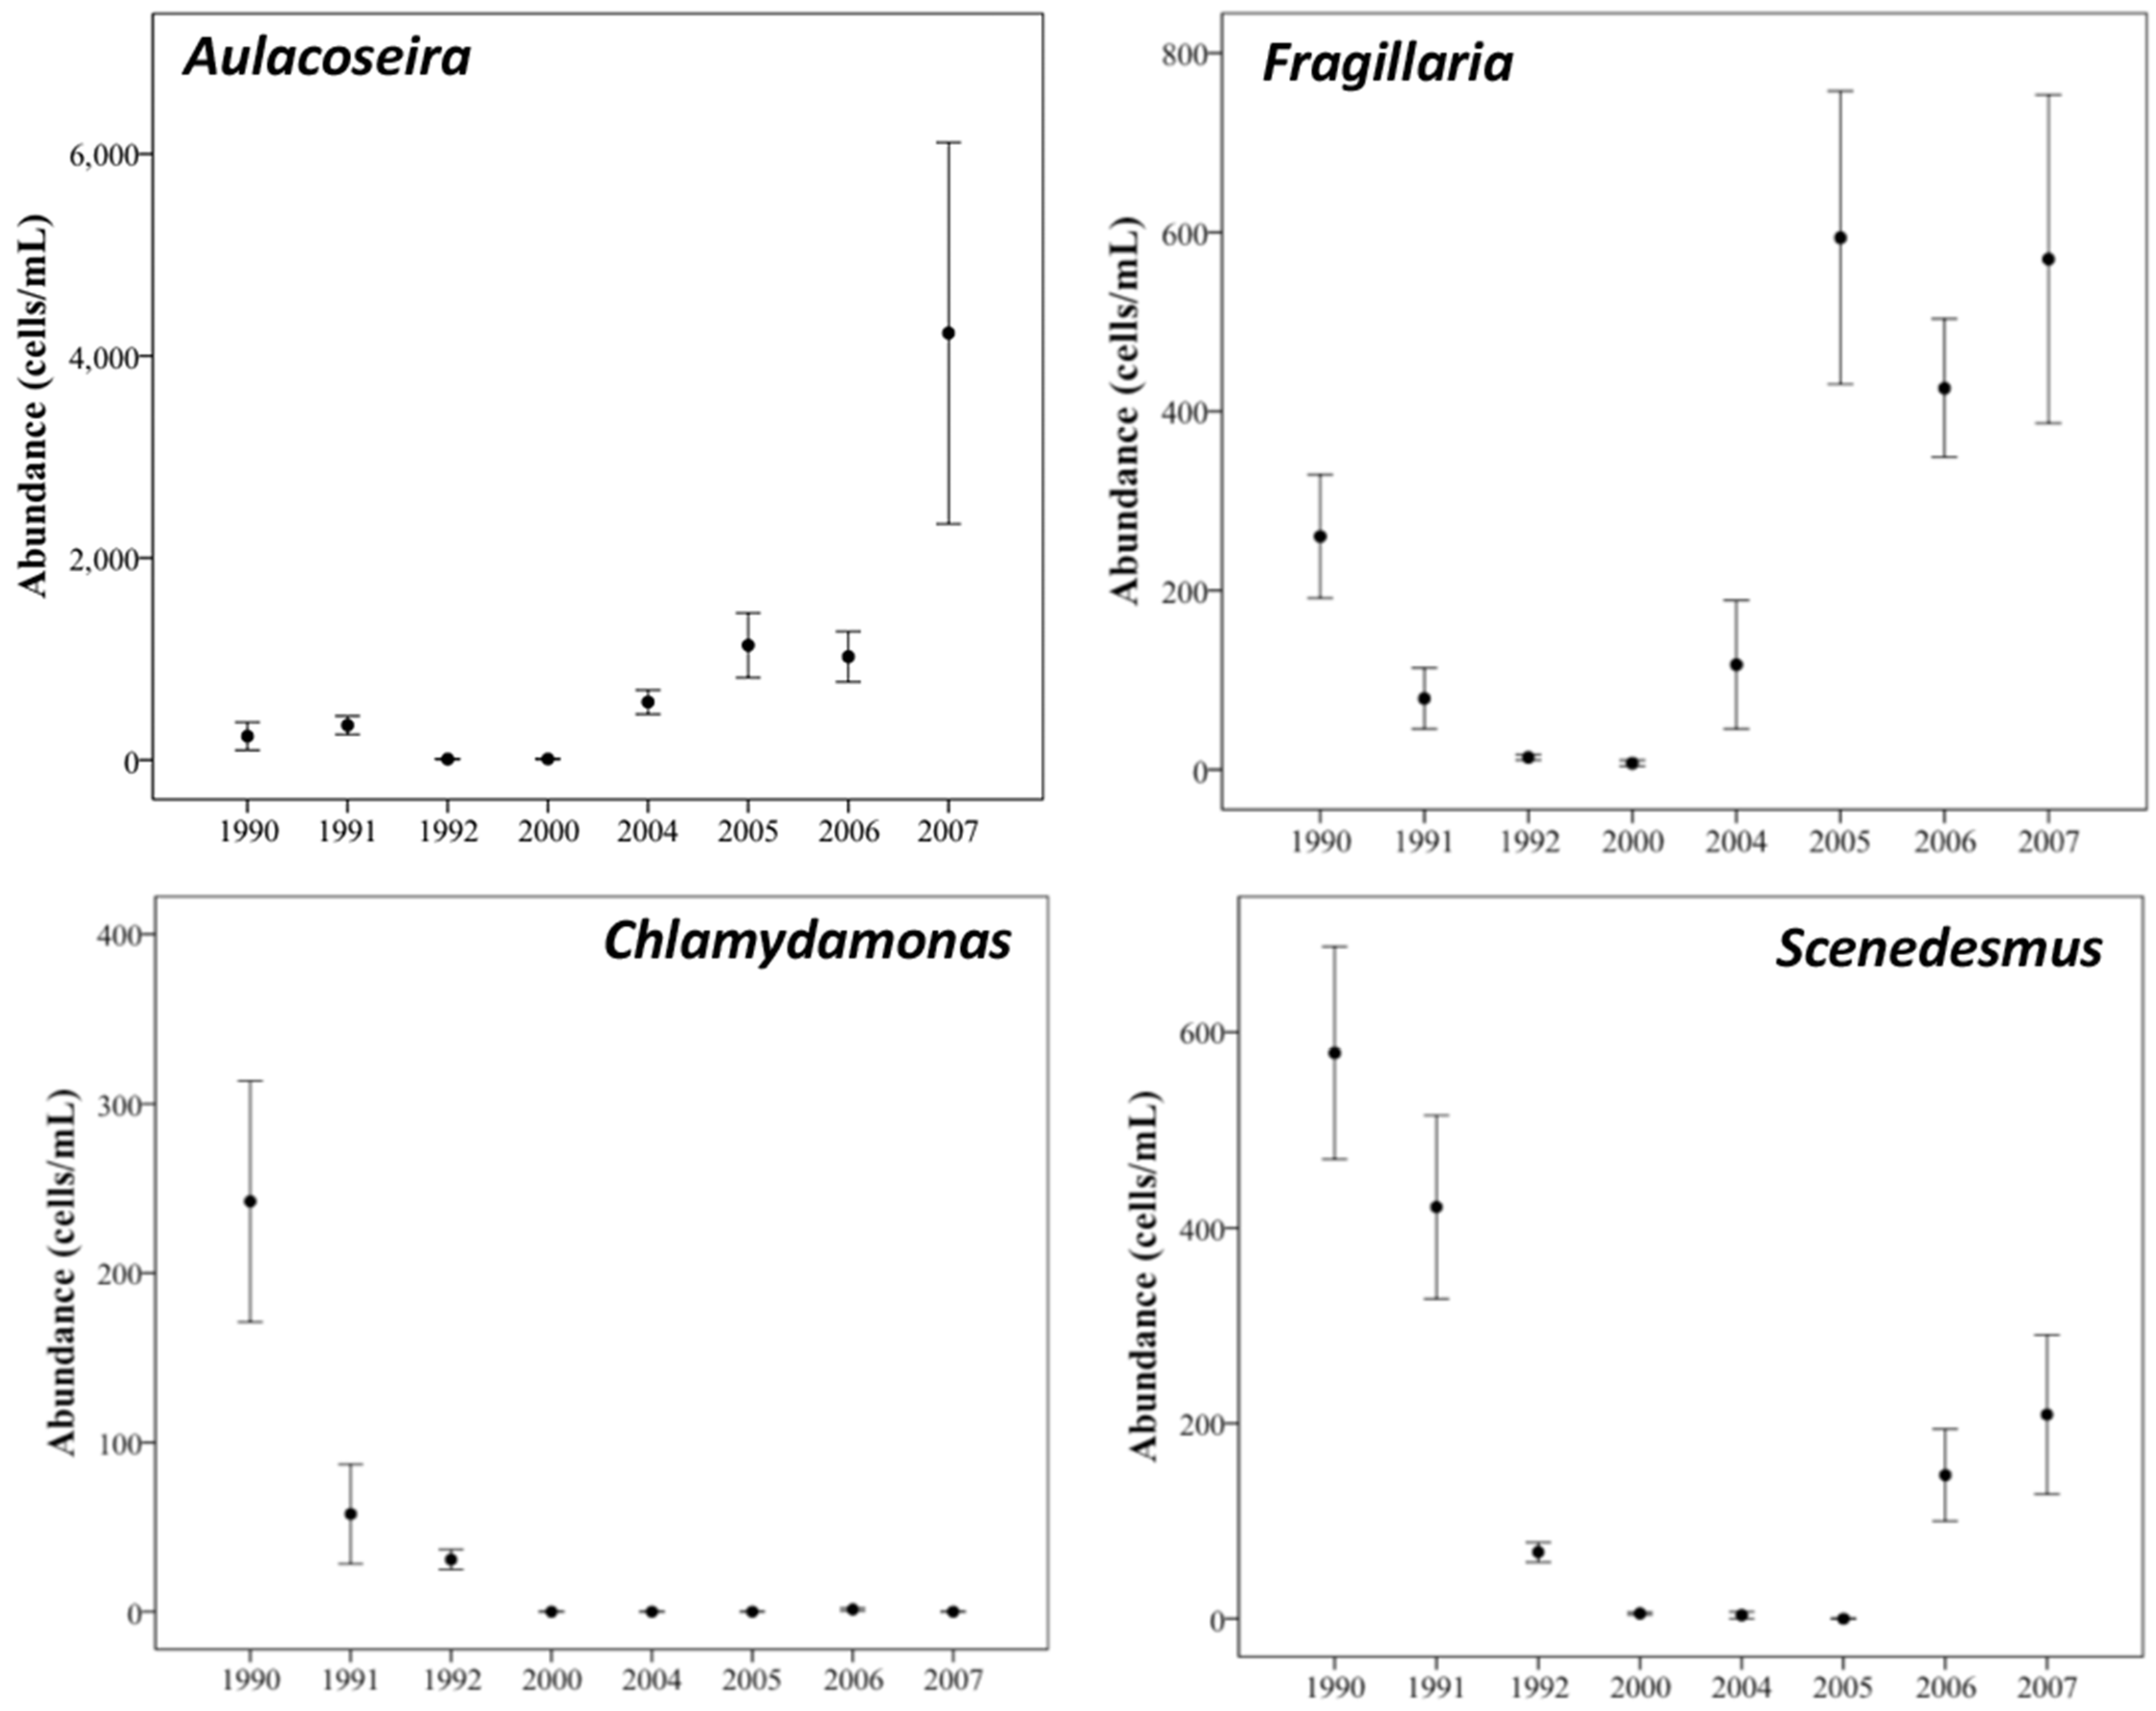
3.3. Changes in Abundance over Time

The clear shift to dominance by cyanobacteria has been driven mostly by increases in abundance of the genera Microcystis and Anabaena (Figure 9). Microcystis was present at low levels in years before invasion, but exhibited dramatically higher abundances in later years, often reaching 20,000–80,000 cells mL−1. Before invasion this group was primarily observed in late July and August, but from 2000 onwards occurred throughout the summer. A similar pattern was observed for Anabaena, but with concentrations an order of magnitude lower. The other major genus of cyanobacteria in lower Green Bay, Aphanizomenon, exhibited higher abundances in 2000–2005, but since then has decreased in concentration.
Figure 9. Summer mean abundance of Microcystis (upper left panel), Anabaena (upper right panel) and Aphanizomenon (lower left panel) in the inner bay of Green Bay. Error bars indicate ±1 SEM. Note change in scales between panels.
Diversity 06 00681 g009
Diatoms were a fairly substantial component of the phytoplankton community in this shallow, well-mixed area of Green Bay over time, but two genera in particular increased following invasion. Aulacoseira increased in abundance starting in 2004, reaching average summer concentrations as high as 4000 cells mL−1 (Figure 10, upper panels). Although seen in much lower abundances than Aulacoseira, the genus Fragilaria was also more abundant from 2005 to 2007 compared to earlier years. In addition to these changes, as mentioned above, there was a significant increase in average number of diatom genera observed during summer (Table 3). Average number of diatom genera increased from 8.67 before invasion to 16.25 for years after the invasion.
Figure 10. Summer mean abundance of select diatoms (upper panels) and green algae (lower panels) for the inner bay of Green Bay. Error bars indicate ±1 SEM. Note changes in scales between panels.
Diversity 06 00681 g010
Green algae such as Chlamydomonas and Scenedesmus were found in lower concentrations following invasion (Figure 10, lower panels). Chlamydomonas was not observed in any appreciable numbers following mussel invasion and remained rare i lower Green Bay through 2007. Scenedesmus concentrations increased again in 2006 and 2007, but did not return to pre-invasion abundances. Coincident with these changes, total number of genera of green algae observed during summer decreased significantly following mussel invasion, changing from an average of 20 genera recorded during pre-invasion years to 11.4 during post-invasion years (Table 3).

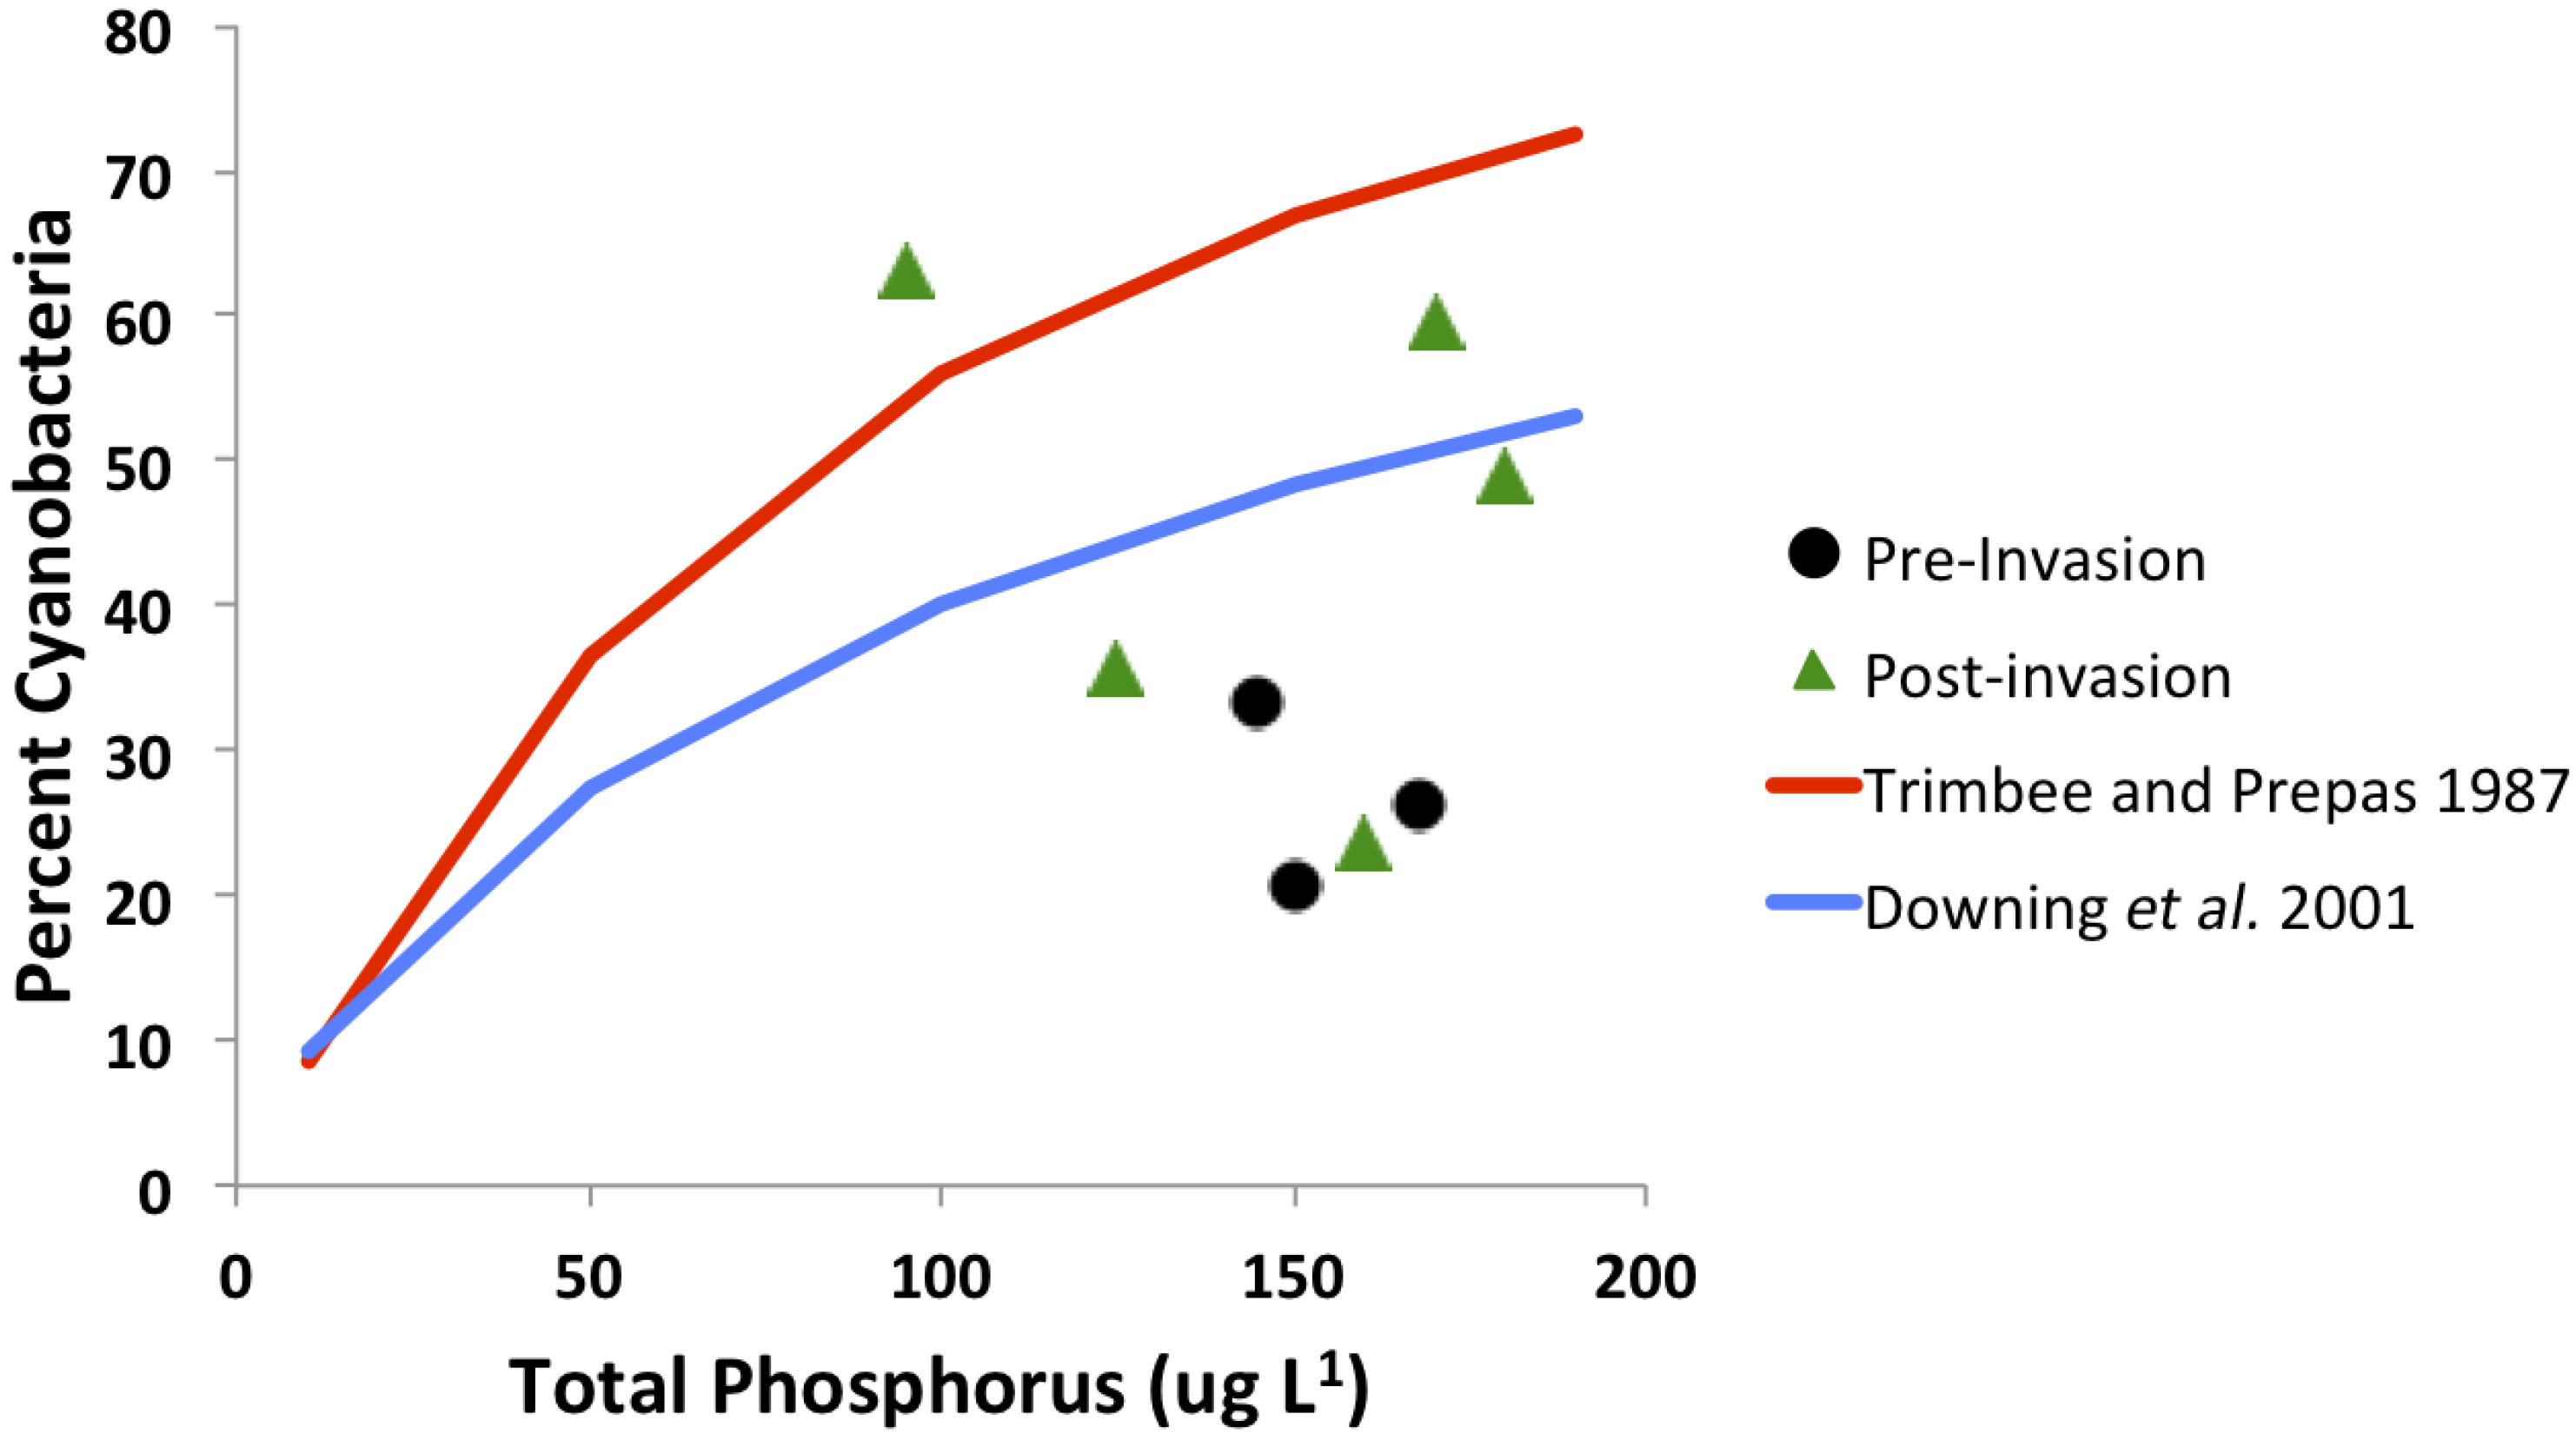
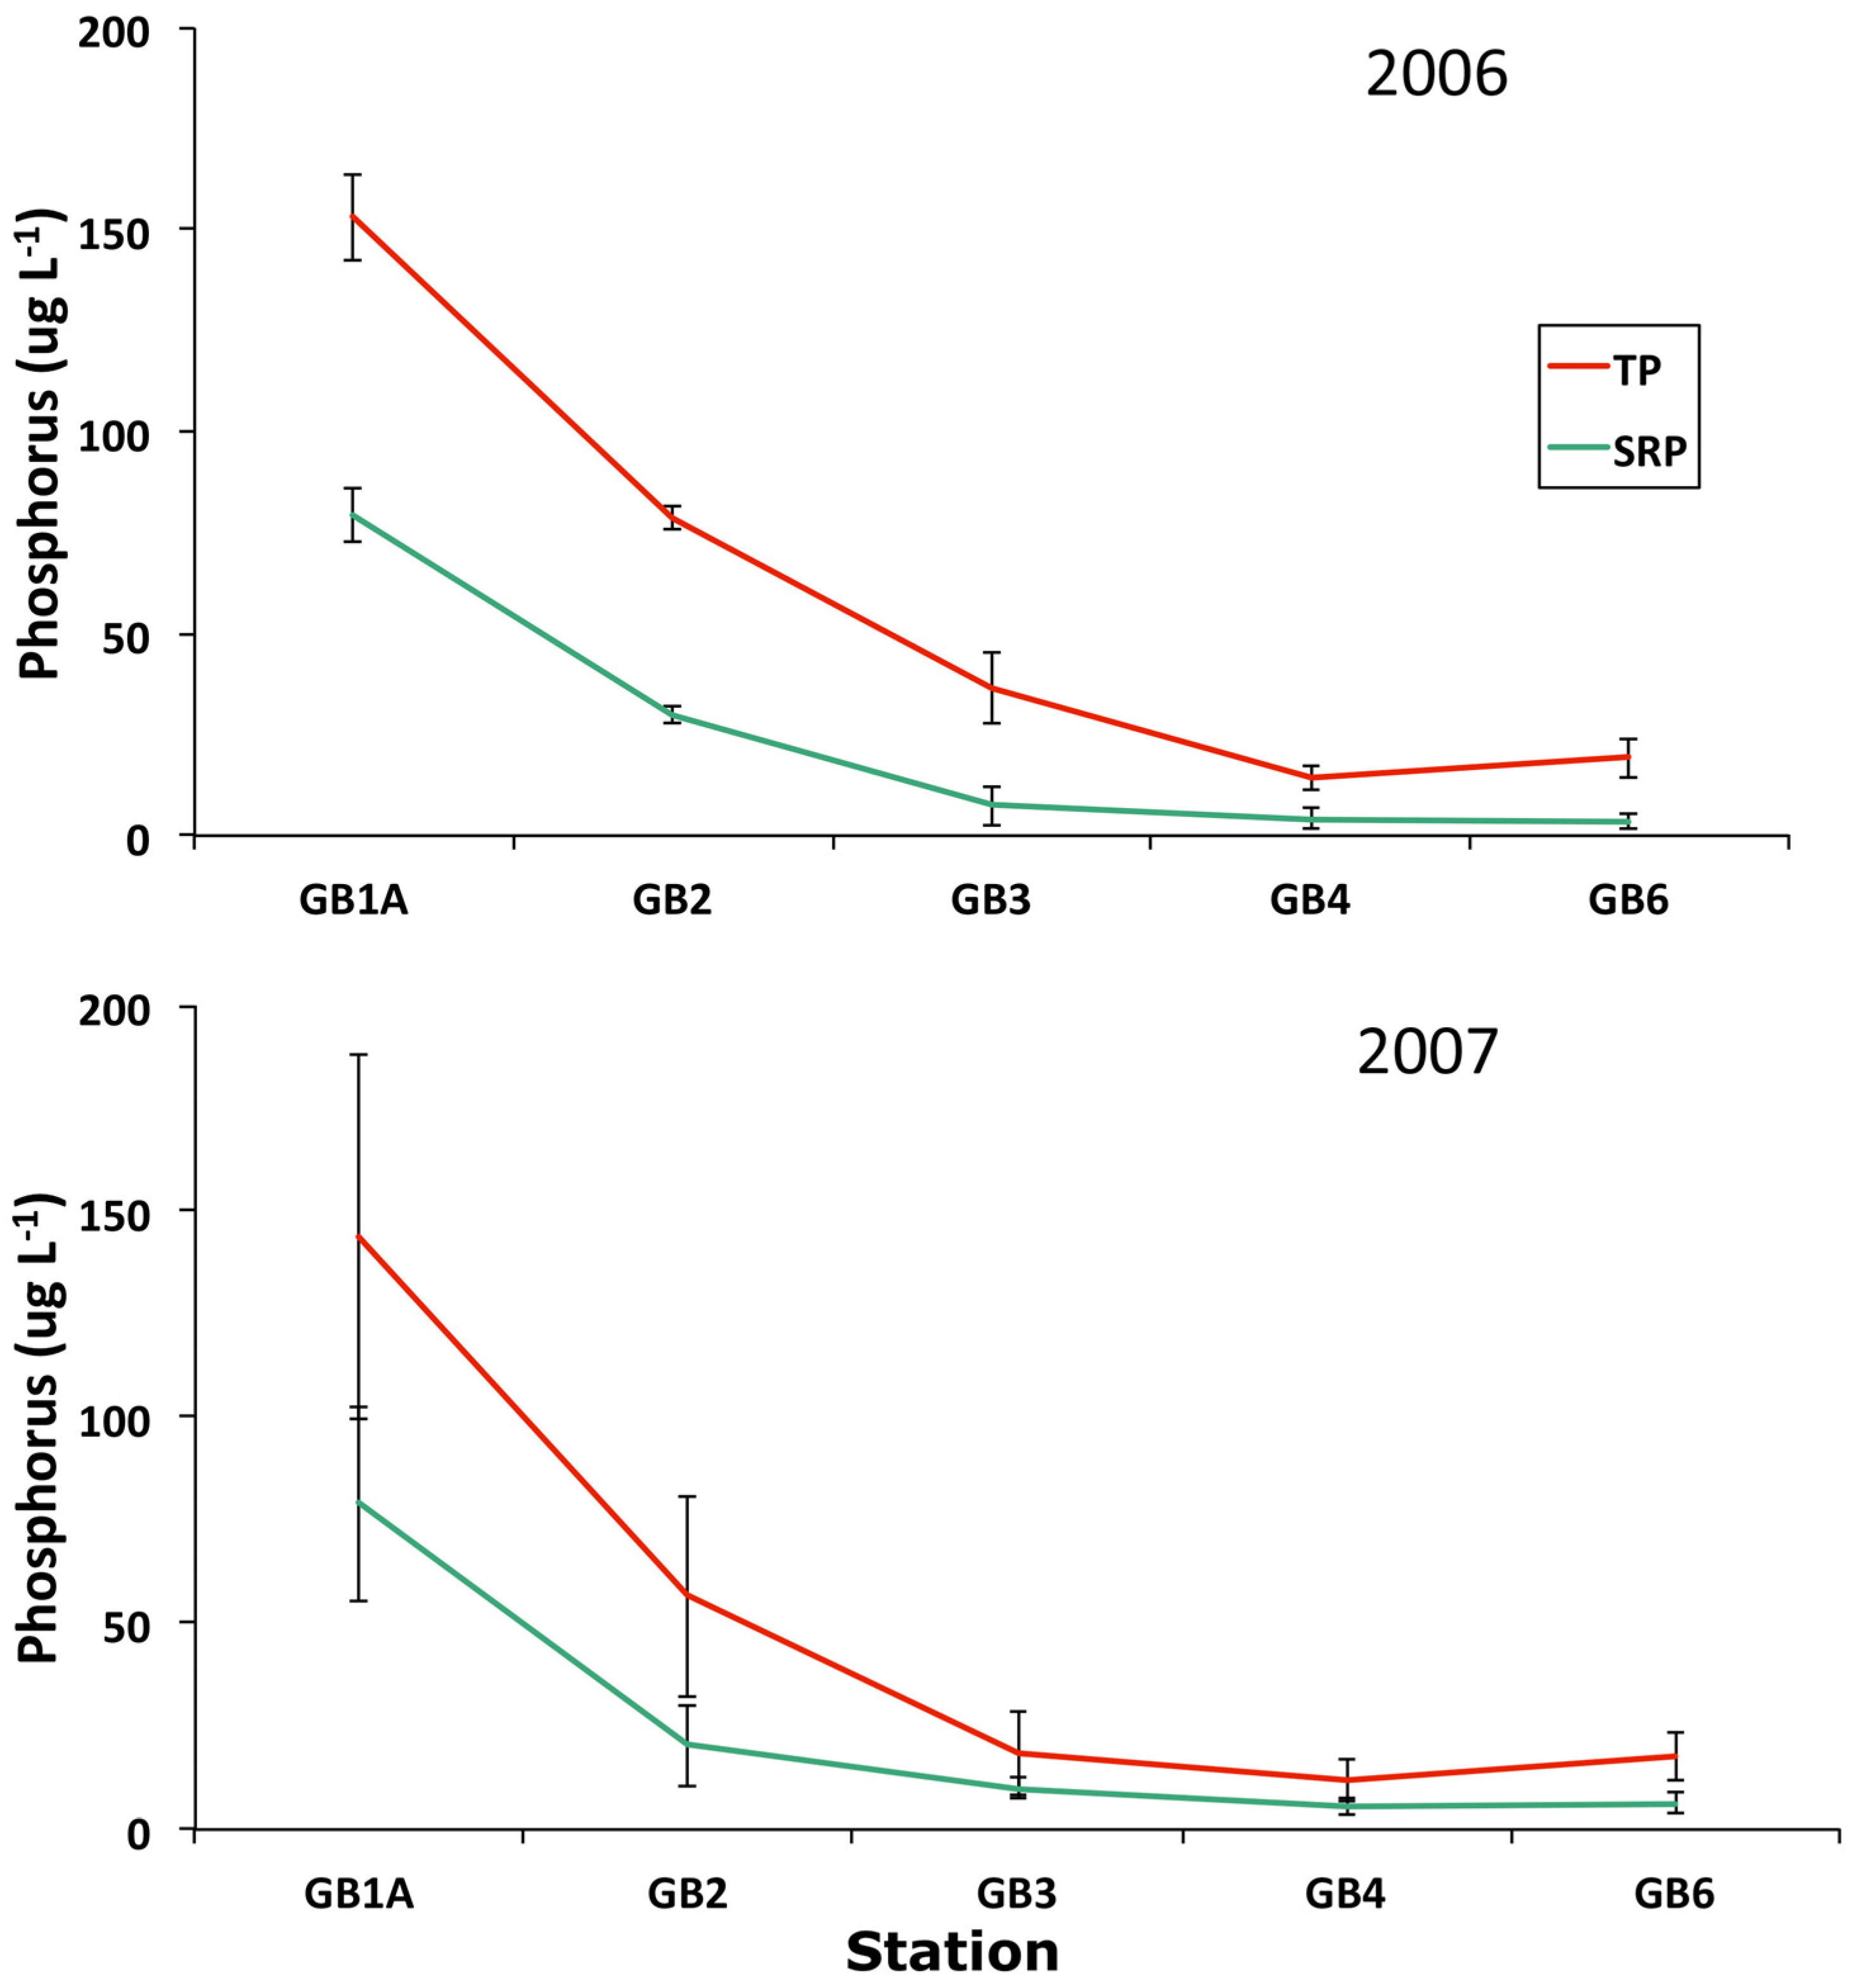
3.4. Trophic Gradient Conditions

A clear trophic gradient in Green Bay occurred both before and after invasion by zebra mussels (Table 4). Total phosphorus and Chl-a concentrations decreased and Secchi depth increased with distance from the mouth of the Fox River (G1A to GB6, respectively). The high total phosphorus values at stations GB1A and GB2 in 2006 and 2007 indicate the continued hypereutrophic nature of the inner bay region after mussel invasion. Total phosphorus was significantly different among years (F2,47 = 7.19, p = 0.002), with higher concentrations in 1980 vs. 2006 and 2007 (Fisher LSD comparison tests, p < 0.05). Station GB1A differed from GB2 in TP, and both of these differed significantly from GB3, GB4, and GB6 (Fisher LSD tests, p < 0.05). Chlorophyll-a concentration also differed significantly among years (F2,47 = 5.57, p = 0.007); Chl-a in 2007 was significantly greater than in 1980 and 2006 (Fisher LSD tests, p < 0.05). Chlorophyll-a at site GB1A differed from GB2, and both were significantly greater than stations GB3, GB4, and GB6 (Fisher LSD tests, p < 0.05). Secchi depth did not differ significantly among years (F2,47 = 0.87, p = 0.43), but did differ among sites (F4,47 = 31.81, p < 0.0001). Water clarity at GB1A and GB2 was significantly lower than at GB3, which was significantly different from GB4 and GB6 (Fisher LSD tests, p < 0.05).
Table 4. Examples of mean summer water quality indicators along the trophic gradient in Green Bay before (1980) and after (2006, 2007) invasion by dreissenid mussels. Mean values are shown with 1 standard error of the mean indicated in parentheses.
Station
GB1AGB2GB3GB4GB6
Total Phosphorus (ug/L)
1980223.7158.347.845.342.3
(23.6)(40.8)(17.8)(14.7)(8.9)
2006153.178.936.614.419.3
(10.7)(2.9)(8.8)(3.2)(4.8)
2007143.756.518.311.617.6
(44.3)(24.6)(10.1)(5.1)(5.7)
Chlorophyll a (ug/L)
198053.363.118.69.89.9
(23.1)(15.9)(3.4)(2.9)(3.3)
200690.360.225.316.817.0
(9.4)(8.4)(7.6)(2.0)(4.5)
2007196.793.227.625.327.9
(34.4)(50.4)(8.8)(7.0)(10.0)
Secchi Depth (m)
19800.40.61.32.42.4
(0.03)(0.1)(0.2)(0.3)(0.5)
20060.50.71.82.32.8
(0.1)(0.04)(0.3)(0.3)(0.5)
20070.30.81.72.23.0
(0.02)(0.2)(0.2)(0.3)(0.6)
Soluble reactive forms of phosphorus (primarily dissolved inorganic forms) comprised greater than 50% of the total phosphorus measured at station GB1A in both years after mussel invasion (Figure 11). Soluble reactive phosphorus accounted for decreasing fractions of the total along the gradient, with 20%–35% of the total as SRP near station GB6.
Figure 11. Phosphorus concentrations along the trophic gradient in Green Bay during 2006 (top) and 2007 (bottom). Both soluble reactive phosphorus (SRP) and total phosphorus (TP) concentrations are shown. Error bars indicate ±1 SEM.
Diversity 06 00681 g011

4. Discussion

Our comparison of data from Green Bay prior to invasion by zebra mussels with data from years following invasion demonstrate clear and consistent changes in the phytoplankton community of lower Green Bay at multiple scales of analysis. As shown by De Stasio et al. [28,29] and the present study, there were significant increases in summer chlorophyll abundance after invasion and significant regime shifts in phytoplankton community composition compared to before the mussel invasion. Cyanobacteria became a more dominant feature of the system, with frequent blooms of Microcystis and Anabaena after mussel invasion. Green algae decreased in abundance and richness, and diatoms increased in abundance and richness at the genus level after the invasion.

4.1. Phytoplankton Community Drivers

While the majority of published research on the Laurentian Great Lakes has demonstrated reductions in both chlorophyll and phytoplankton biomass following invasion by zebra mussel (Dreissena polymorpha), recent meta-analyses indicate that not all systems have displayed reductions in phytoplankton biomass [18,20,21]. Examples where phytoplankton communities responded differently than the majority of systems studied can help us gain insight into the mechanisms that may drive community structure and function. Our results for lower Green Bay show that responses to invasions can be complex and less predictable than originally expected, especially in ecosystems highly influenced by human activities and multiple stressors.
The trophic gradient in Green Bay persisted throughout invasion and remains a major determinant of phytoplankton communities in this Great Lakes estuary. The gradient is clearly seen in changes in total phosphorus, chlorophyll, and Secchi depth along the axis of the bay (Table 4, Figure 11) and mimics that documented since the early 1980s [24,27]. Despite the persistence of the trophic gradient the inner-bay and middle-bay phytoplankton communities changed after invasion by dreissenids [28]. Reconciling plankton changes observed in Green Bay with actions of dreissenids requires examination of overall grazing impacts, effects on nutrient concentrations, and changes in physical habitat after invasion by mussels.

4.1.1. Grazing Impacts

Dreissenids are well known for the ability to filter large volumes of water and remove both phytoplankton and sediment from water by their grazing actions [6,7,9,37,38]. These impacts typically occur because dreissenids in the Great Lakes reached high abundances (often over 50,000 m−2; [5,39]) and because individuals have large per capita filtration rates (>6 L mussel−1 day−1; [40]). In the inner bay of Green Bay, abundance of zebra mussels was shown to be patchy and relatively low from 2000 to 2003 (0.2–11 m−2; [41,42]), while more northern sites near GB6 exhibited densities greater than 20,000 m−2 [41]. Given the relatively low densities of dreissenids in the inner bay, it is perhaps not unexpected that chlorophyll and phytoplankton biovolume did not decrease significantly after the invasion. However, significant increases in chlorophyll in the inner and middle bay regions (Figure 11), and in phytoplankton biovolume in middle bay where mussel densities were high [28], call for further explanation. Similarly, significant shifts in phytoplankton community composition and increases in cyanobacteria indicate that selective feeding by dreissenids and/or shifts in nutrient conditions might also have been important after the invasion of Green Bay.

4.1.2. Selective Grazing

In both the inner and middle bay we documented significant increases in absolute and relative abundance of cyanobacteria, especially for the genus Microcystis (Figure 7 and Figure 9, Table 2). Multivariate analysis of the inner bay phytoplankton community also demonstrated a significant regime shift following the invasion (Figure 6), with post-invasion communities dominated by cyanobacteria (Figure 5, Table 1). Similar shifts to cyanobacteria dominance following invasions have been extensively documented throughout the Great Lakes, sometimes attributed to selective grazing by zebra mussels [9,13,38,43]. Although there were conflicting conclusions drawn from early studies on feeding selectivity by zebra mussels [43,44,45,46,47], more recent studies have shown clearly that zebra mussels can be selective feeders, especially on colonial cyanobacteria like Microcystis [48,49,50]. Large cells and colonial or filamentous forms, such as cyanobacteria and diatoms, are often not drawn into the siphon [48,49,51]. For Microcystis specifically, a recent study demonstrated selectivity for only single cells or colonies smaller than 80 um diameter [50]. Additionally, phytoplankton can be rejected after intake and expelled as pseudofeces after being encased in mucus [43,48,49,50,52]. Pseudofeces often have a loose structure and phytoplankton cells can survive and subsequently recolonize the plankton [48,49]. Such activities by zebra mussels are thought to provide a relative advantage to such inedible and less preferred taxa, leading to community level shifts in phytoplankton composition.
Selective grazing by zooplankton in Green Bay prior to the invasion by zebra mussels was shown to be an important factor in phytoplankton community structure and abundance, with greater overall grazing by zooplankton in the meso-oligotrophic middle and upper bay regions [26,53]. Our recent studies indicate that zooplankton abundances following the invasion decreased, especially in the inner bay region, and that the importance of zooplankton grazing has correspondingly decreased along the trophic gradient (De Stasio et al., in preparation). These decreases in grazing pressure by zooplankton are consistent with the observed shifts in phytoplankton community structure to more grazer resistant taxa, and to higher Chl-a abundances in the Green Bay system. Comparison of zooplankton and zebra mussel grazing impacts following the invasion would be of interest in light of these changes.

4.1.3. Nutrient Conditions

Observed changes in the phytoplankton also could have been driven by changes in nutrient conditions in the inner bay affected by the actions of dreissenids. A clear trophic gradient in nutrient conditions still occurred following the invasion (Table 4, Figure 11), demonstrating the continued importance of the lower Fox River in determining ecosystem structure and function in Green Bay. Monitoring data from inner bay of Green Bay indicate that TP concentrations decreased before the invasion, likely due to nutrient control efforts [23]. Concentrations of TP after the invasion were more variable, but data show that TP increased again [54]. In addition, nitrate concentration in the inner bay increased following mussel invasion. These trends were unexpected considering the continued successful efforts during the 1990s to significantly decrease phosphorus loading to the lower Fox River and Green Bay [23]. The combination of lower loading of nutrients but increases in total phosphorus concentrations (which includes phosphorus as phytoplankton biomass), lends support to the role of zebra mussels in affecting nutrient cycling and dynamics in this system. Zebra mussel invasions of other Great Lakes ecosystems have been associated with increased concentrations of phosphorus as well as changes in nutrient cycling despite decreases in nutrient loading. In Lake Erie, zebra mussels were shown to have an important effect on phosphorus cycling, resulting in increased availability of phosphorus because of high rates of phosphorus release [14,15,55]. However, loading of soluble reactive phosphorus to the western basin of Lake Erie also increased after mussel invasion due to increased agricultural run-off, leading to re-eutrophication of the lake and more frequent blooms of cyanobacteria [56]. Nutrient ratios of nitrogen and phosphorus also were affected by mussel invasion in Saginaw Bay of Lake Huron and Lake St. Clair [5,57,58,59]. Increased availability of both phosphorus and nitrate in lower Green Bay helps explain the significant increases in phytoplankton shown in our study (Figure 2).
Changes in the phytoplankton community composition make sense given these changes in nutrient conditions. The observed shift to dominance by Microcystis, a cyanobacteria genus unable to fix nitrogen, is expected under higher phosphorus and nitrate concentrations. Previous work on Green Bay indicated phosphorus limitation of total algal growth, and nitrogen-limited conditions for non nitrogen-fixing taxa [60,61]. With increased nitrate concentrations and high phosphorus levels Microcystis would be able to more successfully compete with other taxa and flourish. The same applies for diatom taxa that are resistant to other limiting factors such as grazing pressure and silica limitation. The diatoms that increased in Green Bay, such as Aulacoseira and Fragilaria (Figure 10), are typical of phytoplankton functional groups that thrive in well-mixed, eutrophic conditions where silica is abundant [13,62,63]. Both taxa are also colonial, making them less susceptible to grazing by zebra mussels e.g., [45,48]. The observed increases for these functional groups in Green Bay were the main drivers of the increased chlorophyll and phytoplankton abundance documented following the invasion by zebra mussels.
Introduction of dreissenids to North America has been a major disruption of the invaded ecosystems [5] and has led to changes in the mechanisms producing well known system-level relationships. Correlations between TP and chlorophyll have been a standard measure of the effects of nutrients on ecosystem productivity and are used extensively for management decisions in the Great Lakes [54,64,65]. Such correlations can lose predictive ability when the underlying food web interactions change, which has been documented in both the Great Lakes as well as inland lakes [59,66]. In the inner bay of Green Bay the amount of chlorophyll per unit TP was shown to increase (but not significantly), in agreement with our results from 2006 to 2007 compared to relationships published from the 1980s [27,61] (unpublished data). In a previously published study for sites near our middle bay site chlorophyll per unit, TP significantly decreased following invasion [27]. Recent literature reviews of responses of TP-Chl relationships to dreissenid invasions show a similar range of effects [18,20,21]. A similar uncoupling of the relationship between TP and percent cyanobacteria appears to have occurred in Green Bay where well-established relationships from other lakes have very low predictive power (Figure 8). Zebra mussels likely caused a radical change in the grazing pressure on phytoplankton and nutrient cycling in these systems, so shifts in correlations are not unexpected. Experimental work indicates that changes in these relationships differ depending on the range of TP in the system [66,67], which also helps explain differences between the responses in lower Green Bay versus less productive systems like Saginaw Bay of Lake Huron [13].

4.1.4. Physical Habitat Conditions

Dreissenids have been shown to affect physical features of the Great Lakes by clearing the water of particulate matter and changing the nature of the sediment–water interface [5]. The greatest impacts of dreissenids are typically expected in shallow areas because mussels will have access to a larger percentage of the water column [68]. Physical habitat conditions of Green Bay vary along the trophic gradient, changing from a shallow, well-mixed, soft-bottom inner bay to deeper middle and upper bay regions that stratify thermally during the summer (Figure 1). As a consequence, greater effects of dreissenids were expected in lower and inner bay regions of Green Bay [69]. However, our data show that observed changes in inner bay were the opposite of what was expected based on water-clearing activities of dreissenids. Water clarity in the inner bay did not change significantly following the invasion by zebra mussels (Table 4, [28,54]), indicating that mussels did not effectively clear the water of particulate matter. Other studies have shown that high concentrations of suspended matter can interfere with filtering activities and even suppress the growth of dreissenids [70,71]. In addition, high concentrations of cyanobacteria like Microcystis can also lead to poor growth conditions for mussels [49]. Given this information, it is not surprising that zebra mussels occurred in relatively low abundances in inner and lower Green Bay, with higher population abundances near middle bay regions [41]. In the soft-bottom inner bay region, mussel abundance was patchy and occurred in druses [72], but was clearly not sufficient to allow for significant effects on light penetration and water clarity.

5. Conclusions

Green Bay has responded to invasion by dreissenid mussels in a different way than many of the waters in the Laurentian Great Lakes, as well as in other inland bodies of water. The strong trophic gradient from the mouth of the Fox River northward along the bay remained after mussel invasion. Although significant decreases in phosphorus loading to the system occurred over time before mussels arrived, chlorophyll concentrations in lower and middle bay increased and the phytoplankton community shifted to one even more dominated by cyanobacteria than observed prior to the invasion. A combination of relatively poor growth conditions for dreissenids in the inner bay, shifts in nutrient conditions, and decreases in zooplankton grazing appear to have facilitated a shift in abundance, as well as composition and diversity of the phytoplankton communities. Changes in the middle bay region, where nutrient-loading effects are reduced, indicate the importance of mussels as a primary driver of these changes. Additional investigations of physical, chemical and biological factors along gradients, where the influence of these factors varies, will provide tests of mechanisms causing ecosystem responses to invasions. Further studies of examples where lakes respond differently to invasions can provide additional insights into aquatic ecosystem structure and function.

Acknowledgments

This work was funded by the University of Wisconsin Sea Grant Institute under grants from the National Sea Grant College Program, National Oceanic and Atmospheric Administration, U.S. Department of Commerce, and from the State of Wisconsin (Federal grant number: NA16RG2257, project number: R/LR-93). Additional funding was provided by a Franklin Grant from the American Philosophical Society, and the Excellence in Science Fund from Lawrence University. We thank Ashley Beranek, Jessica Beyer, Robert Boeckman, William Daniels, Elizabeth De Stasio, Travis Haas, Thayer Hallidayschult, Kristina Nockleby, and Ben Pauli for assistance with sampling and data management. Previously unpublished data were generously shared by T. Rodman Harvey, Donn Branstrattor, and Kendra Stockdale.

Author Contributions

The work presented here represents collaborative studies conducted by Bart De Stasio, Michael Schrimpf and Brendan Cornwell. Bart De Stasio supervised the field-work, laboratory analyses and honors thesis projects by Michael Schrimpf and Brendan Cornwell. Michael Schrimpf completed sample collections, chlorophyll analyses and microscopic analysis of samples. Brendan Cornwell assisted with sample collections and conducted electronic particle counting of samples. Data analyses are based on the honors thesis work of Michael Schrimpf and Brendan Cornwell, with additional analyses completed by Bart De Stasio. All authors worked on interpreting the results and Bart De Stasio completed the statistical analyses and wrote the paper.

Conflicts of Interest

The authors declare no conflict of interest.

References

  1. Lodge, D.M.; Williams, S.; MacIsaac, H.J.; Hayes, K.R.; Leung, B.; Reichard, S.; Mack, R.N.; Moyle, P.B.; Smith, M.; Andow, D.A.; et al. Biological invasions: Recommendations for U.S. Policy and management. Ecol. Appl. 2006, 16, 2035–2054. [Google Scholar] [CrossRef] [PubMed]
  2. Strayer, D.L. Twenty years of zebra mussels: Lessons from the mollusk that made headlines. Front. Ecol. Environ. 2009, 7, 135–141. [Google Scholar] [CrossRef]
  3. Mills, E.L.; Leach, J.H.; Carlton, J.T.; Secor, C.L. Exotic species and the integrity of the Great Lakes - lessons from the past. Bioscience 1994, 44, 666–676. [Google Scholar] [CrossRef]
  4. Drake, J.M.; Lodge, D.M. Rate of species introductions in the great lakes via ships’ ballast water and sediments. Can. J. Fish. and Aquat. Sci. 2007, 64, 530–538. [Google Scholar] [CrossRef]
  5. Vanderploeg, H.A.; Nalepa, T.F.; Jude, D.J.; Mills, E.L.; Holeck, K.T.; Liebig, J.R.; Grigorovich, I.A.; Ojaveer, H. Dispersal and emerging ecological impacts of Ponto-Caspian species in the Laurentian Great Lakes. Can. J. Fish. Aquat. Sci. 2002. [Google Scholar] [CrossRef]
  6. Fahnenstiel, G.L.; Lang, G.A.; Nalepa, T.F.; Johengen, T.H. Effects of zebra mussel (Dreissena polymorpha) colonization on water quality parameters in Saginaw Bay, Lake Huron. J. Great Lakes Res. 1995, 21, 435–448. [Google Scholar] [CrossRef]
  7. MacIsaac, H.J.; Sprules, W.G.; Johannsson, O.E.; Leach, J.H. Filtering impacts of larval and sessile zebra mussels (Dreissena polymorpha) in western Lake Erie. Oecologia 1992, 92, 30–39. [Google Scholar] [CrossRef]
  8. Bunt, C.M.; Maclsaac, H.J.; Sprules, W.G. Pumping rates and projected filtering impacts of juvenile zebra mussels (Dreissena polymorpha) in western Lake Erie. Can. J. Fish. Aquat. Sci. 1993, 50, 1017–1022. [Google Scholar] [CrossRef]
  9. Lavrentyev, P.J.; Gardner, W.S.; Cavaletto, J.F.; Beaver, J.R. Effects of the zebra mussel (Dreissena polymorpha Pallas) on protozoa and phytoplankton from Saginaw Bay, Lake Huron. J. Great Lakes Res. 1995, 21, 545–557. [Google Scholar] [CrossRef]
  10. Idrisi, N.; Mills, E.L.; Rudstam, L.G.; Stewart, D.J. Impact of zebra mussels (Dreissena polymorpha) on the pelagic lower trophic levels of Oneida Lake, New York. Can. J. Fish. Aquat. Sci. 2001, 58, 1–12. [Google Scholar] [CrossRef]
  11. Barbiero, R.P.; Rockwell, D.C.; Warren, G.J.; Tuchman, M.L. Changes in spring phytoplankton communities and nutrient dynamics in the eastern basin of Lake Erie since the invasion of Dreissena spp. Can. J. Fish. Aquat. Sci. 2006, 63, 1549–1563. [Google Scholar] [CrossRef]
  12. Depew, D.C.; Guildford, S.J.; Smith, R.E.H. Nearshore-offshore comparison of Chlorophyll a and phytoplankton production in the dreissenid-colonized eastern basin of Lake Erie. Can. J. Fish. Aquat. Sci. 2006, 63, 1115–1129. [Google Scholar] [CrossRef]
  13. Fishman, D.B.; Adlerstein, S.A.; Vanderploeg, H.A.; Fahnenstiel, G.L.; Scavia, D. Phytoplankton community composition of Saginaw Bay, Lake Huron, during the zebra mussel (Dreissena polymorpha) invasion: A multivariate analysis. J. Great Lakes Res. 2010, 36, 9–19. [Google Scholar] [CrossRef]
  14. Arnott, D.L.; Vanni, M.J. Nitrogen and phosphorus recycling by the zebra mussel (Dreissena polymorpha) in the western basin of Lake Erie. Can. J. Fish. Aquat. Sci. 1996, 53, 646–659. [Google Scholar] [CrossRef]
  15. Conroy, J.D.; Edwards, W.J.; Pontius, R.A.; Kane, D.D.; Zhang, H.Y.; Shea, J.F.; Richey, J.N.; Culver, D.A. Soluble nitrogen and phosphorus excretion of exotic freshwater mussels (Dreissena spp.): Potential impacts for nutrient remineralisation in western Lake Erie. Freshw. Biol. 2005, 50, 1146–1162. [Google Scholar] [CrossRef]
  16. Mills, E.L.; Casselman, J.M.; Dermott, R.; Fitzsimons, J.D.; Gal, G.; Holeck, K.T.; Hoyle, J.A.; Johannsson, O.E.; Lantry, B.F.; Makarewicz, J.C.; et al. Lake Ontario: Food web dynamics in a changing ecosystem (1970–2000). Can. J. Fish. Aquat. Sci. 2003, 60, 471–490. [Google Scholar] [CrossRef]
  17. Hecky, R.E.; Smith, R.E.H.; Barton, D.R.; Guildford, S.J.; Taylor, W.D.; Charlton, M.N.; Howell, T. The nearshore phosphorus shunt: A consequence of ecosystem engineering by dreissenids in the Laurentian Great Lakes. Can. J. Fish. Aquat. Sci. 2004, 61, 1285–1293. [Google Scholar] [CrossRef]
  18. Higgins, S.N.; Vander Zanden, M.J. What a difference a species makes: A meta-analysis of dreissenid mussel impacts on freshwater ecosystems. Ecol. Monogr. 2010, 80, 179–196. [Google Scholar] [CrossRef]
  19. Althouse, B.; Higgins, S.; Vander Zanden, M.J. Benthic and planktonic primary production along a nutrient gradient in Green Bay, Lake Michigan, USA. Freshw. Sci. 2014, 33, 487–498. [Google Scholar] [CrossRef]
  20. Higgins, S.N.; Vander Zanden, M.J.; Joppa, L.N.; Vadeboncoeur, Y. The effect of dreissenid invasions on chlorophyll and the chlorophyll: Total phosphorus ratio in north-temperate lakes. Can. J. Fish. Aquat. Sci. 2011, 68, 319–329. [Google Scholar] [CrossRef]
  21. Cha, Y.; Stow, C.A.; Bernhardt, E.S. Impacts of dreissenid mussel invasions on chlorophyll and total phosphorus in 25 lakes in the USA. Freshw. Biol. 2013, 58, 192–206. [Google Scholar] [CrossRef]
  22. Bertand, G.; Lang, J.; Ross, J. The Green Bay Watershed: Past, Present, Future; University of Wisconsin Sea Grant Institute: Madison, WI, USA, 1976. [Google Scholar]
  23. Klump, J.V.; Edgington, D.N.; Sager, P.E.; Robertson, D.M. Sedimentary phosphorus cycling and a phosphorus mass balance for the Green Bay (Lake Michigan) ecosystem. Can. J. Fish. Aquat. Sci. 1997, 54, 10–26. [Google Scholar] [CrossRef]
  24. Richman, S.; Sager, P.E.; Banta, G.; Harvey, T.R.; De Stasio, B.T. Phytoplankton standing stocks, size distribution, species composition and productivity along a trophic gradient in Green Bay, Lake Michigan. Internationale Vereinigung fuer Theoretische und Angewandte Limnologie Verhandlungen 1984, 22, 460–469. [Google Scholar]
  25. De Stasio, B.T.; Richman, S. Phytoplankton spatial and temporal distributions in Green Bay, Lake Michigan, prior to colonization by the zebra mussel (Dreissena polymorpha). J. Great Lakes Res. 1998, 24, 620–628. [Google Scholar] [CrossRef]
  26. Sager, P.E.; Richman, S. Functional interaction of phytoplankton and zooplankton along the trophic gradient in Green Bay, Lake Michigan. Can. J. Fish. Aquat. Sci. 1991, 49, 116–122. [Google Scholar] [CrossRef]
  27. Qualls, T.M.; Dolan, D.M.; Reed, T.; Zorn, M.E.; Kennedy, J. Analysis of the impacts of the zebra mussel, Dreissena polymorpha, on nutrients, water clarity, and the chlorophyll-phosphorus relationship in lower Green Bay. J. Great Lakes Res. 2007, 33, 617–626. [Google Scholar] [CrossRef]
  28. De Stasio, B.T.; Schrimpf, M.B.; Beranek, A.E.; Daniels, W.C. Increased Chlorophyll a, phytoplankton abundance, and cyanobacteria occurrence following invasion of Green Bay, Lake Michigan by dreissenid mussels. Aquat. Invasions 2008, 3, 21–27. [Google Scholar] [CrossRef]
  29. De Stasio, B.T.; Schrimpf, M.B.; Beranek, A.E.; Daniels, W.C.; Hoyer, E. Dreissenid driving tests: Going the “wrong” way in Green Bay, Lake Michigan? Internationale Vereinigung fuer Theoretische und Angewandte Limnologie Verhandlungen 2010, 30, 1540–1544. [Google Scholar]
  30. Wetzel, R.G.; Likens, G.E. Limnological Analyses, 2nd ed.; Springer-Verlag: New York, NY, USA, 1991; p. 391. [Google Scholar]
  31. Nicholls, K.H.; Hoyle, J.A.; Johannsson, O.E.; Dermott, R. A biological regime shift in the Bay of Quinte ecosystem (Lake Ontario) associated with the establishment of invasive dreissenid mussels. J. Great Lakes Res. 2011, 37, 310–317. [Google Scholar] [CrossRef]
  32. Hammer, Ø.; Harper, D.A.T.; Ryan, P.D. Past: Paleontological statistics software package for education and data analysis. Palaeontol. Electron. 2001, 4, 1–9. [Google Scholar]
  33. Rodionov, S.N. A sequential algorithm for testing climate regime shifts. Geophys. Res. Lett. 2004. [Google Scholar] [CrossRef]
  34. Frost, T.M.; Descy, J.-P.; de Stasio, B.T.; Gerrish, G.A.; Hood, J.M.; Hurley, J.P.; Amand., A.L.S. Evaluations of phytoplankton communities using varied techniques: A multi-media comparison of lakes in northern Wisconsin, USA. Internationale Vereinigung fuer Theoretische und Angewandte Limnologie Verhandlungen 2000, 27, 1023–1030. [Google Scholar]
  35. Trimbee, A.M.; Prepas, E.E. Evaluation of total phosphorus as a predictor of the relative biomass of blue-green-algae with emphasis on Alberta lakes. Can. J. Fish. Aquat. Sci. 1987, 44, 1337–1342. [Google Scholar] [CrossRef]
  36. Downing, J.A.; Watson, S.B.; McCauley, E. Predicting cyanobacteria dominance in lakes. Can. J. Fish. Aquat. Sci. 2001, 58, 1905–1908. [Google Scholar] [CrossRef]
  37. Holland, R.E. Changes in planktonic diatoms and water transparency in Hatchery Bay, Bass Island area, western Lake Erie since the establishment of the zebra mussel. J. Great Lakes Res. 1993, 19, 617–624. [Google Scholar] [CrossRef]
  38. Nicholls, K.H. Detection of regime shifts in multi-species communities: The Bay of Quinte phytoplankton example. Methods Ecol. Evol. 2011, 2, 416–426. [Google Scholar] [CrossRef]
  39. Wilson, A.E.; Sarnelle, O. Relationship between zebra mussel biomass and total phosphorus in European and North American lakes. Arch. Hydrobiol. 2002, 153, 339–351. [Google Scholar]
  40. Kryger, J.; Riisgard, H.U. Filtration-rate capacities in 6 species of European fresh-water bivalves. Oecologia 1988, 77, 34–38. [Google Scholar] [CrossRef]
  41. Fettes, A.L. The Bottom of the Bay Then and Now: Investigations into Both the Zebra Mussels Colonizing Green Bay and the Pre-Invasion Macroinvertebrate Community. Master’s Thesis, University of Wisconsin-Green Bay, Green Bay, WI, USA, 2001. [Google Scholar]
  42. Salim, A.Y. Alternative Sampling Method to Determine Factors Affecting Distribution and Ecological Impact of the Zebra Mussel (Dreissena polymorpha) in Lower Green Bay, WI. Master’s Thesis, University of Wisconsin-Green Bay, Green Bay, WI, USA, 2007. [Google Scholar]
  43. Vanderploeg, H.A.; Johengen, T.H.; Fahnenstiel, G.L.; Nalepa, T.F.; Liebig, J.R.; Carmichael, W.W.; Agy, M.A. Zebra mussel (Dreissena polymorpha) selective filtration promoted toxic Microcystis blooms in Saginaw Bay (Lake Huron) and Lake Erie. Can. J. Fish. Aquat. Sci. 2001, 58, 1208–1221. [Google Scholar] [CrossRef]
  44. Nicholls, K.H.; Hopkins, G.J. Recent changes in Lake Erie (north shore) phytoplankton-cumulative impacts of phosphorus loading reductions and the zebra mussel introduction. J. Great Lakes Res. 1993, 19, 637–647. [Google Scholar] [CrossRef]
  45. Baker, S.M.; Levinton, J.S.; Kurdziel, J.P.; Shumway, S.E. Selective feeding and biodeposition by zebra mussels and their relation to changes in phytoplankton composition and seston load. J. Shellfish Res. 1998, 17, 1207–1213. [Google Scholar]
  46. Bastviken, D.T.E.; Caraco, N.F.; Cole, J.J. Experimental measurements of zebra mussel (Dreissena polymorpha) impacts on phytoplankton community composition. Freshw. Biol. 1998, 39, 375–386. [Google Scholar] [CrossRef]
  47. Dionisio Pires, L.M.; Jonker, R.R.; Van Donk, E.; Laanbroek, H.J. Selective grazing by adults and larvae of the zebra mussel (Dreissena polymorpha): Application of flow cytometry to natural seston. Freshw. Biol. 2004, 49, 116–126. [Google Scholar] [CrossRef]
  48. Naddafi, R.; Eklov, P.; Pettersson, K. Non-lethal predator effects on the feeding rate and prey selection of the exotic zebra mussel Dreissena polymorpha. Oikos 2007, 116, 1289–1298. [Google Scholar] [CrossRef]
  49. Vanderploeg, H.A.; Johengen, T.H.; Liebig, J.R. Feedback between zebra mussel selective feeding and algal composition affects mussel condition: Did the regime changer pay a price for its success? Freshw. Biol. 2009, 54, 47–63. [Google Scholar]
  50. White, J.D.; Sarnelle, O. Size-structured vulnerability of the colonial cyanobacterium, Microcystis aeruginosa, to grazing by zebra mussels (Dreissena polymorpha). Freshw. Biol. 2014, 59, 514–525. [Google Scholar] [CrossRef]
  51. Dionisio Pires, L.M.; Bontes, B.M.; Van Donk, E.; Ibelings, B.W. Grazing on colonial and filamentous, toxic and non-toxic cyanobacteria by the zebra mussel Dreissena polymorpha. J. Plankton Res. 2005, 27, 331–339. [Google Scholar] [CrossRef]
  52. Baker, S.M.; Levinton, J.S.; Ward, J.E. Particle transport in the zebra mussel, Dreissena polymorpha (Pallas). Biol. Bull. 2000, 199, 116–125. [Google Scholar] [CrossRef]
  53. Richman, S.; Sager, P.E. Patterns of phytoplankton-zooplankton interactions along a trophic gradient: II. Biomass and size distribution. Internationale Vereinigung fuer Theoretische und Angewandte Limnologie Verhandlungen 1990, 24, 401–405. [Google Scholar]
  54. Qualls, T.M.; Harris, H.J.; Harris, V. The State of the Bay: The Condition of the Bay of Green Bay/Lake Michigan 2013; University of Wisconsin Sea Grant Institute: Madison, WI, USA, 2013. [Google Scholar]
  55. Zhang, H.Y.; Culver, D.A.; Boegman, L. Dreissenids in Lake Erie: An algal filter or a fertilizer? Aquat. Invasions 2011, 6, 175–194. [Google Scholar] [CrossRef]
  56. Kane, D.D.; Conroy, J.D.; Richards, R.P.; Baker, D.B.; Culver, D.A. Re-eutrophication of Lake Erie: Correlations between tributary nutrient loads and phytoplankton biomass. J. Great Lakes Res. 2014, 40, 496–501. [Google Scholar] [CrossRef]
  57. Heath, R.T.; Fahnenstiel, G.L.; Gardner, W.S.; Cavaletto, J.F.; Hwang, S.J. Ecosystem-level effects of zebra mussels (Dreissena polymorpha): An enclosure experiment in Saginaw Bay, Lake Huron. J. Great Lakes Res. 1995, 21, 501–516. [Google Scholar] [CrossRef]
  58. Nalepa, T.F.; Gardner, W.S.; Malczyk, J.M. Phosphorus cycling by mussels (unionidae, bivalvia) in Lake St. Clair. Hydrobiologia 1991, 219, 239–250. [Google Scholar] [CrossRef]
  59. Mellina, E.; Rasmussen, J.B.; Mills, E.L. Impact of zebra mussel (Dreissena polymorpha) on phosphorus cycling and chlorophyll in lakes. Can. J. Fish. Aquat. Sci. 1995, 52, 2553–2573. [Google Scholar] [CrossRef]
  60. Vanderhoef, L.N.; Huang, C.Y.; Musil, R.; Williams, J. Nitrogen-fixation (acetylene-reduction) by phytoplankton in Green Bay, Lake Michigan, in relation to nutrient concentrations. Limnol. Oceanogr. 1974, 19, 119–125. [Google Scholar] [CrossRef]
  61. Sager, P.E.; Banta, G.; Kirk, J. The relation between areal and volumetric expressions of 14C productivity in Green Bay, Lake Michigan. Internationale Vereinigung fuer Theoretische und Angewandte Limnologie Verhandlungen 1984, 22, 470–474. [Google Scholar]
  62. Holland, R.E.; Claflin, L.W. Horizontal distribution of planktonic diatoms in Green Bay, mid-july 1970. Limnol. Oceanogr. 1975, 20, 365–378. [Google Scholar] [CrossRef]
  63. Reynolds, C.S.; Huszar, V.; Kruk, C.; Naselli-Flores, L.; Melo, S. Towards a functional classification of the freshwater phytoplankton. J. Plankton Res. 2002, 24, 417–428. [Google Scholar] [CrossRef]
  64. Dillon, P.J.; Rigler, F.H. Phosphorus-chlorophyll relationship in lakes. Limnol. Oceanogr. 1974, 19, 767–773. [Google Scholar] [CrossRef]
  65. Stow, C.A.; Cha, Y. Are Chlorophyll a-total phosphorus correlations useful for inference and prediction? Environ. Sci. Technol. 2013, 47, 3768–3773. [Google Scholar] [CrossRef]
  66. Sarnelle, O.; Raikow, D.F.; Wilson, A.E.; Hamilton, S.K.; Knoll, L.B. Complex interactions between the zebra mussel, Dreissena polymorpha, and the harmful phytoplankter, Microcystis aeruginosa. Limnol. Oceanogr. 2005, 50, 896–904. [Google Scholar] [CrossRef]
  67. Sarnelle, O.; White, J.D.; Horst, G.P.; Hamilton, S.K. Phosphorus addition reverses the positive effect of zebra mussels (Dreissena polymorpha) on the toxic cyanobacterium, Microcystis aeruginosa. Water Res. 2012, 46, 3471–3478. [Google Scholar] [CrossRef] [PubMed]
  68. MacIsaac, H.J.; Johannsson, O.E.; Ye, J.; Sprules, W.G.; Leach, J.H.; McCorquodale, J.A.; Grigorovich, I.A. Filtering impacts of an introduced bivalve (Dreissena polymorpha) in a shallow lake: Application of a hydrodynamic model. Ecosystems 1999, 2, 338–350. [Google Scholar] [CrossRef]
  69. Padilla, D.K.; Adolph, S.C.; Cottingham, K.L.; Schneider, D.W. Predicting the consequences of dreissenid mussels on a pelagic food web. Ecol. Model. 1996, 85, 129–144. [Google Scholar] [CrossRef]
  70. Schneider, D.W.; Madon, S.P.; Stoeckel, J.A.; Sparks, R.E. Seston quality controls zebra mussel (Dreissena polymorpha) energetics in turbid rivers. Oecologia 1998, 117, 331–341. [Google Scholar] [CrossRef]
  71. Penning, W.E.; Pozzato, L.; Vijverberg, T.; Noordhuis, R.; bij de Vaate, A.; van Donk, E.; Dionisio Pires, L.M. Effects of suspended sediments on food uptake for zebra mussels in Lake Markermeer, the Netherlands. Inland Waters 2013, 3, 437–450. [Google Scholar] [CrossRef]
  72. Reed, T.; Fettes, A.L.; Wielgus, S.J.; Barnes, A.K.; Schiefelbein, J.J. Refugia and local controls: Benthic invertebrate dynamics in lower Green Bay, Lake Michigan following zebra mussel invasion. J. Great Lakes Res. 2004, 30, 390–396. [Google Scholar] [CrossRef]

