
Molecular Characterization and Genetic Diversity of the Macaw Palm Ex Situ Germplasm Collection Revealed by Microsatellite Markers

Abstract
:1. Introduction
2. Experimental Section
2.1. Plant Material and DNA Isolation
2.2. Condition of Polymerase Chain Reaction (PCR) and Electrophoresis
2.3. Polyacrylamide Gel Staining
2.4. Data Analyses
3. Results and Discussion
3.1. SSR Allelic Polymorphism, Heterozygosity and Informativeness
3.2. Genetic Diversity
3.3. Analysis of Molecular Variance (AMOVA)
4. Conclusions
Acknowledgments
Author Contributions
Conflicts of Interest
References
- Abreu, S.I.; Carvalho, C.R.; Carvalho, G.M.A.; Motoike, S.Y. First karyotype, DNA C-value and AT/GC base composition of macaw palm (Acrocomia aculeata, Arecaceae)—A promising plant for biodiesel production. Aust. J. Bot. 2011, 59, 149–155. [Google Scholar] [CrossRef]
- Scariot, A.O.; Lleras, E.; Hay, J.D. Reproductive biology of the palm Acrocomia aculeata in Central Brazil. Biotropica 1991, 23, 12–22. [Google Scholar] [CrossRef]
- Scariot, A.O.; Lleras, E.; Hay, J.D. Flowering and fruiting phenologies of the palm Acrocomia aculeata: Patterns and consequences. Biotropica 1995, 27, 168–173. [Google Scholar] [CrossRef]
- Abreu, A.G.; Priolli, R.H.; Azevedo-Filho, J.A.; Nucci, S.M.; Zucchi, M.I.; Coelho, R.M.; Colombo, C.A. The genetic structure and mating system of Acrocomia aculeata (Arecaceae). Genet. Mol. Biol. 2012, 35, 119–121. [Google Scholar] [CrossRef] [PubMed]
- Nucci, S.M.; Azevedo-Filho, A.; Colomo, A.C.; Priolli, G.H.R.; Coelho, M.R.; Mata, T.L.; Zucchi, I.M. Development and characterization of microsatellites markers from the macaw. Mol. Ecol. Resour. 2008, 8, 224–226. [Google Scholar] [CrossRef] [PubMed]
- Lanes, E.C.M.; Costa, P.M.A.; Motoike, S.Y. Alternative fuels: Brazil promotes aviation biofuels. Nature 2014, 511, 31. [Google Scholar] [CrossRef] [PubMed]
- Joshua; Tickell, K. From the Fryer to the Fuel Tank: The Complete Guide to Using Vegetable Oil as an Alternative Fuel, 2nd ed.; Green Teach Publishing: Sarasota, FL, USA, 1999; Available online: http://www3.zetatalk.com/docs/Biodiesel/From_Fryer_To_Fuel_Tank_1999.pdf (accessed on 19 September 2014).
- Moura, E.F.; Motoike, S.Y.; Ventrella, M.C.; Sá Junior, A.Q.; Carvalho, M. Somatic embryogenesis in macaw palm (Acrocomia aculeata) from zygotic embryos. Sci. Hortic. 2009, 119, 447–454. [Google Scholar] [CrossRef]
- Fortes, I.C.P.; Baugh, P.J. Study of analytical on-line pyrolysis of oils from Macauba fruit (Acrocomia sclerocarpa M.) via GC/MS. J. Braz. Chem. Soc. 1999, 10, 469–477. [Google Scholar] [CrossRef]
- Bora, P.S.; Rocha, R.V.M. Macaíba palm: Fatty and amino acids composition of fruits. Cienc. Tecnol. Aliment. 2004, 4, 158–162. [Google Scholar] [CrossRef]
- Hiane, P.A.; Ramos-Filho, M.M.; Ramos, M.I.L.; Macedo, M.L.R. Bocaiúva, Acrocomia aculeata (Jacq.) Lodd., pulp and kernel oils: Characterization and fatty acid composition. Braz. J. Food Technol. 2005, 8, 256–259. [Google Scholar]
- Motoike, S.Y.; Kuki, K.N. The potential of macaw palm (Acrocomia aculeata) as source of biodiesel in Brazil. Int. Rev. Chem. Eng. 2009, 1, 632–635. [Google Scholar]
- Teixeira, L.C. Potencialidades de oleaginosas para produção de biodiesel. In Produção de Oleaginosas para Bioiesel; Lacerda, V., Ed.; Informe Agropecuário: Belo Horizonte, Brazil, 2005; pp. 18–27. [Google Scholar]
- Oliveira, D.A.; Júnior-Melo, A.F.; Brandão, M.M.; Rodrigues, L.A.; Menezes, E.V.; Ferreira, P.R.B. Genetic diversity in populations of Acrocomia aculeata (Arecaceae) in the northern region of Minas Gerais. Genet. Mol. Res. 2012. [Google Scholar] [CrossRef] [PubMed]
- Colombo, C.A.; Nucci, S.M.; Priolli, R.H.G.; Zucchi, M.I.; Carhalho, C.R.L.; Chrfl, B.L.; Siqueira, W.G.; Azvedo-Filho, J.A. Genetic Diversity of Macaw Palm (Acrocomia aculeata) by Microsatellite Markers. In Proceedings of the International Plant and Animal Genome Conference, San Diego, CA, USA, 11–16 January 2013; Available online: http://www.intlpag.org (accessed on 7 October 2013).
- Faleiro, F.G.; Costa, A.M.; Karia, C.T.; Andrade, R.P.; Junqueira, N.T.V.; Pereira, A.V.; Pereira, E.B.; Sano, S.M. Molecular Markers and Qeographic Information Systems as a Tool to Study Native Plant Species in the Brasilian Savannas, 2008. Available online: http://www.cpac.embrapa.br (accessed on 20 July 2012).
- Ribeiro, L.M.; Souza, P.P.; Rodrigues, A.G.; Oliveira, T.G.S.; Garcia, Q.S. Overcoming dormancy in macaw palm diaspores, a tropical species with potential for use as bio-fuel. Seed Sci. Technol. 2011, 39, 303–317. [Google Scholar] [CrossRef]
- Litt, M.; Luty, J.M. A hypervariable microsatellite revealed by in vitro amplification of a dinucleotide repeat within the cardiac muscle actin gene. Am. J. Hum. Genet. 1989, 44, 397–401. [Google Scholar] [PubMed]
- Tautz, D.; Trick, M.; Dover, G.A. Cryptic simplicity in DNA is a major source of genetic variation. Nature 1986, 322, 652–656. [Google Scholar] [CrossRef] [PubMed]
- Ferreira, M.E. Molecular Analysis of Gene Banks for Sustainable Conservation and Increased Use of Crop Genetic Resources: The Role of Biotechnology, 2005. Available online: http://www.fao.org/biotech (accessed on 5 April 2012).
- Mondini, L.; Noorani, A.; Pagnotta, M.A. Assessing plant genetic diversity by molecular tools. Diversity 2009, 1, 19–35. [Google Scholar] [CrossRef]
- Mohan, M.; Nair, S.; Bhagwat, A.; Krishna, T.G.; Yano, M.; Bhatia, C.R.; Sasaki, T. Genome mapping, molecular markers and marker-assisted selection in crop plants. Mol. Breed. 1997, 3, 87–103. [Google Scholar] [CrossRef]
- Agarwal, M.; Shivastava, N.; Padh, H. Advances in molecular marker techniques and their applications in plant sciences. Plant Cell Rep. 2008. [Google Scholar] [CrossRef] [PubMed]
- Motoike, S.Y.; Lopes, F.A.; Sá Júnior, A.Q.; Carvalho, M.; Oliveira, M.A.R. Processo de Germinação e Produção de Sementes Pré-Germinadas de Palmeiras do Gênero Acrocomia. Patente: Submetido à Lei de Patentes. Protocolo INPI: 014070005335; 2007. Available online: http://www.inpi.gov.br/ (accessed on 21 July 2014). [Google Scholar]
- Doyle, J.J.; Doyle, J.L. Isolation of plant DNA from fresh tissue. Focus 1990, 12, 13–15. [Google Scholar]
- Lanes, E.C.M.; Nick, C; Kuki, K.N.; Freitas, R.D.; Motoike, S.Y. Genomic DNA isolation of Acrocomia aculeata (Arecaceae) from leaf and stipe tissue samples for PCR analysis. Genet. Mol. Res. 2013, 12, 3905–3911. [Google Scholar]
- Nucci, S.M. Development, Characterization and Analyses of the Use of Microsatellite Markers in Macaw Palm Population Genetics. Master’s Thesis, University of Sâo Paulo, São Paulo, Brazil, 2007. [Google Scholar]
- Mengistu, F.G.; Motoike, S.Y.; Caixeta, E.T.; Cruz, C.D.; Kuki, K.N. Cross-species amplification and characterization of new microsatellite markers for the macaw palm, Acrocomia aculeata (Arecaceae). Plant Genet. Resour. 2015. [Google Scholar] [CrossRef]
- Brito, G.G.; Caixeta, E.T.; Gallina, P.A.; Zambolim, E.M.; Zambolim, L.; Diola, V.; Loureiro, M.E. Inheritance of coffee leaf rust resistance and identification of AFLP markers linked to the resistance gene. Euphytica 2010, 173, 255–264. [Google Scholar] [CrossRef]
- Cruz, C.D.; Ferreira, F.M.; Pessoni, L.A. Biometria Aplicada ao Estudo da Diversidade Genética, 1st ed.; UFV-Universidade Federal de Viçosa: Viçosa, Brazil, 2011. [Google Scholar]
- Nei, M. Estimation of average heterozygosity and genetic distances from a small number of individuals. Genetics 1978, 89, 583–590. [Google Scholar] [PubMed]
- Hartl, D.L.; Clark, A.G. Principles of Population Genetics, 3rd ed.; Sinauer Associates: Sunderland, MA, USA, 1997. [Google Scholar]
- Bostein, D.; Whiter, L.; Skolnick, M.; Davis, R.W. Construction of a Genetic Linkage Map in Man using Restriction Fragment Length Polymorphisms. Am. J. Hum. Genet. 1980, 32, 314–331. [Google Scholar]
- Cole, C.T. Genetic variation in rare and common plants. Annu. Rev. Ecol. Syst. 2003, 34, 213–237. [Google Scholar] [CrossRef]
- Peakall, R.; Smouse, P.E. GENALEX 6: Genetic analysis in Excel. Population genetic software for teaching and research. Mol. Ecol. Notes 2006, 6, 288–295. [Google Scholar]
- Nei, M. Genetic distance between populations. Am. Nat. 1972, 106, 238–292. [Google Scholar] [CrossRef]
- Excoffier, L.; Smouse, P.E.; Quattro, J.M. Analysis of molecular variance inferred from metric distances among DNA haplotypes: Application to human mitochondrial DNA restriction data. Genetics 1992, 131, 479–491. [Google Scholar] [PubMed]
- Excoffier, L. Analysis of population subdivision. In Handbook of Statistical Genetics; Balding, D.J., Bishop, M., Cannings, C., Eds.; John Wiley Sons: London, UK, 2001; pp. 271–307. [Google Scholar]
- Cruz, C.D. Programa Genes: Biometria; UFV-Universidade Federal de Viçosa: Viçosa, Brazil, 2006. [Google Scholar]
- Pagnotta, M.A.; Annicchiarico, P.; Farina, A.; Proietti, S. Characterizing the moleular and morphophysiological diversity of Italian red clover. Euphytica 2011, 179, 393–404. [Google Scholar] [CrossRef] [Green Version]
- Crinò, P.; Tavazza, R.; Rey Munoz, N.A.; Nisini, P.T.; Saccardo, F.; Ancora, G.; Pagnotta, M.A. Recovery, morphological and molecular characterization of globe artichoke ‘Romanesco’ landraces. Genet. Resour. Crop. Evol. 2008, 55, 823–833. [Google Scholar] [CrossRef] [Green Version]
- Pagnotta, M.A.; Mondini, L.; Atallah, M.F. Morphologocal and molcular characterization of Italian emmer wheat accessions. Euphytica 2005, 146, 29–37. [Google Scholar] [CrossRef] [Green Version]
- Pérez-González, M.A.; Caujapé-Castells, J.; Sosa, P.A. Allozyme variation and structure of the Canarian endemic palm tree Phoenix canariensis (Arecaceae): Implications for conservation. Heredity 2004, 93, 307–315. [Google Scholar] [CrossRef] [PubMed]
- Yeh, F.C.; Chong, D.K.; Yang, R.C. RAPD variation within and among natural populations of trembling aspen (Populus tremuloides Michx). J. Hered. 1995, 86, 454–460. [Google Scholar] [PubMed]
- Sales, E.; Nebauer, S.G.; Mus, M.; Segura, J. Population genetic study in the Balearic endemic plant species Digitalis minor (Scrophulariaceae) using RAPD markers. Am. J. Bot. 2001, 88, 1750–1759. [Google Scholar] [CrossRef] [PubMed]
- Wadt, L.H. Estruturagenética de Populações Naturais de Pimenta Longa (Piper hispidinervum), Visandoseuuso e Coservação. Ph.D. Thesis, Universidade de Federal de São Paulo, São Paulo, Brazil, 2001. [Google Scholar]
- Zimback, L.; Mori, E.S.; Kagyama, P.Y.; Veiga, R.F.A.; Junior, J.R.S.M. Estrutura genética de populações de Trichilia pallida Swartz (Meliaceae) por marcadores RAPD. Sci. For. 2004, 65, 114–119. [Google Scholar]

| No. | Population | Number of Individuals | State/Provenance * | Coordinates ** | No. | Population | Number of Individuals | State/Provenance * | Coordinates ** | ||
|---|---|---|---|---|---|---|---|---|---|---|---|
| Latitude | Longitude | Latitude | Longitude | ||||||||
| 1 | BGP99 | 5 | PA | S 06 03 58.0 | W 49 33 39.0 | 22 | BGP11 | 5 | EMG | S 19 14 01.2 | W 43 03 28.4 |
| 2 | BGP82 | 5 | PE | S 07 14 23.0 | W 36 46 55.0 | 23 | BGP9 | 5 | EMG | S 19 33 12.0 | W 46 51 10.1 |
| 3 | BGP124 | 4 | PB | S 08 48 49.0 | W 36 57 14.0 | 24 | BGP78 | 5 | EMG | S 18 51 25.6 | W 46 52 55.2 |
| 4 | BGP51 | 5 | SP | S 21 32 04.6 | W 48 44 24.7 | 25 | BGP37 | 5 | EMG | S 18 40 51.3 | W 46 33 41.4 |
| 5 | BGP34 | 5 | SP | S 22 25 10.8 | W 50 34 43.1 | 26 | BGP33 | 5 | EMG | S 19 19 40.3 | W 46 38 11.5 |
| 6 | BGP47 | 5 | SP | S 22 29 14.2 | W 50 46 16.2 | 27 | BGP21 | 4 | WMG | S 19 31 15.9 | W 46 31 42.2 |
| 7 | BGP20 | 5 | NMG | S 16 39 52.7 | W 43 53 58.9 | 28 | BGP2 | 5 | WMG | S 20 39 20.4 | W 43 18 45.2 |
| 8 | BGP27 | 5 | NMG | S 16 21 20.7 | W 44 25 30.5 | 29 | BGP76 | 5 | WMG | S 19 41 51.4 | W 43 11 27.7 |
| 9 | BGP22 | 4 | NMG | S 17 25 54.0 | W 45 08 59.5 | 30 | BGP25 | 5 | WMG | S 17 06 54.6 | W 43 49 16.4 |
| 10 | BGP16 | 5 | NMG | S 16 26 07.6 | W 44 00 50.5 | 31 | BGP64 | 5 | WMG | S 16 44 12.7 | W 43 51 54.9 |
| 11 | BGP49 | 5 | NMG | S 20 38 58.0 | W 44 01 15.5 | 32 | BGP105 | 3 | MS | S 20 29 52.5 | W 55 18 39.3 |
| 12 | BGP10 | 5 | NMG | S 21 03 12.9 | W 44 16 28.2 | 33 | BGP102 | 4 | MS | S 20 30 38.6 | W 55 37 59.7 |
| 13 | BGP68 | 5 | SMG | S 21 11 27.6 | W 44 19 29.7 | 34 | BGP104 | 4 | MS | S 20 27 55.9 | W 55 46 41.7 |
| 14 | BGP3 | 5 | SMG | S 21 09 52.2 | W 44 08 49.5 | 35 | BGP117 | 3 | MS | S 20 27 56.5 | W 55 46 38.2 |
| 15 | BGP51 | 5 | SMG | S 21 17 20.5 | W 44 49 12.6 | 36 | BGP118 | 4 | MS | S 20 50 22.3 | W 55 54 53.3 |
| 16 | BGP5 | 5 | SMG | S 19 05 02.0 | W 44 39 13.9 | 37 | BGP112 | 5 | MS | S 20 50 16.5 | W 55 54 51.8 |
| 17 | BGP14 | 5 | SMG | S 19 56 29.0 | W 44 36 12.0 | 38 | BGP106 | 3 | MS | S 21 28 42.3 | W 56 10 03.6 |
| 18 | BGP18 | 5 | CMG | S 19 52 34.0 | W 43 52 20.5 | 39 | BGP92 | 5 | MS | S 21 28 45.7 | W 56 10 06.6 |
| 19 | BGP24 | 5 | CMG | S 19 53 20.2 | W 43 41 11.5 | 40 | BGP103 | 5 | MS | S 21 42 04.8 | W 57 50 39.0 |
| 20 | BGP1 | 5 | CMG | S 20 17 42.6 | W 43 42 30.9 | 41 | BGP119 | 4 | MS | S 21 42 06.0 | W 57 50 32.4 |
| 21 | BGP52 | 5 | CMG | S 20 50 13.1 | W 42 54 27.3 | ||||||
| Locus | Forward and Reverse Primer Sequence (5´–3´) | Allele Size (bp) | A | Ho | He | F | PIC | Tm (°C) | Source * |
|---|---|---|---|---|---|---|---|---|---|
| Aacu07 | F: ATCGAAGGCCCTCCAATACT | 153–177 | 6 | 0.43 | 0.48 | 0.10 | 0.43 | 56 | a |
| R: AAATAAGGGGACCCTCCAA | |||||||||
| Aacu10 | F: TGCCACATAGAGTGCTTGCT | 168–186 | 8 | 0.58 | 0.69 | 0.16 | 0.65 | 56 | a |
| R: CTACCACATCCCCGTGAGTT | |||||||||
| Aacu12 | F: GAATGTGCGTGCTCAAAATG | 190–202 | 11 | 0.57 | 0.71 | 0.20 | 0.67 | 56 | a |
| R: AATGCCAAGTGACCAAGTCC | |||||||||
| Aacu26 | F: ACTTGCAGCCCCATATTCAG | 273–316 | 9 | 0.41 | 0.63 | 0.35 | 0.56 | 56 | a |
| R: CAGGAACAGAGGCAAGTTC | |||||||||
| Aacu30 | F: TGTGGAAGAAACAGGTCCC | 148–158 | 6 | 0.39 | 0.43 | 0.09 | 0.38 | 56 | a |
| R: TCGCCTTGAGAAATTATGGC | |||||||||
| Aacu38 | F: TTCTCAGTTTCGTGCGTGAG | 316–346 | 6 | 0.13 | 0.64 | 0.80 | 0.58 | 56 | b |
| R: GGGAGGCATGAGGAATACAA | |||||||||
| Aacu45 | F: CAGACTACCAGGCTTCCAGC | 260–284 | 5 | 0.30 | 0.38 | 0.21 | 0.34 | 56 | b |
| R: TCATCATCGCAGCTTGACTC | |||||||||
| Aacu74 | F: TACTGTTGTGCCAAGTCCCA | 278–313 | 9 | 0.26 | 0.45 | 0.42 | 0.42 | 56 | b |
| R: GAGCACAAGGGGGATATCAA | |||||||||
| Aac04 | F: GCATTGTCATCTGCAACCAC | 258–306 | 8 | 0.61 | 0.72 | 0.15 | 0.68 | 60 | c |
| R: GCAGGGGCCATAAGTCATAA | |||||||||
| Aac12 | F: GCTCTGTAATCTCGGCTTCCT | 229–247 | 4 | 0.06 | 0.31 | 0.81 | 0.27 | 60 | c |
| R: TCCAGTTCAAGCTCTCTCAGC | |||||||||
| Mean | - | 7.2 | 0.37 | 0.54 | 0.33 | 0.50 | - | - |
| Provenances | Nt | Pa | Na | F | P95 | ||
|---|---|---|---|---|---|---|---|
| PA | 32 | 0.44 | 3.20 | 0.46 | 0.54 | 0.15 | 90 |
| PE | 29 | 0.40 | 2.90 | 0.34 | 0.45 | 0.24 | 90 |
| PB | 28 | 0.38 | 2.80 | 0.35 | 0.49 | 0.29 | 100 |
| SP | 39 | 0.53 | 3.90 | 0.32 | 0.56 | 0.42 | 90 |
| NMG | 52 | 0.71 | 5.20 | 0.32 | 0.62 | 0.48 | 90 |
| SMG | 39 | 0.53 | 3.90 | 0.36 | 0.52 | 0.32 | 80 |
| CMG | 42 | 0.58 | 4.20 | 0.29 | 0.56 | 0.48 | 90 |
| EMG | 43 | 0.59 | 4.30 | 0.30 | 0.51 | 0.40 | 90 |
| WMG | 55 | 0.75 | 5.10 | 0.28 | 0.63 | 0.55 | 100 |
| MS | 57 | 0.78 | 5.70 | 0.46 | 0.59 | 0.22 | 100 |
| Mean | 42 | - | 4.12 | 0.35 | 0.55 | 0.36 | 92 |
| Group | Provenances | Mean Intra-Group Distance | Mean Inter-Group Distance |
|---|---|---|---|
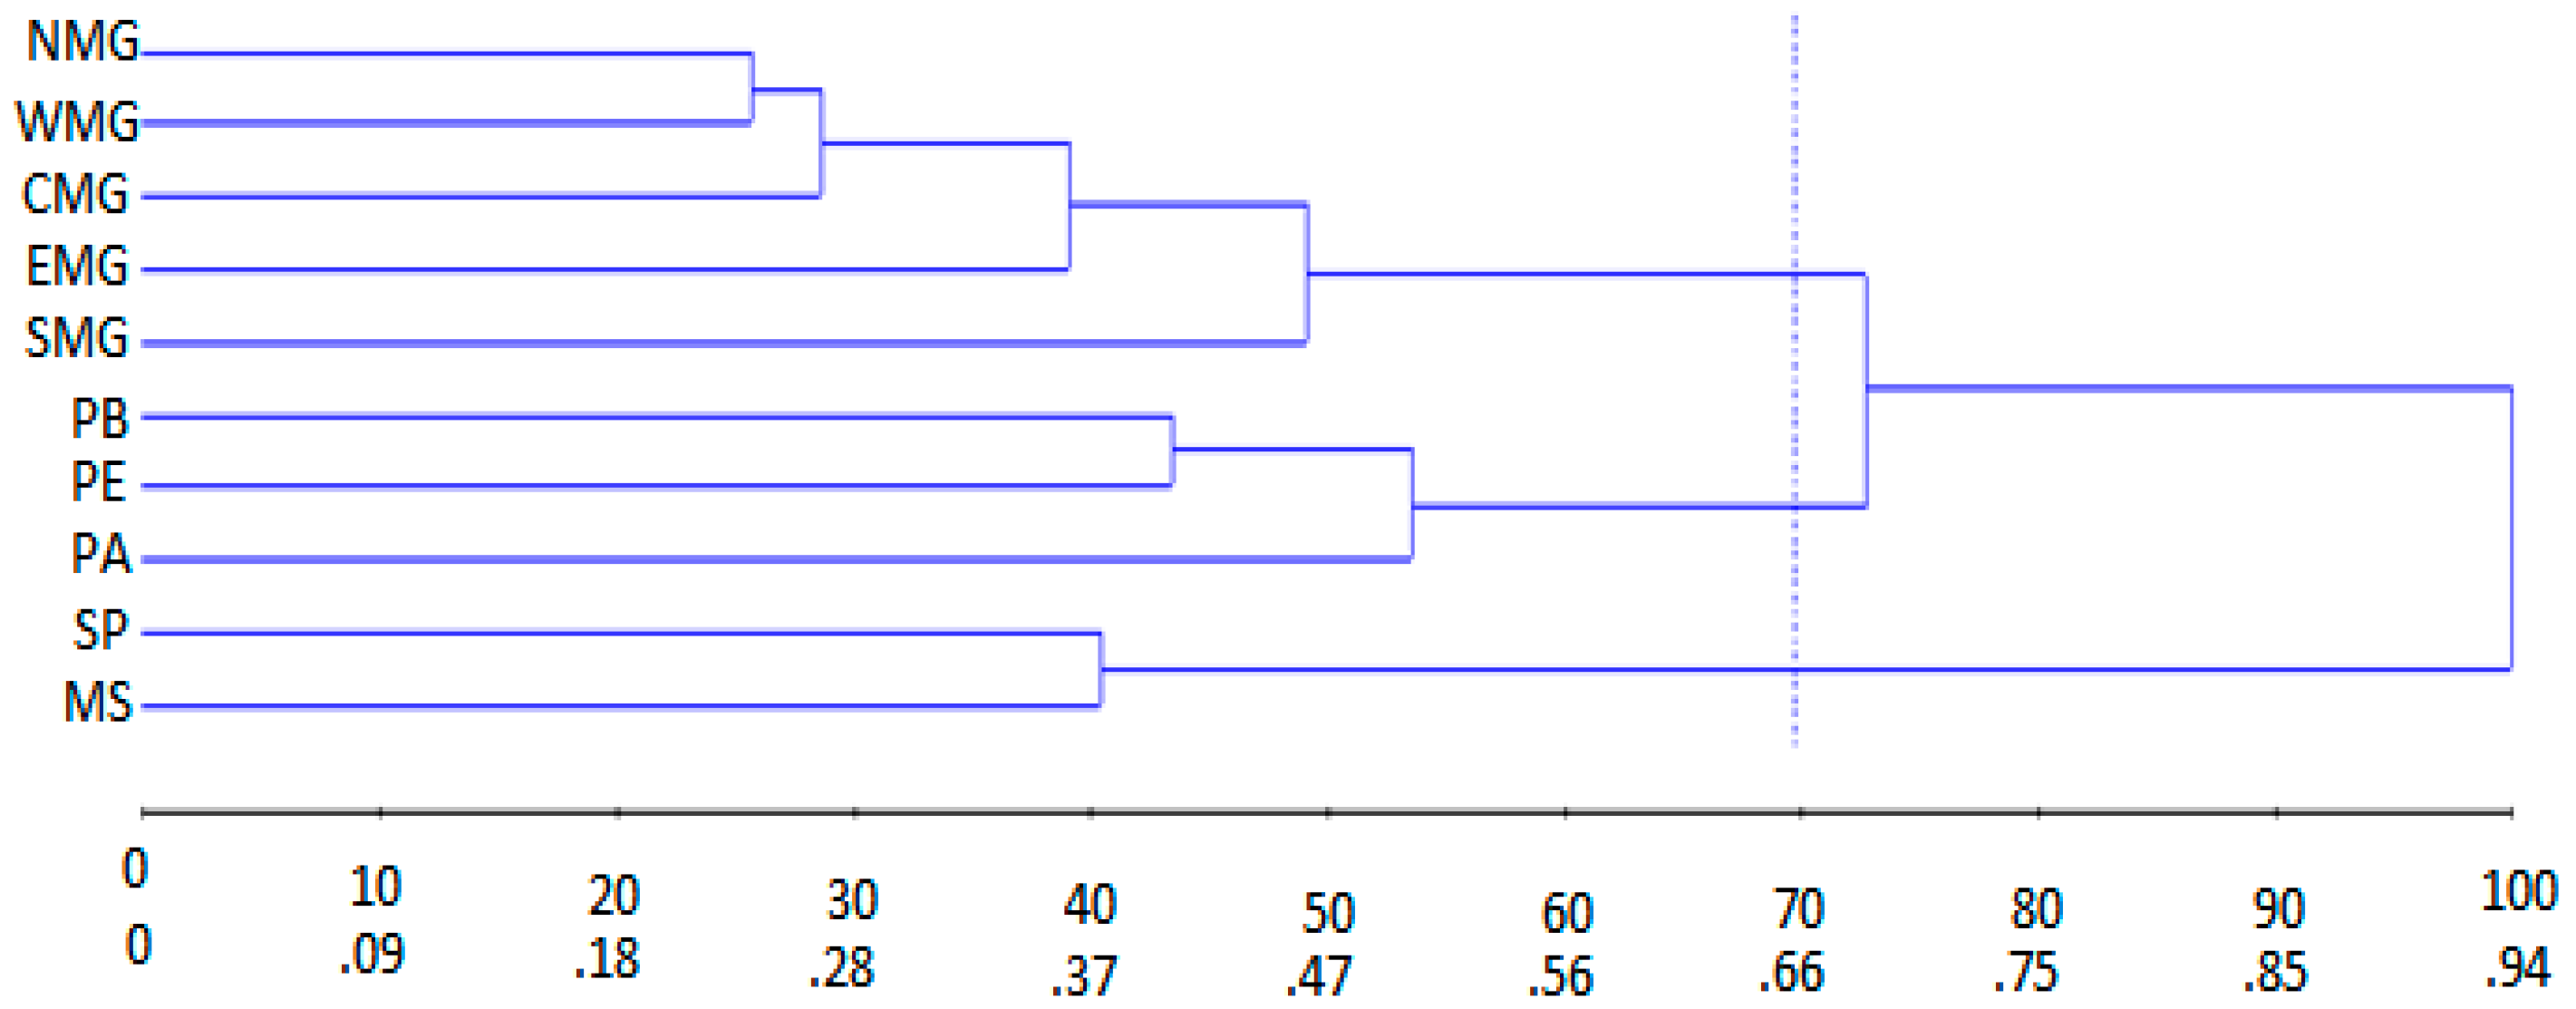
| 1 | NMG WMG CMG EMG SMG | 0.37 | D1,2 = 1.05; D1,3 = 0.64; D1,4 = 0.77 |
| 2 | SP MS | 0.38 | D2,3 = 0.80; D2,4 = 0.67 |
| 3 | PB PE | 0.41 | D3,4 = 0.50 |
| 4 | PA | - | - |
| Source of Variance | df | Variance | % | Φ-Statistics | Sig. |
|---|---|---|---|---|---|
| Among provenance | 6 | 0.1217 | 15.31 | ΦCT = 0.4307 | * |
| Among populations/provenance | 31 | 0.2901 | 36.47 | ΦSC = 0.1531 | * |
| Among individuals/population | 140 | 0.3835 | 48.22 | ΦST = 0.5178 | * |
© 2016 by the authors; licensee MDPI, Basel, Switzerland. This article is an open access article distributed under the terms and conditions of the Creative Commons Attribution (CC-BY) license (http://creativecommons.org/licenses/by/4.0/).
Share and Cite
Mengistu, F.G.; Motoike, S.Y.; Cruz, C.D. Molecular Characterization and Genetic Diversity of the Macaw Palm Ex Situ Germplasm Collection Revealed by Microsatellite Markers. Diversity 2016, 8, 20. https://doi.org/10.3390/d8040020
Mengistu FG, Motoike SY, Cruz CD. Molecular Characterization and Genetic Diversity of the Macaw Palm Ex Situ Germplasm Collection Revealed by Microsatellite Markers. Diversity. 2016; 8(4):20. https://doi.org/10.3390/d8040020
Chicago/Turabian StyleMengistu, Fekadu G., Sérgio Y. Motoike, and Cosme D. Cruz. 2016. "Molecular Characterization and Genetic Diversity of the Macaw Palm Ex Situ Germplasm Collection Revealed by Microsatellite Markers" Diversity 8, no. 4: 20. https://doi.org/10.3390/d8040020