Abstract
Invasion by non-native tree species is an environmental and societal challenge requiring predictive tools to assess invasion dynamics. The frequent scale mismatch between such tools and on-ground conservation is currently limiting invasion management. This study aimed to reduce these scale mismatches, assess the success of non-native tree invasion and determine the environmental factors associated to it. A hierarchical scaling approach combining species distribution models (SDMs) and satellite mapping at very high resolution (VHR) was developed to assess invasion by Acacia dealbata in Peneda-Gerês National Park, the only national park in Portugal. SDMs were first used to predict the climatically suitable areas for A. dealdata and satellite mapping with the random-forests classifier was then applied to WorldView-2 very-high resolution imagery to determine whether A. dealdata had actually colonized the predicted areas (invasion success). Environmental attributes (topographic, disturbance and canopy-related) differing between invaded and non-invaded vegetated areas were then analyzed. The SDM results indicated that most (67%) of the study area was climatically suitable for A. dealbata invasion. The onset of invasion was documented to 1905 and satellite mapping highlighted that 12.6% of study area was colonized. However, this species had only colonized 62.5% of the maximum potential range, although was registered within 55.6% of grid cells that were considerable unsuitable. Across these areas, the specific success rate of invasion was mostly below 40%, indicating that A. dealbata invasion was not dominant and effective management may still be possible. Environmental attributes related to topography (slope), canopy (normalized difference vegetation index (ndvi), land surface albedo) and disturbance (historical burnt area) differed between invaded and non-invaded vegetated area, suggesting that landscape attributes may alter at specific locations with Acacia invasion. Fine-scale spatial-explicit estimation of invasion success combining SDM predictions with VHR invasion mapping allowed the scale mismatch between predictions of invasion dynamics and on-ground conservation decision making for invasion management to be reduced. Locations with greater potential to suppress invasions could also be defined. Uncertainty in the invasion mapping needs to be accounted for in the interpretation of the results.
1. Introduction
The spread of non-native species is of global concern [1] and the mitigation of invasions is a target of the European Union 2020 Strategic Plan for Biodiversity [2]. Mountains, areas of global significance for people and biodiversity, are particularly sensitive to invasion by non-native species [3]. To quantify and monitor the success of invasion processes is therefore a major step-forward to evaluate and mitigate the impacts of non-native species in the structure and functioning of ecosystems, and to support management.
The quantification and analysis of invasion extent at the landscape level is at the basis of effective management. One of the most frequent approaches for such purpose is represented by spatial predictions obtained from species distribution models (SDMs) based on habitat suitability. Despite their relevance in many contexts, these predictions present some limitations for monitoring or mitigation purposes (e.g., in terms of grain or detail; [4]) as highlighted by the scarce evidence of SDMs supporting solutions for on-ground conservation problems [5]. The scale mismatch between this predictive tool and on-ground conservation is limiting invasion management. Accurate high-resolution mapping of land colonized by invasive species is increasingly used for management decisions [6] as it allows such colonization be quantified, a greater understanding of invasion dynamics and ecosystem responses from regional to local (landscape) scales and a guidance of plot-level studies. However, the link between SDMs and remote sensing can provide information that is needed to address new invasion ecology challenges as invasion dynamics and success of invasion [7,8].
Recent developments in Earth Observation (EO), the dissemination of satellite systems and data (e.g., Sentinel-2) and advances in classification approaches [9,10,11] have collectively provided new opportunities for such integration. The sensors resolution (spectral, spatial and temporal) has improved and the set of semi-automated image interpretation methods (e.g., EODHAM, [12]) allowed repeatability and increased detail and accuracy of mapping [6]. In this front, Object-Based Image Analysis (OBIA) techniques have facilitated the use of very high resolution (VHR) optical imagery (e.g., WorldView-2) [13,14,15], namely with sub-metric spatial resolution of image pixels. The merging of terrain and spectral data into image classifications [16,17] and the use of texture measures as contextual descriptors [18] has also enhanced the classification ability of machine-learning algorithms including random forests (RF) [19,20] and support vector machines (SVMs) [21].
These advances are evidenced by the increasing attempts to combine remote sensing variables and SDM frameworks [6,22,23,24], mainly to proxy or describe structural or functional attributes of the landscape. In invasion ecology, this incorporation has focused primarily on obtaining predictive variables to improve spatial and temporal representations of species distribution [25]. However, other strategies to integrate remote sensing data and ecological models exist [26], namely their combination into hierarchical scaling approaches that seek to use both source data as independent descriptors for invasion processes. When combined, these sources allow the success of invasion to be assessed by linking forecasted suitability with observed invasion distribution at fine resolution, and to use this data to further analyze the invasion process. These approaches and data can contribute to efforts aimed at addressing on-ground conservation [5]. For example, the comprehension and management of European Larch colonization has been assisted by linking regional habitat suitability with landscape dynamics models [27].
In this study, invasion success was assumed as the capacity of non-native species to colonize areas forecasted for invasion. We aimed to illustrate a fine-scale spatially-explicit mapping of invasion success by the non-native tree A. dealbata combining the strength of SDMs predictions at regional scale (200 × 200 m) with fine resolution mapping based on WorldView-2 very-high resolution satellite data (2 × 2 m). The approach combined hierarchically the two types of information. First, SDMs predicted the regional potential distribution of A. dealbata based on the climate suitability. Then, scaling down to the landscape level using OBIA satellite mapping with RF classification, the success of A. dealbata in colonizing those areas was assessed by two metrics: overall and specific success rate of invasion. Later, environmental attributes (topographic, disturbance and canopy-related) of invaded and non-invaded vegetated areas were compared to identify specific attributes of A. dealbata invasion which may conduct to changes in environmental attributes of landscape. Results are discussed considering the ecology of A. dealbata invasion and the relevance of the proposed approach to manage invasion in a societal context where managing authorities has limited human resources and large areas to cover. The Peneda-Gerês National Park (Portugal), where A. dealbata was planted as far back as 1905 for soil erosion control [28], was the study area. Portugal is one of the European countries most affected by plant invasions [29] particularly by Acacia trees, a group of widespread and aggressive non-native plants in Europe and an environmental threat to native biodiversity in Southwestern Europe [4,7,30].
2. Materials and Methods
2.1. Study Area
The study area comprises 53.5 km2 located in a central valley of the Peneda-Gerês National Park (41°42′25.2″ N, 8°10′1.2″ W) in the northwest of Portugal (Figure 1). It is included in the transnational UNESCO biosphere reserve Gerês-Xurês and protected under EU legislation (Habitats and Birds Directives). The climate is temperate sub-Mediterranean influenced by its location at the transition between Atlantic and Mediterranean conditions. Total precipitation amounts to 1300 mm/year and mean annual temperature to 13 °C, with large amplitude in mean annual values between cold and warm seasons (−10 to 35 °C). Elevation ranges from 145 to 1253 m above sea level (a.s.l) with steep slopes (>20°). Scrub and deciduous oak forests developed on granite bedrock are the main vegetation types, as a follow-up of the abandonment of extensive husbandry. Pine forests are also another relevant vegetation type, especially on common land. Agricultural areas occupy a small and decreasing extent at lower altitudes. Invasion of non-native A. dealbata species is a main and strong active process of ecological change. The local introduction of A. dealbata species started in 1898–1899 with the plantation of 550 plants by the forestry service to stabilize slopes [28] and ended in 1905. Inhabitants documented the presence of A. dealbata at least over the last 45 years and indicated that the management of the species areas has changed. While to cut A. dealbata required authorization in the 1970s, nowadays authorities offer support to cut and collect the species wood to be used by the population. Chemical control was also applied to the species in the 1990s.
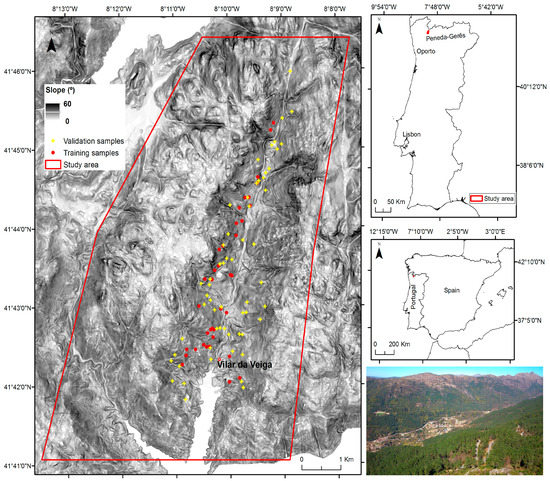
Figure 1.
Study area located at Peneda-Gerês National Park and sites used for training and validation of invasion mapping with OBIA and supervised classification with random forest (RF) and WorldView-2 satellite data. In the photograph, the main valley and the A. dealbata invaded slope in the distance (yellowish area of vegetation) can be observed.
2.2. Input Data Collection
A Worldview-2 satellite scene recording the study area during summer (23 June 2013) was acquired. This VHR platform records data in eight bands with ground resolution of 2 m: coastal blue (b1 0.40–0.45 μm), blue (b2 0.45–0.51 μm), green (b3 0.51–0.58 μm), yellow (b4 0.59–0.63 μm), red (b5 0.63–0.69 μm), red edge (b6 0.71–0.75 μm), near-Infrared 1 (b7 0.77–0.90 μm), and near Infrared 2 (b8 0.86–1.04 μm). Imagery pre-processing consisted in the orthorectification of scene using a Digital Elevation Model (DEM; 20 m spatial resolution) and a bilinear convolution algorithm based on six ground control points, yielding average Root Mean Square Error values (RMSE) of 1.45 m.
Eight spectral per-pixel layers were estimated using this satellite imagery (see Table 1): Normalized Difference Vegetation Index (NDVI), Tasseled Cap Transformation wetness (TCTw), Water Band Index (WBI), Normalized Difference Soil Index (NDSI), Red Edge Position (REP), Standardized Blue/Green ratio (BGND), Land Surface Albedo (LSA), and Forest Discrimination Index (FDI). The DEM from the Portuguese Geographic Institute was used to derive elevation, slope and aspect variables. Spatial distribution of wildfires (burnt area) between 2000 and 2013 (14 years) was assembled from the Portuguese National Fire Inventory (NFI [31]).

Table 1.
List and rationale of spectral and topographical variables estimated to support A. dealbata invasion mapping. Normalized Difference Vegetation Index (NDVI); Tasseled Cap Transformation Wetness (TCTw); Water Band Index (WBI); Normalized Difference Soil Index (NDSI); Red Edge Position (REP); Standardized Blue/Green ratio (BGND); Land Surface Albedo (LSA); Forest Discrimination Index (FDI). NIR and R refer to Near-Infrared and Red bands, respectively; and B, G and Y refer to blue, green and yellow bands, respectively.
Ground data on A. dealbata invasion was collected in the field in April 2015 (n = 77) and a set of complementary points (due to the inaccessibility of some locations) were obtained from very-high resolution imagery of Google Earth between 2010 and 2013 (n = 20; see Figure 1), totalizing 97 plots. The 77 locations were surveyed using a minimum sampling unit of 20 m2 and coordinates were recorded using a Spectra Precision ProMark 120 device. Each plot was classified into invaded areas or non-invaded areas, the vegetation type assigned and data saved in shapefile format. Using these point data, regions of interest (ROIs) were manually digitized and rasterized to the same spatial resolution as the WorldView-2 scene (2 × 2 m).
2.3. Regional Spatial-Explicit Suitability for A. dealbata Invasion
An available spatial-explicit invasion suitability forecast for A. dealbata (200 × 200 m resolution) was considered to obtain the potential distribution for the species in the study area (Figure 2). This dataset results from species distribution modeling (SDMs) [4] established to predict the distribution of A. dealbata (200 × 200 m cells) in Northern Portugal. The occurrence dataset used to fit the model was collected through field surveys, between January and March 2012, during the species flowering season. An equal-stratified sampling design was used to randomly select 20 plots in each of the 9 final strata. Presence or absence data for the species was collected in each of the plots (200 × 200 m), with a fixed sampling effort established (≈30 min per plot). The final occurrence dataset used for model fitting comprised 138 records (69 presences and 69 absences). The final distribution model was obtained by applying an ensemble forecasting framework available in software R through the package biomod2 [43], coupled with the combined predictive modeling approach [30]. Separate ensemble models were fitted, based on the combination of nine modeling algorithms available in biomod2. These separate models were fitted using either regional or local predictors and a final ensemble model was obtained by spatially overlapping the two model projections (see [4]) to generate a detailed description of the full modeling procedure). The final ensemble model comprises four different prediction categories: suitable regional conditions and local habitat, only suitable regional conditions, only suitable local habitat, and unsuitable regional conditions and local habitat. For our study, these categories were reclassified into suitable and not suitable.
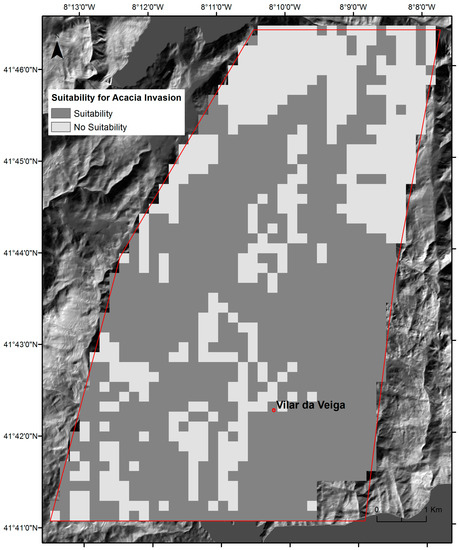
Figure 2.
Locations climatically suitable for invasion by A. dealbata in the study area obtained from species distribution modeling (SDMs) [4].
2.4. Mapping of A. dealbata Invasion and Estimation of Success Rate Of Invasion
To identify the areas invaded by A. dealbata and thereby determine the success rate of A. dealbata invasion, an OBIA classification with RF algorithm was performed following the OBIA classification paradigm [44]. The classification procedure involved image segmentation, object-based dataset composition and invasion classification with RF, a machine-learning algorithm. The used analytical framework is presented in Figure 3.
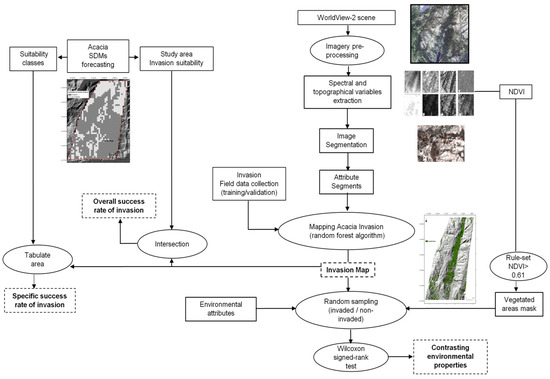
Figure 3.
Illustration of the mapping analytical framework applied in this study to map invasion, estimate invasion success and comprehend environmental attributes differing between invaded and non-invaded vegetated areas.
Three layers were used for image segmentation: NDVI, Water WBI and BRND (see Table 1). Segmentation was performed using the k-means clustering algorithm implemented in RSGISLib open-source software [41]. Iterative k-means clustering algorithm and cleaning routines [41] partitioned the landscape into spectrally homogeneous objects by clumping pixels into contiguous regions of minimum heterogeneity. K-means clustering parameters were set to: maximum number of initial clusters (250), maximum number of iterations (500), maximum degree of change (0.05), and the diagonal range attaching initiation method. During the cleaning phase, objects with less than 100 pixels (including single pixels) were removed, and the maximum spectral distance was set at 100,000. The median size of the objects amounted to 660 m2 (min: 8, max: 725,500 and standard deviation: 2888.7).
The objects obtained in the segmentation stage were further populated with average statistics for all the layers (Table 1), including the ground-truth invasion data created above. This object-based dataset was saved in a KEA format [41]. To map invasion extent, a RF classifier was developed and the object-based dataset was used as input for the set of predictors and training data. The training data consisted of 37 samples selected from the ground-truth layer (n = 97). Several setup parameters were available and the following primary parameters for RF model were considered: maximum number of features RF (max_features: 3), number of trees (n_estimators: 500) and RF validation (oob_score = False). The invasion map obtained was assessed for accuracy generating an error-matrix relating the mapped invasion to ground truth data (n = 60) [45]. The Python-based Scikit-learn package [46] was used for RF classification.
To measure the success rate of A. dealbata invasion in the study area, two metrics were established: (i) overall success (OS; Equation (1)); and (ii) specific success rate (SS; Equation (2)). Ta_WV2 is the total grid cells currently invaded by A. dealbata and Ta_SDMs is the total grid cells predicted by the regional SDM as either having suitable or non-suitable conditions for invasion. Ta_WV2_i is the invaded area (in m2) in each SDM unit (200 × 200 m). The overall success metric measured the distribution of mapped invasion across the invasion suitability classes predicted by the SDMs. The specific success metric measured the fractional cover of invasion (%) in each invaded grid cell. The spatially-explicit invasion suitability map (200 × 200 m) described above was used as reference and a tabulate area function was applied. All grid cells registering less than 2% of fractional cover were excluded from the analysis to consider they might result from mapping errors. Overall and specific success rate of invasion metrics are spatial-explicit variables and in this study were calculated as:
2.5. Comparison of Environmental Attributes between Invaded and Non-Invaded Vegetated Areas
To identify environmental attributes differing between invaded and non-invaded vegetated areas, three groups of spatially-explicit variables were considered (see Figure 4): topographic (elevation, slope and aspect, and topographic wetness index (TWI)), disturbance (historical burnt area) and canopy-related (NDVI, BRND and LSA). The non-parametric Wilcoxon signed-rank test was used to compare median rank differences. The correlation between variables was checked beforehand and all values were <0.6. Due to the large number of pixels, sampling was used including 5% of vegetated pixels. Vegetated/non-vegetated areas were masked by applying a 0.61 threshold to NDVI. This value optimized the discrimination between these two types of areas based on visual inspection.
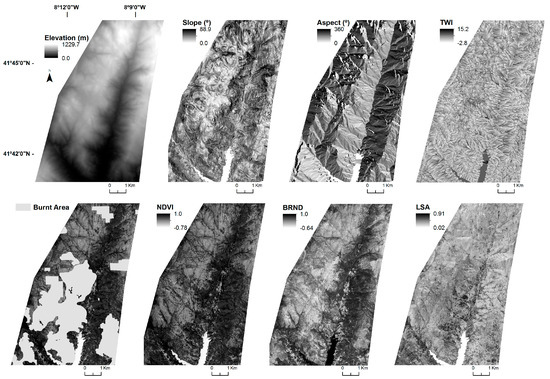
Figure 4.
Illustration of environmental variables used to analyze the success rate of invasion and to compare invaded and non-invaded areas: elevation, slope, aspect, TWI, burnt area, NDVI, BRND and LSA.
This comparative analysis can contribute to pattern specific ecological characteristics of A. dealbata invasion and to identify environmental attributes of landscape that may alter with the replacement of non-invasive vegetation. The set of variables was chosen based on previous observed relationships with Acacia invasion and on the insufficient knowledge about differences in canopy attributes of invaded and non-invaded vegetated areas retrieved by fine-scale remote sensing data. Previous literature indicated an influence of topographic and disturbance factors on invasion processes at regional scale. Topographic variables proxy the effect that spatial variation exerts in energy fluxes (e.g., light interception) influencing plant establishment and growing in mountain environment. Topographic variables estimation is given in Section 2.2. For statistical analysis, the variable aspect was transformed using the cosine (northness) and sine (eastness) functions. TWI measures the potential wetness of a given area [47] influencing among other aspects, woody seed germination [48,49]. TWI is defined as Ln (A/tan (b)), where A is the specific drainage area (local upslope area draining through a certain point per unit contour length) and b is the slope angle [47]. TWI has been used to indicate soil moisture, zones of saturation and source areas of runoff [50]; and to characterize net primary productivity, runoff [51], vegetation patterns [52], and distribution of plant species richness and correlated well with groundwater depth and soil pH [53]. Disturbance effect was described by the cumulated historical burnt area between 2000 and 2013 (14 years). Wildfire is the major disturbance process in the study area and literature suggests that wildfire favored invasion in southwestern European landscapes [7,54]. The canopy-related variables proxy the influence of vegetation structure during the invasion process using three satellite-derived indices: NDVI, BRDN and LSA. NDVI measured the greenness intensity, which is associated to health and physiological condition of plants [55]. BRDN reflects the structure of the canopy, as measured by the proportion of shadows within the canopy [38]. Large BRDN values suggest a substantive woody canopy, whose light interception may be influenced by vegetation sub-layers. LSA quantified the fraction of light that is reflected by the Earth back into space and is one of the key geophysical variables controlling surface radiation budget [56]. Low values indicate high absorption by the surface, which influences microclimate (e.g., canopy temperature, transpiration and water requirements). Albedo-based studies presents real opportunities to inform on environmental and wildlife management for several ecosystems [57].
3. Results
3.1. The Success Rate of A. dealbata Invasion in the Study Area: Mapped and SDMs Forecasted Spatial Patterns
The extent of A. dealbata invasion in 2013 amounts to 6.72 km2 or 12.6% of the study area (Figure 5; 53.5 km2). The cross-tabulation matrix used to assess classification accuracy based on ground truth data collected in April of 2015 indicated that the invasion map obtained from the object-based RF classification is consistent. The overall accuracy and Kappa Coefficient was 91.3% and 0.81%, respectively. The invasion class registered accuracies up to 86.5% with the object-oriented classification assisted by variables derived from spectral indices (WorldView-2 imagery) and topography (Table 2).
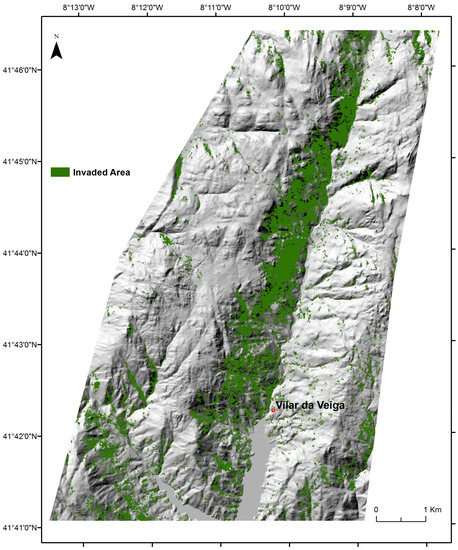
Figure 5.
Spatial distribution of A. dealbata invaded areas obtained from object oriented classification with RF algorithm (predictors = 11, n = 37 training sites).
Table 2.
Error matrix for the A. dealbata invasion map using ground-truth samples (n = 60).
The SDMs predictions for A. dealbata invasion in the study area (Figure 2) comprised 1324 grid cells (200 × 200 m; ca 53 km2), 67% of the cells with suitability for invasion (n = 887) and 33% without suitable conditions (n = 437). These predictions were assumed to represent the maximum expectable extent for invasion. The overall success rate of invasion, which measured the distribution of mapped invasion across the suitability classes, indicated that 60.2% of total cells (797/1324) registered invasion, 69.6% in cells with suitability (n = 555) and 30.4% in unsuitable cells (n = 242). A. dealbata has already colonized 62.5% of total cells with suitability for invasion (555/887), but also 55.6% of unsuitable cells (242/437; Figure 6). The specific success rate of invasion, measured by the fractional cover of invasion within each invaded grid cell (200 × 200 m), varied from 2% to 99% (Figure 7), with most grid cells below the 40% threshold. The highest success values occurred in the central part of the valley.
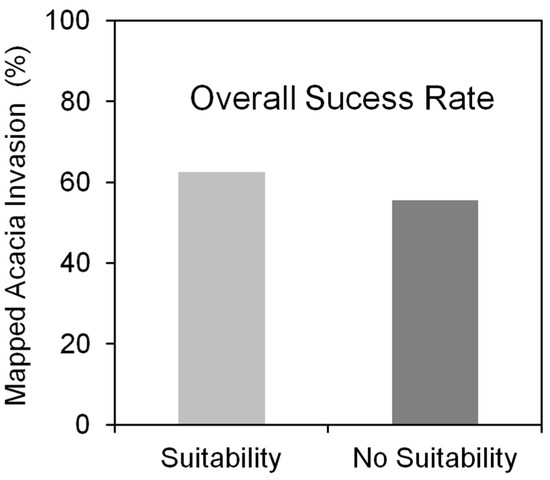
Figure 6.
The distribution of mapped Acacia invasion across the predicted invasion suitability classes (overall success rate) estimated with SDMs (200 × 200 m).
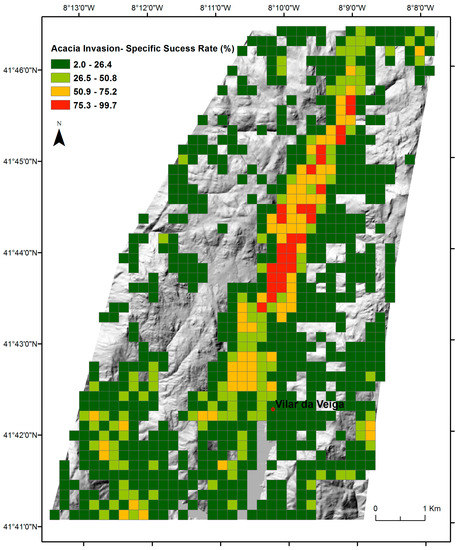
Figure 7.
The specific success rate of Acacia invasion with respect to SDMs predicted invasion suitability, measured as the fractional cover of mapped invasion in each invaded grid cell (200 × 200 m).
3.2. Variation of Environmental Attributes between Invaded and Non-Invaded Vegetated Areas
A set of eight spatially-explicit environmental attributes grouped into three thematic fields (topographic, disturbance and canopy-related) were considered to evaluate the differences between A. dealbata invaded and non-invaded vegetated areas. The comparison performed with the Wilcoxon signed-rank test using 5% of vegetated pixels indicated that all environmental attributes significantly differed (p < 0.001) (see Figure 8). Invaded areas occupied locations at lower altitudes between uplands and lowlands, with higher slopes and mostly on east-facing slopes (sin_aspect). Potential soil wetness represented by TWI measures was also slightly, but significantly lower in invasive areas. Disturbance, represented by the frequency of wildfires, differed very slightly between A. dealbata invaded and non-invaded vegetated areas. In contrast, large differences were observed in the canopy attributes of invasion and non-invasion areas. NDVI, BRND and surface albedo were significantly higher in invaded areas respect to non-invaded vegetated areas. Invaded areas were characterized by large NDVI values, low values of canopy reflection (surface albedo) and large positive woody canopy structure (BRDN).
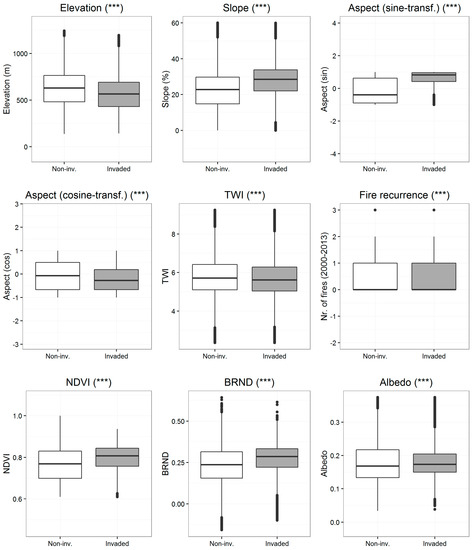
Figure 8.
The comparison of median rank differences in the environmental attributes between invaded (white boxes) and non-invaded vegetated areas (grey boxes) performed with the Wilcoxon signed-rank test (two-tailed comparison). (***) p ≤ 0.001.
4. Discussion
4.1. The Combining of VHR Remote Sensing and SDMs for Invasion Success Assessment
Focusing on Peneda-Gerês National Park, this study attempted to illustrate the hierarchical combination of satellite invasion mapping at VHR (WorldView-2; 2 × 2 m) and SDMs to assess the success rate of A. dealbata invasion and later to identify environmental attributes differing between invaded and non-invaded vegetated areas. The quantification of invaded areas, the detection of invasion success and their relationship with controlling factors is of critical importance to comprehend and manage invasion [7,58]. The use of remote sensing data to verify model predictions is one of the four main strategies to link remote sensing data and ecological modeling [6,26]. The approach and the outputs addressed the scale mismatch limitation between predictive tools and on-ground conservation by creating two spatial-explicit informative layers (overall and specific success rate of invasion). They state the conversion of invasion suitability into observed invasion (overall success rate) and the extent of such conversion (specific success rate). This information may support invasion management by providing spatial discrimination of forecasted invasion based on fine-scale assessment of invaded areas (e.g., WorldView-2). It may also contribute to the prioritization of areas where intervention is appropriate and, if integrated into monitoring systems, can be updated. Overall, for managers it can contribute to a more realistic vision of invasion forecasts. The fine invasion mapping contributed also to identifying currently invaded sites beyond suitable areas predicted by the regional SDMs, which indicated suitable conditions in most of the study area. This information may help to verify and complement model SDMs predictions and identify unforeseen gaps in areas currently invaded. Despite the benefits, there are limiting factors. Access to high resolution satellite data is still not universal and affordable, but prices are reducing and other less expensive satellite data not considered in this study ensure a good compromise between resolution and price (e.g., RapidEye, 5 m resolution). Uncertainty in the thematic accuracy of invasion mapping also affects the added-value of the approach.
The mapping of invasion is a crucial step in the approach and fulfills important management needs: knowing where the species is invading and which extent of the forecasted areas is actually occupied. An OBIA classification with RF algorithm and WorldView-2 was applied and invasion mapped with good accuracy (overall accuracy = 91.3%) using a set of spectral and topographical indices. Uncertainty is still present in our classification. Invasion class accuracy (86.5%) affected our invasion success metrics. Despite this, accuracy values were consistent with previous findings on tree species mapping with WorldView-2 [59,60] and with Acacia species [61]. In contrast to previous studies, the classification was performed using spectral-derived (e.g., NDVI) and contextual information (e.g., slope). The application of ancillary layers during OBIA classification is increasingly used [12,17,62], since image band derivatives and ancillary data sources provide useful information to help distinguish between spectrally inseparable vegetation classes and enhance classification [62]. Große-Stoltenberg [63] demonstrated that vegetation indices estimated with hyperspectral data successfully contributed to distinguish Acacia longifolia and the RF classifier presented the best classification performance at the canopy level. Moreover, the review on Acacia species by [64] highlighted that their spatial patterns and spread are strongly influenced by propagule dissemination, which for instance is influenced by topographical conditions. The inclusion of spectral indices along with ancillary layers during object-based mapping can contribute to improve classification performance.
4.2. The A. dealbata Invasion in the Study Area and the Variation of Environmental Attributes between Invaded and Non-Invaded Vegetated Areas: Implications for Management and Landscape Attributes
The introduction of Acacia trees in the study area started in the last years of the 19th century, and until 1905 approximately 550 individuals of A. dealbata were planted for soil erosion control [28]. The link between SDMs predictions of suitability for A. dealbata invasion (baseline for the expected invasion extent) and the mapped invasion (observed) evidenced that more than 60% of total cells included in the predictions registered invasion, which highlights a considerable overall success rate of invasion in the study area. It suggests also that, in the Iberian Peninsula, Acacia invasion has not yet reached their potential distribution range [7,65]. Nonetheless, the results also showed that invasion has occurred in 55.6% of cells predicted as unsuitable for invasion. This suggests that further investigation regarding the invasion drivers and adjustment in SDMs might be necessary (e.g., selection of further predictor variables).
The specific success rate of invasion, measured by the fractional cover of A. dealbata in invaded grid cells (200 × 200 m), showed that mitigation of invasion may be possible in the study area, since the total fractional cover of invasion in most of invaded cells was below 40%, and non-native A. dealbata trees are still not the dominant vegetation type. In this regard, Marchante et al. [66] suggested that management by clearing of Acacia should be prioritized in recently invaded areas, which in our case refer to grid cells with low specific success rate of invasion. Recently invaded areas presented higher native species richness, plant cover, initial diversity and species turnover rates compared to those in the long-term invaded areas (higher specific success rate). Invasion success results presented here, however, were affected by the uncertainty in the invasion mapping mentioned above, but eventually also by the time gap between the infield data used to calibrate SDMs predictions (2010–2012) and our satellite VHR data (2013) used to map invasion.
The comparison of environmental attributes of invaded and non-invaded vegetated areas using the Wilcoxon signed-rank test showed that three groups of environmental attributes (topographic, disturbance and canopy-related) were significantly different. This result highlighted the specific patterns of invasion process, which may help to distinguish the non-native species (e.g., slope, aspect), but also the specific landscape features that may alter following replacement of non-invasive vegetation (e.g., NDVI). The largest differences occurred in topographic and canopy-related attributes, while differences in disturbance (wildfire recurrence), despite being significant, were less evident. The effect of topography and disturbance on Acacia invasion is known [7,48,49,54], but our results suggests that wildfire disturbance recurrence in the landscape may not considerably change with the replacement of non-invasive vegetation considering the observed wildfire patterns (2000–2013). This issue deserves further research since resistance and resilience to wildfire (pre- and post-wildfire) is among the most reported altered properties with non-native invasion [67,68].
By contrast, changes in functional properties expressed by the canopy-related attributes are deeper and might have large implications, since canopy attributes reflected species-specific characteristics such as leaf chemistry, canopy structure as well as litter and soil parameters are combined in the canopy spectrum [63]. All canopy-related attributes increased in invaded areas, in particular NDVI (proxy for leaf area) and BRDN (proxy for vegetation structure). This suggests that vegetation photosynthesis (NDVI) and ecosystems productivity are features affected by the replacement of non-invasive vegetation. Morris et al. [69] found that the larger NDVI of Acacia stands were associated to a larger above-ground biomass and leaf area (for transpiration), in that particular case 25% greater compared with native vegetation. Since Acacia is a water-spending species, which increases the stand transpiration to decrease the water availability for co-occurring species [70], this may also impact water depletion [69], which can be affected by increase in drought and reduction in precipitation forecasted to the region by 2050 [71]. This NDVI alteration is supported by the large values of BRDN, indicating large vertical structures respect to non-invasive vegetation (e.g., scrublands). Surface albedo presented slight differences with respect to non-invasive vegetation, suggesting this main component of local and remote climate [72] will not substantially change with the replacement.
The link between the statistical difference of topographic factors (slope and, aspect) and the canopy attributes suggested that change in landscape attributes may occur at specific locations, namely in steep slopes and east facing slopes which received intermediate amounts of radiation, an important abiotic factor for the establishment and spread of Acacia, which grows faster than native species [69]. All canopy variables were based in a single satellite scene, which limited its interpretation. The important contribution of seasonal dynamics for the landscape attributes was not considered. Still, the results presented here signal important avenues for further research on the effects of Acacia invasion on functional features of landscapes.
Acknowledgments
This research was developed as part of the ECOPOTENTIAL project financed by European Union’s Horizon 2020 research and innovation program under grant agreement No. 641762. The authors acknowledge the support Portuguese Foundation for Science and Technology (FCT) through the project grant project “IND_CHANGE” (PTDC/AAG-MAA/4539/2012-FCOMP-01-0124-FEDER-027863) in the early stages of the study. A.T. Monteiro is supported by FEDER funds through the Operational Programme for Competitiveness Factors (COMPETE) and by National Funds through FCT (Foundation for Science and Technology) under the UID/BIA/50027/2013 and POCI-01-0145-FEDER-006821. B.M. and J.G. are supported by FCT through PhD Grant SFRH/BD/99469/2014 and SFRH/BD/90112/2012, respectively. We acknowledge SENSFOR Cost Action-ES1203-030414-041242.
Author Contributions
Study conception and design: A.T.M., J.G., B.M. Acquisition of data: A.T.M., S.A., B.M., J.G. Data analysis: A.T.M., J.G., B.M. and R.F.F. Drafting of manuscript: A.T.M., J.G., R.F. Critical revision: R.L., A.C.T., B.M. and J.P.H.
Conflicts of Interest
The authors declare no conflict of interest.
References
- United Nations Environment Programme. Report of the Seventh Meeting of the Conference of the Parties to the Convention on Biological Diversity (unep/cbd/cop/35/4); UNEP: Kuala Lumpur, Malasia, 2010. [Google Scholar]
- European Commission. Communication from the Commission to the European Parliament, the Council, the Economic and Social Committee and the Committee of the Regions—Our Life Insurance, our Natural Capital: An eu Biodiversity Strategy to 2020; EC: Brussels, Belgium, 2011. [Google Scholar]
- Kueffer, C.; McDougall, K.; Alexander, J.; Daehler, C.; Edwards, P.; Haider, S.; Milbau, A.; Parks, C.; Pauchard, A.; Reshi, Z.A.; et al. Plant invasions into mountain protected areas: Assessment, prevention and control at multiple spatial scales. In Plant Invasions in Protected Areas: Patterns, Problems and Challenges; Foxcroft, C.L., Pyšek, P., Richardson, M.D., Genovesi, P., Eds.; Springer: Dordrecht, The Netherlands, 2013; pp. 89–113. [Google Scholar]
- Fernandes, R.F.; Vicente, J.R.; Georges, D.; Alves, P.; Thuiller, W.; Honrado, J.P. A novel downscaling approach to predict plant invasions and improve local conservation actions. Biol. Invasions 2014, 16, 2577–2590. [Google Scholar] [CrossRef]
- Guisan, A.; Tingley, R.; Baumgartner, J.B.; Naujokaitis-Lewis, I.; Sutcliffe, P.R.; Tulloch, A.I.T.; Regan, T.J.; Brotons, L.; McDonald-Madden, E.; Mantyka-Pringle, C.; et al. Predicting species distributions for conservation decisions. Ecol. Lett. 2013, 16, 1424–1435. [Google Scholar] [CrossRef] [PubMed]
- He, K.S.; Bradley, B.A.; Cord, A.F.; Rocchini, D.; Tuanmu, M.-N.; Schmidtlein, S.; Turner, W.; Wegmann, M.; Pettorelli, N. Will remote sensing shape the next generation of species distribution models? Remote Sens. Ecol. Conserv. 2015, 1, 4–18. [Google Scholar] [CrossRef]
- Hernández, L.; Martínez- Fernández, J.; Cañellas, I.; de la Cueva, A.V. Assessing spatio-temporal rates, patterns and determinants of biological invasions in forest ecosystems. The case of acacia species in NW spain. For. Ecol. Manag. 2014, 329, 206–213. [Google Scholar]
- Richardson, D.M.; Daehler, C.C.; Leishman, M.R.; Pauchard, A.; Pyšek, P. Plant invasions: Theoretical and practical challenges. Biol. Invasions 2010, 12, 3907–3911. [Google Scholar] [CrossRef]
- Bricher, P.K.; Lucieer, A.; Shaw, J.; Terauds, A.; Bergstrom, D.M. Mapping sub-antarctic cushion plants using random forests to combine very high resolution satellite imagery and terrain modelling. PLoS ONE 2013, 8, e72093. [Google Scholar] [CrossRef] [PubMed]
- Lu, D.; Weng, Q. A survey of image classification methods and techniques for improving classification performance. Int. J. Remote Sens. 2007, 28, 823–870. [Google Scholar] [CrossRef]
- Xie, Y.; Sha, Z.; Yu, M. Remote sensing imagery in vegetation mapping: A review. J. Plant Ecol. 2008, 1, 9–23. [Google Scholar] [CrossRef]
- Lucas, R.; Blonda, P.; Bunting, P.; Jones, G.; Inglada, J.; Arias, M.; Kosmidou, V.; Petrou, Z.I.; Manakos, I.; Adamo, M.; et al. The earth observation data for habitat monitoring (eodham) system. Int. J. Appl. Earth Observ. Geoinf. 2015, 37, 17–28. [Google Scholar] [CrossRef]
- Blaschke, T. Object based image analysis for remote sensing. ISPRS J. Photogramm. Remote Sens. 2010, 65, 2–16. [Google Scholar] [CrossRef]
- Fava, F.; Pulighe, G.; Monteiro, A.T. Mapping changes in land cover composition and pattern for comparing mediterranean rangeland restoration alternatives. Land Degrad. Dev. 2016, 27, 671–681. [Google Scholar] [CrossRef]
- Teodoro, A.C.; Araujo, R. Comparison of performance of object-based image analysis techniques available in open source software (spring and orfeo toolbox/monteverdi) considering very high spatial resolution data. J. Appl. Remote Sens. 2016, 10, 016011. [Google Scholar] [CrossRef]
- Dirnböck, T.; Dullinger, S.; Gottfried, M.; Ginzler, C.; Grabherr, G. Mapping alpine vegetation based on image analysis, topographic variables and canonical correspondence analysis. Appl. Veg. Sci. 2003, 6, 85–96. [Google Scholar] [CrossRef]
- Gonçalves, J.; Henriques, R.; Alves, P.; Sousa-Silva, R.; Monteiro, A.T.; Lomba, Â.; Marcos, B.; Honrado, J. Evaluating an unmanned aerial vehicle-based approach for assessing habitat extent and condition in fine-scale early successional mountain mosaics. Appl. Veg. Sci. 2016, 19, 132–146. [Google Scholar] [CrossRef]
- Mallinis, G.; Koutsias, N.; Tsakiri-Strati, M.; Karteris, M. Object-based classification using quickbird imagery for delineating forest vegetation polygons in a mediterranean test site. ISPRS J. Photogramm. Remote Sens. 2008, 63, 237–250. [Google Scholar] [CrossRef]
- Breiman, L. Random forests. Mach. Learn. 2001, 45, 5–32. [Google Scholar] [CrossRef]
- Cutler, D.R.; Edwards, T.C.; Beard, K.H.; Cutler, A.; Hess, K.T.; Gibson, J.; Lawler, J.J. Random forests for classification in ecology. Ecology 2007, 88, 2783–2792. [Google Scholar] [CrossRef] [PubMed]
- Mountrakis, G.; Im, J.; Ogole, C. Support vector machines in remote sensing: A review. ISPRS J. Photogramm. Remote Sens. 2011, 66, 247–259. [Google Scholar] [CrossRef]
- Bastos, R.; Monteiro, A.T.; Carvalho, D.; Gomes, C.; Travassos, P.; Honrado, J.P.; Santos, M.; Cabral, J.A. Integrating land cover structure and functioning to predict biodiversity patterns: A hierarchical modelling framework designed for ecosystem management. Landsc. Ecol. 2016, 31, 701–710. [Google Scholar] [CrossRef]
- Deblauwe, V.; Droissart, V.; Bose, R.; Sonké, B.; Blach-Overgaard, A.; Svenning, J.C.; Wieringa, J.J.; Ramesh, B.R.; Stévart, T.; Couvreur, T.L.P. Remotely sensed temperature and precipitation data improve species distribution modelling in the tropics. Glob. Ecol. Biogeogr. 2016, 25, 443–454. [Google Scholar] [CrossRef]
- Pottier, J.; Malenovský, Z.; Psomas, A.; Homolová, L.; Schaepman, M.E.; Choler, P.; Thuiller, W.; Guisan, A.; Zimmermann, N.E. Modelling plant species distribution in alpine grasslands using airborne imaging spectroscopy. Biol. Lett. 2014, 10. [Google Scholar] [CrossRef] [PubMed]
- Rocchini, D.; Andreo, V.; Förster, M.; Garzon-Lopez, C.X.; Gutierrez, A.P.; Gillespie, T.W.; Hauffe, H.C.; He, K.S.; Kleinschmit, B.; Mairota, P.; et al. Potential of remote sensing to predict species invasions: A modelling perspective. Prog. Phys. Geogr. 2015, 39, 283–309. [Google Scholar] [CrossRef]
- Plummer, S.E. Perspectives on combining ecological process models and remotely sensed data. Ecol. Model. 2000, 129, 169–186. [Google Scholar] [CrossRef]
- Albert, C.H.; Thuiller, W.; Lavorel, S.; Davies, I.D.; Garbolino, E. Land-use change and subalpine tree dynamics: Colonization of larix decidua in french subalpine grasslands. J. Appl. Ecol. 2008, 45, 659–669. [Google Scholar] [CrossRef]
- Fernandes, M.J.D.S.M. Recuperação ecológica de áreas invadidas por acacia dealbata link no vale do rio gerês: Um trabalho de sísifo? UTAD (Universidade de Trás-os-Montes e Alto Douro): Vila Real, Portugal, 2008. [Google Scholar]
- European Economic Area. Invasive alien species indicators in europe a review of streamlining european biodiversity (sebi) indicator 10. Eea Tech. Rep. 2012. [Google Scholar] [CrossRef]
- Vicente, J.R.; Fernandes, R.F.; Randin, C.F.; Broennimann, O.; Gonçalves, J.; Marcos, B.; Pôças, I.; Alves, P.; Guisan, A.; Honrado, J.P. Will climate change drive alien invasive plants into areas of high protection value? An improved model-based regional assessment to prioritise the management of invasions. J. Environ. Manag. 2013, 131, 185–195. [Google Scholar] [CrossRef] [PubMed]
- Inventory, P.N.F. National cartography of burnt areas. National Institute for Nature and Forests Conservation: Lisbon, Portugal, 2014. Available online: http://www.icnf.pt/portal/florestas/dfci/inc/info-geo (accessed on 18 January 2017).
- Tucker, C. Red and photographic infrared linear combinations for monitoring vegetation. Remote Sens. Environ. 1979, 8, 127–150. [Google Scholar] [CrossRef]
- Navulur, K. Multispectral Image Analysis Using the Object-Oriented Paradigm. CRC Press, Inc.: Boca Raton, FL, USA, 2006. [Google Scholar]
- Nouri, H.; Beecham, S.; Anderson, S.; Nagler, P. High spatial resolution worldview-2 imagery for mapping ndvi and its relationship to temporal urban landscape evapotranspiration factors. Remote Sens. 2014, 6, 580. [Google Scholar] [CrossRef]
- Wolf, A.F. Using worldview-2 vis-nir multispectral imagery to support land mapping and feature extraction using normalized difference index ratios. In Proceedings of the SPIE 8390, Algorithms and Technologies for Multispectral, Hyperspectral, and Ultraspectral Imagery XVIII, Baltimore, Maryland, USA, 23–27 April 2012.
- Cho, M.A.; Skidmore, A.K. A new technique for extracting the red edge position from hyperspectral data: The linear extrapolation method. Remote Sens. Environ. 2006, 101, 181–193. [Google Scholar] [CrossRef]
- Oumar, Z.; Mutanga, O. Using WorldView-2 bands and indices to predict bronze bug thaumastocoris peregrinus damage in plantation forests. Int. J. Remote Sens. 2013, 34, 2236–2249. [Google Scholar] [CrossRef]
- Vaz, A.S.; Marcos, B.; Gonçalves, J.; Monteiro, A.; Alves, P.; Civantos, E.; Lucas, R.; Mairota, P.; Garcia-Robles, J.; Alonso, J.; et al. Can we predict habitat quality from space? A multi-indicator assessment based on an automated knowledge-driven system. Int. J. Appl. Earth Observ. Geoinf. 2015, 37, 106–113. [Google Scholar] [CrossRef]
- Waser, L.T.; Kuechler, M.; Juette, K.; Stampfer, T. Evaluating the potential of worldview-2 data to classify tree species and different levels of ash mortality. Remote Sens. 2014, 6, 4515–4545. [Google Scholar] [CrossRef]
- Lyons, E.A.; Jin, Y.; Randerson, J.T. Changes in surface albedo after fire in boreal forest ecosystems of interior alaska assessed using modis satellite observations. J. Geophys. Res. Biogeosci. 2008, 113, 912. [Google Scholar] [CrossRef]
- Bunting, P.; Clewley, D.; Lucas, R.M.; Gillingham, S. The remote sensing and gis software library (rsgislib). Comput. Geosci. 2014, 62, 216–226. [Google Scholar] [CrossRef]
- Delaplace, K.L.W.; Van Coillie, F.M.B.; De Wulf, R.R.; Gabriels, D.; De Smet, K.; Ouessar, M.; Belgacem, A.O.; Houcine, T. Object-based assessment of tree attributes of acacia tortilis in bou-hedma, tunisia. In Proceedings of the Third International Conference of Geographic Object-Based Image Analysis (GEOBIA 2010), Ghent, Belgium, 29 June–2 July 2010.
- Thuiller, W.; Lafourcade, B.; Engler, R.; Araújo, M.B. Biomod—A platform for ensemble forecasting of species distributions. Ecography 2009, 32, 369–373. [Google Scholar] [CrossRef]
- Clewley, D.; Bunting, P.; Shepherd, J.; Gillingham, S.; Flood, N.; Dymond, J.; Lucas, R.; Armston, J.; Moghaddam, M. A python-based open source system for geographic object-based image analysis (geobia) utilizing raster attribute tables. Remote Sens. 2014, 6, 6111–6135. [Google Scholar] [CrossRef]
- Congalton, R.G. A review of assessing the accuracy of classifications of remotely sensed data. Remote Sens. Environ. 1991, 37, 35–46. [Google Scholar] [CrossRef]
- Fabian, P.; Gaël, E.V.; Gramfort, A.; Michel, V.; Thirion, B.; Grisel, O.; Blondel, M.; Prettenhofer, P.; Weiss, R.; Dubourg, V.; et al. Scikit-learn: Machine learning in python. J. Mach. Learn. Res. 2011, 12, 2825–2830. [Google Scholar]
- Buchanan, B.P.; Fleming, M.; Schneider, R.L.; Richards, B.K.; Archibald, J.; Qiu, Z.; Walter, M.T. Evaluating topographic wetness indices across central new york agricultural landscapes. Hydrol. Earth Syst. Sci. 2014, 18, 3279–3299. [Google Scholar] [CrossRef]
- Castro-Díez, P.; Godoy, O.; Saldaña, A.; Richardson, D.M. Predicting invasiveness of australian acacias on the basis of their native climatic affinities, life history traits and human use. Divers. Distrib. 2011, 17, 934–945. [Google Scholar] [CrossRef]
- Ferreras, A.E.; Funes, G.; Galetto, L. The role of seed germination in the invasion process of honey locust (gleditsia triacanthos l., fabaceae): Comparison with a native confamilial. Plant Species Biol. 2015, 30, 126–136. [Google Scholar] [CrossRef]
- Western, A.W.; Grayson, R.B.; Blöschl, G.; Willgoose, G.R.; McMahon, T.A. Observed spatial organization of soil moisture and its relation to terrain indices. Water Resour. Res. 1999, 35, 797–810. [Google Scholar] [CrossRef]
- White, J.D.; Running, S.W. Testing scale dependent assumptions in regional ecosystem simulations. J. Veg. Sci. 1994, 5, 687–702. [Google Scholar] [CrossRef]
- Moore, I.D.; Gessler, P.E.; Nielsen, G.A.; Peterson, G.A. Soil attribute prediction using terrain analysis. Soil Sci. Soc. Am. J. 1993, 57, 443–452. [Google Scholar] [CrossRef]
- Sørensen, R.; Zinko, U.; Seibert, J. On the calculation of the topographic wetness index: Evaluation of different methods based on field observations. Hydrol. Earth Syst. Sci. 2006, 10, 101–112. [Google Scholar] [CrossRef]
- Bellingham, P.J.; Sparrow, A.D. Resprouting as a life history strategy in woody plant communities. Oikos 2000, 89, 409–416. [Google Scholar] [CrossRef]
- Pettorelli, N.; Vik, J.O.; Mysterud, A.; Gaillard, J.-M.; Tucker, C.J.; Stenseth, N.C. Using the satellite-derived ndvi to assess ecological responses to environmental change. Trends Ecol. Evol. 2005, 20, 503–510. [Google Scholar] [CrossRef] [PubMed]
- Graham, A. Remote Sensing of Vegetation Principles, Techniques, and Applications; Oxford University Press: Oxford, UK, 2012; pp. 1653–1654. [Google Scholar]
- Pettorelli, N. The Normalized Difference Vegetation Index; OUP Oxford: Oxford, UK, 2013. [Google Scholar]
- Higgins, S.I.; Richardson, D.M.; Cowling, R.M. Validation of a spatial simulation model of a spreading alien plant population. J. Appl. Ecol. 2001, 38, 571–584. [Google Scholar] [CrossRef]
- Immitzer, M.; Atzberger, C.; Koukal, T. Tree species classification with random forest using very high spatial resolution 8-band WorldView-2 satellite data. Remote Sens. 2012, 4, 2661–2693. [Google Scholar] [CrossRef]
- Peerbhay, K.Y.; Mutanga, O.; Ismail, R. Investigating the capability of few strategically placed worldview-2 multispectral bands to discriminate forest species in kwazulu-natal, south africa. IEEE J. Sel. Top. Appl. Earth Observ. Remote Sens. 2014, 7, 307–316. [Google Scholar] [CrossRef]
- Cho, M.A.; Malahlela, O.; Ramoelo, A. Assessing the utility worldview-2 imagery for tree species mapping in south african subtropical humid forest and the conservation implications: Dukuduku forest patch as case study. Int. J. Appl. Earth Observ. Geoinf. 2015, 38, 349–357. [Google Scholar] [CrossRef]
- Yu, Q.; Gong, P.; Clinton, N.; Biging, G.; Kelly, M.; Schirokauer, D. Object-based detailed vegetation classification with airborne high spatial resolution remote sensing imagery. Photogramm. Eng. Remote Sens. 2006, 72, 799–811. [Google Scholar] [CrossRef]
- Grosse-Stoltenberg, A.; Hellmann, C.; Werner, C.; Oldeland, J.; Thiele, J. Evaluation of continuous VNIR–SWIR spectra versus narrowband hyperspectral indices to discriminate the invasive acacia longifolia within a mediterranean dune ecosystem. Remote Sens. 2016, 8, 334. [Google Scholar] [CrossRef]
- Lorenzo, P.; González, L.; Reigosa, M.J. The genus acacia as invader: The characteristic case of acacia dealbata link in europe. Ann. For. Sci. 2010, 67, 101. [Google Scholar] [CrossRef]
- Gassó, N.; Thuiller, W.; Pino, J.; Vilà, M. Potential distribution range of invasive plant species in spain. NeoBiota 2012, 12, 25–40. [Google Scholar]
- Marchante, H.; Freitas, H.; Hoffmann, J.H. Post-clearing recovery of coastal dunes invaded by acacia longifolia: Is duration of invasion relevant for management success? J. Appl. Ecol. 2011, 48, 1295–1304. [Google Scholar] [CrossRef]
- Alba, C.; Skalova, H.; McGregor, K.F.; D’Antonio, C.; Pysek, P. Native and exotic plant species respond differently to wildfire and prescribed fire as revealed by meta-analysis. J. Veg. Sci. 2015, 26, 102–113. [Google Scholar] [CrossRef]
- Dickens, S.J.M.; Allen, E.B. Exotic plant invasion alters chaparral ecosystem resistance and resilience pre- and post-wildfire. Biol. Invasions 2014, 16, 1119–1130. [Google Scholar] [CrossRef]
- Morris, T.L.; Esler, K.J.; Barger, N.N.; Jacobs, S.M.; Cramer, M.D. Ecophysiological traits associated with the competitive ability of invasive australian acacias. Divers. Distrib. 2011, 17, 898–910. [Google Scholar] [CrossRef]
- Rascher, K.G.; Grosse-Stoltenberg, A.; Maguas, C.; Werner, C. Understory invasion by acacia longifolia alters the water balance and carbon gain of a mediterranean pine forest. Ecosystems 2011, 14, 904–919. [Google Scholar] [CrossRef]
- Carvalho-Santos, C.; Nunes, J.P.; Monteiro, A.T.; Hein, L.; Honrado, J.P. Assessing the effects of land cover and future climate conditions on the provision of hydrological services in a medium-sized watershed of portugal. Hydrol. Processes 2016, 30, 720–738. [Google Scholar] [CrossRef]
- Foley, J.A.; Costa, M.H.; Delire, C.; Ramankutty, N.; Snyder, P. Green surprise? How terrestrial ecosystems could affect earth’s climate. Front. Ecol. Environ. 2003, 1, 38–44. [Google Scholar]
© 2017 by the authors. Licensee MDPI, Basel, Switzerland. This article is an open access article distributed under the terms and conditions of the Creative Commons Attribution (CC BY) license ( http://creativecommons.org/licenses/by/4.0/).