Article

Error Analysis and Measurement Uncertainty for a Fiber Grating Strain-Temperature Sensor

1
Department of Physics, National Chung Cheng University, 168 University Road, Chia-Yi 62102, Taiwan
2
Department of Construction Engineering, National Yunlin University of Science and Technology, 123 Section 3 University Road, Douliou 64002, Taiwan
*
Author to whom correspondence should be addressed.
Sensors 2010, 10(7), 6582-6593; https://doi.org/10.3390/s100706582
Submission received: 20 April 2010 / Revised: 17 June 2010 / Accepted: 2 July 2010 / Published: 9 July 2010
(This article belongs to the Section Chemical Sensors)

Abstract

:
A fiber grating sensor capable of distinguishing between temperature and strain, using a reference and a dual-wavelength fiber Bragg grating, is presented. Error analysis and measurement uncertainty for this sensor are studied theoretically and experimentally. The measured root mean squared errors for temperature T and strain ε were estimated to be 0.13 °C and 6 με, respectively. The maximum errors for temperature and strain were calculated as 0.00155 T + 2.90 × 10⁻⁶ ε and 3.59 × 10⁻⁵ ε + 0.01887 T, respectively. Using the estimation of expanded uncertainty at 95% confidence level with a coverage factor of k = 2.205, temperature and strain measurement uncertainties were evaluated as 2.60 °C and 32.05 με, respectively. For the first time, to our knowledge, we have demonstrated the feasibility of estimating the measurement uncertainty for simultaneous strain-temperature sensing with such a fiber grating sensor.

Graphical Abstract

1. Introduction

The advantages of fiber optic sensors include light weight, small size, immunity to electromagnetic interference (EMI), large bandwidth, environmental ruggedness and electrical and optical multiplexing capability. Thus, fiber optic sensors are ideal for the applications in potential smart structures and materials. Fiber Bragg gratings (FBGs) have many wide applications, ranging from tele-communications to optical fiber sensors. Though Bragg grating sensors (BGSs) have offered a variety of potential advantages over their conventional counterparts, their widespread practical use has been plagued by their inability to effectively discriminate between temperature and strain fields. A number of attempts to overcome this limitation have been demonstrated [17]. Among them, one popular approach is to use a separate reference grating as a temperature sensor. Another popular approach is the dual-wavelength technique which involves writing two superimposed Bragg gratings, resulting in different responses to temperature and strain at the same location. Therefore, the combination of the respective merits of both reference grating and dual-wavelength grating techniques is expected to offer excellent strain and temperature performance. Chehura et al. have used a technique which exploits the core-cladding mode coupling of a tilted fibre Bragg grating (TFBG). The strength of this method lays in the use of only a single TFBG, and the wavelength and matrix induced errors for temperature and strain measurements are 1 °C and 11 με, respectively [8]. Ma et al. have presented an error analysis of temperature-compensated white-light interferometric fiber-optic strain sensor. The theoretical and experimental analysis demonstrates its potential for practical applications. For example, 4 m sensing and 6 m compensating fibers using Fibercore HB800 fiber can enhance the strain resolution to 2.5 με and reduce the temperature compensating error to ±7 με [9]. However, the principle of this sensor is not based on the concept of fiber grating. Xie et al. have analyzed the relationship between temperature sensitivity and plating thickness of nickel-clad FBG in theory and verified by experiment. The rectangular distribution is used to calculate the standard uncertainty, us, and the expanded uncertainty of temperature is obtained: U = kus = 0.28 pm °C−1, where k = 2 at a level of confidence of 95% [10]. In this paper, we present an evaluation of error analysis and measurement uncertainty for a reference dual-wavelength grating sensor system. The theoretical strain and temperature dependent errors, both wavelength and matrix induced errors, for the grating pair were examined. The measurement uncertainty for simultaneous temperature and strain measurements using a reference dual wavelength grating method was studied by an estimation of standard uncertainty, combined standard uncertainty, and expanded uncertainty. To our knowledge, this is the first time that the measurement uncertainty for simultaneous strain-temperature sensing was demonstrated for fiber grating sensors.

2. Sensor Description and Operation Principle

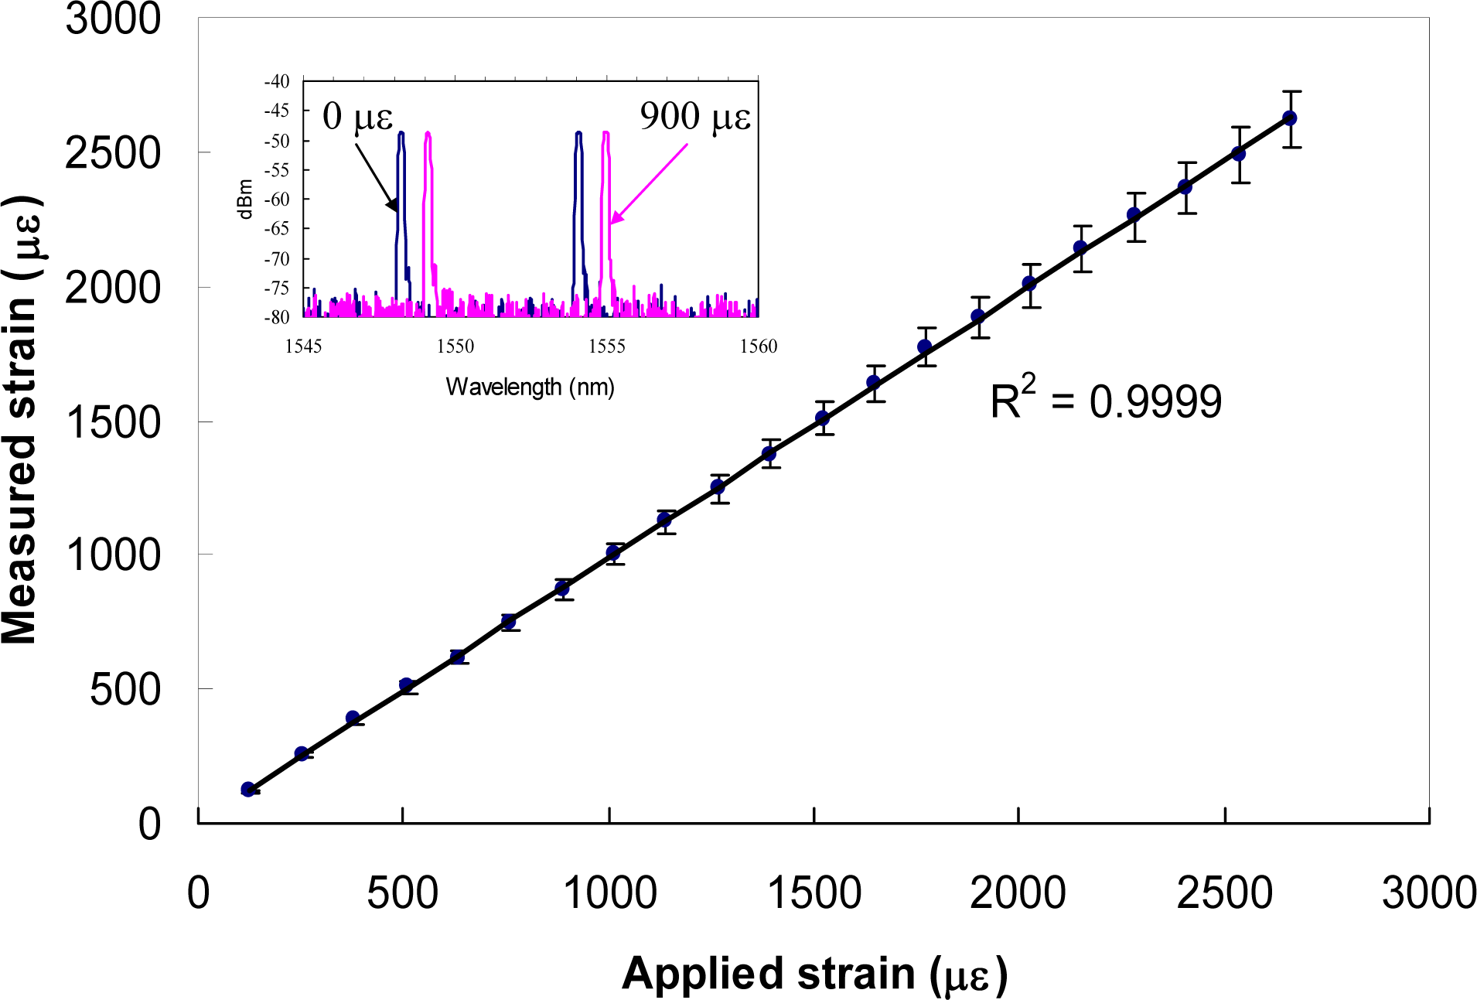
2.1. Simultaneous Temperature and Strain Measurement

Though BGSs have offered potentially numerous advantages over their conventional electrical and mechanical counterparts, their widespread use has been limited by their inability to discriminate effectively between temperature and strain fields, and this poses serious problems for sensors system designed to monitor quasi-strain signals, as temperature variations along the fiber link will induce indistinguishable thermal-apparent strain signals. It is apparent that measurement of one wavelength shift from a single grating will not determine those two variables simultaneously. A number of methods that separate temperature- and strain-induced wavelength shift and overcome this limitation have been proposed and demonstrated, including the use of reference grating [1], the use of dual wavelength gratings [2], and the use of two sensors associated with different strain and temperature responses [37,11]. In brief, the determination of those two variables or the elimination of cross-sensitivity may be achieved by operating at two wavelengths or two different perturbation-induced optical modes, which have different responses to temperature and strain. The simplest scheme is to facilitate two sensors in which one is isolated from either of the unwanted external perturbations. One approach called reference grating is to use separate reference gratings as temperature sensors along the fiber path, i.e., gratings that are in thermal contact with the local structure but shield from strain changes. Another approach is to use the dual wavelength technique involving writing two superimposed Bragg gratings [2], in which the responses to temperature (κ1T2T) and strain (κ) at the same location on the structure are different. Dual-wavelength technique requires two broadband sources to address each sensor and suitable wavelength demodulation system (WDS) at the output. The change in the Bragg center wavelengths Δλi of the two gratings from the changes in temperature (ΔTi) and strain (Δεi) is given by the following matrix expression
Δ λ i = κ i ε Δ ε i + κ iT Δ T i                   i = 1 , 2
where κiε = λ / εi is the strain coefficient of material related to the Poisson ratio, photoelastic constant and effective refractive index, and κiT = λ / ∂Ti is the temperature coefficient related to the thermal expansion and thermo-optic coefficients. The above matrix can be inverted to give temperature and strain provided that the ratio of temperature responses of the two gratings is different from that of their strain responses. Xu et al. [2] have used this method to measure the responses of two BGS’s written at 848 and 1,298 nm, and reported that the responses are 6.5% higher for strain and 9.8% less for temperature for wavelength at 1300 nm compared with 850 nm. This approach has shown the capability to measure strain and temperature simultaneously with errors of ±10 με and ±5 °C, respectively. Kannellopoulos et al. [3] have demonstrated simultaneous temperature and strain measurement using a FBG and a long-period rocking filter operating at the 800 nm wavelength band and reported errors of ±165 με and ±1.5 °C. Other similar types of Bragg gratings, such as a long-period grating and FBG’s in the 1,300 nm band, demonstrated by Patrick et al. [4], can be used to determine strain and temperature of ±9 με and ±1.5 °C, respectively. However, several potential problems such as relative large bandwidth and long physical length of long-period grating, have limited the accuracy and number of sensors that could be used in a wavelength division multiplexing (WDM) system. If spatial resolutions can be improved to a certain degree, this technique could provide a practical means for measuring strain/temperature in arrays of distributed sensor systems.

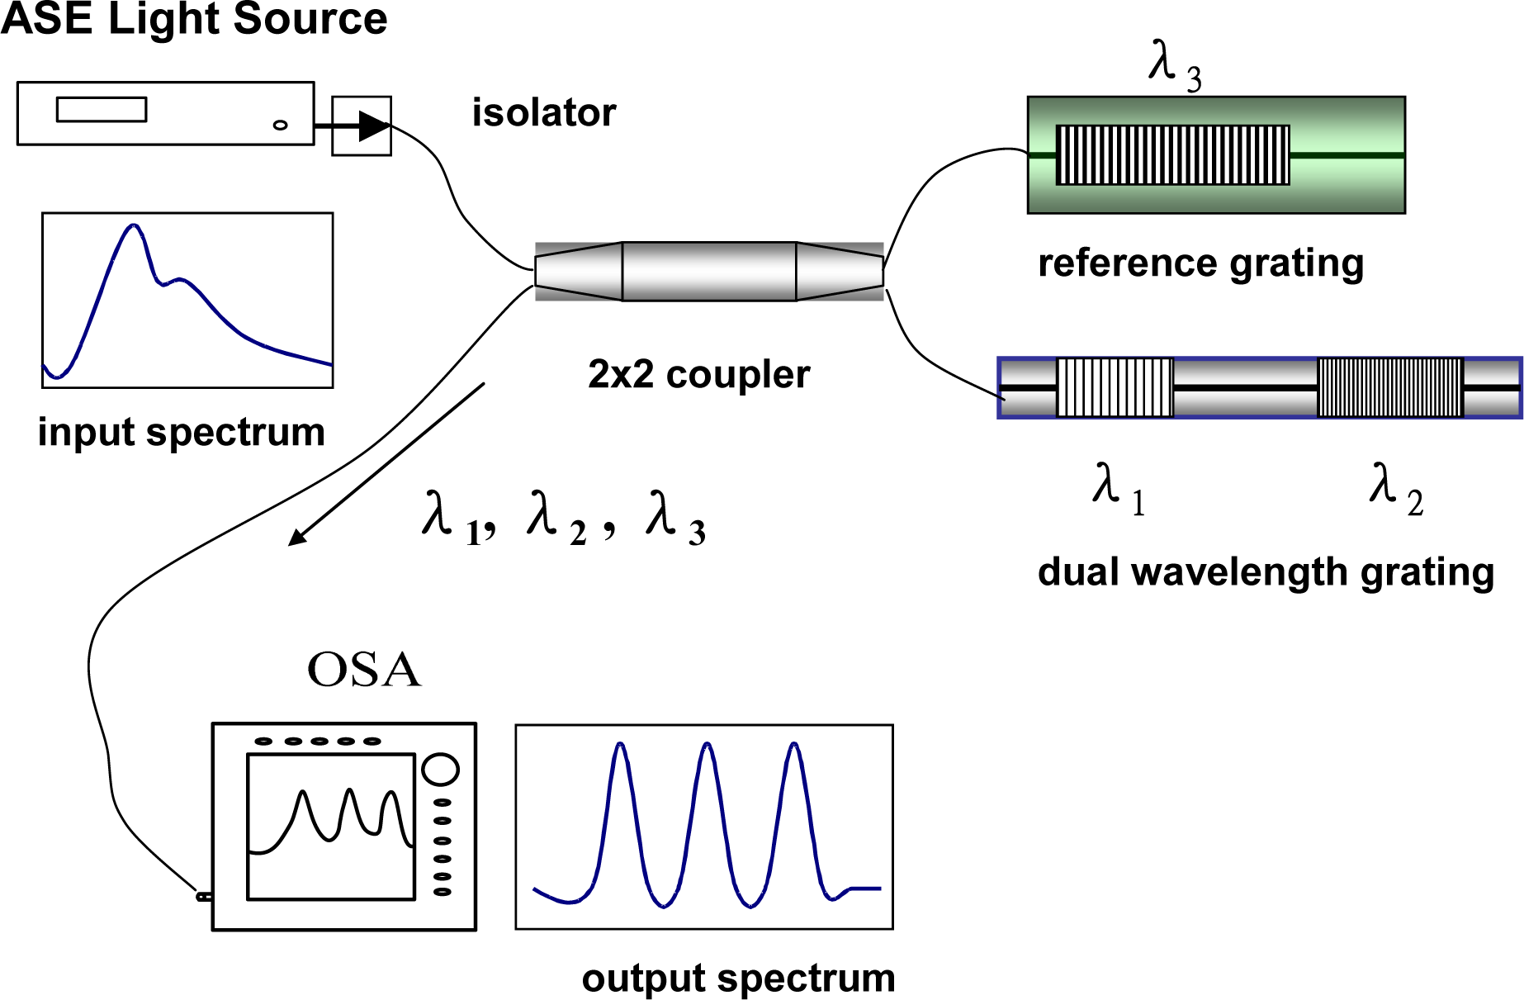
2.2. Sensor Configuration

We have developed a simple and low-cost optical fiber sensor for this purpose [12]. Table 1 summarizes the experimental and theoretical errors of individual strain and temperature measurement. Figure 1 shows the configuration of the sensor and the detection system, in which the proposed sensor was connected to the output port of a fiber coupler. The fiber sensor was consisted of a bare grating pair (λ1 and λ2,) and a packaged reference grating (λ3). The bare grating pair was constructed by fusion splicing two fiber Bragg gratings in cascade with different Bragg wavelengths. The spliced portion of the grating pair was glued into a quartz tube in order to prevent the relatively brittle spliced or fused portion from being damaged or broken. To protect the reference grating from mechanical deformation and damage, a method of packaging the bare fiber Bragg grating with a stainless steel tube was applied. In the packaging process, the reference grating was first bonded to a quartz substrate with an adhesive and the substrate with the reference grating was inserted into a stainless steel tube, and the both ends of the stainless tube was then glued and sealed with elastic epoxy glue. In this sensor structure, the free end of the fiber was secured with adhesive tape to avoid any unwanted movement or twisting. The three fiber Bragg gratings at wavelengths of λ1, λ2, λ3 were interrogated using a broadband ASE source and an optical spectrum analyzer (OSA). A fiber coupler was used for coupling the reflected light signals of the sensor to the OSA. The reference grating was used to measure only the temperature effect. The shift in Bragg wavelength λ3 from temperature changes is given by
Δ λ 3 = κ 3 T Δ T
Precise measurement of wavelength shift Δλ3 can be used to determine uniquely the local temperature provided that the temperature coefficient κ3T is well known. The grating pair was fabricated by splicing two fiber Bragg gratings with wavelengths, λ1 and λ2, respectively. The wavelength shifts Δλi from temperature (ΔTi) and strain (Δεi) changes were calculated using Equation (1). This equation may be inverted and temperature and strain from measurements of the two wavelength shifts can be solved as:
( Δ T Δ ε ) = 1 ( κ 1 T κ 2 ε κ 2 T κ 1 ε ) ( κ 2 ε κ 1 ε κ 2 T κ 1 T ) ( Δ λ 1 Δ λ 2 )
It can be seen that the errors measured in temperature and strain are determined primarily by the resolution effect of optical spectrum analyzer and the errors in estimation of temperature and strain coefficients (see Table 1, κ = 0.914 pm/με; κ = 0.918 pm/με; κ1T = 10.4 pm/°C; κ2T = 12.1 pm/°C). Although the use of a fast and high resolution grating interrogation system is feasible, to build such a sensor system is costly. A simple and cost-effective method for improving the performance is to use the reference grating as an independent temperature sensor. The reference grating can be used to reduce unnecessary errors induced from the grating pair and to improve the accuracy of the temperature measurement. Figures 2 and 3 show the strain and temperature performance of an individual fiber Bragg grating sensor. Figures 4 and 5 show the results of simultaneous strain and temperature measurements for this reference dual-wavelength sensor. The measured root mean square (RMS) errors for temperature and strain were estimated to be 0.13 °C and 6 με, respectively.

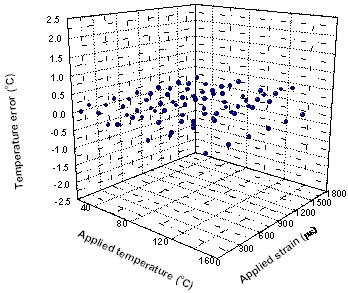
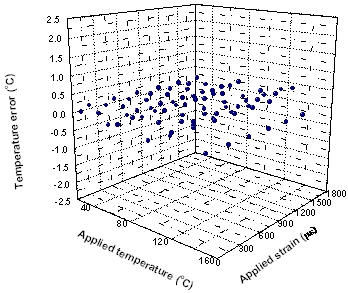
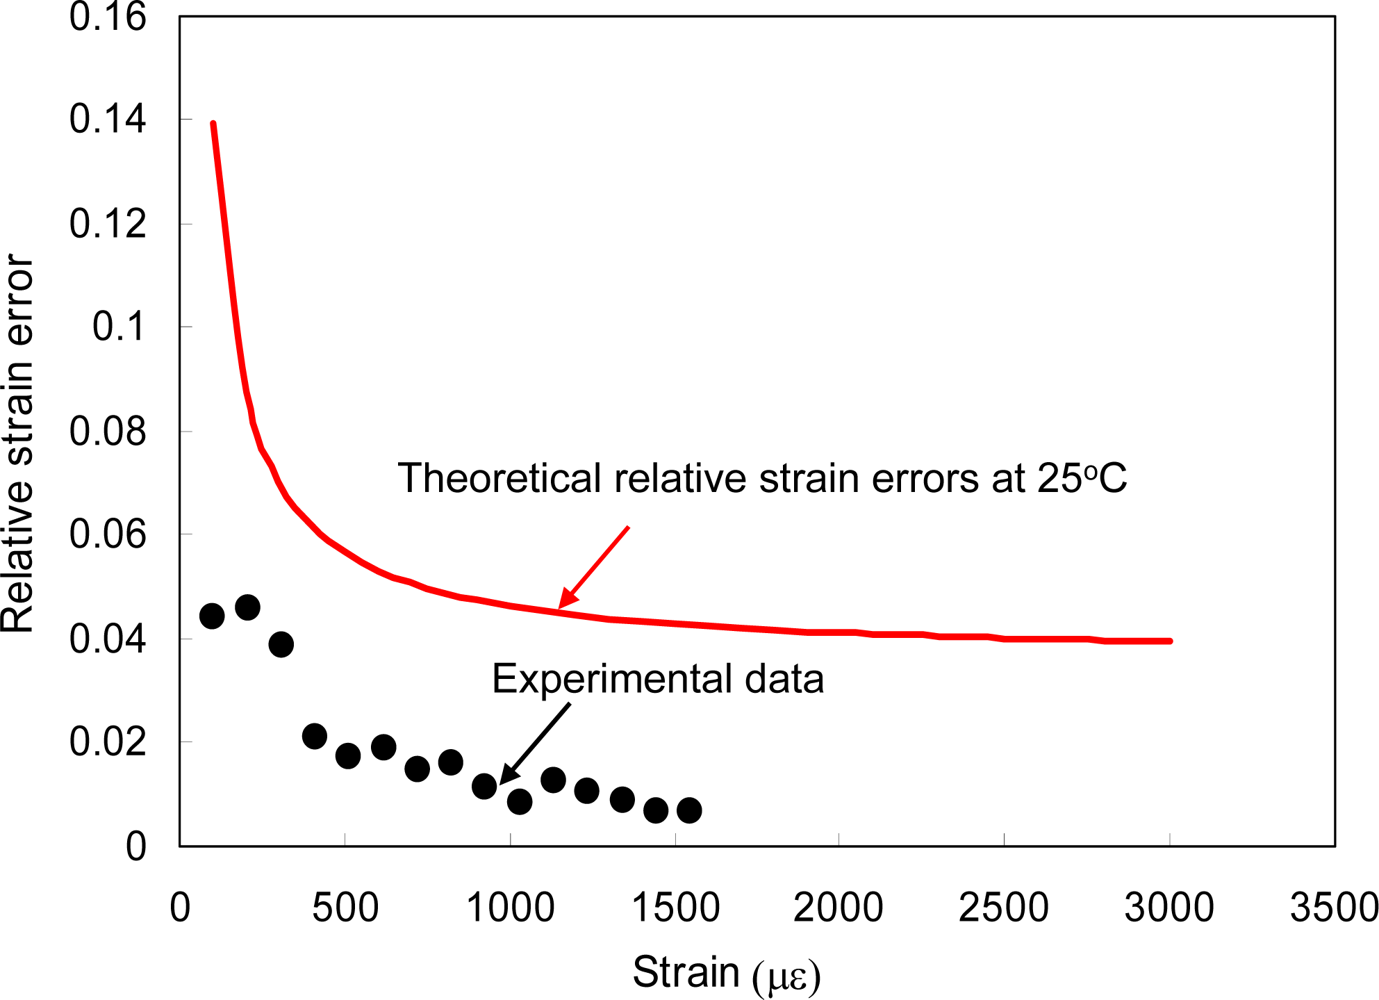
3. Error Analysis of Fiber Grating Sensor

According to the error analysis technique presented by Jin et al. [13], the theoretical strain and temperature dependent errors for the grating pair were examined. In the first case, we neglected the errors of the measured coefficients and attributed all errors to measurement errors of λ1 and λ2. The maximum errors in temperature T and strain ε is formulated as:
| δ T | | κ 2 ε | | δ λ 1 | + | κ 1 ε | | δ λ 2 | | Δ |
| δ ε | | κ 2 T | | δ λ 1 | + | κ 1 T | | δ λ 2 | | Δ |
where Δ = κ1Tκ − κ2Tκ. The maximum measurement errors of δT and δε were calculated as 0.13 °C and 1.6 με, respectively. For the second case, assuming that the measurement errors in λ1 and λ2 may be neglected (δλ1 = δλ2 = 0) and the maximum errors are in all the coefficients, the maximum relative errors for δT/T and δε/ε is expressed as:
| δ T T | max | κ 1 T κ 2 ɛ δ 1 T | + | κ 1 ɛ κ 2 T δ 2 T | + | κ 1 ɛ κ 2 ɛ | ( | δ 1 ɛ | + | δ 2 ɛ | ) | ɛ / T | | Δ |
| δ ɛ ɛ | max | κ 1 ɛ κ 2 T δ 1 ɛ | + | κ 1 T κ 2 ɛ δ 2 ɛ | + | κ 1 T κ 2 T | ( | δ 1 T | + | δ 2 T | ) | T / ɛ | | Δ |
Thus, the maximum relative errors for δT/T and δε/ε were calculated as 0.0016 + 2.90 × 10⁻⁶ ε/T, and 3.59 × 10⁻⁵ + 0.0188 T/ε, respectively. In Figure 6, we plotted the experimental relative error δε/ε as a function of strain at room temperature (25 °C) along with a theoretical curve at 25 °C. It can be seen that the theoretical curve and the experimental data of the relative strain errors agreed well except for some measured data below 200 με, indicating that the error in wavelength measurement is not negligible.
Secondly, considering all the measurement errors involved in determining the coefficients and the precision of wavelength measurement, the maximum relative errors for δT/T and δε/ε is given by
| δ T T | max | κ 1 T κ 2 ε | + | κ 1 ε κ 2 T | + 2 | ε / T | | κ 1 ε κ 2 ε | | κ 1 T κ 2 ε κ 1 ε κ 2 T | | γ |
| δ ε ε | max | κ 1 ε κ 2 T | + | κ 1 T κ 2 ε | + 2 | T / ε | | κ 1 T κ 2 T | | κ 1 T κ 2 ε κ 1 ε κ 2 T | | γ |
where γ is the maximum error in the entire matrix. With Equations (8) and (9), the maximum relative error or δT/T and δε/ε are estimated as 0.00175 + 1.42 × 10⁻⁴ ε/T, and 1.75 × 10⁻³ + 0.021 T/ε, respectively. As shown in Figure 7, the experimental error of δε / ε as a function of strain was plotted together with the different maximum error predictions at 25 °C. It is shown that all the measured data in Figure 7 departed away from the theoretical curve by a factor of 1.8∼6.2. Since the theoretical curve represents the maximum relative errors, the results show that all of the measured data of the relative strain errors were well controlled within the theoretical calculations at a reasonable range, in which the differences of relative strain errors between experiment and theory were around 0.03∼0.09.
However, in Reference [13], equations (6) to (9) were used only for normalizing maximum error, δTmax or δεmax, to be relative maximum error (δT/T or δε/ε, unit less). The value of relative maximum error (percentage) is not always between 0 and 100. It is not recommended to use the relative maximum error when the temperature or strain is zero since relative maximum error becomes singular in this situation. Actually, for our laboratory testing data, the controlled temperature and strain ranges were 25∼113 °C and 100∼1,600 με, respectively. There was no singular problem for our testing results. Therefore, using maximum errors instead of relative maximum errors could be a better way to characterize measured quantity. The maximum errors for temperature and strain are expressed by
| δ T | max ( | κ 1 T κ 2 ɛ δ 1 T | + | κ 1 ɛ κ 2 T δ 2 T | ) | T | + | κ 1 ɛ κ 2 ɛ | ( | δ 1 ɛ | + | δ 2 ɛ | ) | ɛ | | Δ |
| δ ɛ | max ( | κ 1 ɛ κ 2 T δ 1 ɛ | + | κ 1 T κ 2 ɛ δ 2 ɛ | ) | ɛ | + | κ 1 T κ 2 T | ( | δ 1 T | + | δ 2 T | ) | T | | Δ |
With equations (8) and (9), the maximum errors, |δT|max and |δε|max, were estimated as 0.00155 T + 2.90 × 10⁻⁶ ε and 3.59 × 10⁻⁵ ε+ 0.01887 T, respectively.

4. Measurement Uncertainty of Fiber Grating Sensor

The measurement uncertainty for temperature and strain simultaneous measurements using dual wavelength grating method was studied as estimation of standard uncertainty, combined standard uncertainty, and expanded uncertainty [14,15]. The source of uncertainty includes the skills of operators, effects of broadband ASE light source stability, fabrication and preparation of fiber grating samples and the resolution of optical spectrum analyzer. Assuming the operators are well-trained, broadband light source has been calibrated and is in stable condition, and the fabrication of fiber grating sensor meets the allowable tolerances as specified in standards or methods.

4.1. Estimation of Standard Uncertainty

The models for temperature and strain difference were shown in Equation (3) and let functions f and g represent the temperature and strain differences:
f = ˙ Δ T = [ κ 2 ε ( Δ λ 1 ) κ 1 ε ( Δ λ 2 ) ] / [ κ 1 T κ 2 ε κ 2 T κ 1 ε ]
g = Δ ε = [ κ 2 T ( Δ λ 1 ) + κ 1 T ( Δ λ 2 ) ] / [ κ 1 T κ 2 ε κ 2 T κ 1 ε ]
Since the measurement resolution of wavelength shift using the ANDO AQ6331 OSA was ±0.05 nm, the uncertainty on the FBGs measurement was as large as 3 pm [16]. For the standard uncertainty of wavelength shift at a confidence level of not less than 95%; assuming normal distribution with coverage factor k = 2 and degree of freedom, νΔλ1 = infinity, and νΔλ2 = infinity, therefore;
  • Standard uncertainty, uΔλ1 = 3 pm/2 = 1.5 pm;
  • Standard uncertainty, uΔλ2 = 3 pm/2 = 1.5 pm;

4.2. Estimation of Combined Standard Uncertainty

Based on Table 1, the strain and temperature coefficients were used to evaluate the uncertainty values for both fiber gratings, λ1 and λ2, respectively.
  • Sensitivity coefficient for Δ T due to λ1:
    C f , Δ λ 1 = [ f / Δ λ 1 ] = κ 2 ε / [ κ 1 T κ 2 ε κ 2 T κ 1 ε ] = 0.6070626 ° C / pm ;
  • Sensitivity coefficient for Δ T due to λ2:
    C f , Δ λ 2 = [ f / Δ λ 1 ] = ˜ κ 1 ε / [ κ 1 T κ 2 ε κ 2 T κ 1 ε ] = 0.6044174 ° C / pm ;
  • Sensitivity coefficient for Δε due to λ1:
    C g , Δ λ 1 = [ g / Δ λ 1 ] = ˜ κ 2 T / [ κ 1 T κ 2 ε κ 2 T κ 1 ε ] = 8.001587 μ ε / pm ;
  • Sensitivity coefficient for Δε due to λ2:
    C g , Δ λ 2 = [ g / Δ λ 1 ] = κ 1 T / [ κ 1 T κ 2 ε κ 2 T κ 1 ε ] = 6.8773972 μ ε / pm ;
Since the temperature is compensated, it is reasonable to assume there are non-correlated uncertainty components. The combined uncertainty is obtained from the uncertainties of the single components without taking into account possible covariances. The combined uncertainties for temperature and strain are the square root of equations (14) and (15), respectively:
U combined 2 ( Δ T ) = u f = i = 1 n ( f x i ) 2 u 2 ( x i )
U combined 2 ( Δ ε ) = u g = i = 1 n ( g x i ) 2 u 2 ( x i )
where the combined uncertainty is calculated for non-correlated uncertainty components based on the first order Taylor approximation.
Thus the combined standard uncertainty for temperature difference as:
[ u f ] 2 = ( C f , Δ λ 1 ) 2 ( u Δ λ 1 ) 2 + ( C f , Δ λ 2 ) 2 ( u Δ λ 2 ) 2 = 1.651 ° C 2 ; u f = 1.285 ° C
The combined standard uncertainty for strain difference as:
[ u g ] 2 = C g , Δ λ 1 ) 2 ( u Δ λ 1 ) 2 + ( C g , Δ λ 2 ) 2 ( u Δ λ 2 ) 2 = 250.479 μ ε 2 ; u g = 15.827 μ ε

4.3. Estimation of Expanded Uncertainty

Effective degree of freedom for Δ T,
ν e f f , f = [ u f ] 4 / Σ { [ ( C f , Δ λ t ) ( u Δ λ t ) ] 4 / ν i } = infinity ;
Effective degree of freedom for Δε,
ν eff , g = [ u g ] 4 / { [ ( C g , Δ λ ι ) ( u Δ λ ι ) ] 4 / ν i } = infinity ;
Thus for coverage factor k = 2.025 at 95% level confidence (from Student-t distribution);
U f = U Δ T = k u f = 2.205 * ( 1.285 ) 2.602 ° C
U g = U Δ ε = k u g = 2.205 * ( 15.827 ) 32.049 μ ε
Therefore, values of temperature and strain measurement uncertainty were determined to be 2.602 °C and 32.049 με, respectively. The estimation of expanded uncertainty provides at 95% confidence level with a coverage factor of k = 2.205, but excluding the effects of light source stability and fabrication and preparation of fiber grating samples.

5. Conclusions

We present a simple and low-cost reference dual-wavelength grating sensor system that could offer the potential of simultaneous measurement of strain and temperature for infrastructures. Experimental results show that measurement errors of 6 με and 0.13 °C for strain and temperature could be achieved, respectively. We have performed and characterized the error analysis and measurement uncertainty for this strain-temperature sensing system. The maximum errors for temperature T and strain ε were calculated as 0.00155 T + 2.90 × 10⁻⁶ ε and 3.59 × 10⁻⁵ ε+ 0.01887 T, respectively. Based on the analysis of estimation of expanded uncertainty at 95% confidence level with a coverage factor of k = 2.205, values of temperature and strain measurement uncertainty were evaluated as 2.60 °C and 32.05 με, respectively. Using fiber grating sensors, for the first time the measurement uncertainty for simultaneous strain-temperature sensing could successfully be analyzed.

Acknowledgments

The authors thank Yi-Hsien Wang for his laboratory assistance. The partial support of the National Science Council (NSC) of Taiwan under Contract Nos. NSC 95-2122-M-194-013, NSC 95-3114-P-194-001-MY3, NSC 96-2112-M-194-004-MY3, NSC 97-2111-E-224-050, and NSC 98-2111-E-224-060 is gratefully acknowledged.

References

  1. Kersey, AD; Berkoff, TA; Morey, WW. Fiber-Optic Bragg grating strain sensor with phase sensitive detection. Proceedings of 1st European Conference on Smart Structures and Materials, Glasgow, Scotland, 12–14 May 1992; pp. 61–67.
  2. Xu, MG; Archambault, JL; Reekie, L; Dakin, JP. Discrimination between strain and temperature effects using dual-wavelength fiber grating sensors. Electron. Lett. 1994, 30, 1085–1087. [Google Scholar]
  3. Kanellopouslos, SE; Handerek, VA; Rogers, AJ. Simultaneous strain and temperature sensing with photogenerated in-fiber gratings. Optics Letters 1995, 20, 333–335. [Google Scholar]
  4. Patrick, HJ; Williams, GM; Kersey, AD; Pedrazzani, JR; Vengsarkar, AM. Hybrid fiber Bragg grating/long period fiber grating sensors for strain/temperature discrimination. IEEE Photonic. Technol. Lett. 1996, 8, 1223–1225. [Google Scholar]
  5. James, SW; Dockney, ML; Tatam, RP. Simultaneous independent temperature and strain measurement using in-fiber Bragg grating sensors. Electron. Lett. 1996, 32, 1133–1134. [Google Scholar]
  6. Jung, J; Park, N; Lee, B. Simultaneous measurement of strain and temperature using a single fbg grating with erbium-dopped fiber amplifier. Appl. Opt. 2000, 39, 1118–1120. [Google Scholar]
  7. Davis, MA; Kersey, AD. Simultaneous measurement of temperature and strain using fiber Bragg grating and Brillouin scattering. IEE Proc. Optoelectronics 1997, 144, 151–155. [Google Scholar]
  8. Chehura, E; James, SW; Tatam, RP. Temperature and strain discrimination using a single tilted fibre Bragg grating. Opt. Commun. 2007, 275, 344–347. [Google Scholar]
  9. Ma, J; Bock, WJ; Urbanczyk, W. Error analysis of temperature-compensated white-light interferometric fiber-optic strain sensor. Sensor. Actuator-A 2004, 112, 25–31. [Google Scholar]
  10. Xie, JF; Zhang, H; Zhu, Z; Xu, JN; Hu, RH; Song, LF. A study of the temperature sensitivity of fiber Bragg gratings after metallization. Smart Mater. Struct. 2007, 16, 1837–1842. [Google Scholar]
  11. Othonos, A; Kalli, K. Fiber Bragg Grating: Fundamentals and Applications in Telecommunications and Sensing; Artech House Inc: Norwood, MA, USA, 1999. [Google Scholar]
  12. Wang, JN; Tang, JL. Using fiber Bragg grating sensors to monitor pavement structures. Transp. Res. Rec. 2005, 1913, 165–176. [Google Scholar]
  13. Jin, W; Michie, WC; Thursby, G; Konstantaki, M; Culshaw, B. Simultaneous measurement of temperature and strain: Error analysis. Opt. Eng. 1997, 36, 598–609. [Google Scholar]
  14. European Federation of National Associations of Measurement, Testing and Analytical Laboratories. Measurement Uncertainty in Testing; Berlin, Germany, 2002. [Google Scholar]
  15. Singapore Accreditation Council. Singapore Laboratory Accreditation Scheme (SAC-SINGLAS), Guidance Document on Measurement Uncertainty for Civil Engineering and Mechanical Testing Laboratories; Singapore, 2004. [Google Scholar]
  16. Dyer, SD; Kofler, JD; Espejo, RJ; Etzel, SM. Stability of fiber Bragg grating wavelength calibration references. In Bragg Gratings, Photosensitivity, and Poling in Glass Waveguides; Optical Society of America Monterey: California, CA, USA, 2003; pp. 55–57. [Google Scholar]
Figure 1. A reference dual wavelength grating system.
Sensors 10 06582f1
Figure 2. Strain performance of grating sensor. Inset: output spectrum for the fiber Bragg grating sensors with an applied strain at 0 με (black color) and 900 με (magenta color), respectively.
Sensors 10 06582f2
Figure 3. Temperature performance of grating sensor. Inset: output spectrum for the fiber Bragg grating sensors with an applied temperature at 35 °C (black color) and 85 °C (magenta color), respectively.
Sensors 10 06582f3
Figure 4. 3D Scatter plot of strain errors with applied temperature and applied strain.
Sensors 10 06582f4
Figure 5. 3D scatter plot of temperature errors with applied temperature and applied strain.
Sensors 10 06582f5
Figure 6. Measured and calculated relative strain error as a function of strain. In error analysis, the measurement errors in wavelength were neglected.
Sensors 10 06582f6
Figure 7. Measured and calculated relative strain error as a function of strain. In error analysis, all measurement errors are taken into account.
Sensors 10 06582f7
Table 1. Experimental and theoretical errors of individual strain and temperature measurement.
FBG sensor propertyDual gratingReference grating
λ11 (1,548 nm)λ21 (1,554 nm)λ3 (1,551 nm)
Strain coefficient (pm/με)0.914 ± 0.0030.918 ± 0.003N/A2
Temperature coefficient (pm/°C)10.4 ± 0.1012.1 ± 0.1012.1 ± 0.08
Theoretical strain error (με)5.364.93N/A
Experimental strain error (με)7.8612.35N/A
Theoretical temperature error (°C)0.170.170.17
Experimental temperature error (°C)0.650.440.48
Note:
1Strain and temperature coefficients for calculation of measurement uncertainty were as follows: κ = 0.914 pm/με; κ = 0.918 pm/με; κ1T = 10.4 pm/°C; κ2T = 12.1 pm/°C
2Not applicable

