Experimental Study of the Oriented Immobilization of Antibodies on Photonic Sensing Structures by Using Protein A as an Intermediate Layer

 , , ,
, , ,
Abstract
:1. Introduction
2. Materials and Methods
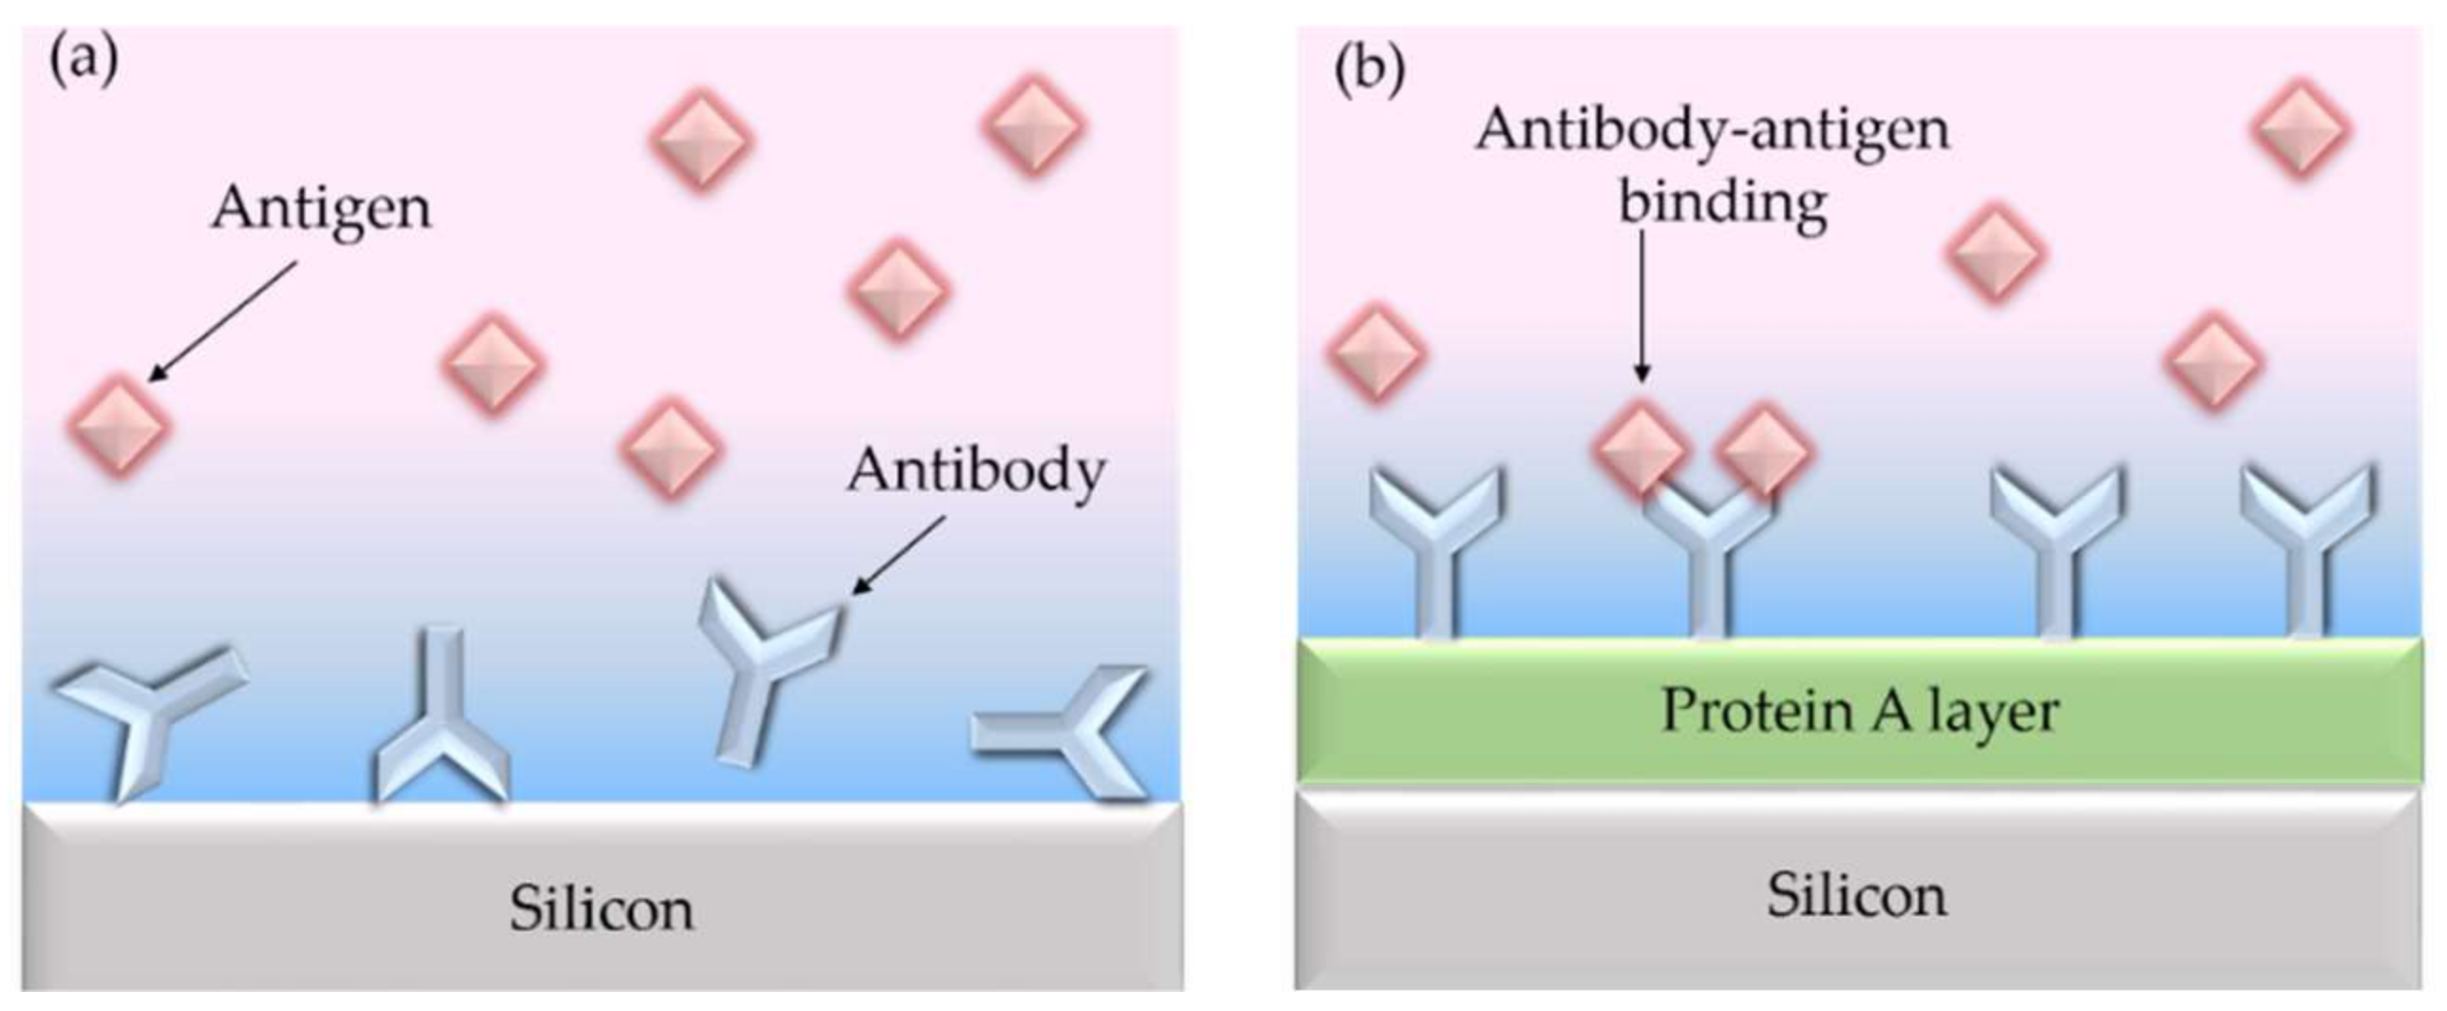
2.1. Usefulness of Protein A for Antibody Immobilization
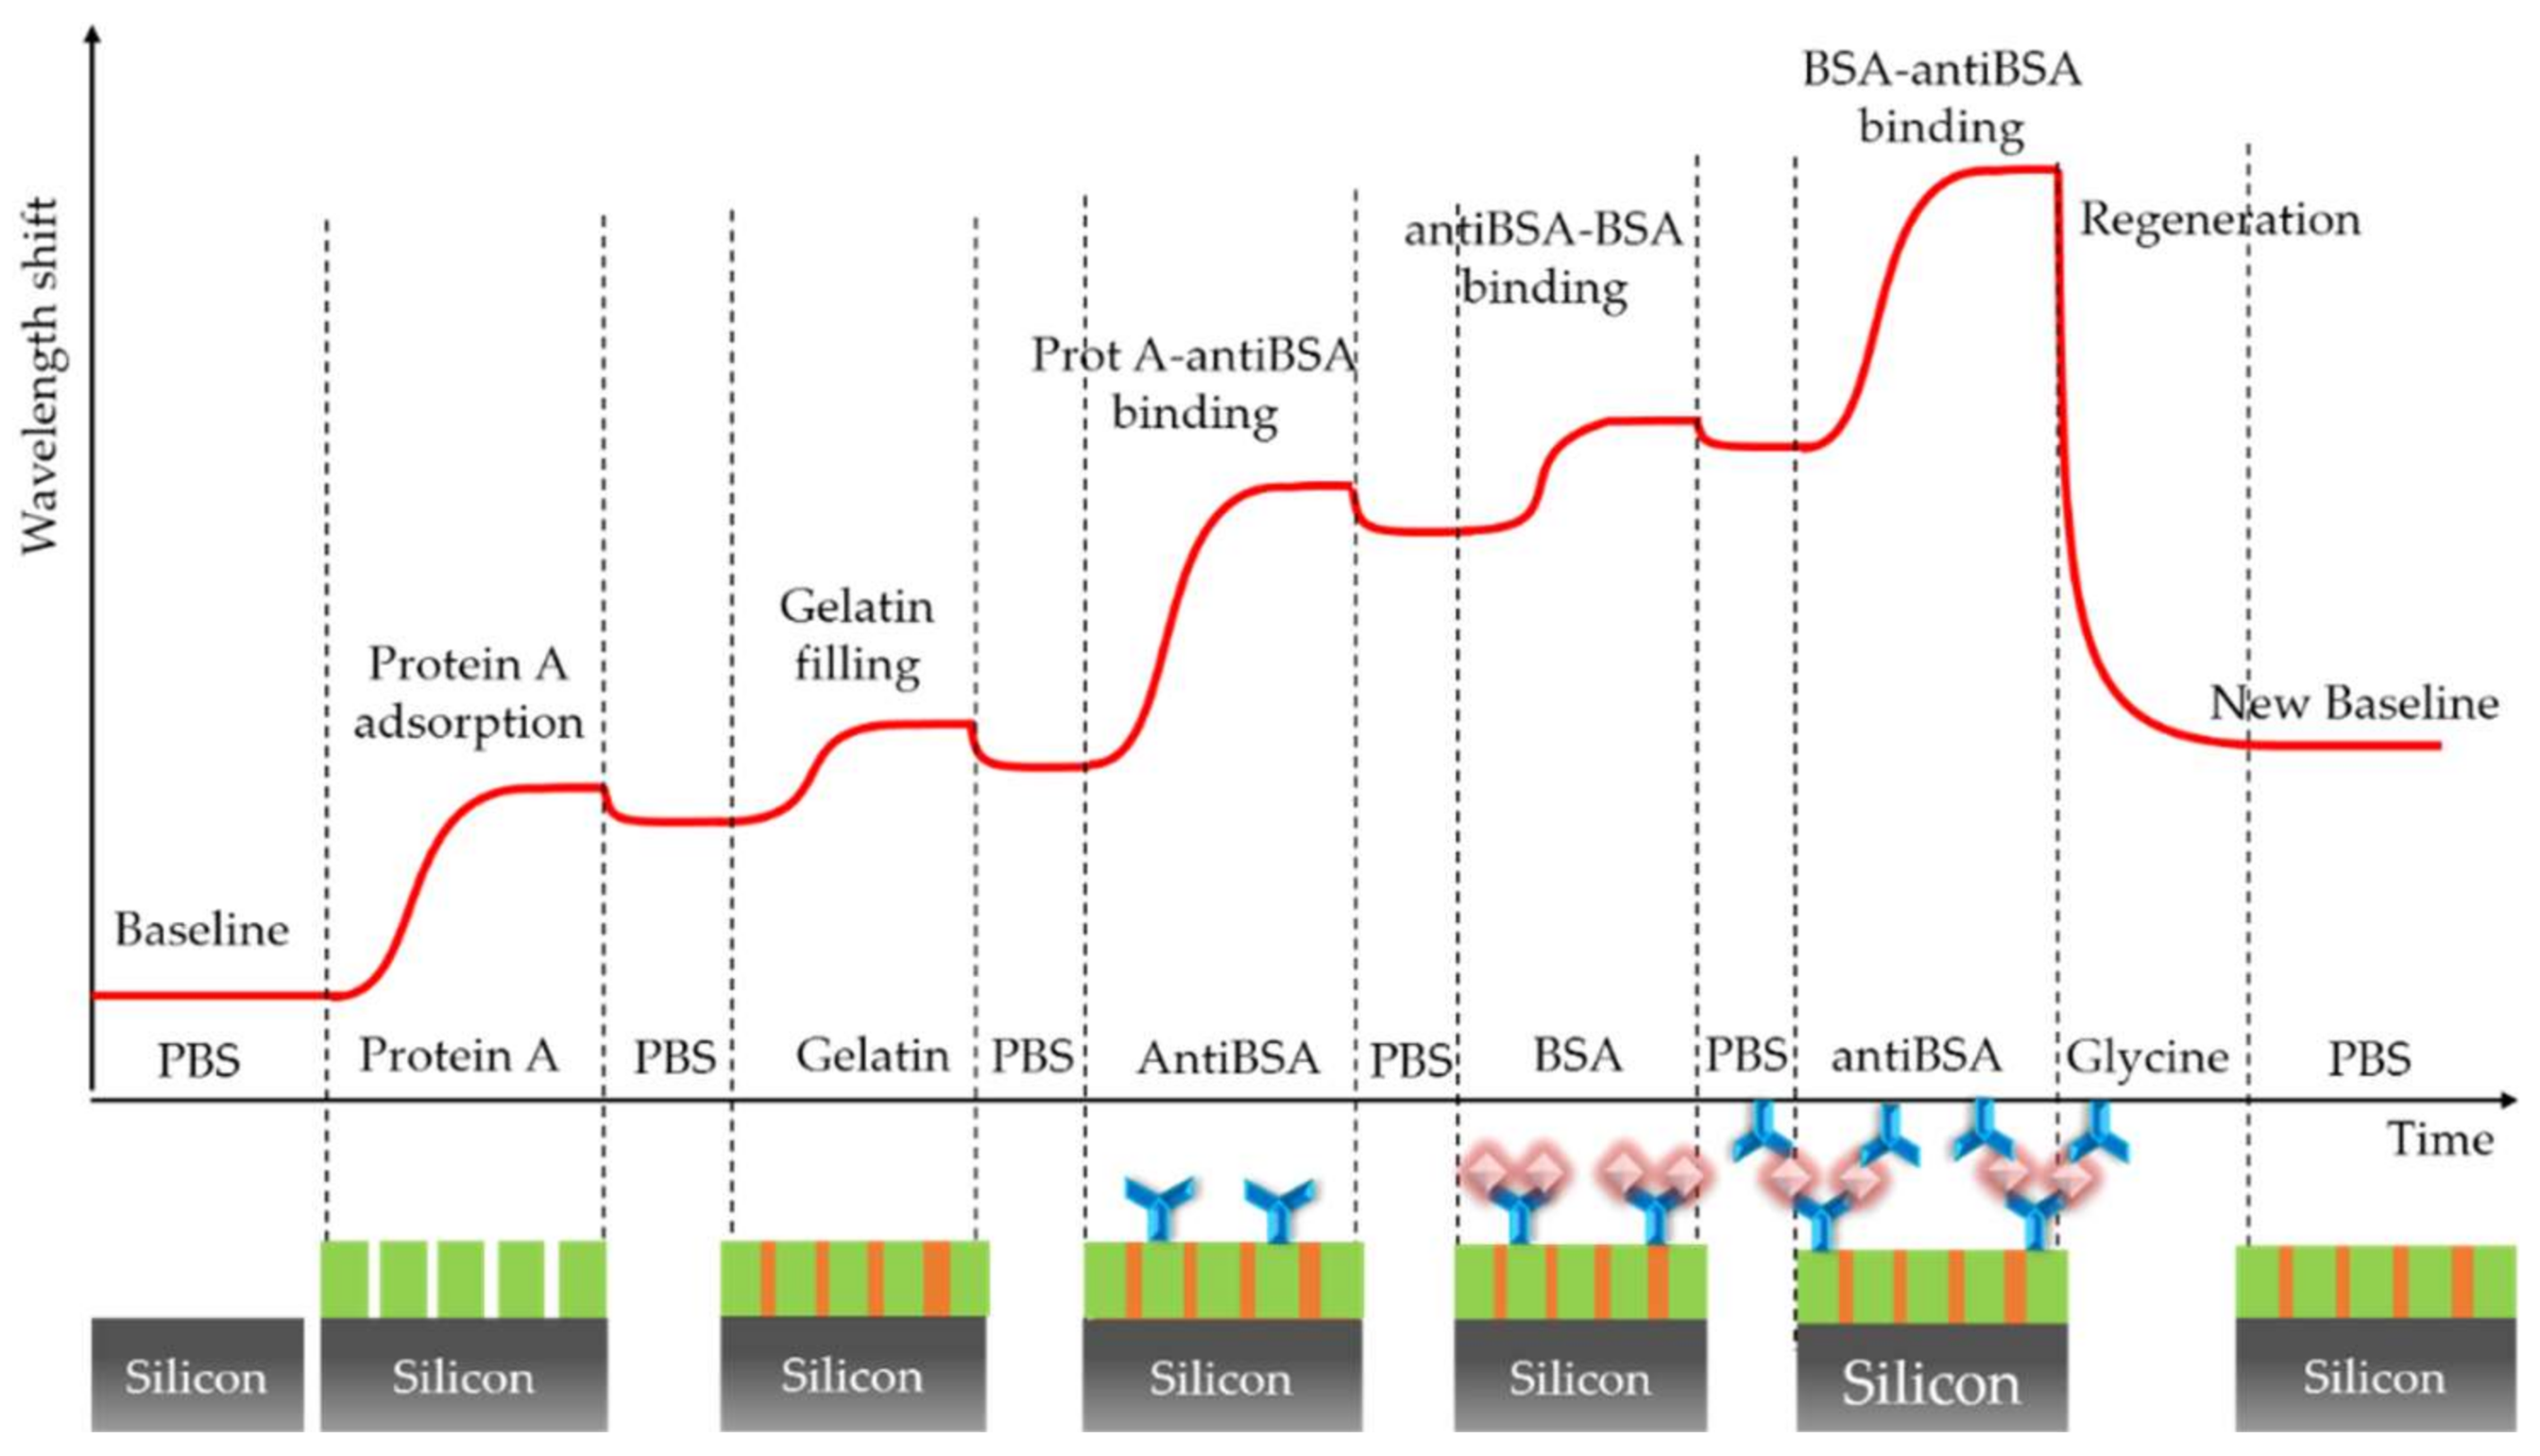
2.2. Experimental Procedure
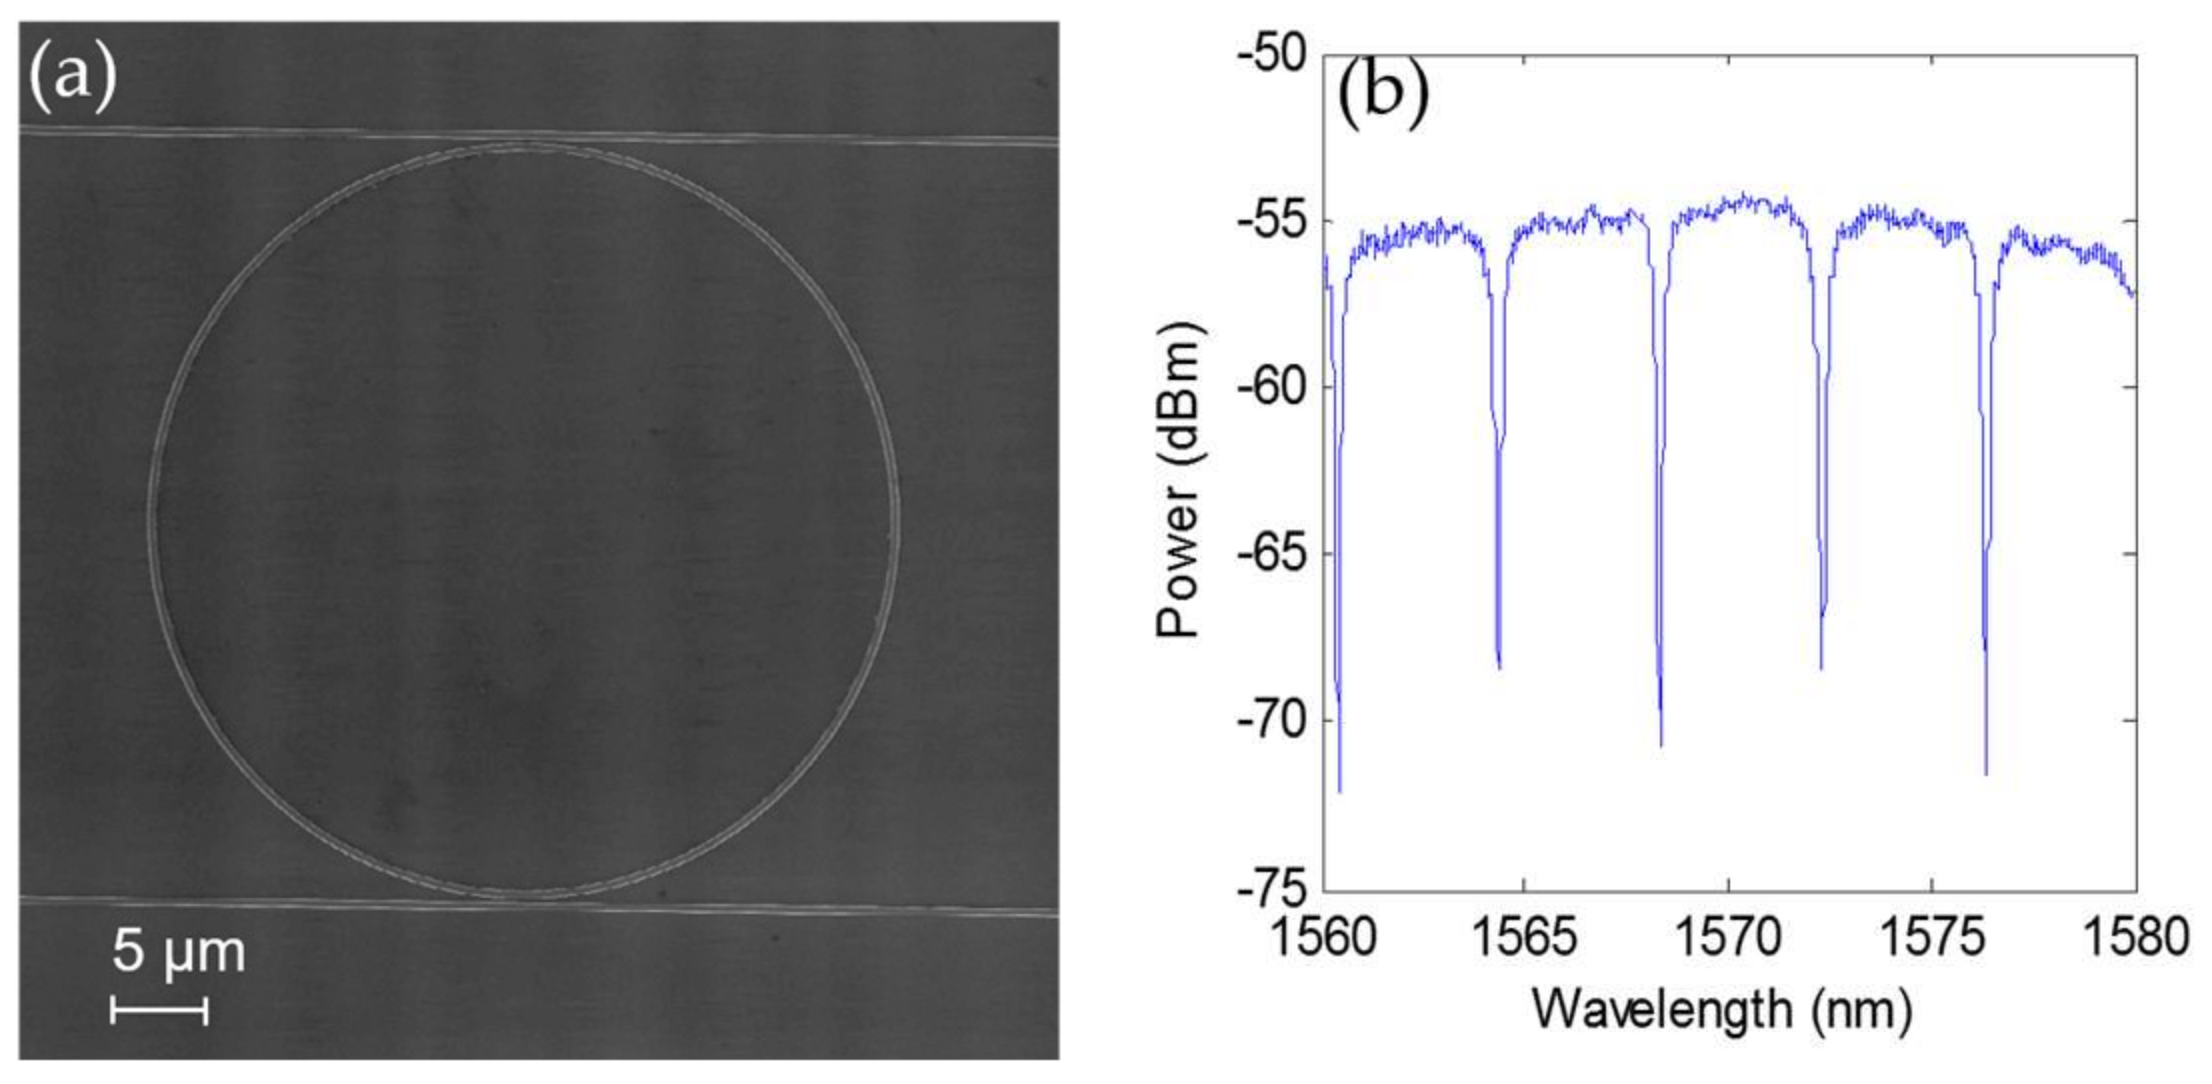
2.3. Photonic Structure
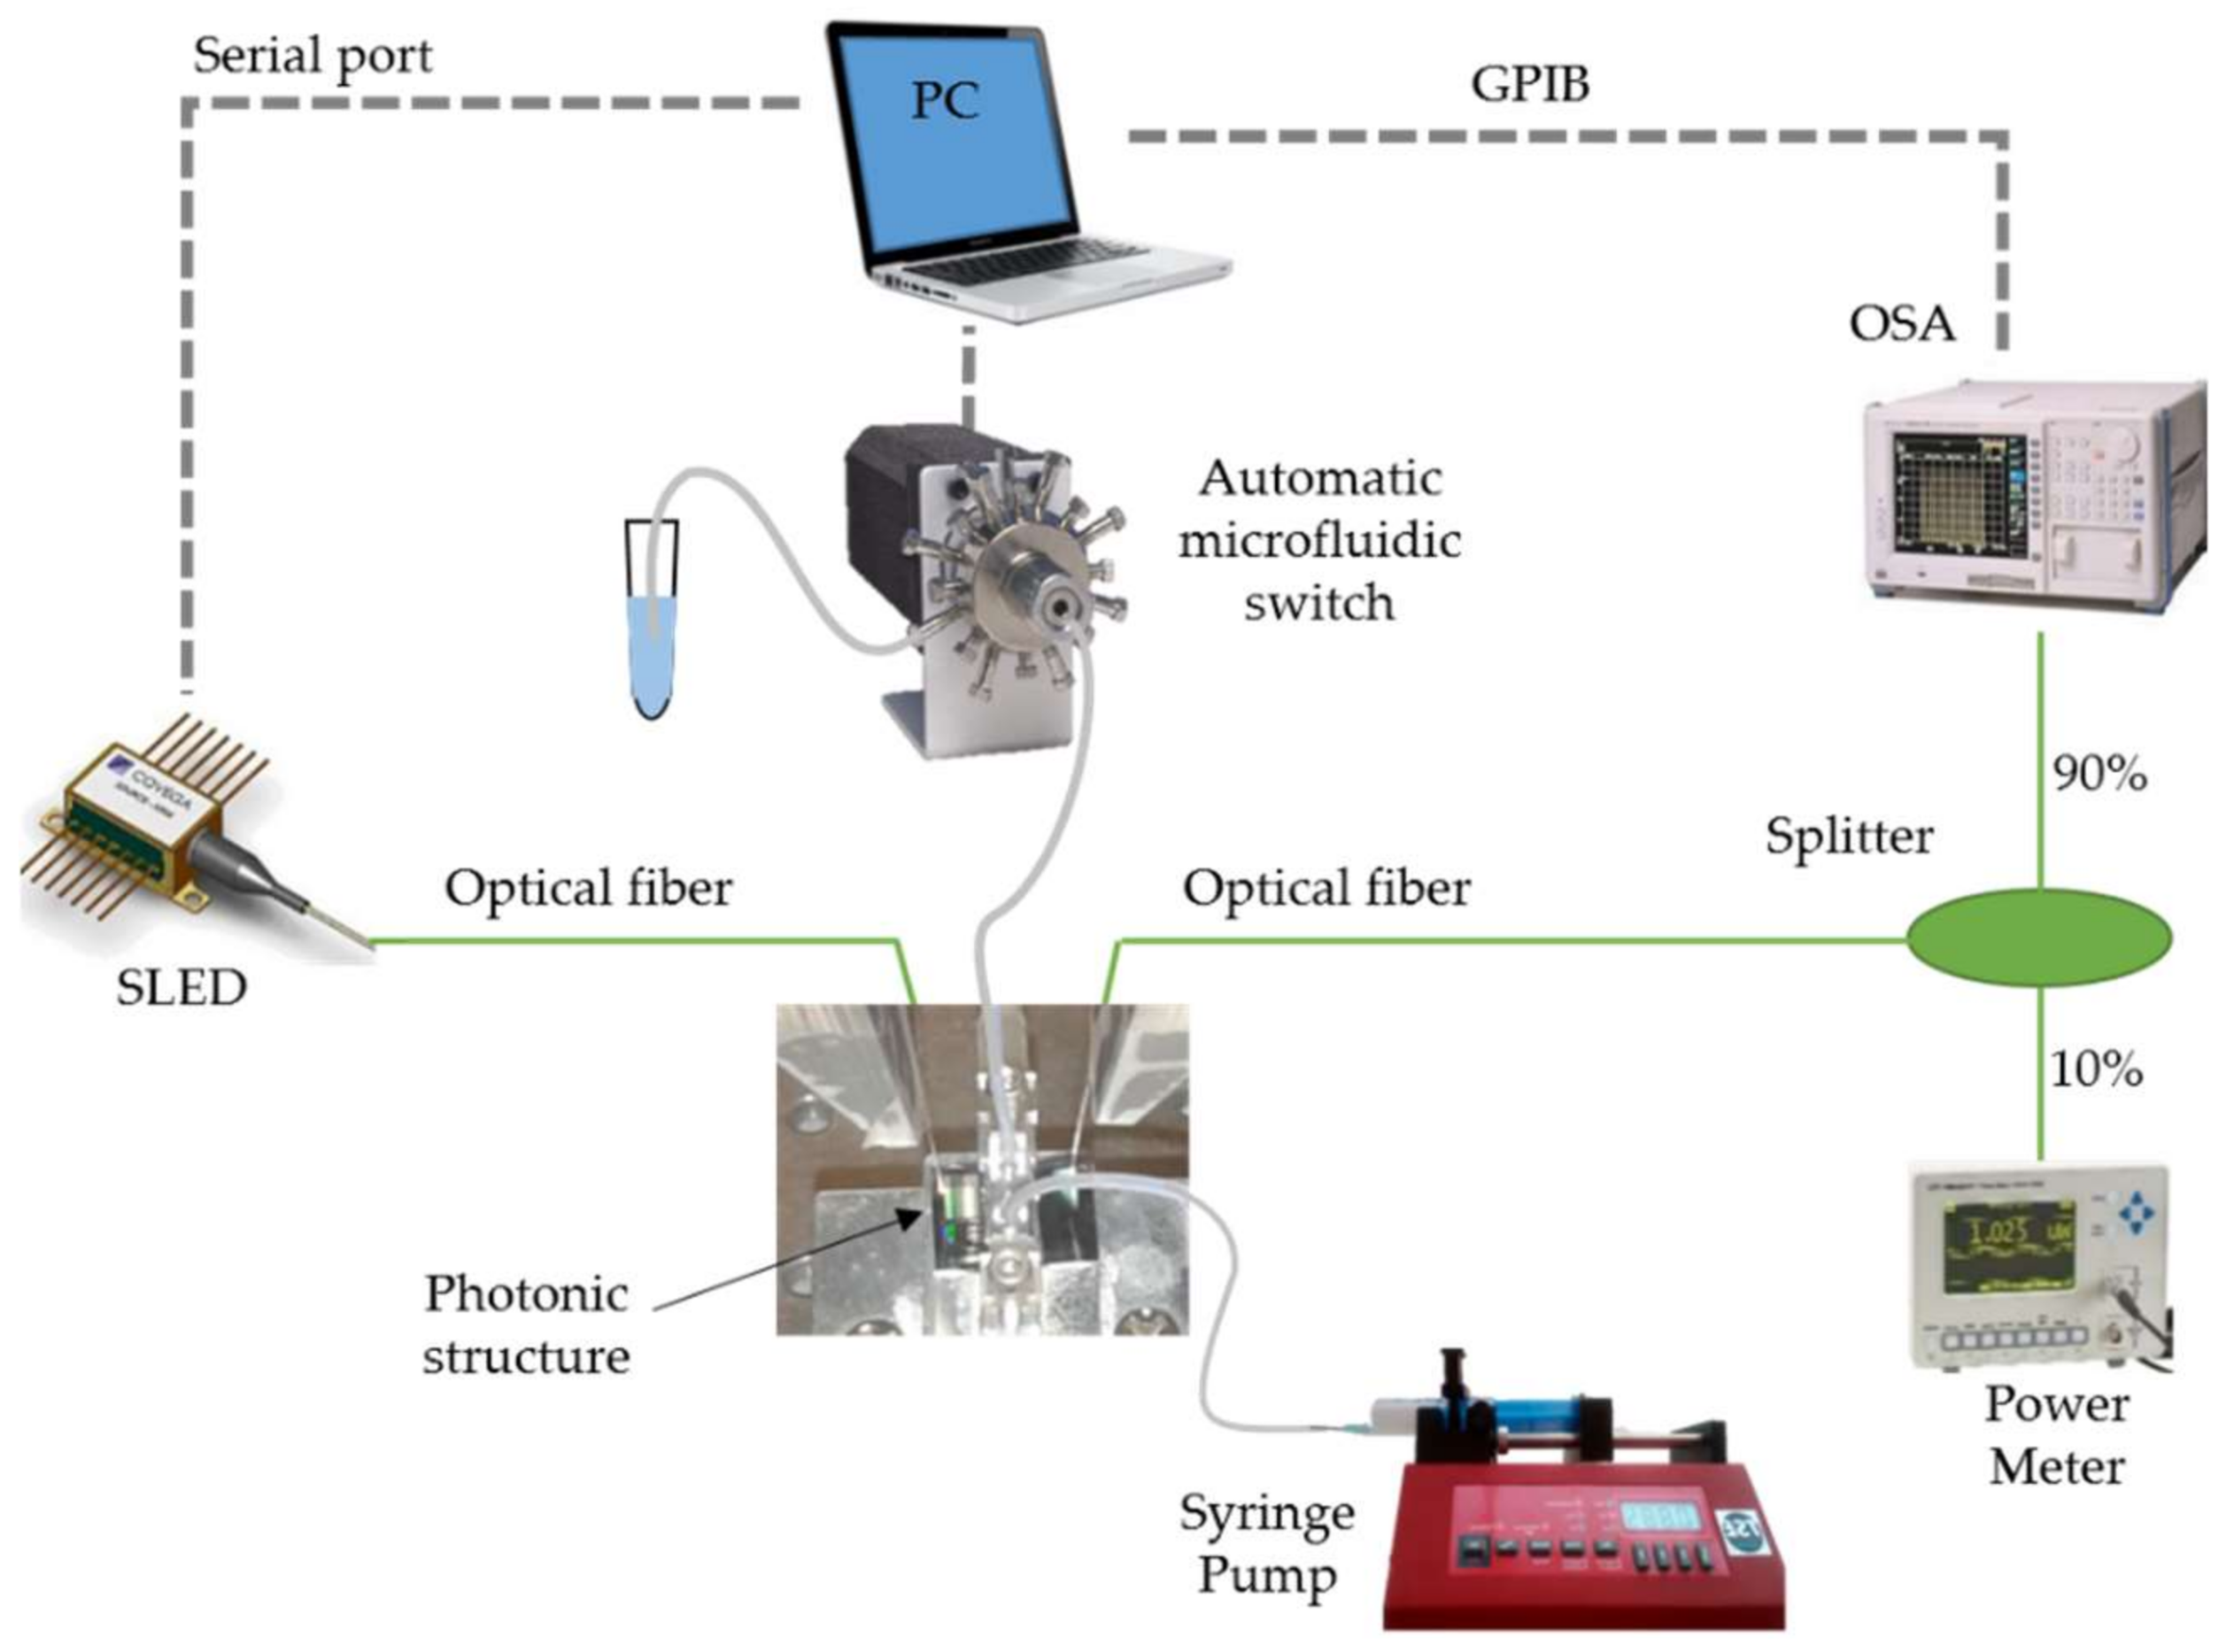
2.4. Opto-Fluidic Setup
3. Results
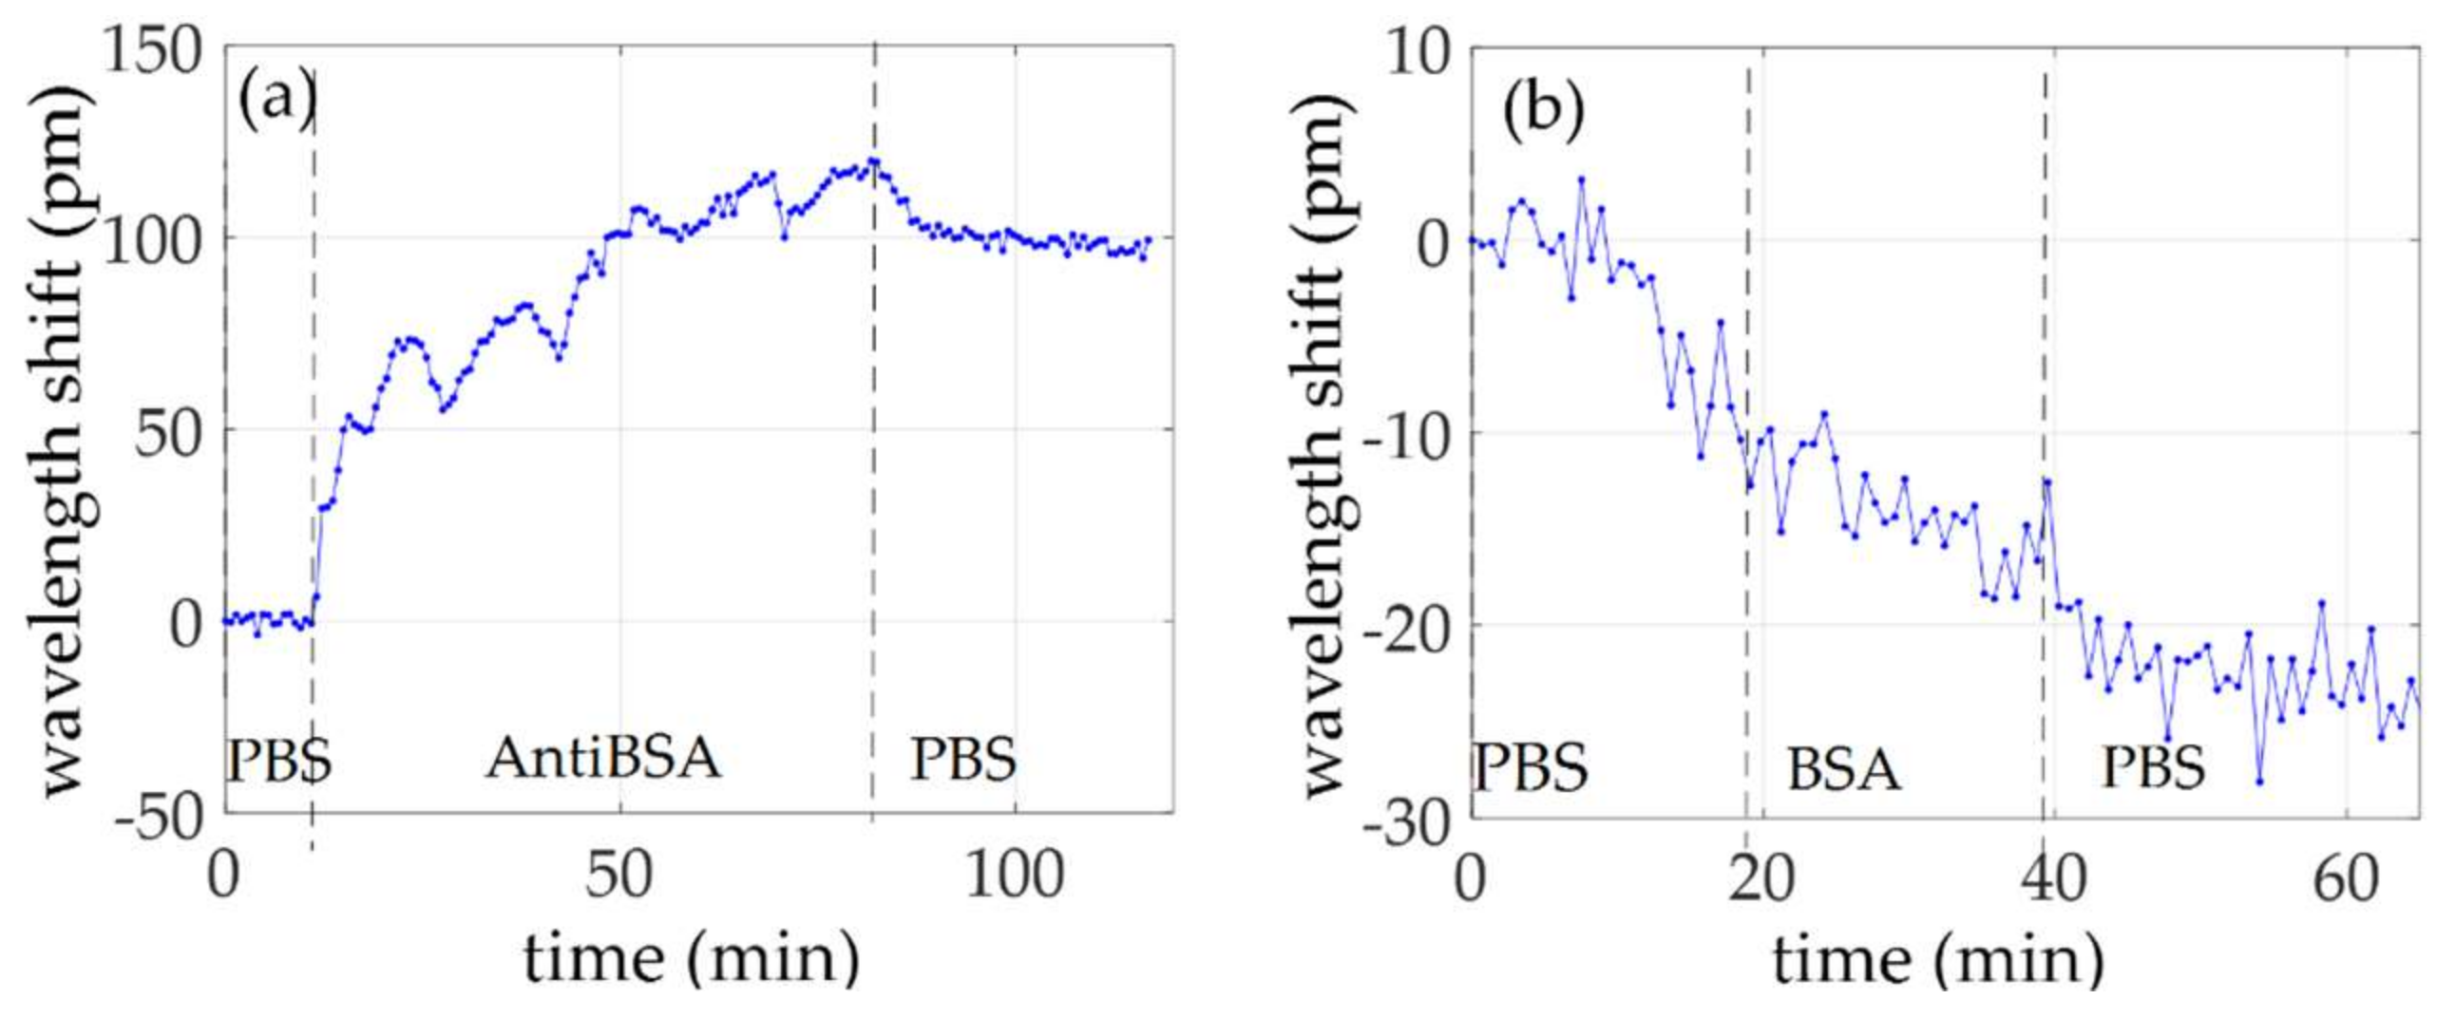
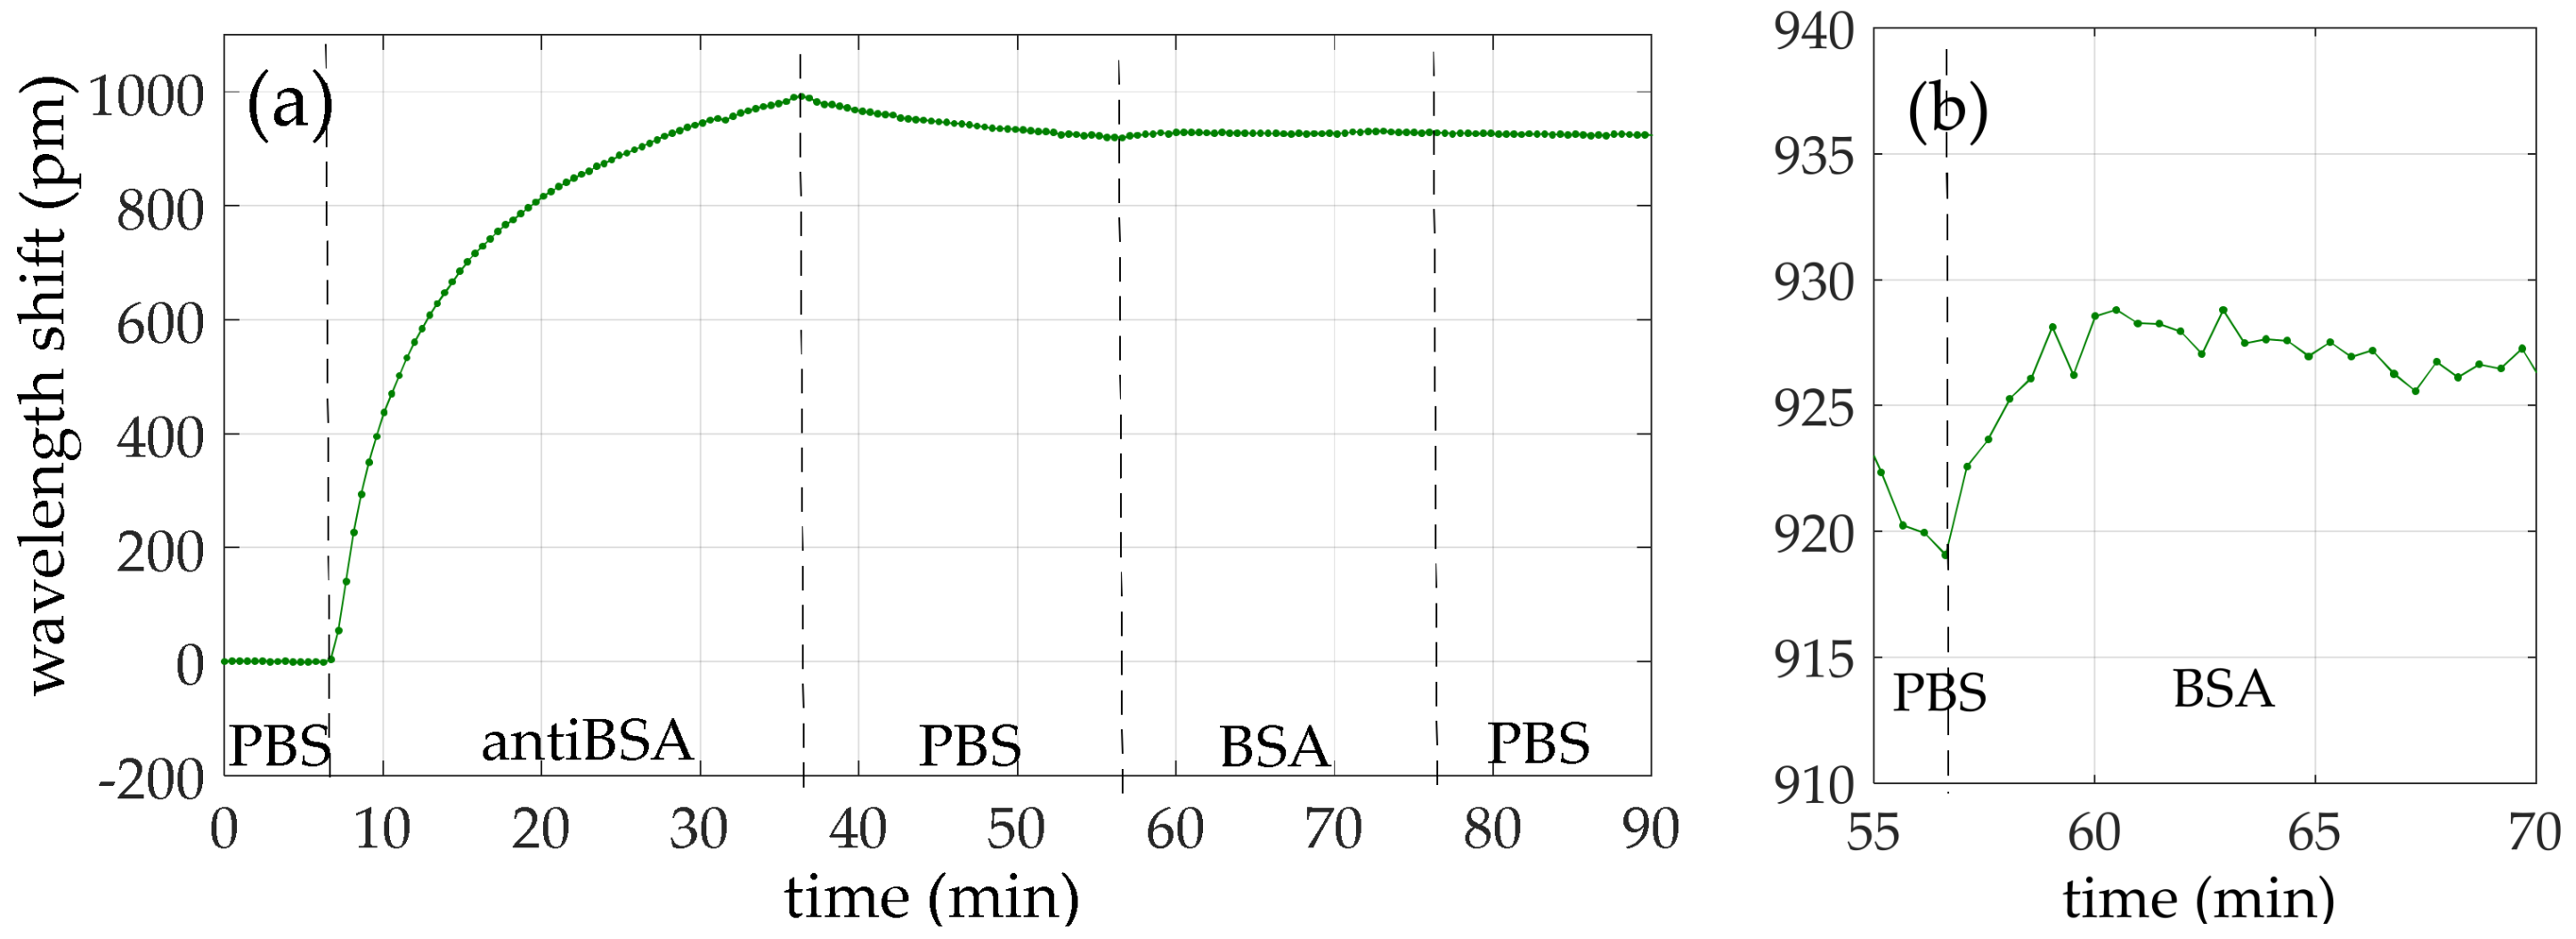
3.1. BSA Sensing without the Protein A Layer
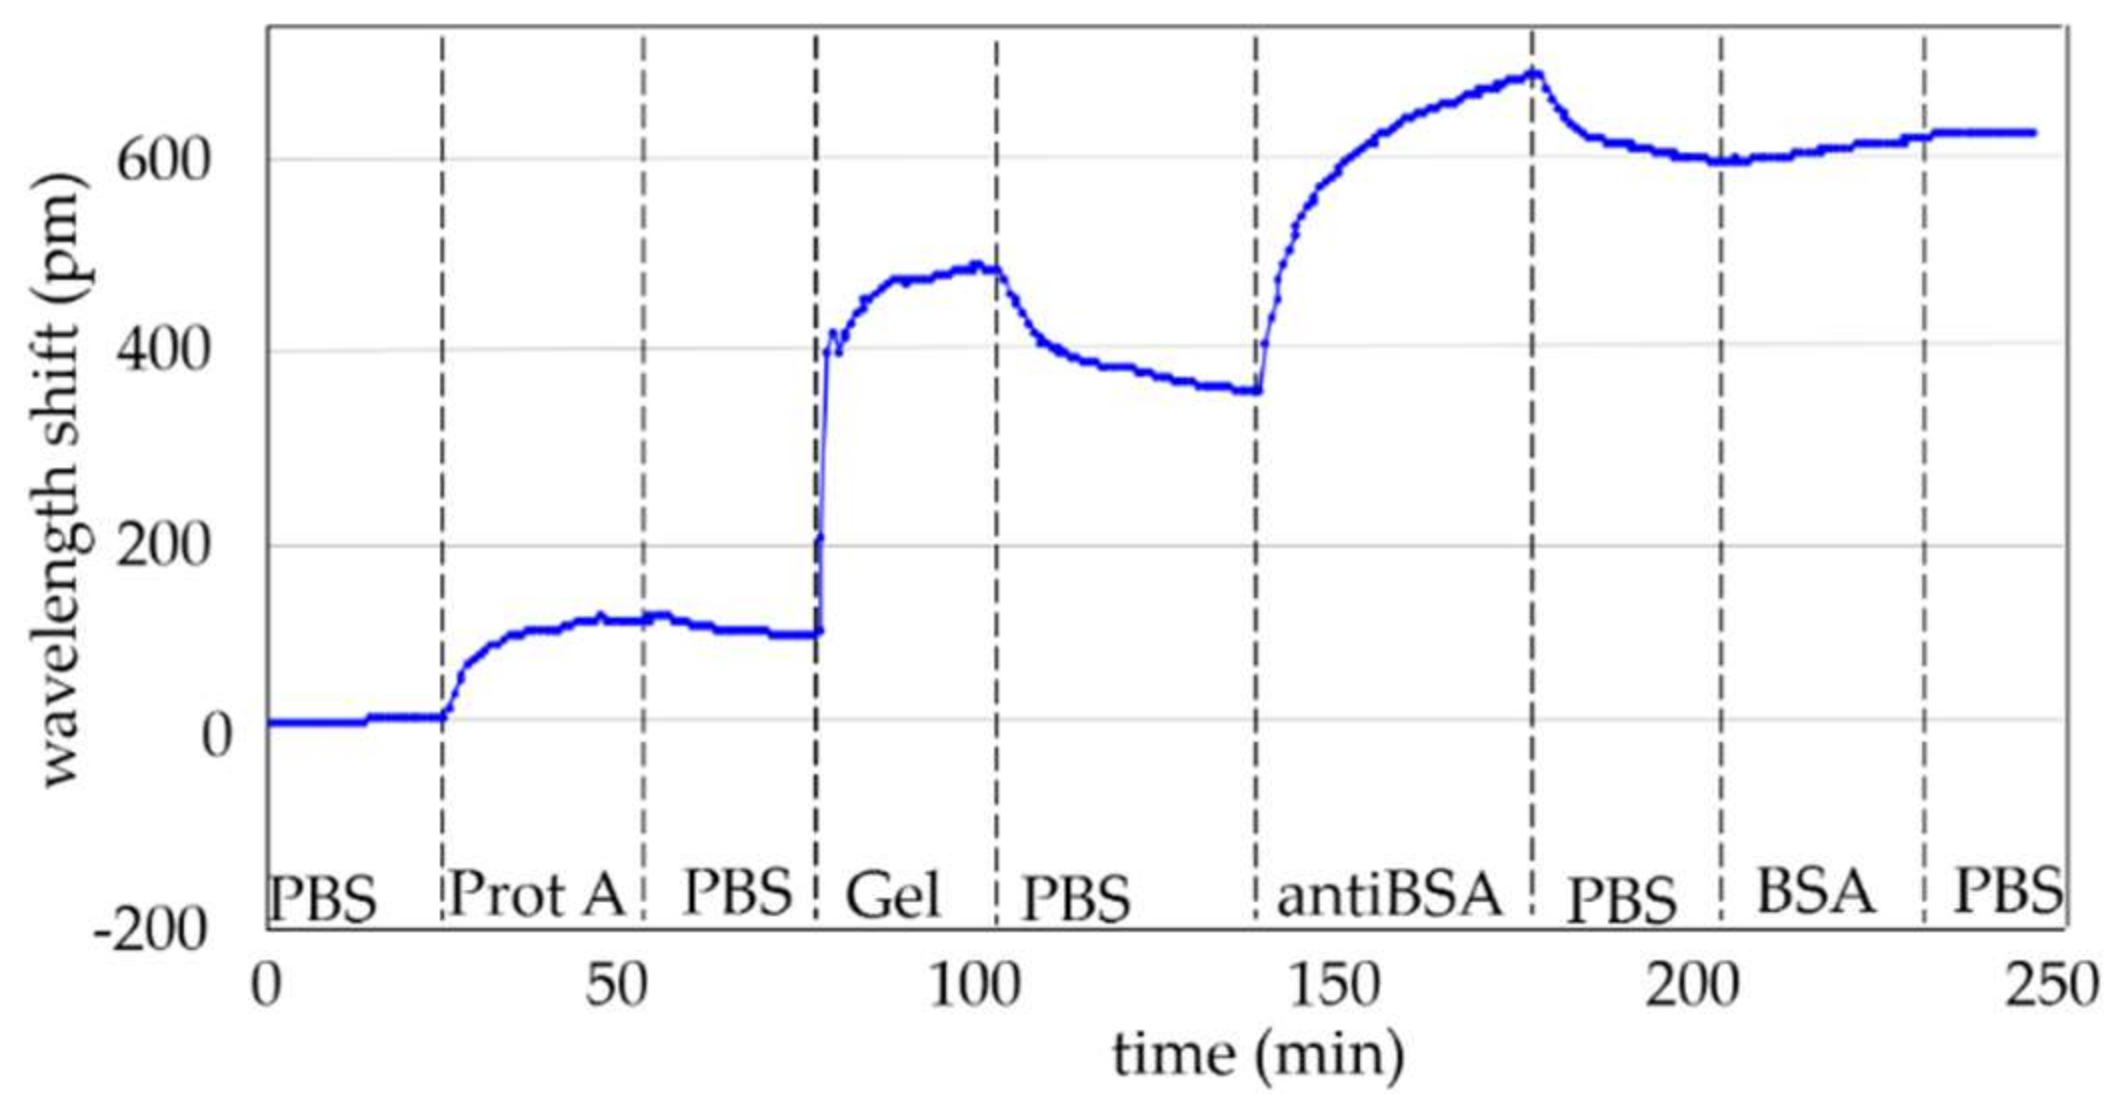
3.2. BSA Sensing with a Protein A Intermediate Layer
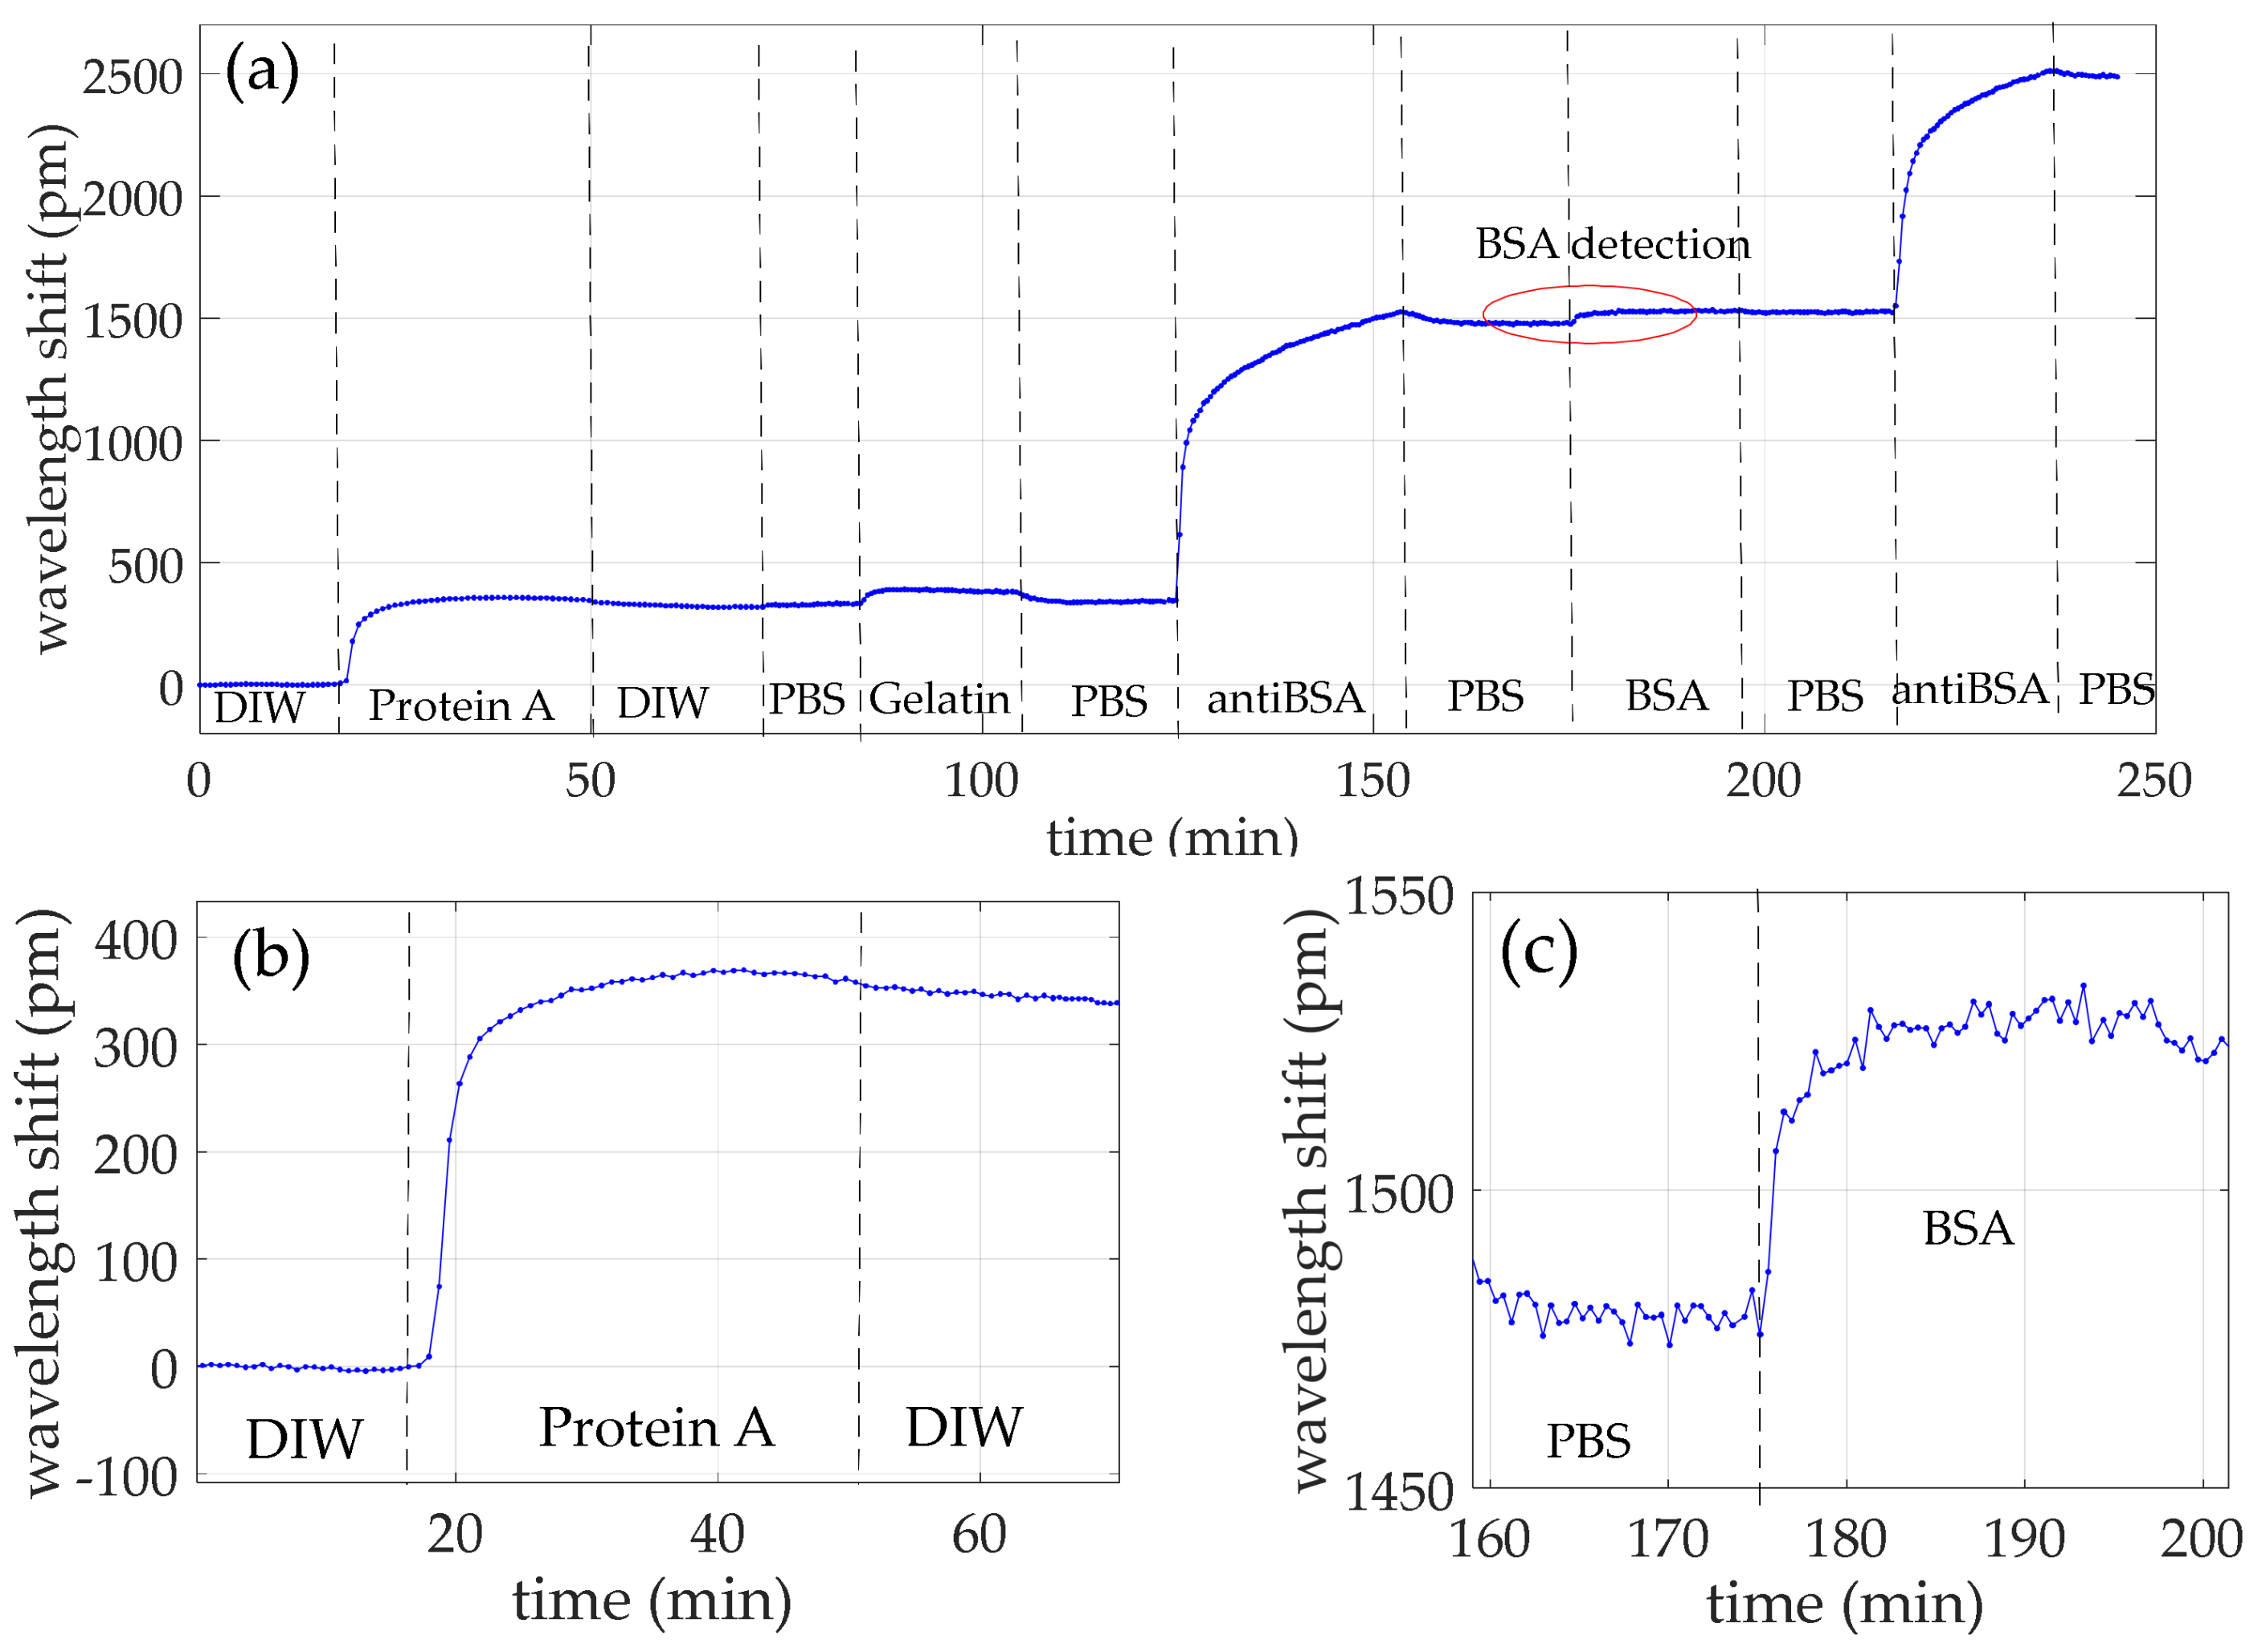
3.3. BSA Sensing with a Protein A Intermediate Layer under Several Regeneration Cycles
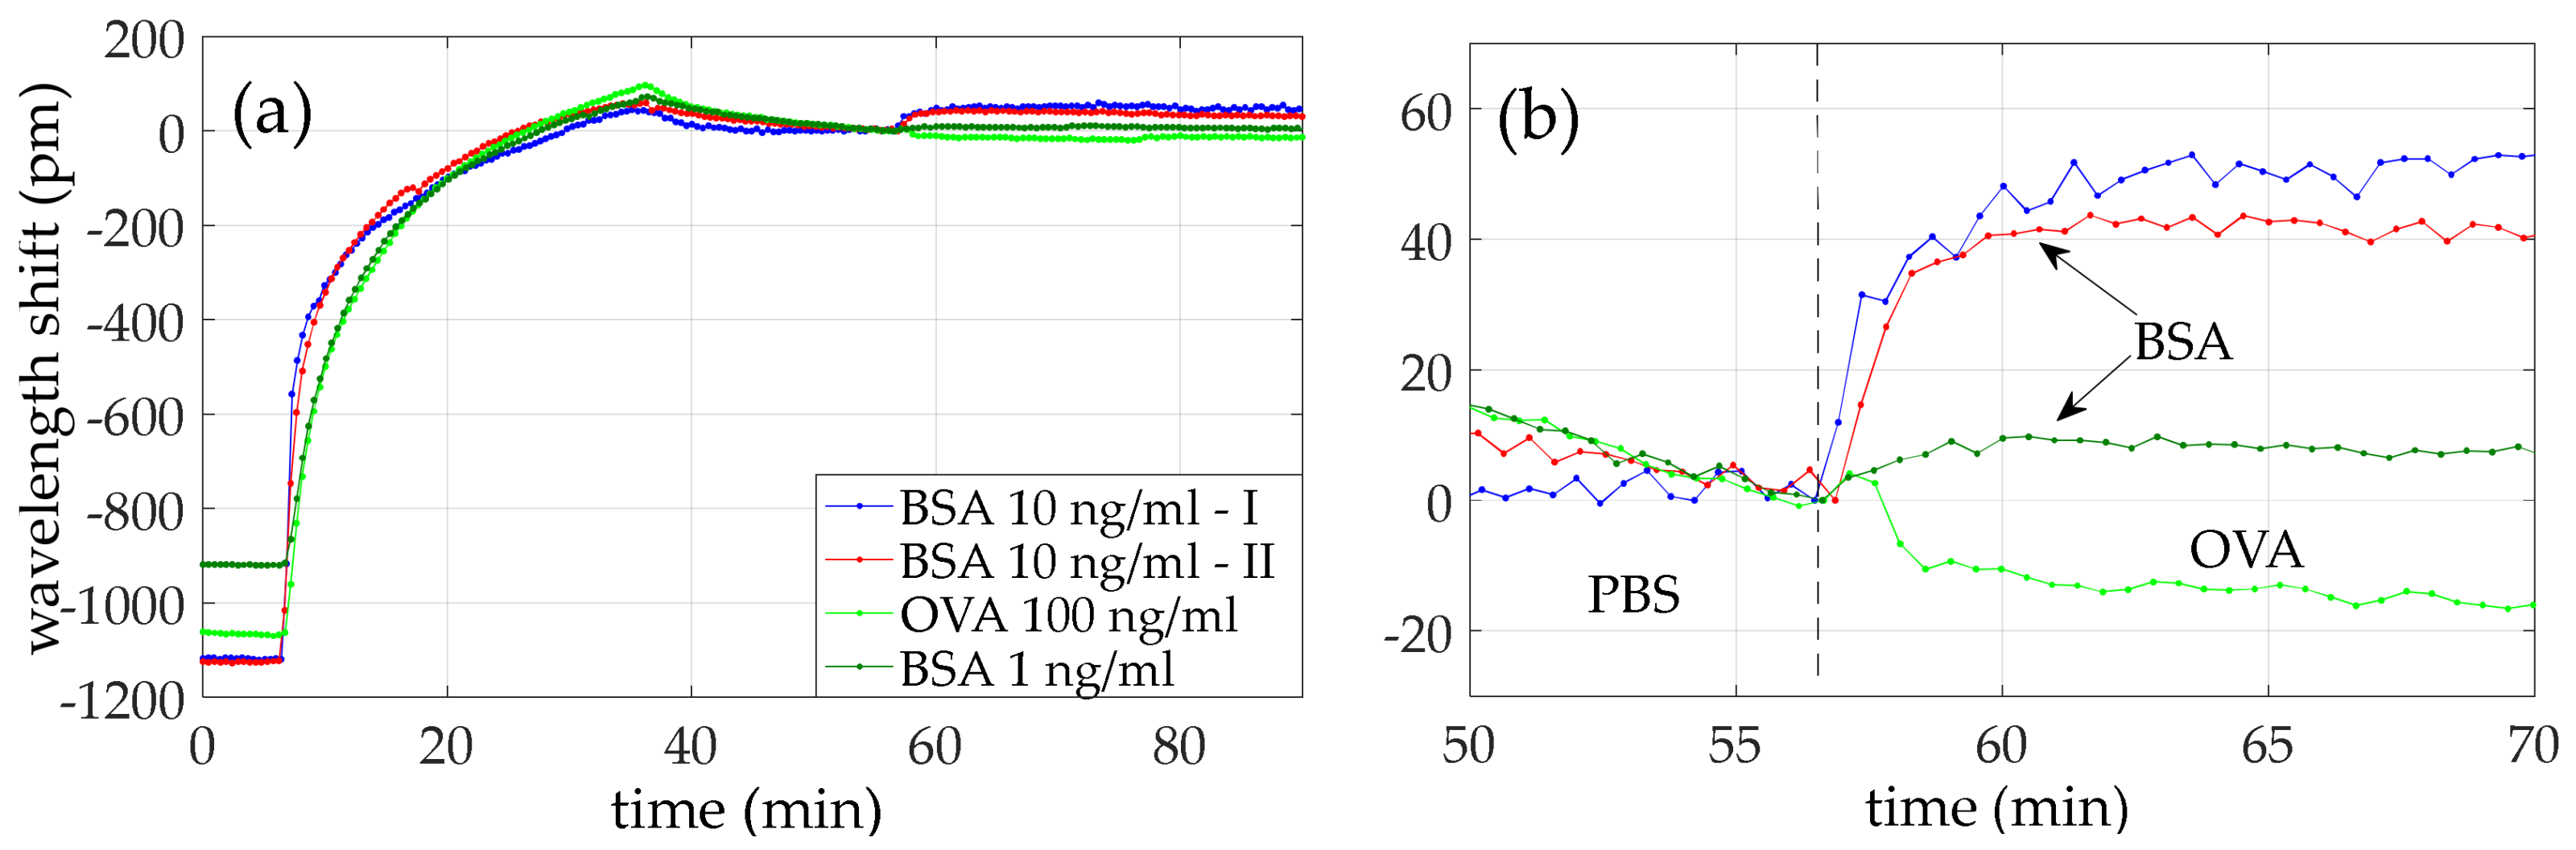
3.4. Specificity Test
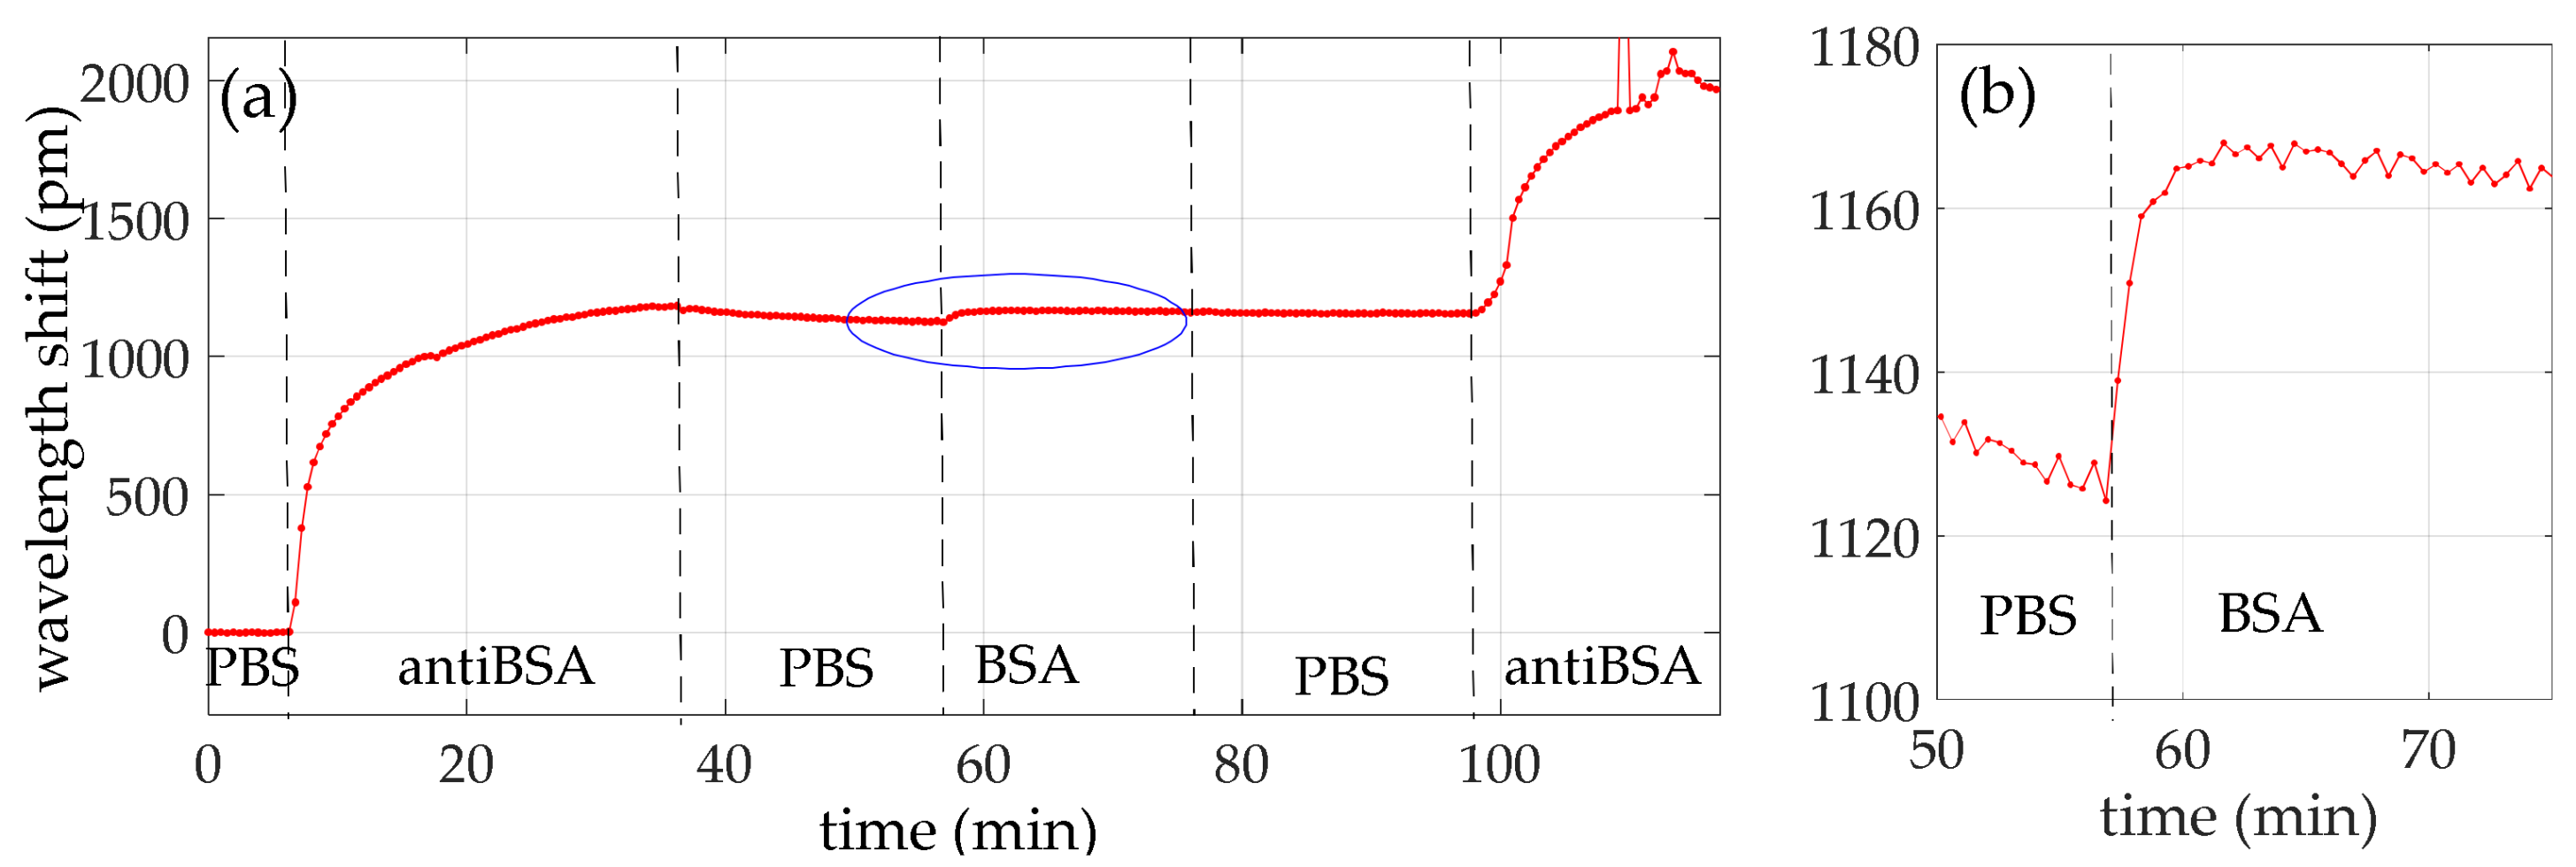
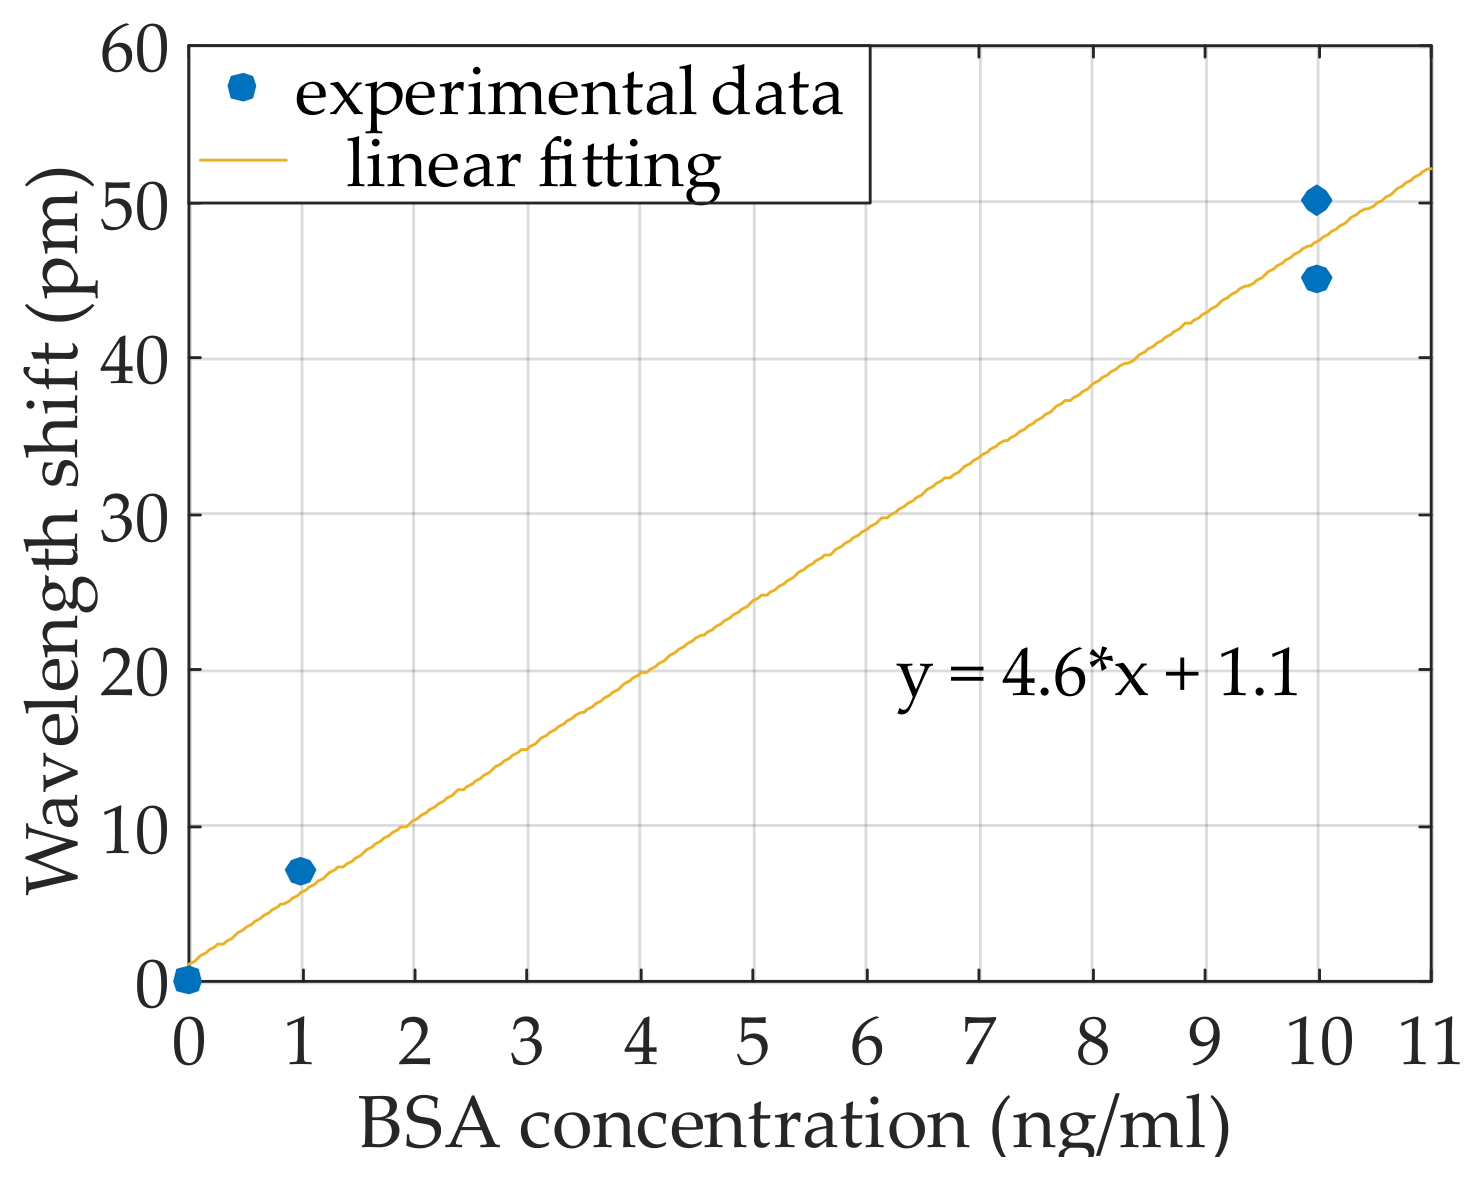
3.5. Experimental Limit of Detection of BSA
3.6. Sensitivity for AntiBSA and AntiBSA Detection Limit
4. Discussion
5. Conclusions
Acknowledgments
Author Contributions
Conflicts of Interest
References
- Huertas, C.S.; Fariña, D.; Lechuga, L.M. Direct and Label-Free Quantification of Micro-RNA-181a at Attomolar Level in Complex Media Using a Nanophotonic Biosensor. ACS Sens. 2016, 1, 748–756. [Google Scholar] [CrossRef]
- Estevez, M.C.; Alvarez, M.; Lechuga, L.M. Integrated optical devices for lab-on-a-chip biosensing applications. Laser Photonics Rev. 2012, 6, 463–487. [Google Scholar] [CrossRef] [Green Version]
- Luchansky, M.S.; Bailey, R.C. High-Q optical sensors for chemical and biological analysis. Anal. Chem. 2012, 84, 793–821. [Google Scholar] [CrossRef] [PubMed]
- Qavi, A.J.; Kindt, J.T.; Gleeson, M.A.; Bailey, R.C. Anti-DNA: RNA antibodies and silicon photonic microring resonators: Increased sensitivity for multiplexed microRNA detection. Anal. Chem. 2011, 83, 5949–5956. [Google Scholar] [CrossRef] [PubMed]
- Šípová, H.; Zhang, S.; Dudley, A.M.; Galas, D.; Wang, K.; Homola, J. Surface plasmon resonance biosensor for rapid label-free detection of microribonucleic acid at subfemtomole level. Anal. Chem. 2010, 82, 10110–10115. [Google Scholar] [CrossRef] [PubMed]
- Fan, X.; White, I.M.; Shopova, S.I.; Zhu, H.; Suter, J.D.; Sun, Y. Sensitive optical biosensors for unlabeled targets: A review. Anal. Chim. Acta 2008, 620, 8–26. [Google Scholar] [CrossRef] [PubMed]
- García-Rupérez, J.; Toccafondo, V.; Bañuls, M.J.; Castelló, J.G.; Griol, A.; Peransi-Llopis, S.; Maquieira, Á. Label-free antibody detection using band edge fringes in SOI planar photonic crystal waveguides in the slow-light regime. Opt. Express 2010, 18, 24276–24286. [Google Scholar] [CrossRef]
- Toccafondo, V.; García-Rupérez, J.; Bañuls, M.J.; Griol, A.; Castelló, J.G.; Peransi-Llopis, S.; Maquieira, A. Single-strand DNA detection using a planar photonic-crystal-waveguide-based sensor. Opt. Lett. 2010, 35, 3673–3675. [Google Scholar] [CrossRef] [PubMed]
- Passaro, V.M.N.; Troia, B.; La Notte, M.; Leonardis, F. De Photonic resonant microcavities for chemical and biochemical sensing. RSC Adv. 2013, 3, 25–44. [Google Scholar] [CrossRef]
- Scullion, M.G.; Krauss, T.F.; Di Falco, A. Slotted photonic crystal sensors. Sensors 2013, 13, 3675–3710. [Google Scholar] [CrossRef] [PubMed] [Green Version]
- Lee, M.R.; Fauchet, P.M. Two-dimensional silicon photonic crystal based biosensing platform for protein detection. Opt. Express 2007, 15, 4530. [Google Scholar] [CrossRef] [PubMed]
- Buswell, S.C.; Wright, V.A.; Buriak, J.M.; Van, V.; Evoy, S. Specific detection of proteins using photonic crystal waveguides. Opt. Express 2008, 16, 15949–15957. [Google Scholar] [CrossRef] [PubMed]
- Castello, J.G.; Toccafondo, V.; Perez-Millan, P.; Losilla, N.S.; Cruz, J.L.; Andres, M.V.; Garcia-Ruperez, J. Real-time and low-cost sensing technique based on photonic bandgap structures. Opt. Lett. 2011, 36, 2707–2709. [Google Scholar] [CrossRef] [PubMed]
- Patko, D.; Cottier, K.; Hamori, A.; Horvath, R. Single beam grating coupled interferometry: High resolution miniaturized label-free sensor for plate based parallel screening. Opt. Express 2012, 20, 23162–23173. [Google Scholar] [CrossRef] [PubMed]
- Zanchetta, G.; Lanfranco, R.; Giavazzi, F.; Bellini, T.; Buscaglia, M. Emerging applications of label-free optical biosensors. Nanophotonics 2017, 6, 627–645. [Google Scholar] [CrossRef]
- Gavela, A.F.; García, D.G.; Ramirez, J.C.; Lechuga, L.M. Last advances in silicon-based optical biosensors. Sensors 2016, 16, 285. [Google Scholar] [CrossRef] [PubMed]
- Hunt, H.K.; Armani, A.M. Label-free biological and chemical sensors. Nanoscale 2010, 2, 1544. [Google Scholar] [CrossRef] [PubMed]
- Vollmer, F.; Yang, L.; Fainman, S. Label-free detection with high-Q microcavities: A review of biosensing mechanisms for integrated devices. Nanophotonics 2012, 1, 267–291. [Google Scholar] [CrossRef] [PubMed]
- Peter, B.; Farkas, E.; Forgacs, E.; Saftics, A.; Kovacs, B.; Kurunczi, S.; Szekacs, I.; Csampai, A.; Bosze, S.; Horvath, R. Green tea polyphenol tailors cell adhesivity of RGD displaying surfaces: Multicomponent models monitored optically. Sci. Rep. 2017, 7, 42220. [Google Scholar] [CrossRef] [PubMed]
- Escorihuela, J.; Bañuls, M.J.; Castelló, J.G.; Toccafondo, V.; García-Rupérez, J.; Puchades, R.; Maquieira, Á. Chemical silicon surface modification and bioreceptor attachment to develop competitive integrated photonic biosensors. Anal. Bioanal. Chem. 2012, 404, 2831–2840. [Google Scholar] [CrossRef] [PubMed]
- Rusmini, F.; Zhong, Z.; Feijen, J. Protein immobilization strategies for protein biochips. Biomacromolecules 2007, 8, 1775–1789. [Google Scholar] [CrossRef] [PubMed]
- Bañuls, M.J.; Puchades, R.; Maquieira, Á. Chemical surface modifications for the development of silicon-based label-free integrated optical (IO) biosensors: A review. Anal. Chim. Acta 2013, 777, 1–16. [Google Scholar] [CrossRef] [PubMed]
- Jonkheijm, P.; Weinrich, D.; Schröder, H.; Niemeyer, C.M.; Waldmann, H. Chemical strategies for generating protein biochips. Angew. Chem. Int. Ed. 2008, 47, 9618–9647. [Google Scholar] [CrossRef] [PubMed]
- Zourob, M.; Lakhtakia, A. Optical Guided-Wave Chemical and Biosensors II; Springer: Berlin, Germany, 2010; p. 270. ISBN 978364202826. [Google Scholar]
- Anderson, G.P.; Jacoby, M.A.; Ligler, F.S.; King, K.D. Effectiveness of protein A for antibody immobilization for a fiber optic biosensor. Biosens. Bioelectron. 1997, 12, 329–336. [Google Scholar] [CrossRef]
- Wang, Z.; Jin, G. Feasibility of protein A for the oriented immobilization of immunoglobulin on silicon surface for a biosensor with imaging ellipsometry. J. Biochem. Biophys. Methods 2003, 57, 203–211. [Google Scholar] [CrossRef]
- Meyer, V.K.; Kober, C.; Niessner, R.; Seidel, M. Regeneration of recombinant antigen microarrays for the automated monitoring of antibodies against zoonotic pathogens in swine sera. Sensors 2015, 15, 2614–2628. [Google Scholar] [CrossRef] [PubMed]
- Julián, E.; Cama, M.; Martínez, P.; Luquin, M. An ELISA for five glycolipids from the cell wall of Mycobacterium tuberculosis: Tween 20 interference in the assay. J. Immunol. Methods 2001, 251, 21–30. [Google Scholar] [CrossRef]
- Lebogang, L.; Mattiasson, B.; Hedström, M. Capacitive sensing of microcystin variants of Microcystis aeruginosa using a gold immunoelectrode modified with antibodies, gold nanoparticles and polytyramine. Microchim. Acta 2014, 181, 1009–1017. [Google Scholar] [CrossRef]
- Ngo, T.N. Molecular Interactions in Bioseparations; Springer Science & Business Media: Boston, MA, USA, 2013; p. 100. ISBN 978-1489918741. [Google Scholar]
- Xu, D.-X.; Vachon, M.; Densmore, A.; Ma, R.; Delâge, A.; Janz, S.; Lapointe, J.; Li, Y.; Lopinski, G.; Zhang, D.; Liu, Q.Y.; Cheben, P.; Schmid, J.H. Label-free biosensor array based on silicon-on-insulator ring resonators addressed using a WDM approach. Opt. Lett. 2010, 35, 2771–2773. [Google Scholar] [CrossRef] [PubMed]
- De Vos, K.; Girones, J.; Claes, T.; De Koninck, Y.; Popelka, S.; Schacht, E.; Baets, R.; Bienstman, P. Multiplexed antibody detection with an array of silicon-on-insulator microring resonators. IEEE Photonics J. 2009, 1, 225–235. [Google Scholar] [CrossRef]
- Luchansky, M.S.; Washburn, A.L.; Martin, T.A.; Iqbal, M.; Gunn, L.C.; Bailey, R.C. Characterization of the evanescent field profile and bound mass sensitivity of a label-free silicon photonic microring resonator biosensing platform. Biosens. Bioelectron. 2010, 26, 1283–1291. [Google Scholar] [CrossRef] [PubMed]
- Taniguchi, T.; Hirowatari, A.; Ikeda, T.; Fukuyama, M.; Amemiya, Y.; Kuroda, A.; Yokoyama, S. Detection of antibody-antigen reaction by silicon nitride slot-ring biosensors using protein G. Opt. Commun. 2016, 365, 16–23. [Google Scholar] [CrossRef]
- Shang, J.; Cheng, F.; Dubey, M.; Kaplan, J.M.; Rawal, M.; Jiang, X.; Newburg, D.S.; Sullivan, P.A.; Andrade, R.B.; Ratner, D.M. An organophosphonate strategy for functionalizing silicon photonic biosensors. Langmuir 2012, 28, 3338–3344. [Google Scholar] [CrossRef] [PubMed]


| PBS | Prot A | PBS | Gel | PBS | AntiBSA | PBS | BSA | PBS |
|---|---|---|---|---|---|---|---|---|
| 20 | 35 | 20 | 25 | 40 | 40 | 20 | 20 | 10 |
| DIW | Prot A | DIW | PBS | Gel | PBS | AntiBSA | PBS | BSA | PBS | AntiBSA | PBS |
|---|---|---|---|---|---|---|---|---|---|---|---|
| 15 | 35 | 20 | 10 | 25 | 20 | 30 | 20 | 20 | 20 | 20 | 10 |
| PBS | AntiBSA | PBS | BSA | PBS | AntiBSA |
|---|---|---|---|---|---|
| 6 | 30 | 20 | 20 | 20 | 20 |
| PBS | AntiBSA | PBS | OVA | PBS |
|---|---|---|---|---|
| 6 | 30 | 20 | 20 | 14 |
| PBS | AntiBSA | PBS | BSA | PBS |
|---|---|---|---|---|
| 6 | 30 | 20 | 20 | 14 |
| Δλantibsa (pm) | SantiBSA (pm/ng/mm2) | σPBS (pm) | DLρ-antiBSA (pm/mm2) | DLantiBSA (ag) |
|---|---|---|---|---|
| 1120 | 930 | 1 | 1.07 | 60 |
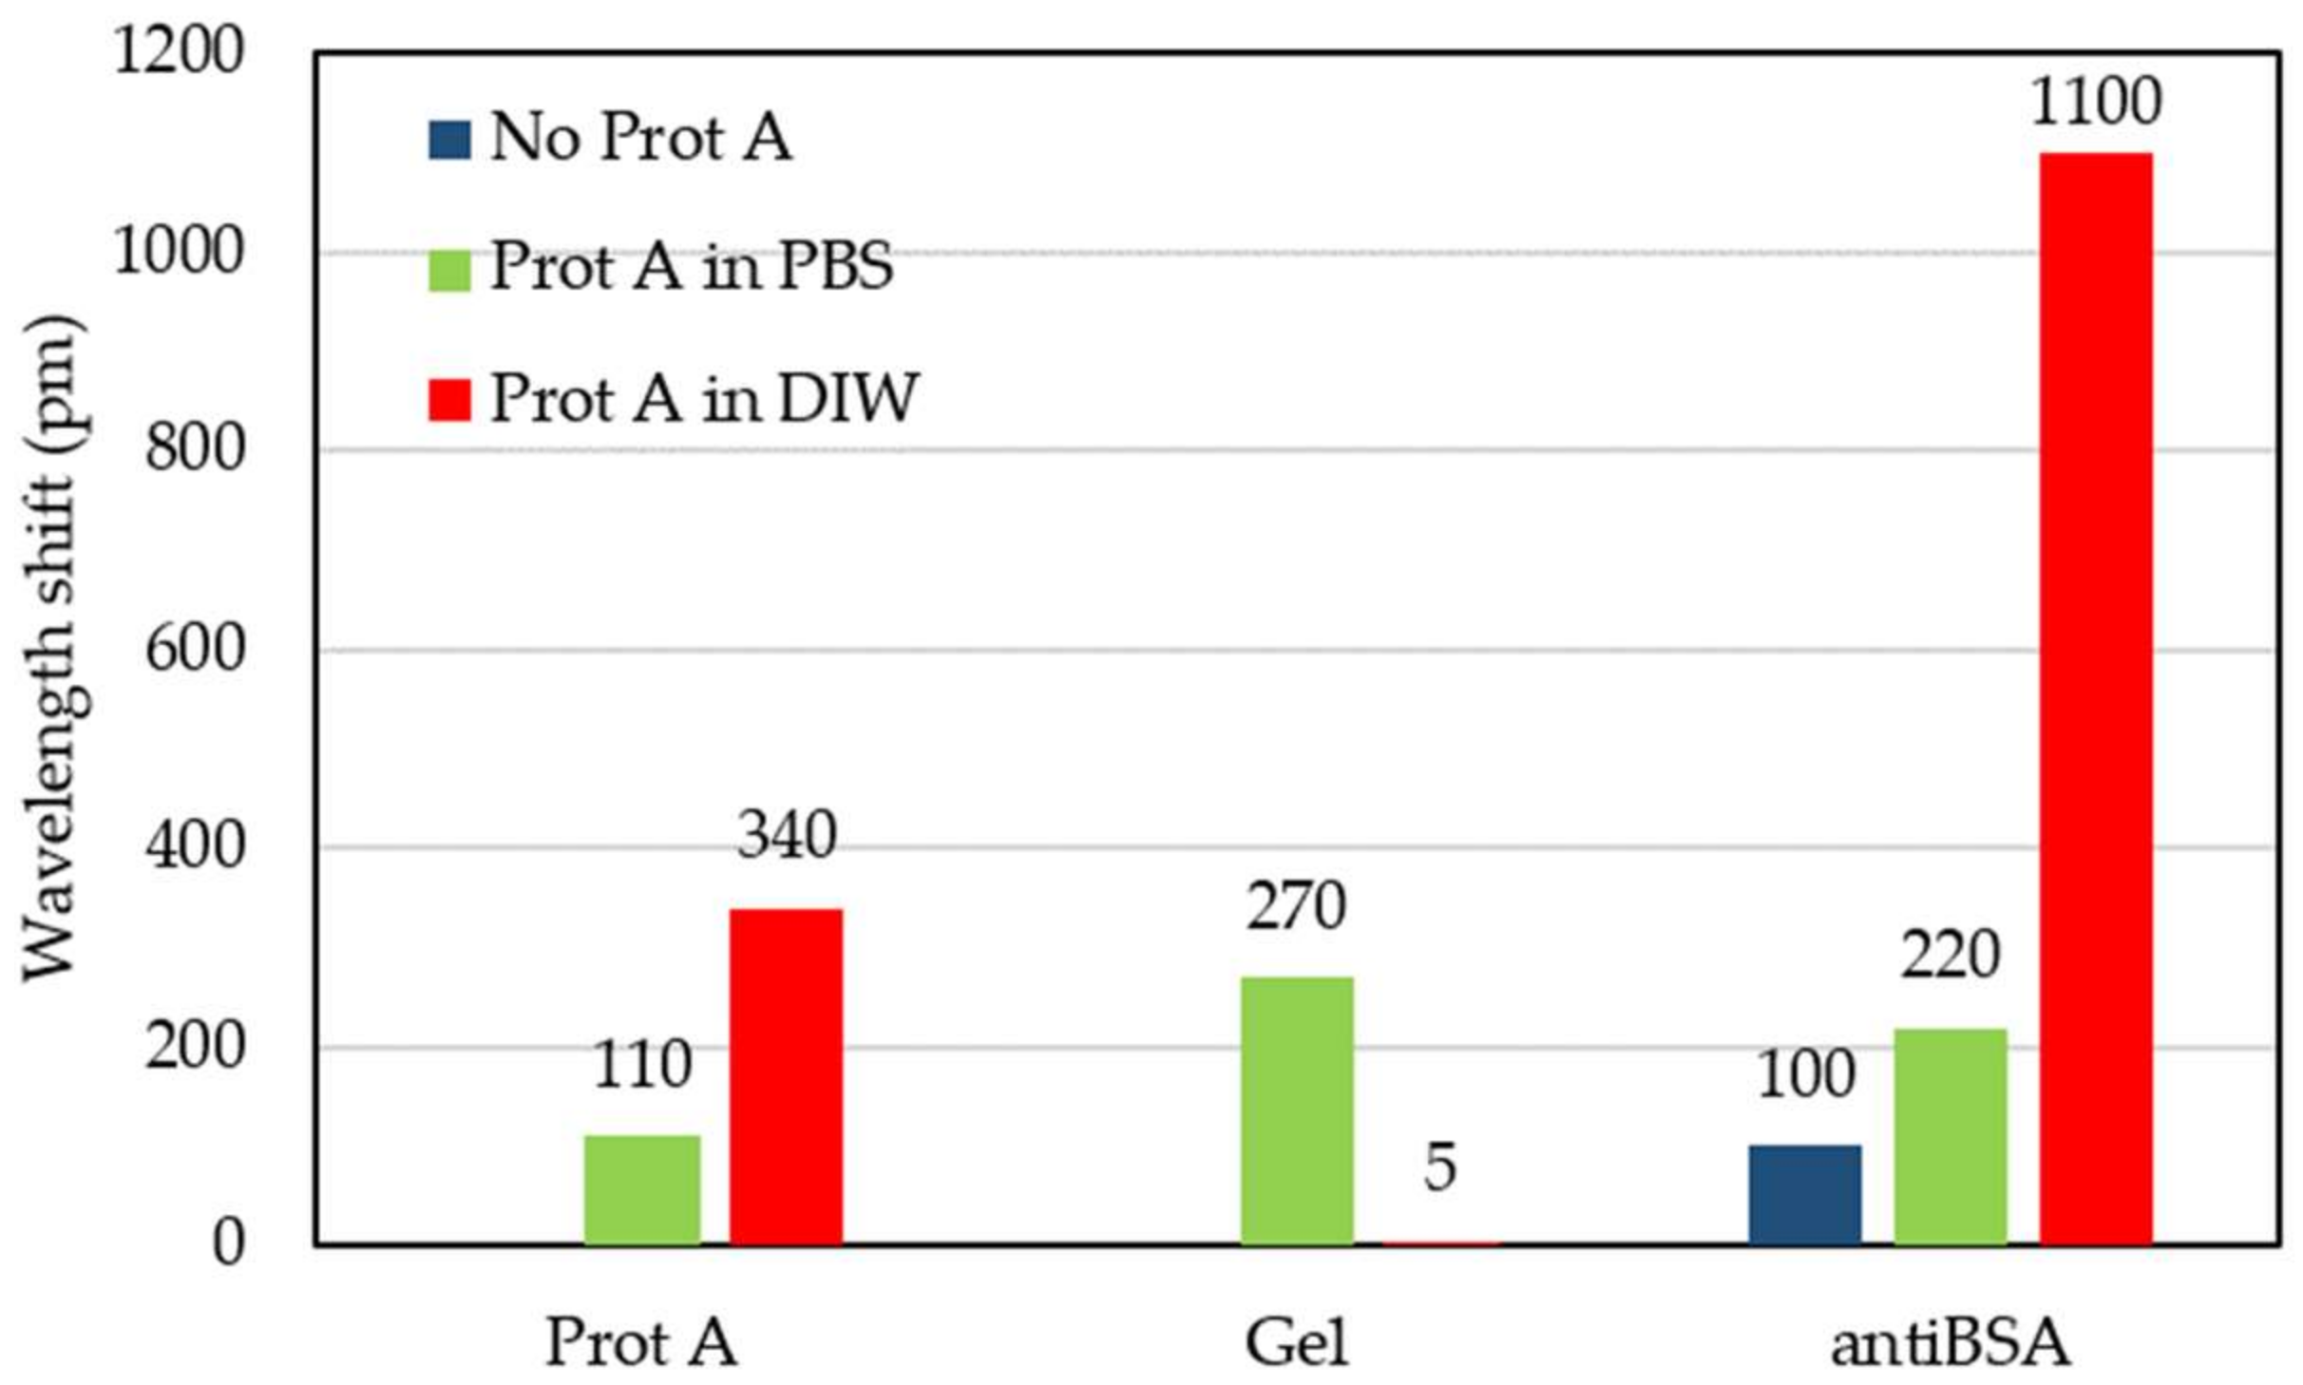
| Protocol | Wavelength Shift (pm) Due to: | ||
|---|---|---|---|
| Protein A | Gelatin | AntiBSA | |
| No protein A layer | Not flowed | Not flowed | 100 |
| Protein A in PBS | 110 | 270 | 220 |
| Protein A in DIW | 340 | 5 | 1100 |
© 2018 by the authors. Licensee MDPI, Basel, Switzerland. This article is an open access article distributed under the terms and conditions of the Creative Commons Attribution (CC BY) license (http://creativecommons.org/licenses/by/4.0/).
Share and Cite
Caroselli, R.; García Castelló, J.; Escorihuela, J.; Bañuls, M.J.; Maquieira, Á.; García-Rupérez, J. Experimental Study of the Oriented Immobilization of Antibodies on Photonic Sensing Structures by Using Protein A as an Intermediate Layer. Sensors 2018, 18, 1012. https://doi.org/10.3390/s18041012
Caroselli R, García Castelló J, Escorihuela J, Bañuls MJ, Maquieira Á, García-Rupérez J. Experimental Study of the Oriented Immobilization of Antibodies on Photonic Sensing Structures by Using Protein A as an Intermediate Layer. Sensors. 2018; 18(4):1012. https://doi.org/10.3390/s18041012
Chicago/Turabian StyleCaroselli, Raffaele, Javier García Castelló, Jorge Escorihuela, María José Bañuls, Ángel Maquieira, and Jaime García-Rupérez. 2018. "Experimental Study of the Oriented Immobilization of Antibodies on Photonic Sensing Structures by Using Protein A as an Intermediate Layer" Sensors 18, no. 4: 1012. https://doi.org/10.3390/s18041012