
Heating Homes with Servers: Workload Scheduling for Heat Reuse in Distributed Data Centers


.jpeg)
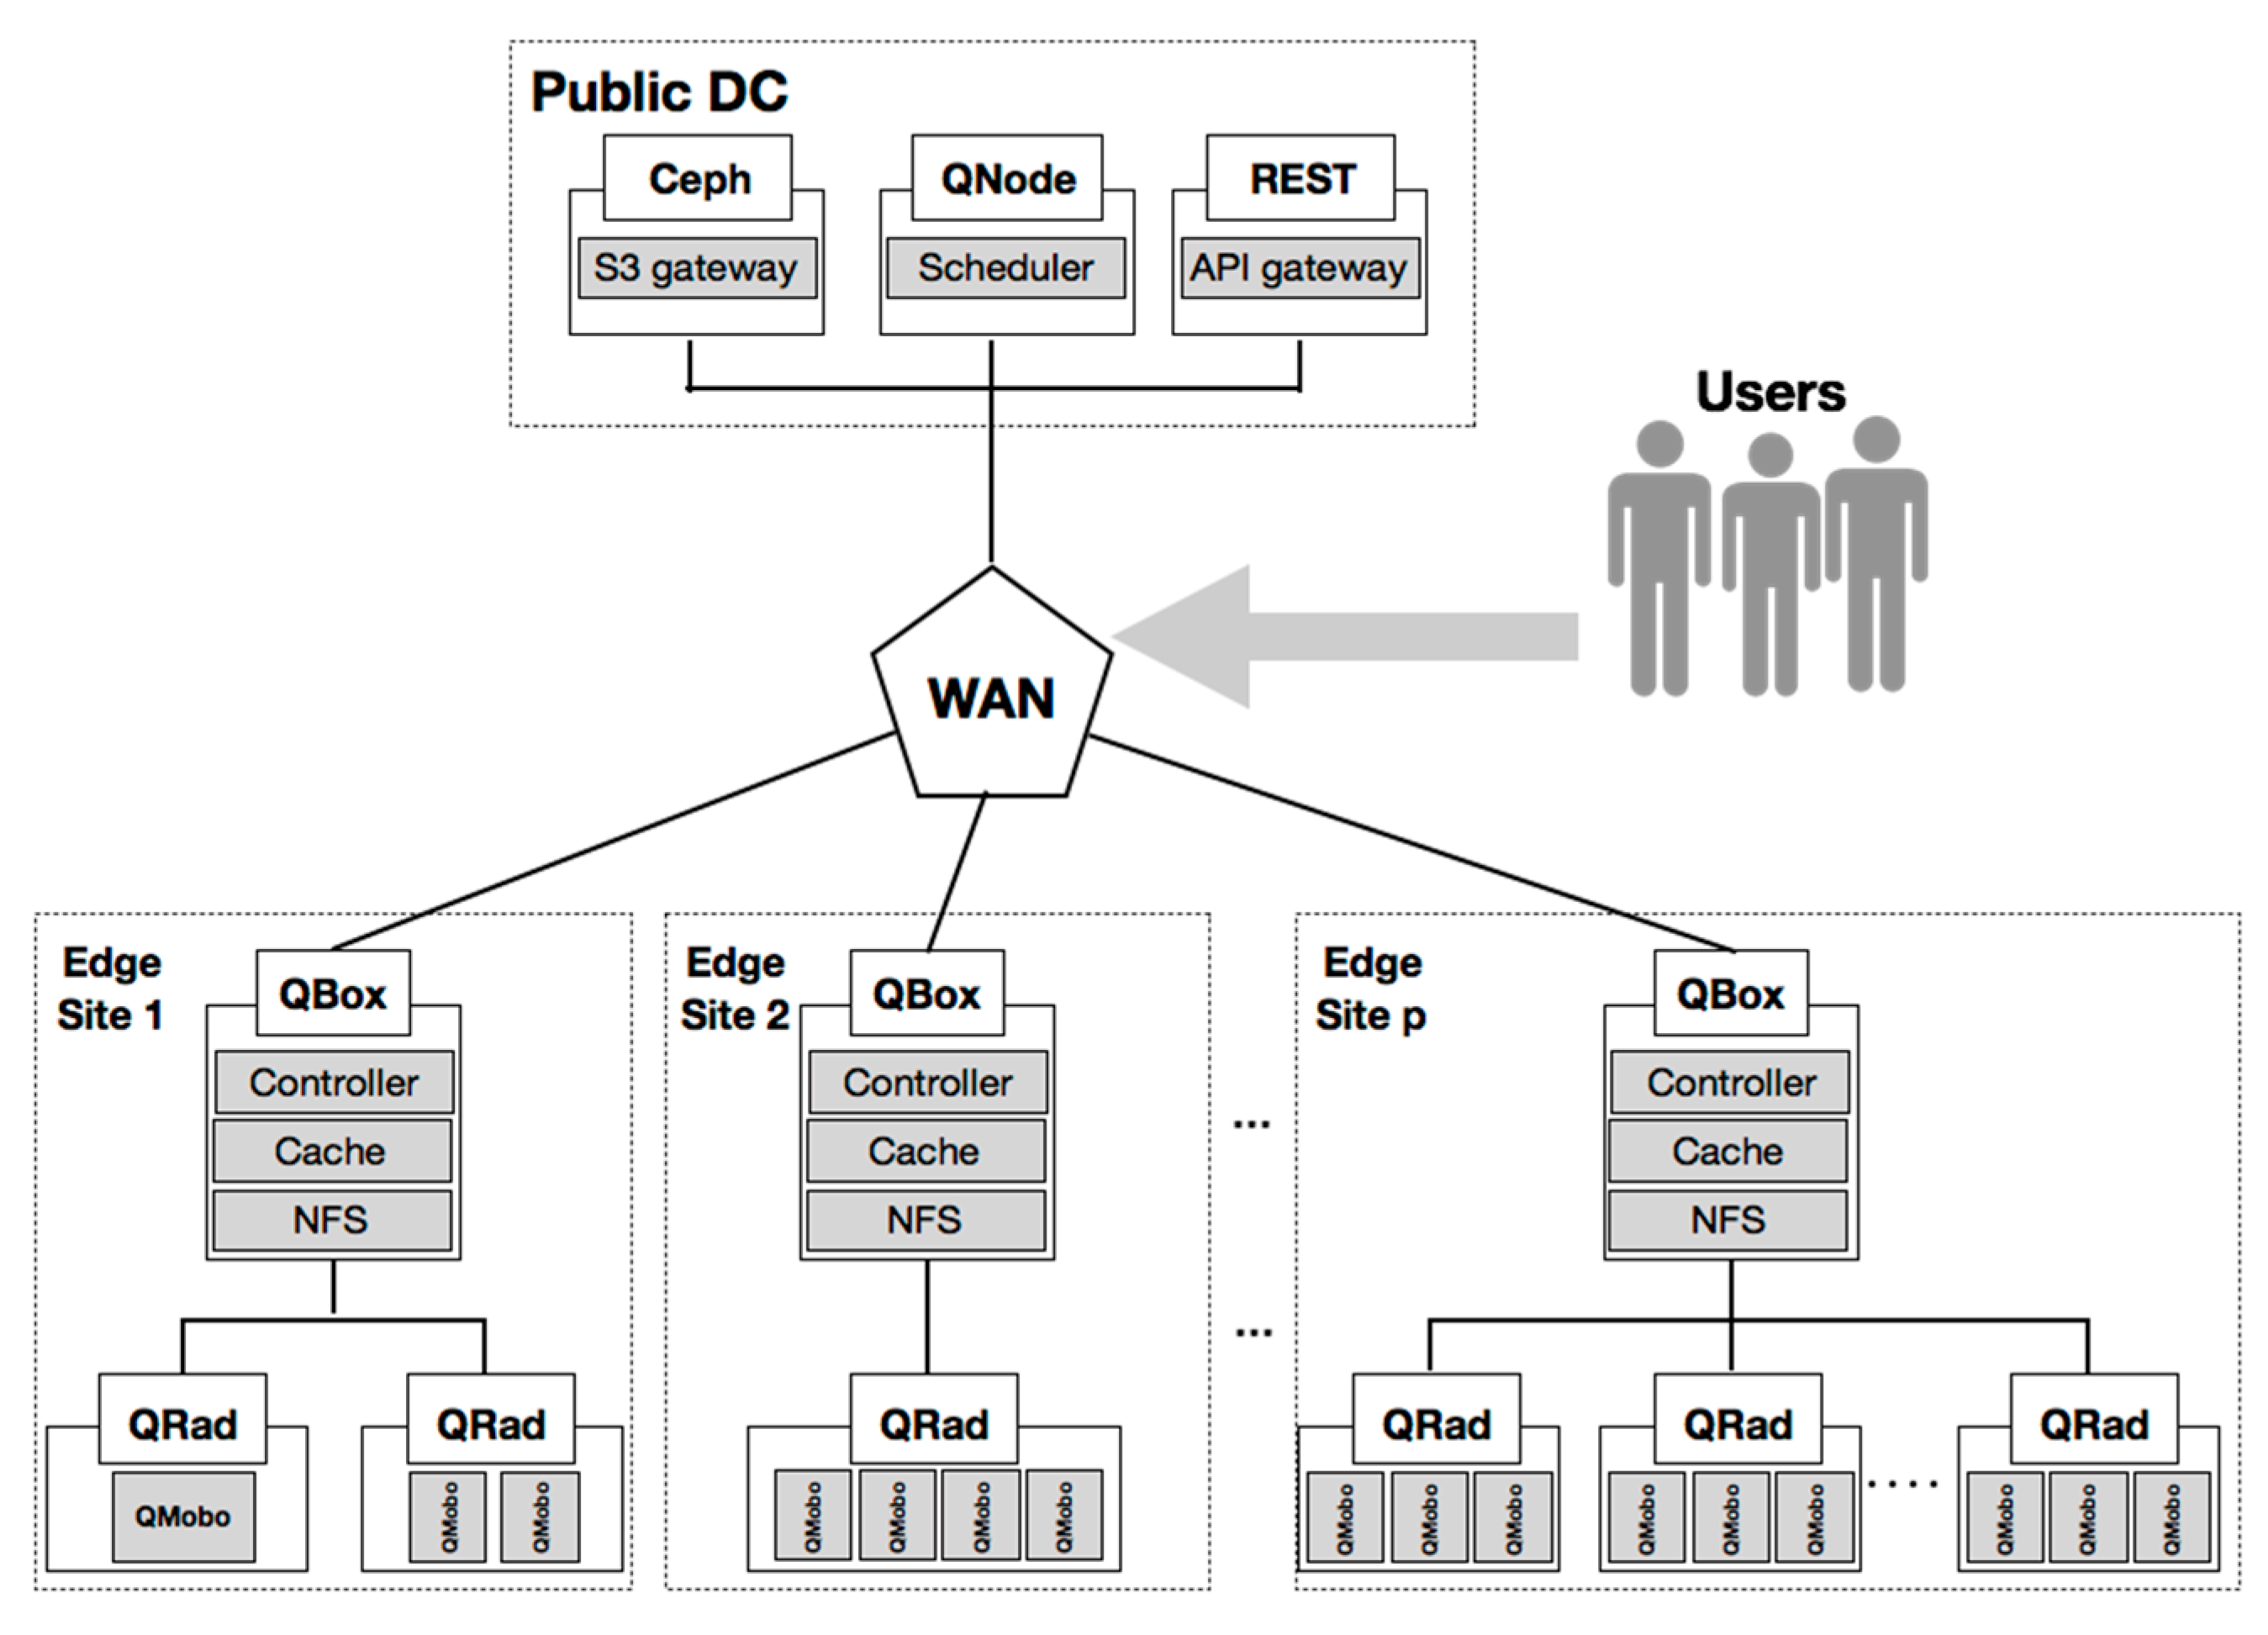
 ,
,
Abstract
:1. Introduction
- Definition of the thermal aware workload scheduling for the distributed DC case as a constraint satisfaction problem aiming to meet the workload service level agreements and at the same time meet the heat demand of the tenants.
- Definition of a thermodynamic model to accurately estimate the heat demand needed to be generated by the IT equipment and the workload to be allocated for execution to meet the temperature setpoint defined by the tenant.
- Development of a machine learning-based model for learning and correlating the heat demand with monitored data related to the actual temperature in the room, the temperature of the heat generated by the IT equipment, and temperature setpoint.
- The heat models and workload scheduling solution were tested and validated considering the characteristics and actual monitored data from an operational distributed DC, with the results being promising in terms of meeting the heat demand and heat model’s correlation accuracy.
2. Related Work
3. Thermal Aware Workload Scheduling
| Algorithm 1 Thermal aware workload scheduling |
| Input:, the number of distributed servers, the number of workload tasks, the temperatures in the rooms where the servers are distributed, the desired temperature in the rooms. Output: matrix keeping the tasks scheduling on servers Considering the following constraints for each server |
4. Heat Demand Estimation
4.1. Server Heat Transfer Model
4.2. Machine Learning-Based Model
5. Evaluation Results
6. Conclusions
Author Contributions
Funding
Institutional Review Board Statement
Informed Consent Statement
Data Availability Statement
Conflicts of Interest
References
- Pärssinen, M.; Wahlroos, M.; Manner, J.; Syri, S. Waste heat from data centers: An investment analysis. Sustain. Cities Soc. 2019, 44, 428–444. [Google Scholar] [CrossRef]
- Bashroush, R. Data Center Energy Use Goes Up and Up and Up, January 2020, Uptime Institute. Available online: https://journal.uptimeinstitute.com/data-center-energy-use-goes-up-and-up/ (accessed on 23 March 2021).
- Capozzoli, A.; Primiceri, G. Cooling Systems in Data Centers: State of Art and Emerging Technologies. Energy Procedia 2015, 83, 484–493. [Google Scholar] [CrossRef] [Green Version]
- Antal, M.; Cioara, T.; Anghel, I.; Pop, C.; Salomie, I. Transforming Data Centers in Active Thermal Energy Players in Nearby Neighborhoods. Sustainability 2018, 10, 939. [Google Scholar] [CrossRef] [Green Version]
- Antal, M.; Cioara, T.; Anghel, I.; Gorzenski, R.; Januszewski, R.; Oleksiak, A.; Piatek, W.; Pop, C.; Salomie, I.; Szeliga, W. Reuse of Data Center Waste Heat in Nearby Neighborhoods: A Neural Networks-Based Prediction Model. Energies 2019, 12, 814. [Google Scholar] [CrossRef] [Green Version]
- Wahlroos, M.; Pärssinen, M.; Rinne, S.; Syri, S.; Manner, J. Future views on waste heat utilization—Case of data centers in Northern Europe. Renew. Sustain. Energy Rev. 2018, 82 Pt 2, 1749–1764. [Google Scholar] [CrossRef]
- Nielsen, S.; Hansen, K.; Lund, R.; Moreno, D. Unconventional Excess Heat Sources for District Heating in a National Energy System Context. Energies 2020, 13, 5068. [Google Scholar] [CrossRef]
- Wahlroos, M.; Pärssinen, M.; Manner, J.; Syri, S. Utilizing data center waste heat in district heating—Impacts on energy efficiency and prospects for low-temperature district heating networks. Energy 2017, 140 Pt 1, 1228–1238. [Google Scholar] [CrossRef]
- Su, C.; Dalgren, J.; Palm, B. High-resolution mapping of the clean heat sources for district heating in Stockholm City. Energy Convers. Manag. 2021, 235, 113983. [Google Scholar] [CrossRef]
- Taking the Next Steps: Stockholm, the Circular City, DatacenterDynamics. April 2020. Available online: https://www.datacenterdynamics.com/en/analysis/taking-next-steps-stockholm-circular-city/ (accessed on 23 March 2021).
- Cho, J.; Park, B.; Jeong, Y. Thermal Performance Evaluation of a Data Center Cooling System under Fault Conditions. Energies 2019, 12, 2996. [Google Scholar] [CrossRef] [Green Version]
- Marcel, A.; Cristian, P.; Eugen, P.; Claudia, P.; Cioara, T.; Anghel, I.; Ioan, S. Thermal aware workload consolidation in cloud data centers. In Proceedings of the 2016 IEEE 12th International Conference on Intelligent Computer Communication and Processing (ICCP), Cluj-Napoca, Romania, 8–10 September 2016; pp. 377–384. [Google Scholar] [CrossRef]
- Cho, J.; Woo, J.; Park, B.; Lim, T. A Comparative CFD Study of Two Air Distribution Systems with Hot Aisle Containment in High-Density Data Centers. Energies 2020, 13, 6147. [Google Scholar] [CrossRef]
- Koronen, C.; Åhman, M.; Nilsson, L.J. Data centres in future European energy systems—Energy efficiency, integration and policy. Energy Effic. 2020, 13, 129–144. [Google Scholar] [CrossRef] [Green Version]
- Silva-Llanca, L.; del Valle, M.; Ortega, A.; Díaz, A.J. Cooling Effectiveness of a Data Center Room under Overhead Airflow via Entropy Generation Assessment in Transient Scenarios. Entropy 2019, 21, 98. [Google Scholar] [CrossRef] [Green Version]
- Antal, M.; Pop, C.; Cioara, T.; Anghel, I.; Salomie, I.; Pop, F. A system of systems approach for data centers optimization and integration into smart energy grids. Future Gener. Comput. Syst. 2020, 105, 948–963. [Google Scholar] [CrossRef]
- Oltmanns, J.; Sauerwein, D.; Dammel, F.; Stephan, P.; Kuhn, C. Potential for waste heat utilization of hot-water-cooled data centers: A case study. Energy Sci. Eng. 2020, 8, 1793–1810. [Google Scholar] [CrossRef]
- Swinhoe, D. Switch Datacenters to Heat Homes and Offices Using Residual Server Heat, Data Center Dynamics. 13 January 2021. Available online: https://www.datacenterdynamics.com/en/news/switch-datacenters-heat-homes-and-offices-using-residual-server-heat/ (accessed on 23 March 2021).
- Wheatcroft, E.; Wynn, H.; Lygnerud, K.; Bonvicini, G.; Leonte, D. The Role of Low Temperature Waste Heat Recovery in Achieving 2050 Goals: A Policy Positioning Paper. Energies 2020, 13, 2107. [Google Scholar] [CrossRef] [Green Version]
- Jirinec, J.; Rot, D. The Control System for Heating of Small Buildings with Heat Recovery unit and Heat Pump. In Proceedings of the 2020 21st International Scientific Conference on Electric Power Engineering (EPE), Prague, Czech Republic, 19–21 October 2020; pp. 1–4. [Google Scholar] [CrossRef]
- Härtel, P.; Ghosh, D. Modelling heat pump systems in low-carbon energy systems with significant cross-sectoral integration. IEEE Trans. Power Syst. 2020. [Google Scholar] [CrossRef]
- Wang, J.; Zhong, H.; Tan, C.W.; Chen, X.; Rajagopal, R.; Xia, Q.; Kang, C. Economic Benefits of Integrating Solar-Powered Heat Pumps into a CHP System. IEEE Trans. Sustain. Energy 2018, 9, 1702–1712. [Google Scholar] [CrossRef]
- Garofalo, E.; Bevione, M.; Cecchini, L.; Mattiussi, F.; Chiolerio, A. Waste Heat to Power: Technologies, Current Applications, and Future Potential. Energy Technol. 2020, 8, 2000413. [Google Scholar] [CrossRef]
- Ebrahimi, K.; Jones, G.F.; Fleischer, A.S. Thermo-economic analysis of steady state waste heat recovery in data centers using absorption refrigeration. Appl. Energy 2015, 139, 384–397. [Google Scholar] [CrossRef]
- Antal, M.; Cioara, T.; Anghel, I.; Pop, C.; Salomie, I.; Bertoncini, M.; Arnone, D. DC Thermal Energy Flexibility Model for Waste Heat Reuse in Nearby Neighborhoods. In Proceedings of the Eighth International Conference on Future Energy Systems (ACM e-Energy ’17), New York, NY, USA, 16–19 May 2017; pp. 278–283. [Google Scholar]
- Dayarathna, M.; Wen, Y.; Fan, R. Data Center Energy Consumption Modeling: A Survey. IEEE Commun. Surv. Tutor. 2016, 18, 732–794. [Google Scholar] [CrossRef]
- Matko, V.; Brezovec, B.; Milanovič, M. Intelligent Monitoring of Data Center Physical Infrastructure. Appl. Sci. 2019, 9, 4998. [Google Scholar] [CrossRef] [Green Version]
- Rastegarpour, S.; Caseri, L.; Ferrarini, L.; Gehrke, O. Experimental Validation of the Control-Oriented Model of Heat Pumps for MPC Applications. In Proceedings of the 2019 IEEE 15th International Conference on Automation Science and Engineering (CASE), Vancouver, BC, Canada, 22–26 August 2019; pp. 1249–1255. [Google Scholar] [CrossRef]
- Grishina, A.; Chinnici, M.; Kor, A.-L.; Rondeau, E.; Georges, J.-P. A Machine Learning Solution for Data Center Thermal Characteristics Analysis. Energies 2020, 13, 4378. [Google Scholar] [CrossRef]
- Durand-Estebe, B.; le Bot, C.; Mancos, J.N.; Arquis, E. Data center optimization using PID regulation in CFD simulations. Energy Build. 2013, 66, 154–164. [Google Scholar] [CrossRef]
- Kheirabadi, A.C.; Groulx, D. Cooling of server electronics: A design review of existing technology. Appl. Therm. Eng. 2016, 105, 622–638. [Google Scholar] [CrossRef]
- Li, Y.; Wang, X.; Luo, P.; Pan, Q. Thermal-Aware Hybrid Workload Management in a Green Datacenter towards Renewable Energy Utilization. Energies 2019, 12, 1494. [Google Scholar] [CrossRef] [Green Version]
- Daniels, S.J.; Rahat, A.A.M.; Everson, R.M.; Tabor, G.R.; Fieldsend, J.E. A Suite of Computationally Expensive Shape Optimisation Problems Using Computational Fluid Dynamics. In Parallel Problem Solving from Nature, Proceedings of the PPSN 2018: Parallel Problem Solving from Nature–PPSN XV, Coimbra, Portugal, 8–12 September 2018; Auger, A., Fonseca, C., Lourenço, N., Machado, P., Paquete, L., Whitley, D., Eds.; Lecture Notes in Computer Science; Springer: Cham, Switzerland, 2018; Volume 11102. [Google Scholar]
- Lye, K.O.; Mishra, S.; Ray, D. Deep learning observables in computational fluid dynamics. J. Comput. Phys. 2020, 410, 109339. [Google Scholar] [CrossRef] [Green Version]
- Jonas, M.; Gilbert, R.R.; Ferguson, J.; Varsamopoulos, G.; Gupta, S. A transient model for data center thermal prediction. In Proceedings of the 2012 International Green Computing Conference, IGCC 2012, San Jose, CA, USA, 4–8 June 2012. [Google Scholar] [CrossRef]
- Berezovskaya, Y.; Yang, C.; Mousavi, A.; Vyatkin, V.; Minde, T.B. Modular Model of a Data Centre as a Tool for Improving Its Energy Efficiency. IEEE Access 2020, 8, 46559–46573. [Google Scholar] [CrossRef]
- Wang, F.; Huang, Y.; Prasetyo, B. Energy-Efficient Improvement Approaches through Numerical Simulation and Field Measurement for a Data Center. Energies 2019, 12, 2757. [Google Scholar] [CrossRef] [Green Version]
- Sánchez, C.; Bloch, L.; Holweger, J.; Ballif, C.; Wyrsch, N. Optimised Heat Pump Management for Increasing Photovoltaic Penetration into the Electricity Grid. Energies 2019, 12, 1571. [Google Scholar] [CrossRef] [Green Version]
- Li, L.; Liang, C.; Liu, J.; Nath, S.; Terzis, A.; Faloutsos, C. ThermoCast: A cyber-physical forecasting model for data centers. In Proceedings of the ACM SIGKDD International Conference on Knowledge Discovery and Data Mining, San Diego, CA, USA, 21–24 August 2011; pp. 1370–1378. [Google Scholar] [CrossRef]
- Kumar, V.A. Real Time Temperature Prediction in a Data Center Environment Using an Adaptive Algorithm. Master’s Thesis, The University of Texas at Arlington, Arlington, TX, USA, December 2013. [Google Scholar]
- Sharma, M.; Garg, R. An artificial neural network based approach for energy efficient task scheduling in cloud data centers. Sustain. Comput. Inform. Syst. 2020, 26, 100373. [Google Scholar] [CrossRef]
- Sasakura, K.; Aoki, T.; Komatsu, M.; Watanabe, T. Rack Temperature Prediction Model Using Machine Learning after Stopping Computer Room Air Conditioner in Server Room. Energies 2020, 13, 4300. [Google Scholar] [CrossRef]
- Ilager, S.; Ramamohanarao, K.; Buyya, R. Thermal Prediction for Efficient Energy Management of Clouds Using Machine Learning. IEEE Trans. Parallel Distrib. Syst. 2021, 32, 1044–1056. [Google Scholar] [CrossRef]
- Zapater, M.; Risco-Martín, J.L.; Arroba, P.; Ayala, J.; Moya, J.; Hermida, R. Runtime Data Center Temperature Prediction using Grammatical Evolution Techniques. Appl. Soft Comput. 2016, 49, 94–107. [Google Scholar] [CrossRef]
- Brenner, P.; Go, D.B.; Buccellato, A.P.C. Data Center Heat Recovery Models and Validation: Insights from Environmentally Opportunistic Computing. In Proceedings of the ASHRAE Winter Conference Technical Program, Dallas, TX, USA, 26–30 January 2013. [Google Scholar]
- Wang, S.J.; Jin, C.Z. An extension of earley’s algorithm for extended grammars. In Computational Methods; Liu, G., Tan, V., Han, X., Eds.; Springer: Dordrecht, The Netherlands, 2006. [Google Scholar] [CrossRef]
- Akbari, A.; Khonsari, A.; Ghoreyshi, S.M. Thermal-Aware Virtual Machine Allocation for Heterogeneous Cloud Data Centers. Energies 2020, 13, 2880. [Google Scholar] [CrossRef]
- Chaudhry, M.T.; Ling, T.C.; Manzoor, A.; Hussain, S.A.; Kim, J. Thermal-Aware Scheduling in Green Data Centers. ACM Comput. Surv. 2015, 47, 1–48. [Google Scholar] [CrossRef]
- Cioara, T.; Antal, M.; Antal, C.D.; Anghel, I.; Bertoncini, M.; Arnone, D.; Lazzaro, M.; Mammina, M.; Velivassaki, T.-H.; Voulkidis, A.; et al. Data Centers Optimized Integration with Multi-Energy Grids: Test Cases and Results in Operational Environment. Sustainability 2020, 12, 9893. [Google Scholar] [CrossRef]
- Yao, J.; Guan, H.; Luo, J.; Rao, L.; Liu, X. Adaptive Power Management through Thermal Aware Workload Balancing in Internet Data Centers. IEEE Trans. Parallel Distrib. Syst. 2015, 26, 2400–2409. [Google Scholar] [CrossRef]
- Moore, J.; Chase, J.; Ranganathan, P.; Sharma, R. Making scheduling “cool”: Temperature-aware workload placement in data centers. In Proceedings of the Annual Conference on USENIX Annual Technical Conference (ATEC ’05), Anaheim, CA, USA, 10–15 April 2005. [Google Scholar]
- Singh, S.; Chana, I. A Survey on Resource Scheduling in Cloud Computing: Issues and Challenges. J. Grid Comput. 2016, 14, 217–264. [Google Scholar] [CrossRef]
- Yang, J.; Xiao, W.; Jiang, C.; Hossain, M.S.; Muhammad, G.; Amin, S.U. AI-Powered Green Cloud and Data Center. IEEE Access 2019, 7, 4195–4203. [Google Scholar] [CrossRef]
- Wang, L.; von Laszewski, G.; Huang, F.; Dayal, J.; Frulani, T.; Fox, G. Task scheduling with ANN-based temperature prediction in a data center: A simulation-based study. Eng. Comput. 2011, 27, 381–391. [Google Scholar] [CrossRef]
- Nejad, S.M.M.; Badawy, G.; Down, D.G. Holistic thermal-aware workload management and infrastructure control for heterogeneous data centers using machine learning. Future Gener. Comput. Syst. 2021, 118, 208–218. [Google Scholar]
- Van Damme, T.; de Persis, C.; Tesi, P. Optimized Thermal-Aware Job Scheduling and Control of Data Centers. IFAC-Pap. 2017, 50, 8244–8249. [Google Scholar] [CrossRef]
- Ni, J.; Jin, B.; Zhang, B.; Wang, X. Simulation of Thermal Distribution and Airflow for Efficient Energy Consumption in a Small Data Centers. Sustainability 2017, 9, 664. [Google Scholar] [CrossRef] [Green Version]
- Sun, H.; Stolf, P.; Pierson, J. Spatio-temporal thermal-aware scheduling for homogeneous high-performance computing datacenters. Future Gener. Comput. Syst. 2017, 71, 157–170. [Google Scholar] [CrossRef] [Green Version]
- Kumar, M.; Sharma, S.C. Dynamic load balancing algorithm for balancing the workload among virtual machine in cloud computing. Procedia Comput. Sci. 2017, 115, 322–329. [Google Scholar] [CrossRef]
- Zhou, J.; Yan, J.; Chen, J.; Wei, T. Peak Temperature Minimization via Task Allocation and Splitting for Heterogeneous MPSoC Real-Time Systems. J. Signal Process. Syst. 2016, 84, 111–121. [Google Scholar] [CrossRef]
- Anghel, I.; Cioara, T.; Salomie, I.; Copil, G.; Moldovan, D.; Pop, C. Dynamic frequency scaling algorithms for improving the CPU’s energy efficiency. In Proceedings of the 2011 IEEE 7th International Conference on Intelligent Computer Communication and Processing, Cluj-Napoca, Romania, 25–27 August 2011; pp. 485–491. [Google Scholar] [CrossRef]
- Liu, H.; Liu, B.; Yang, L.T.; Lin, M.; Deng, Y.; Bilal, K.; Khan, S.U. Thermal-Aware and DVFS-Enabled Big Data Task Scheduling for Data Centers. IEEE Trans. Big Data 2018, 4, 177–190. [Google Scholar] [CrossRef]
- Cioara, T.; Salomie, I.; Anghel, I.; Chira, I.; Cocian, A.; Henis, E.; Kat, R. A Dynamic Power Management Controller for Optimizing Servers’ Energy Consumption in Service Centers. In Service-Oriented Computing, Proceedings of the International Conference on Service-Oriented Computing ICSOC 2010, Stockholm, Sweden, 23–27 November 2010; Maximilien, E.M., Rossi, G., Yuan, S.T., Ludwig, H., Fantinato, M., Eds.; Lecture Notes in Computer Science; Springer: Berlin/Heidelberg, Germany, 2011; Volume 6568. [Google Scholar] [CrossRef] [Green Version]
- Li, X.; Xie, N.; Tian, X. Dynamic Voltage-Frequency and Workload Joint Scaling Power Management for Energy Harvesting Multi-Core WSN Node SoC. Sensors 2017, 17, 310. [Google Scholar] [CrossRef]
- Fang, Q.; Wang, J.; Zhu, H.; Gong, Q. Using Model Predictive Control in Data Centers for Dynamic Server Provisioning. IFAC Proc. Vol. 2014, 47, 9635–9642. [Google Scholar] [CrossRef] [Green Version]
- Wang, J.; Shen, T.; Zhao, J.; Ma, S.; Rao, W.; Zhang, Y. Data-driven thermal efficiency modeling and optimization for reheating furnace based on statistics analysis. In Proceedings of the 2015 34th Chinese Control Conference (CCC), Hangzhou, China, 28–30 July 2015; pp. 8271–8275. [Google Scholar] [CrossRef]
- Liu, J.; Goraczko, M.; James, S.; Belady, C.; Lu, J.; Whitehouse, K. The Data Furnace: Heating Up with Cloud Computing. In Proceedings of the 3rd USENIX Workshop on Hot Topics in Cloud Computing, Portland, OR, USA, 14–15 June 2011. [Google Scholar]
- Tang, Q.; Mukherjee, T.; Gupta, S.K.S.; Cayton, P. Sensor-based Fast Thermal Evaluation Model for Energy Efficient High-Performance Datacenters. In Proceedings of the Fourth International Conference on Intelligent Sensing and Information Processing, Bangalore, India, 15 October–18 December 2006; pp. 203–208. [Google Scholar]
- Zhang, S.; Xia, Y. Solving nonlinear optimization problems of real functions in complex variables by complex-valued iterative methods. IEEE Trans. Cybern. 2018, 48, 277–287. [Google Scholar] [CrossRef]
- Belotti, P.; Kirches, C.; Leyffer, S.; Linderoth, J.; Luedtke, J.; Mahajan, A. Mixed-integer nonlinear optimization. Acta Numer. 2013, 22, 1–131. [Google Scholar] [CrossRef] [Green Version]
- Ruder, S. An overview of gradient descent optimization algorithms. arXiv 2016, arXiv:1609.04747. [Google Scholar]
- Laabadi, S.; Naimi, M.; el Amri, H.; Boujemâa, A. The 0/1 Multidimensional Knapsack Problem and Its Variants: A Survey of Practical Models and Heuristic Approaches. Am. J. Oper. Res. 2018, 8, 395–439. [Google Scholar] [CrossRef] [Green Version]
- Pardey, Z.; Demetriou, D.; Erden, H.; Vangilder, J.; Khalifa, H.; Schmidt, R. Proposal for standard compact server model for transient data center simulations. ASHRAE Trans. 2015, 121, 413–421. [Google Scholar]
- Qarnot Datacenter. Available online: https://qarnot.com/ (accessed on 3 February 2021).
- SciPY Optimizer. Available online: https://docs.scipy.org/doc/scipy/reference/optimize.html (accessed on 29 January 2021).
- SciKit Learn. Available online: https://scikit-learn.org/stable/ (accessed on 29 January 2021).
- Keras. Available online: https://keras.io/ (accessed on 1 February 2021).
- Tensorflow. Available online: https://www.tensorflow.org/ (accessed on 1 February 2021).
- XGBoost. Available online: https://xgboost.readthedocs.io/en/latest/ (accessed on 1 February 2021).
- Heating Blog. Available online: https://www.electricpoint.com/heating/electric-heating/how-to-calculate-kw-required-to-heat-a-room (accessed on 14 April 2021).
- Intel® Core™ i7-6950X Study. Available online: https://www.anandtech.com/show/10337/the-intel-broadwell-e-review-core-i7-6950x-6900k-6850k-and-6800k-tested-up-to-10-cores/10 (accessed on 23 March 2021).


| Parameter | Description | Parameter Type |
|---|---|---|
| Air specific heat capacity, defined as a physical constant for air property dependent on temperature | Constant | |
| Server heat capacity, defined as a physical property of the server, intrinsic to the system | Experimentally determined | |
| Airflow of air pumped by the cooling system over the servers, measured in , the intrinsic parameter of the system. | Measured during cooling system operation | |
| Server thermal efficiency, defined by Equation (22), considered an intrinsic parameter of the system | Experimentally determined | |
| Room temperature measured by sensors during system operation | Measured | |
| Server temperature measured by sensors, directly influencing the room temperature | Measured | |
| Server power demand due to workload execution | The output of the model |
| Model Type | Model Description |
|---|---|
| Linear Regression | The basic linear regressor was used to determine the baseline for prediction accuracy |
| Polynomial Regression | A second-degree polynomial regressor. Multiple degrees were considered, but the validation score began to drop after the degree was set to 2. |
| Gradient Boosted Regression | 90 estimators with a maximum depth of 4. The samples had a minimum split of 5 and the learning rate was 0.1. The loss was computed using the least-squares method. |
| Random Forest Regression | 9 estimators with a maximum depth of 4 are defined. |
| Support Vector Regression | A support vector regressor with kernel type of radial basis function and parameters: |
| K Neighbors Regression | The K-Nearest Neighbors Regression with 2 neighbors and uniform weights. |
| Deep Learning Regression | Multi-Layer Perceptron having one input layer, two hidden layers of 128 and 256 neurons, and one output layer. The activation function for the hidden layers is of type Rectified Linear Units (ReLU), and 500 epochs were used for training. The loss function was the mean squared error and the optimizer ADAM. Early stopping was employed with the patience of 50 epochs and a minimum validation loss as the monitor. |
| Server | MAPE | RMSPE | RMSE |
|---|---|---|---|
| QRad Heater | 11.98 | 14.28 | 20.15 |
| Model | RMSE | R2 | Error Mean | Error Standard Deviation | RMSPE | MAPE |
|---|---|---|---|---|---|---|
| Linear Regressor | 14.4 | 0.89 | −0.66 | 14.04 | 8.62 | 13.36 |
| Polynomial Regression | 33.12 | 0.39 | 2.05 | 29.19 | 23.38 | 13.65 |
| Random Forest Regressor | 10.04 | 0.92 | −2.06 | 9.55 | 7.6 | 5.06 |
| Gradient Boosting Regressor | 10.65 | 0.94 | −1.12 | 10.32 | 7.14 | 4.74 |
| Support Vector Regression | 16.28 | 0.85 | 2.33 | 15.02 | 9.71 | 6.89 |
| K Neighbors Regressor | 13.7 | 0.84 | 1.09 | 12.85 | 10.54 | 6.27 |
| Multi-Layer Perceptron Deep Neural Network | 33.09 | 1 | 1.92 | 24.54 | 20.62 | 17.29 |
| Number of Exterior Walls | Thermal Insulation | Number of QRad Heaters | |||
|---|---|---|---|---|---|
| 30 | 1 | Yes | 51 | 1838 | 4 |
| 1 | No | 55 | 1991 | 4 | |
| 2 | Yes | 55 | 1991 | 4 | |
| 2 | No | 60 | 2144 | 4 | |
| 35 | 1 | Yes | 51 | 2100 | 4 |
| 1 | No | 55 | 2275 | 4 | |
| 2 | Yes | 55 | 2275 | 4 | |
| 2 | No | 60 | 2450 | 5 | |
| 50 | 1 | Yes | 51 | 3000 | 6 |
| 1 | No | 55 | 3250 | 6 | |
| 2 | Yes | 55 | 3250 | 6 | |
| 2 | No | 60 | 3500 | 7 |
Publisher’s Note: MDPI stays neutral with regard to jurisdictional claims in published maps and institutional affiliations. |
© 2021 by the authors. Licensee MDPI, Basel, Switzerland. This article is an open access article distributed under the terms and conditions of the Creative Commons Attribution (CC BY) license (https://creativecommons.org/licenses/by/4.0/).
Share and Cite
Antal, M.; Cristea, A.-A.; Pădurean, V.-A.; Cioara, T.; Anghel, I.; Antal, C.; Salomie, I.; Saintherant, N. Heating Homes with Servers: Workload Scheduling for Heat Reuse in Distributed Data Centers. Sensors 2021, 21, 2879. https://doi.org/10.3390/s21082879
Antal M, Cristea A-A, Pădurean V-A, Cioara T, Anghel I, Antal C, Salomie I, Saintherant N. Heating Homes with Servers: Workload Scheduling for Heat Reuse in Distributed Data Centers. Sensors. 2021; 21(8):2879. https://doi.org/10.3390/s21082879
Chicago/Turabian StyleAntal, Marcel, Andrei-Alexandru Cristea, Victor-Alexandru Pădurean, Tudor Cioara, Ionut Anghel, Claudia Antal (Pop), Ioan Salomie, and Nicolas Saintherant. 2021. "Heating Homes with Servers: Workload Scheduling for Heat Reuse in Distributed Data Centers" Sensors 21, no. 8: 2879. https://doi.org/10.3390/s21082879