
An Aggregated Mutual Information Based Feature Selection with Machine Learning Methods for Enhancing IoT Botnet Attack Detection


Abstract
:1. Introduction
- The IoT Botnet attack detection is explored as a multiclass classification problem using a dataset with more than 6.2 M instances. The description of the dataset is presented in Section 3.1.
- A feature selection-based method is proposed that incorporates Mutual Information (MI) technique, Principal Component Analysis (PCA) and an ANOVA f-test at finely granulated detection level.
- A fine-granulated aggregated mutual information is proposed and tested on the benchmark dataset. The proposed technique effectively selects the relevant features for increasing the performance of IoT Botnet classifiers.
- A comprehensive and practical approach is proposed that investigates the performance of the proposed technique using two ensemble-based machine learning methods, namely Random Forest (RF) and XGBoost (XGB), and four standalone classifiers, namely, Gaussian Naïve Bayes (GNB), k-Nearest Neighbor (k-NN), Logistic Regression (LR) and Support Vector Machine (SVM).
- Finally, the proposed approach outperforms other techniques using various evaluation metrics.
2. Related Works
3. Materials and Methods
3.1. Used Dataset
| Algorithm 1 Pseudocode of Dataset Sampling |
| Input: A list of |
| Output: Balanced dataset |
| an empty list |
| size of data frame |
| for each file do: |
| Import the file as data frame |
| Count the size of the |
| Append data frame to |
| End for |
| threshold the smallest data frame size |
| For all AND do: |
| percent of data |
| Sample dataset as |
| End For |
| Return as csv format |
| End |
3.2. Data Preprocessing
3.2.1. Label Encoding
3.2.2. Normalization and Standardization
- Min–max normalization is used for transforming values of the dataset features into the range of [0, 1] according to the following equation:where represents the normalized value, and are the border range of the desired interval, which is in this study [0, 1], and is the original value that would be transformed within these ranges.
- Z-score standardization is used for rescaling dataset features so that they will have the properties of a standard normal distribution with mean and standard deviation .
| Algorithm 2 Pseudocode of One-hot encoding, Min–Max Normalization and Z-score Standardization |
| Input: dataset features , class label |
| Output: Pre-processed dataset |
| MinMaxScaler: |
| = 0 |
| max maximum value among all values of column in |
| min minimum value among all values of column in |
| // Equation (1) |
| Return |
| Standardize: |
| = 0 |
| // Equation (2) |
| Return |
| Begin: |
| [ ] // Normalized/ Standardized dataset |
| Hot-encoding dataset |
| For each item in do: |
| // both min-max and z-score method is |
| // executed separately |
| End For |
| End |
3.3. Feature Selection Techniques
3.4. Classification Algorithms
3.5. Model Evaluation Metrics
4. Results and Discussion
4.1. Preliminary Exploration Setup: Binary Dataset
4.1.1. Performance Exploration of Machine Learning Algorithm
4.1.2. Discussion
- Most ML models benefit more when the MI feature selection technique is applied. The performance of ML classifiers in terms of accuracy exceeds the baseline, except LR, in which the performance decreased. As a result, the following section presents how MI can be beneficial for detecting attack types where the multi-class dataset is used. The proposed aggregated MI feature selection approach is highlighted.
4.2. N-BaIoT Dataset as a Multi-Class Dataset
Comparison of MI Feature Selection using Different Aggregation Functions
4.3. Discussion
- When the “MIN” and “AVERAGE” functions were used, the most of classifiers performed well and XGB, k-NN, GNB, LR and SVM achieved notable results compared to their results when the “MAX” operator was used. Among these methods, XGB obtained the best accuracy (99.19%).
- In most cases of the experiments, all classifiers showed good results when the “AVERAGE” operator was used as aggregation function, except RF and SVM.
- It is notable that RF benefited more only when the “MAX” operator was used as an aggregation function. The performance of RF was degraded a little.
- In terms of accuracy, XGB and k-NN classifiers achieved 99.19% and 98.28% respectively, which means that they are quite close. However, when their performances were measured in terms of time consumption, the preference tends to favor k-NN, since it consumes less time, as shown in Table 16.
- The prediction time is also a very important factor for employing an ML classifier for real-time applications. Thus, in the case that the ML classifier is used for preventing attacks on IoT devices in real-time and sensitive intrusion detection systems, the favor tends toward XGB.
- Among all attack types, the XGB and k-NN classifiers were capable of detecting the “Mirai” attack type perfectly.
- Among the “Bashlite” attack types that XGB was able to detect, the “TCP” and “UDP” attack types were poorly detected, whilst the k-NN classifier performed poorly with “TCP” and “UDP” attack types, and also with “COMBO” and “Junk” attack types.
- Interestingly, RF records the best performance with F1score of 100% for the “COMBO” attack type when the “AVERAGE” aggregation function was used. In addition, it achieved F1 score of 99.95% with the “Junk” type.
5. Conclusions
Author Contributions
Funding
Institutional Review Board Statement
Informed Consent Statement
Data Availability Statement
Acknowledgments
Conflicts of Interest
Appendix A

| F. No | Feature Name | F. No | Feature Name | F. No | Feature Name | F. No | Feature Name |
|---|---|---|---|---|---|---|---|
| MI_dir_L5_weight | H_L1_mean | HH_L1_weight | HH_jit_L5_mean | ||||
| MI_dir_L5_mean | H_L1_variance | HH_L1_mean | HH_jit_L5_variance | ||||
| MI_dir_L5_variance | H_L0.1_weight | HH_L1_std | HH_jit_L3_weight | ||||
| MI_dir_L3_weight | H_L0.1_mean | HH_L1_magnitude | HH_jit_L3_mean | ||||
| MI_dir_L3_mean | H_L0.1_variance | HH_L1_radius | HH_jit_L3_variance | ||||
| MI_dir_L3_variance | H_L0.01_weight | HH_L1_covariance | HH_jit_L1_weight | ||||
| MI_dir_L1_weight | H_L0.01_mean | HH_L1_pcc | HH_jit_L1_mean | ||||
| MI_dir_L1_mean | H_L0.01_variance | HH_L0.1_weight | HH_jit_L1_variance | ||||
| MI_dir_L1_variance | HH_L5_weight | HH_L0.1_mean | HH_jit_L0.1_weight | ||||
| MI_dir_L0.1_weight | HH_L5_mean | HH_L0.1_std | HH_jit_L0.1_mean | ||||
| MI_dir_L0.1_mean | HH_L5_std | HH_L0.1_magnitude | HH_jit_L0.1_variance | ||||
| MI_dir_L0.1_variance | HH_L5_magnitude | HH_L0.1_radius | HH_jit_L0.01_weight | ||||
| MI_dir_L0.01_weight | HH_L5_radius | HH_L0.1_covariance | HH_jit_L0.01_mean | ||||
| MI_dir_L0.01_mean | HH_L5_covariance | HH_L0.1_pcc | HH_jit_L0.01_variance | ||||
| MI_dir_L0.01_variance | HH_L5_pcc | HH_L0.01_weight | HpHp_L5_weight | ||||
| H_L5_weight | HH_L3_weight | HH_L0.01_mean | HpHp_L5_mean | ||||
| H_L5_mean | HH_L3_mean | HH_L0.01_std | HpHp_L5_std | ||||
| H_L5_variance | HH_L3_std | HH_L0.01_magnitude | HpHp_L5_magnitude | ||||
| H_L3_weight | HH_L3_magnitude | HH_L0.01_radius | HpHp_L5_radius | ||||
| H_L3_mean | HH_L3_radius | HH_L0.01_covariance | HpHp_L5_covariance | ||||
| H_L3_variance | HH_L3_covariance | HH_L0.01_pcc | HpHp_L5_pcc | ||||
| H_L1_weight | HH_L3_pcc | HH_jit_L5_weight | HpHp_L3_weight | ||||
| HpHp_L3_magnitude | HpHp_L3_radius | HpHp_L3_covariance | HpHp_L3_pcc | ||||
| HpHp_L1_weight | HpHp_L1_mean | HpHp_L1_std | HpHp_L1_magnitude | ||||
| HpHp_L1_radius | HpHp_L1_covariance | HpHp_L1_pcc | HpHp_L0.1_weight | ||||
| HpHp_L0.1_mean | HpHp_L0.1_std | HpHp_L0.1_magnitude | HpHp_L0.1_radius | ||||
| HpHp_L0.1_covariance | HpHp_L0.1_pcc | HpHp_L0.01_weight | HpHp_L0.01_mean | ||||
| HpHp_L0.01_std | HpHpL0.01_magnitude | HpHp_L0.01_radius | HpHp_L0.01_covariance | ||||
| HpHp_L0.01_pcc | HpHp_L3_mean | HpHp_L3_std |
| No. of Components | RF | XGB | k-NN | LR | GNB | SVM |
|---|---|---|---|---|---|---|
| 1 | 65.605% | 63.072% | 70.231% | 16.720% | 24.553% | 61.430% |
| 11 | 93.011% | 97.711% | 99.765% | 78.314% | 68.009% | 88.621% |
| 21 | 93.058% | 98.657% | 99.802% | 82.053% | 68.871% | 89.350% |
| 31 | 92.066% | 98.871% | 99.819% | 82.822% | 68.179% | 89.928% |
| 41 | 91.145% | 98.897% | 99.817% | 82.831% | 67.753% | 89.506% |
| 51 | 92.055% | 98.920% | 99.817% | 82.833% | 66.803% | 89.521% |
| 61 | 92.043% | 98.869% | 99.817% | 82.904% | 62.286% | 89.521% |
| 71 | 92.051% | 99.290% | 99.817% | 82.890% | 56.603% | 89.521% |
| 81 | 92.049% | 99.327% | 99.817% | 82.843% | 50.457% | 89.521% |
| 91 | 92.043% | 99.306% | 99.817% | 82.818% | 44.553% | 89.521% |
| 101 | 92.055% | 99.292% | 99.817% | 82.776% | 44.333% | 89.521% |
| 111 | 92.051% | 99.187% | 99.817% | 82.759% | 44.333% | 89.521% |
References
- Sicato, J.C.S.; Singh, S.K.; Rathore, S.; Park, J.H. A comprehensive analyses of intrusion detection system for IoT environment. J. Inf. Processing Syst. 2020, 16, 975–990. [Google Scholar]
- Smys, S.; Basar, A.; Wang, H. Hybrid intrusion detection system for internet of Things (IoT). J. ISMAC 2020, 2, 190–199. [Google Scholar] [CrossRef]
- Greengard, S. The Internet of Things; MIT Press: Cambridge, MA, USA, 2021. [Google Scholar]
- Hindy, H.; Brosset, D.; Bayne, E.; Seeam, A.K.; Tachtatzis, C.; Atkinson, R.; Bellekens, X. A taxonomy of network threats and the effect of current datasets on intrusion detection systems. IEEE Access 2020, 8, 104650–104675. [Google Scholar] [CrossRef]
- Arshad, J.; Azad, M.A.; Amad, R.; Salah, K.; Alazab, M.; Iqbal, R. A review of performance, energy and privacy of intrusion detection systems for IoT. Electronics 2020, 9, 629. [Google Scholar] [CrossRef] [Green Version]
- Gaonkar, S.; Dessai, N.F.; Costa, J.; Borkar, A.; Aswale, S.; Shetgaonkar, P. A survey on botnet detection techniques. In 2020 International Conference on Emerging Trends in Information Technology and Engineering (ic-ETITE); IEEE: Vellore, India, 2020; pp. 1–6. [Google Scholar]
- Al-Othman, Z.; Alkasassbeh, M.; Baddar SA, H. A State-of-the-Art Review on IoT botnet Attack Detection. arXiv 2020, arXiv:2010.13852. [Google Scholar]
- Popoola, S.I.; Adebisi, B.; Ande, R.; Hammoudeh, M.; Anoh, K.; Atayero, A.A. SMOTE-DRNN: A Deep Learning Algorithm for Botnet Detection in the Internet-of-Things Networks. Sensors 2021, 21, 2985. [Google Scholar] [CrossRef]
- Soe, Y.N.; Feng, Y.; Santosa, P.I.; Hartanto, R.; Sakurai, K. Machine learning-based IoT-botnet attack detection with sequential architecture. Sensors 2020, 20, 4372. [Google Scholar] [CrossRef]
- Tuan, T.A.; Long, H.V.; Son, L.H.; Kumar, R.; Priyadarshini, I.; Son NT, K. Performance evaluation of Botnet DDoS attack detection using machine learning. Evol. Intell. 2020, 13, 283–294. [Google Scholar] [CrossRef]
- Saranya, T.; Sridevi, S.; Deisy, C.; Chung, T.D.; Khan, M.A. Performance analysis of machine learning algorithms in intrusion detection system: A review. Procedia Comput. Sci. 2020, 171, 1251–1260. [Google Scholar] [CrossRef]
- Kiran, K.S.; Devisetty, R.K.; Kalyan, N.P.; Mukundini, K.; Karthi, R. Building an intrusion detection system for iot environment using machine learning techniques. Procedia Comput. Sci. 2020, 171, 2372–2379. [Google Scholar] [CrossRef]
- Pacheco, J.; Benitez, V.H.; Felix-Herran, L.C.; Satam, P. Artificial neural networks-based intrusion detection system for internet of things fog nodes. IEEE Access 2020, 8, 73907–73918. [Google Scholar] [CrossRef]
- Ferrag, M.A.; Maglaras, L.; Ahmim, A.; Derdour, M.; Janicke, H. Rdtids: Rules and decision tree-based intrusion detection system for internet-of-things networks. Future Internet 2020, 12, 44. [Google Scholar] [CrossRef] [Green Version]
- Amouri, A.; Alaparthy, V.T.; Morgera, S.D. A machine learning based intrusion detection system for mobile Internet of Things. Sensors 2020, 20, 461. [Google Scholar] [CrossRef] [Green Version]
- Verma, A.; Ranga, V. Machine learning based intrusion detection systems for IoT applications. Wirel. Pers. Commun. 2020, 111, 2287–2310. [Google Scholar] [CrossRef]
- Hindy, H.; Bayne, E.; Bures, M.; Atkinson, R.; Tachtatzis, C.; Bellekens, X. Machine learning based IoT Intrusion Detection System: An MQTT case study (MQTT-IoT-IDS2020 Dataset). In Proceedings of the International Networking Conference (2020), Rhodes, Greece, 19–21 September 2020; Springer: Cham, Switzerland, 2020; pp. 73–84. [Google Scholar]
- Lv, L.; Wang, W.; Zhang, Z.; Liu, X. A novel intrusion detection system based on an optimal hybrid kernel extreme learning machine. Knowl.-Based Syst. 2020, 195, 105648. [Google Scholar] [CrossRef]
- Gad, A.R.; Nashat, A.A.; Barkat, T.M. Intrusion Detection System Using Machine Learning for Vehicular Ad Hoc Networks Based on ToN-IoT Dataset. IEEE Access 2021, 9, 142206–142217. [Google Scholar] [CrossRef]
- Alqahtani, M.; Mathkour, H.; Ben Ismail, M.M. IoT botnet attack detection based on optimized extreme gradient boosting and feature selection. Sensors 2020, 20, 6336. [Google Scholar] [CrossRef]
- Bahşi, H.; Nõmm, S.; La Torre, F.B. Dimensionality reduction for machine learning based iot botnet detection. In 2018 15th International Conference on Control, Automation, Robotics and Vision (ICARCV); IEEE: Singapore, 2018; pp. 1857–1862. [Google Scholar]
- Panda, M.; Abd Allah, A.M.; Hassanien, A.E. Developing an Efficient Feature Engineering and Machine Learning Model for Detecting IoT-Botnet Cyber Attacks. IEEE Access 2021, 9, 91038–91052. [Google Scholar] [CrossRef]
- AGhaleb, F.; Saeed, F.; Al-Sarem, M.; Ali Saleh Al-rimy, B.; Boulila, W.; Eljialy, A.E.M.; Aloufi, K.; Alazab, M. Misbehavior-aware on-demand collaborative intrusion detection system using distributed ensemble learning for VANET. Electronics 2020, 9, 1411. [Google Scholar] [CrossRef]
- Ramadan, R.A.; Emara, A.H.; AL-Sarem, M.; Elhamahmy, M. Internet of Drones Intrusion Detection Using Deep Learning. Electronics 2021, 10, 2633. [Google Scholar] [CrossRef]
- Al-Sarem, M.; Saeed, F.; Al-Mekhlafi, Z.G.; Mohammed, B.A.; Hadwan, M.; Al-Hadhrami, T.; Alshammari, M.T.; Alreshidi, A.; Alshammari, T.S. An Improved Multiple Features and Machine Learning-Based Approach for Detecting Clickbait News on Social Networks. Appl. Sci. 2021, 11, 9487. [Google Scholar] [CrossRef]
- Al-Sarem, M.; Saeed, F.; Boulila, W.; Emara, A.H.; Al-Mohaimeed, M.; Errais, M. Feature Selection and Classification Using CatBoost Method for Improving the Performance of Predicting Parkinson’s Disease. In Advances on Smart and Soft Computing; Springer: Singapore, 2021; pp. 189–199. [Google Scholar]
- Nasser, M.; Salim, N.; Hamza, H.; Saeed, F.; Rabiu, I. Features Reweighting and Selection in ligand-based Virtual Screening for Molecular Similarity Searching Based on Deep Belief Networks. Adv. Data Sci. Adapt. Anal. 2020, 12, 2050009. [Google Scholar] [CrossRef]
- Alsoufi, M.A.; Razak, S.; Siraj, M.M.; Nafea, I.; Ghaleb, F.A.; Saeed, F.; Nasser, M. Anomaly-Based Intrusion Detection Systems in IoT Using Deep Learning: A Systematic Literature Review. Appl. Sci. 2021, 11, 8383. [Google Scholar] [CrossRef]
- Meidana, Y.; Bohadana, M.; Mathov, Y.; Mirsky, Y.; Shabtai, A.; Breitenbacher, D.; Elovici, Y. N-BaIoT—Network-Based Detection of IoT Botnet Attacks Using Deep Autoencoders. IEEE Pervasive Comput. 2018, 17, 12–22. [Google Scholar] [CrossRef] [Green Version]
- Al-Sarem, M.; Emara, A.H. Analysis the Arabic Authorship Attribution Using Machine Learning Methods: Application on Islamic Fatwā. In Recent Trends in Data Science and Soft Computing. IRICT 2018. Advances in Intelligent Systems and Computing; Saeed, F., Gazem, N., Mohammed, F., Busalim, A., Eds.; Springer: Cham, Switzerland, 2019; Volume 843. [Google Scholar] [CrossRef]
- Paulauskas, N.; Auskalnis, J. Analysis of data pre-processing influence on intrusion detection using NSL-KDD dataset. In Proceedings of the 2017 Open Conference of Electrical, Electronic and Information Sciences (eStream), Vilnius, Lithuania, 27 April 2017; pp. 1–5. [Google Scholar]
- Cohen, P.; West, S.G.; Aiken, L.S. Applied Multiple Regression/Correlation Analysis for the Behavioral Sciences; Psychology Press: New York, NY, USA, 2014. [Google Scholar]
- Eye Av Clogg, C.C. Categorical Variables in Developmental Research: Methods of Analysis; Academic Press: New York, NY, USA; London, UK, 1996. [Google Scholar]
- Cerda, P.; Varoquaux, G.; K’egl, B. Similarity encoding for learning with dirty categorical variables. Mach. Learn. 2018, 107, 1477–1494. [Google Scholar] [CrossRef] [Green Version]
- Guo, C.; Berkhahn, F. Entity embeddings of categorical variables. arXiv 2016, arXiv:1604.06737. [Google Scholar]
- Zhou, Y.; Cheng, G.; Jiang, S.; Dai, M. Building an efficient intrusion detection system based on feature selection and ensemble classifier. Comput. Netw. 2020, 174, 107247. [Google Scholar] [CrossRef] [Green Version]
- Mahfouz, A.; Abuhussein, A.; Venugopal, D.; Shiva, S. Ensemble Classifiers for Network Intrusion Detection Using a Novel Network Attack Dataset. Future Internet 2020, 12, 180. [Google Scholar] [CrossRef]
- Claesen, M.; De Moor, B. Hyperparameter search in machine learning. arXiv 2015, arXiv:1502.02127. [Google Scholar]


| Feature Name | Number of Instances, % | |
|---|---|---|
| IoT device types | Security cameras | 1 |
| Webcam | 1 | |
| Smart baby monitor | 1 | |
| Thermostat | 1 | |
| Smart door-bell devices | 2 | |
| General Features | Total number of Instances | 6,273,053 |
| # of features in dataset | 115 | |
| Time windows | 100 ms, 500 ms, 1.5 s, 10 s and 1 min | |
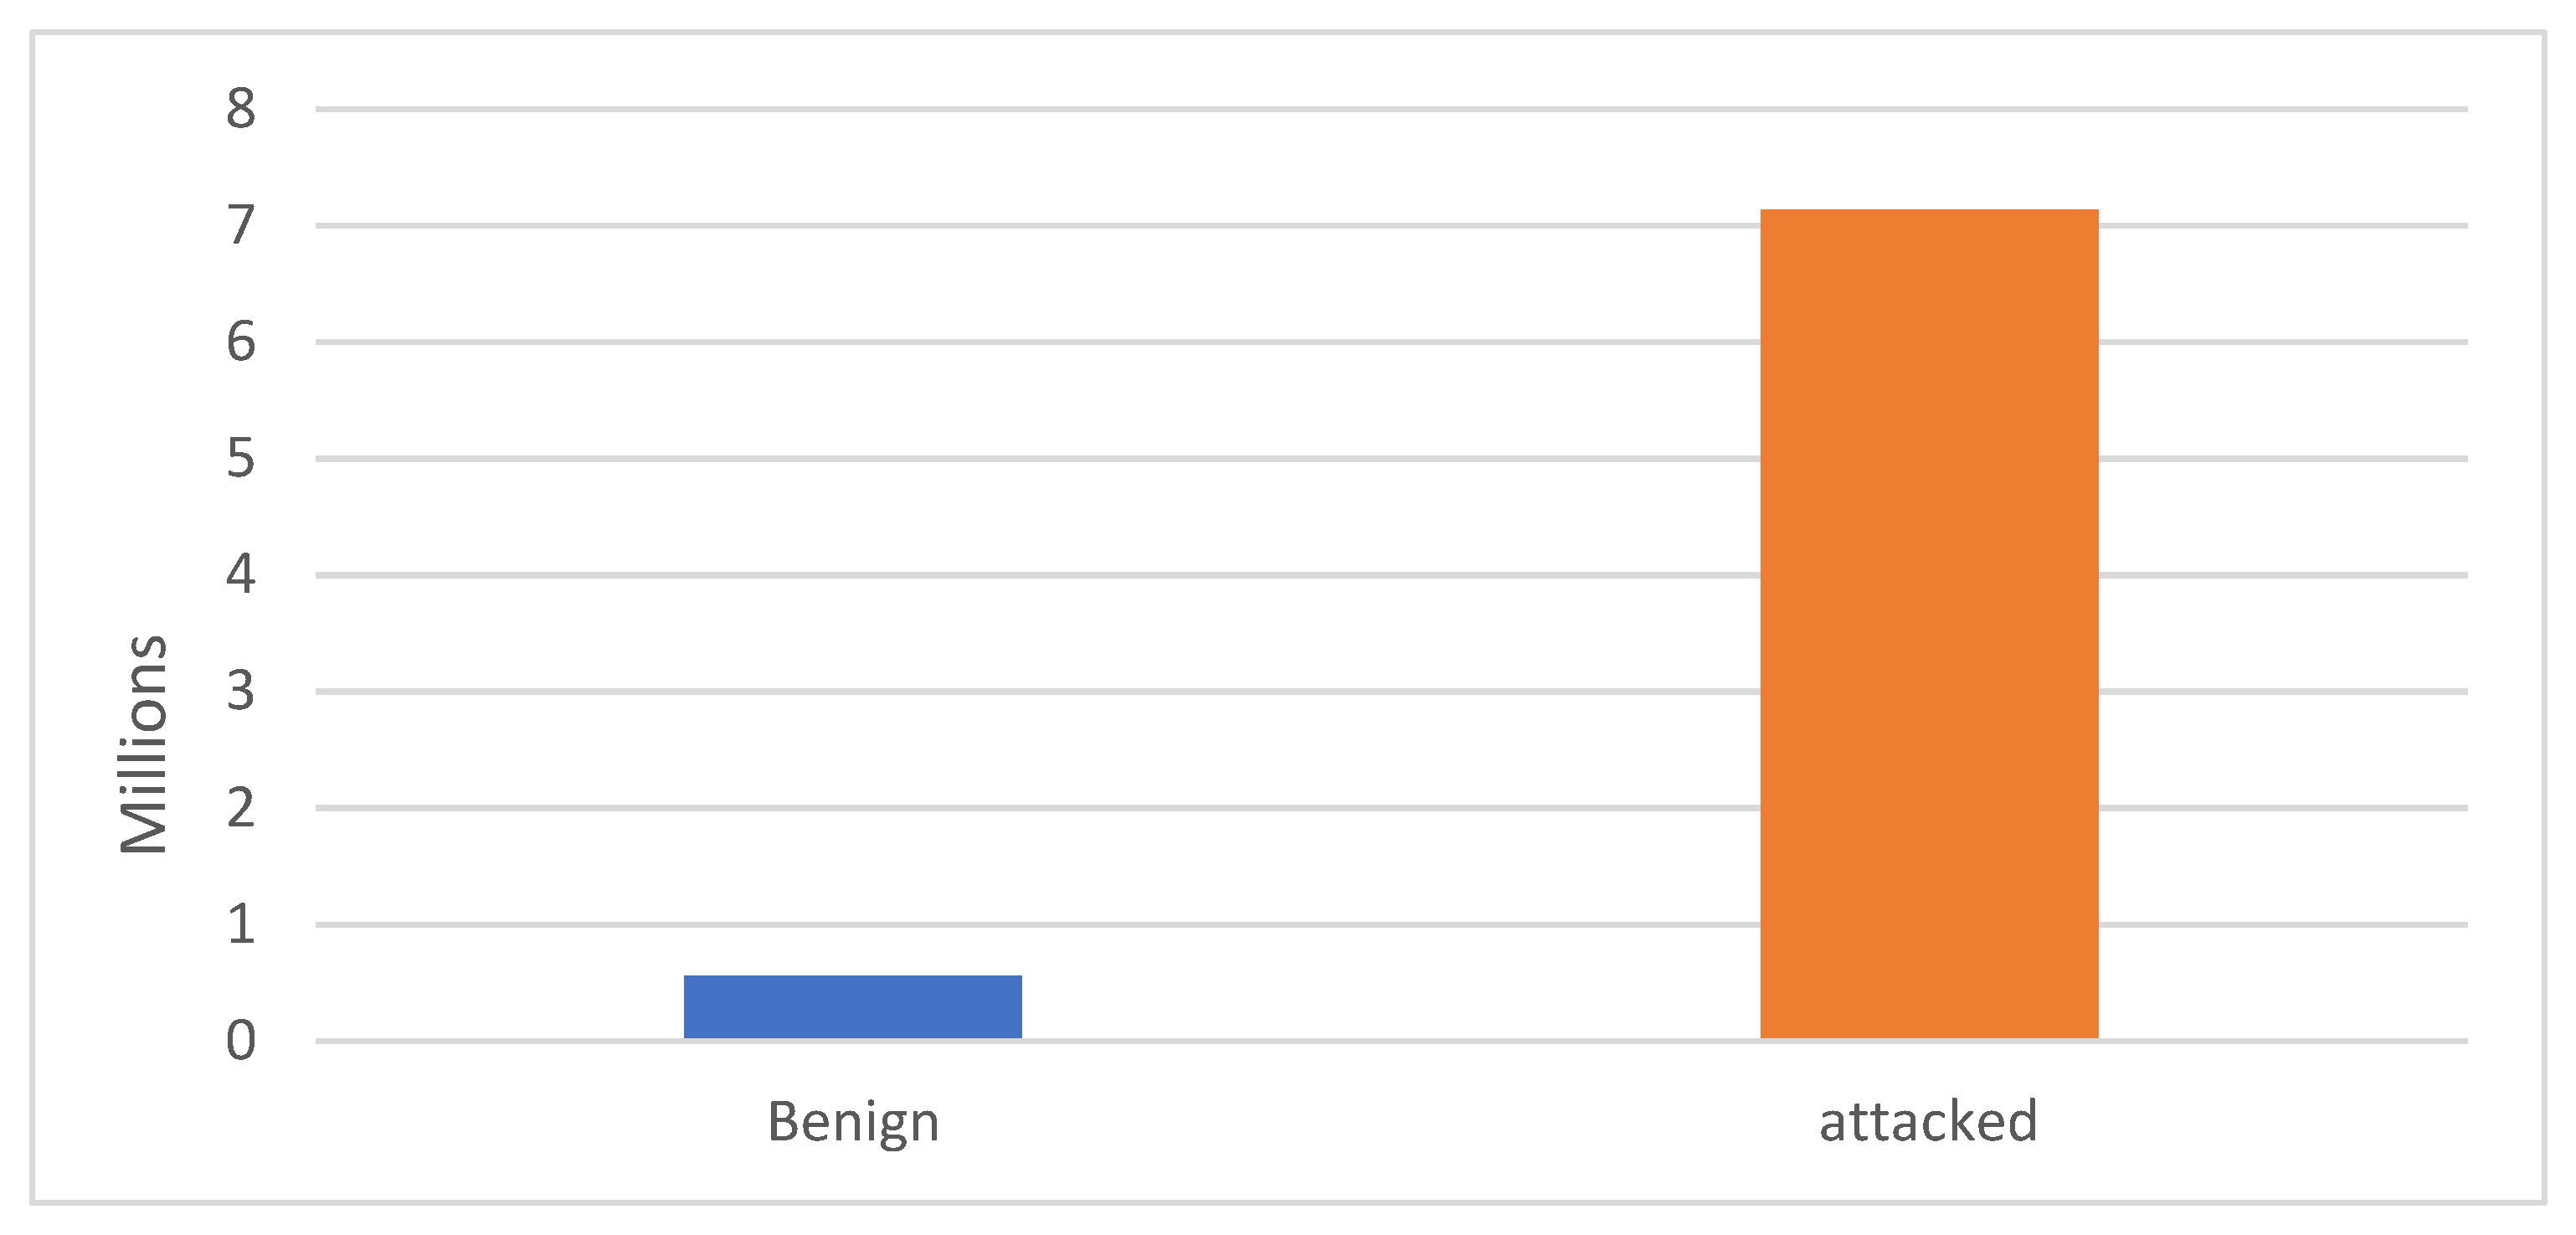
| Distribution of data (2 classes) | # of “Benign” records | 555,932 (7.23%) |
| # of “attack” records | 7,134,943 (92,77%) | |
| Distribution of data (3 classes) | # of “Bengin” records | 555,932 (7.23%) |
| # of “Bashlite” records | 2,838,272 (36,90%) | |
| # of “Mirai” records | 4,296,671 (55,87%) | |
| Statistical Feature | Reference | Number of Records |
|---|---|---|
| “Benign” | 555,932 (7.23%) | |
| “Bashlite” attack type, % out of all instances | COMBO: 515,156 (6.698 %) | |
| Junk: 261,789 (3.403 %) | ||
| Scan: 255,111 (3.317%) | ||
| TCP: 859,850 (11.180%) | ||
| UDP: 946,366 (12.305%) | ||
| “Mirai” attack type, % out of all instances | Ack: 865,646 (11.255%) | |
| Scan: 650,414 (8.457%) | ||
| Syn: 790,227 (10.275%) | ||
| UDP: 1,285,683 (16.717%) | ||
| UDPplain: 704,701 (9.163%) |
| Aggregators | Formula | Description |
|---|---|---|
| Min ( ) | Selects the minimum of the relevance scores produced when class type is used as a target class | |
| Max ( ) | Selects the maximum of the relevance scores produced when class type is used as a target class | |
| Mean ( ) | Selects the mean of the relevance scores produced when class type is used as a target class |
| Classification Algorithms | Adjusted Parameters | Best Tuned Hyper-Parameter |
|---|---|---|
| RF | Criterion: [‘entropy’, ‘gini’] max_depth: [10–1200] + [None] max_features: [‘auto’, ‘sqrt’,’log2′, None] min_samples_leaf: [4–12] min_samples_split: [5–10] n_estimators’: [150–1200] | Criterion: ‘gini’, max_depth: 150, max_features: ‘auto’. min_samples_leaf: 4, min_samples_split: 7, n_estimators’: 150 |
| XGB | n_estimators: [100–1200] max_depth: [1–11], learning_rate: [1 × 10⁻³, 1 × 10⁻², 0.1, 0.5, 1.] subsample: [0.05–1.01] min_child_weight: [1–21] | n_estimators: 150, max_depth: 4, learning_rate: 1 × 10⁻², subsample: 0.25. min_child_weight: 5 |
| k-NN | leaf_size = [3–15], distance = [‘minkowski’, ‘Euclidian’, ‘Manhattan’] #neighbors = [3–45], p = 2, weights = ‘uniform’ | leaf_size = 7, distance = ‘Manhattan’, #neighbors = 23, p = 2, weights = ‘uniform’ |
| LR | C= [−4.0–4.0], intercept_scaling = 1, max_iter = [100–500], penalty = [‘l1′, ‘l2’], solver = [‘liblinear’, ‘lbfgs’], tol = 0.0001, verbose = 0 | C= 1.0, intercept_scaling = 1, max_iter = 100, penalty = ‘l2’, solver = ‘lbfgs’, tol = 0.0001, verbose = 0 |
| SVM | C = [0.1, 1, 10, 100, 1000] gamma = [1, 0.1, 0.01, 0.001, 0.0001] kernel = [‘rbf’, ‘kernel’] | C = 10 gamma = 0.001 kernel = ‘rbf’ |
| Measure Metric | Formula | Explanation |
|---|---|---|
| Accuracy (Acc.) | —Correctly classified instances as the right type of attack. —Correctly classified instances as benign. —Wrongly classified attack instances as benign. —Wrongly classified benign instances as an attack | |
| Precision (P) | ||
| Recall (R) | ||
| F1 score | F1 score is the harmonic mean of precision and recall | |
| Execution time | —Training time; —Prediction time |
| Class | Training Set | Testing Set |
|---|---|---|
| Benign | 190,313 | 22,824 |
| Attacked | 191,927 | 72,736 |
| Total Number of Records | 382,240 | 95,560 |
| FS Technique | RF | XGB | k-NN | LR | GNB | SVM |
|---|---|---|---|---|---|---|
| Without | 94.031% | 99.382% | 99.861% | 82.631% | 74.785% | 89.189% |
| PCA | 93.058% | 99.290% | 99.819% | 82.053% | 68.869% | 89.928% |
| MI | 94.391% | 99.462% | 99.903% | 77.253% | 84.819% | 89.526% |
| ANOVA F-test | 94.287% | 99.294% | 99.811% | 80.157% | 60.260% | 88.645% |
| Aggregation Function | Feature Name |
|---|---|
| MAX | MI_dir_L0.01_mean H_L0.01_mean H_L0.1_mean MI_dir_L0.1_mean H_L0.01_variance MI_dir_L0.01_variance H_L1_mean MI_dir_L1_mean MI_dir_L3_mean H_L3_mean MI_dir_L5_mean H_L5_mean H_L0.1_variance MI_dir_L0.1_variance H_L0.01_weight |
| MIN | HH_jit_L0.1_mean H_L0.01_mean H_L0.1_mean H_L0.1_variance MI_dir_L0.01_mean MI_dir_L0.01_variance H_L0.01_variance MI_dir_L0.1_variance MI_dir_L0.1_mean HH_jit_L0.01_mean H_L1_weight MI_dir_L1_weight MI_dir_L1_mean H_L1_mean MI_dir_L3_mean |
| AVERAGE | MI_dir_L0.01_mean H_L0.01_mean MI_dir_L0.01_variance H_L0.01_variance H_L0.1_mean MI_dir_L0.1_mean MI_dir_L0.1_variance H_L0.1_variance H_L0.1_weight MI_dir_L0.1_weight H_L1_mean MI_dir_L1_mean HH_jit_L0.01_mean HH_jit_L0.1_mean HH_L0.01_magnitude |
| Classifier | Aggregation Function | ||
|---|---|---|---|
| MAX | MIN | AVERAGE | |
| RF | 0.9427 | 0.9414 | 0.9417 |
| XGB | 0.9386 | 0.9897 | 0.9919 |
| k-NN | 0.9305 | 0.9784 | 0.9827 |
| LR | 0.5896 | 0.6071 | 0.7513 |
| GNB | 0.7585 | 0.8464 | 0.8496 |
| SVM | 0.7612 | 0.8673 | 0.8201 |
| Precision | Recall | F1score | |||||||
|---|---|---|---|---|---|---|---|---|---|
| Class Name | MAX | MIN | AVE. | MAX | MIN | AVE. | MAX | MIN | AVE. |
| 0.9994 | 0.9994 | 0.9978 | 1.0000 | 0.9998 | 0.9998 | 0.9997 | 0.9996 | 0.9988 | |
| 1.0000 | 0.9995 | 1.0000 | 1.0000 | 1.0000 | 1.0000 | 1.0000 | 0.9998 | 1.0000 | |
| 1.0000 | 1.0000 | 1.0000 | 0.9997 | 0.9992 | 0.9989 | 0.9999 | 0.9996 | 0.9995 | |
| 1.0000 | 1.0000 | 0.9997 | 0.9997 | 1.0000 | 0.9994 | 0.9998 | 1.0000 | 0.9995 | |
| 1.0000 | 0.8000 | 1.0000 | 0.0015 | 0.0014 | 0.0003 | 0.0029 | 0.0029 | 0.0007 | |
| 0.5397 | 0.5390 | 0.5390 | 0.9997 | 0.9991 | 0.9985 | 0.7010 | 0.7002 | 0.7001 | |
| 1.0000 | 0.9996 | 1.0000 | 1.0000 | 1.0000 | 1.0000 | 1.0000 | 0.9998 | 1.0000 | |
| 1.0000 | 1.0000 | 1.0000 | 1.0000 | 0.9997 | 1.0000 | 1.0000 | 0.9998 | 1.0000 | |
| 1.0000 | 1.0000 | 1.0000 | 1.0000 | 1.0000 | 1.0000 | 1.0000 | 1.0000 | 1.0000 | |
| 1.0000 | 1.0000 | 1.0000 | 1.0000 | 1.0000 | 1.0000 | 1.0000 | 1.0000 | 1.0000 | |
| 1.0000 | 1.0000 | 1.0000 | 1.0000 | 0.9995 | 1.0000 | 1.0000 | 0.9998 | 1.0000 | |
| Precision | Recall | F1score | |||||||
|---|---|---|---|---|---|---|---|---|---|
| Class Name | MAX | MIN | AVE. | MAX | MIN | AVE. | MAX | MIN | AVE. |
| 0.9891 | 0.9727 | 0.9910 | 1.0000 | 0.9996 | 1.0000 | 0.9945 | 0.9859 | 0.9955 | |
| 0.9988 | 0.9985 | 0.9995 | 0.9712 | 0.9689 | 0.9728 | 0.9848 | 0.9835 | 0.9859 | |
| 0.9650 | 0.9724 | 0.9657 | 0.9934 | 0.9835 | 0.9971 | 0.9790 | 0.9779 | 0.9811 | |
| 1.0000 | 1.0000 | 1.0000 | 0.9997 | 1.0000 | 0.9994 | 0.9998 | 1.0000 | 0.9997 | |
| 1.0000 | 0.9234 | 0.9309 | 0.0015 | 1.0000 | 1.0000 | 0.0029 | 0.9602 | 0.9642 | |
| 0.5397 | 0.9993 | 1.0000 | 0.9994 | 0.9281 | 0.9351 | 0.7009 | 0.9624 | 0.9665 | |
| 1.0000 | 0.9998 | 1.0000 | 1.0000 | 0.9998 | 1.0000 | 1.0000 | 0.9998 | 1.0000 | |
| 1.0000 | 1.0000 | 1.0000 | 1.0000 | 0.9997 | 1.0000 | 1.0000 | 0.9998 | 1.0000 | |
| 1.0000 | 1.0000 | 1.0000 | 1.0000 | 1.0000 | 1.0000 | 1.0000 | 1.0000 | 1.0000 | |
| 1.0000 | 1.0000 | 1.0000 | 1.0000 | 1.0000 | 1.0000 | 1.0000 | 1.0000 | 1.0000 | |
| 1.0000 | 1.0000 | 1.0000 | 1.0000 | 0.9995 | 1.0000 | 1.0000 | 0.9998 | 1.0000 | |
| Precision | Recall | F1score | |||||||
|---|---|---|---|---|---|---|---|---|---|
| Class Name | MAX | MIN | AVE. | MAX | MIN | AVE. | MAX | MIN | AVE. |
| 0.9988 | 0.9982 | 0.9986 | 0.9998 | 0.9990 | 0.9998 | 0.9993 | 0.9986 | 0.9992 | |
| 0.9963 | 0.9353 | 0.9431 | 0.9862 | 0.8959 | 0.9199 | 0.9912 | 0.9152 | 0.9313 | |
| 0.9793 | 0.8471 | 0.8773 | 0.9940 | 0.9018 | 0.9114 | 0.9866 | 0.8736 | 0.8940 | |
| 0.9988 | 0.9972 | 1.0000 | 0.9991 | 0.9988 | 0.9994 | 0.9989 | 0.9980 | 0.9997 | |
| 0.4604 | 0.9993 | 0.9996 | 0.9985 | 0.9996 | 1.0000 | 0.6302 | 0.9995 | 0.9998 | |
| 0.5000 | 0.9994 | 0.9997 | 0.0003 | 0.9991 | 0.9985 | 0.0006 | 0.9992 | 0.9991 | |
| 1.0000 | 1.0000 | 1.0000 | 1.0000 | 0.9996 | 0.9996 | 1.0000 | 0.9998 | 0.9998 | |
| 1.0000 | 1.0000 | 0.9997 | 0.9997 | 0.9994 | 1.0000 | 0.9998 | 0.9997 | 0.9998 | |
| 1.0000 | 0.9997 | 1.0000 | 1.0000 | 0.9997 | 1.0000 | 1.0000 | 0.9997 | 1.0000 | |
| 1.0000 | 1.0000 | 0.9998 | 1.0000 | 1.0000 | 1.0000 | 1.0000 | 1.0000 | 0.9999 | |
| 0.9993 | 0.9998 | 1.0000 | 1.0000 | 0.9995 | 1.0000 | 0.9997 | 0.9997 | 1.0000 | |
| Precision | Recall | F1score | |||||||
|---|---|---|---|---|---|---|---|---|---|
| Class Name | MAX | MIN | AVE. | MAX | MIN | AVE. | MAX | MIN | AVE. |
| 0.2392 | 0.2747 | 0.3811 | 1.0000 | 0.9990 | 0.9998 | 0.3861 | 0.43091 | 0.5518 | |
| 0.0000 | 0.4962 | 0.7715 | 0.0000 | 0.4478 | 0.5823 | 0.0000 | 0.47075 | 0.6637 | |
| 0.0000 | 0.0000 | 0.0000 | 0.0000 | 0.0000 | 0.0000 | 0.0000 | 0.00000 | 0.0000 | |
| 0.0000 | 0.9964 | 1.0000 | 0.0000 | 0.4268 | 0.4633 | 0.0000 | 0.59762 | 0.6332 | |
| 0.0000 | 0.0000 | 1.0000 | 0.0000 | 0.0000 | 0.0004 | 0.0000 | 0.00000 | 0.0007 | |
| 0.5397 | 0.5389 | 0.5390 | 0.9994 | 0.9991 | 0.9985 | 0.7009 | 0.70012 | 0.7000 | |
| 1.0000 | 0.9992 | 1.0000 | 1.0000 | 0.9996 | 0.9994 | 1.0000 | 0.99939 | 0.9997 | |
| 1.0000 | 0.9871 | 1.0000 | 0.7999 | 0.5693 | 0.9928 | 0.8889 | 0.72215 | 0.9964 | |
| 0.8204 | 0.9990 | 1.0000 | 0.6615 | 0.1691 | 0.9015 | 0.7324 | 0.28920 | 0.9480 | |
| 1.0000 | 1.0000 | 1.0000 | 0.7714 | 0.9079 | 0.9117 | 0.8710 | 0.95172 | 0.9538 | |
| 1.0000 | 0.9998 | 1.0000 | 1.0000 | 0.9988 | 1.0000 | 1.0000 | 0.99931 | 1.0000 | |
| Precision | Recall | F1score | |||||||
|---|---|---|---|---|---|---|---|---|---|
| Class Name | MAX | MIN | AVE. | MAX | MIN | AVE. | MAX | MIN | AVE. |
| 0.9722 | 0.9644 | 0.9687 | 1.0000 | 0.9996 | 0.9998 | 0.9859 | 0.9817 | 0.9840 | |
| 0.5980 | 0.6103 | 0.6152 | 0.9934 | 0.9955 | 0.9973 | 0.7466 | 0.7567 | 0.7610 | |
| 0.2727 | 0.4516 | 0.5833 | 0.0039 | 0.0036 | 0.0018 | 0.0078 | 0.0072 | 0.0037 | |
| 0.9967 | 0.9920 | 1.0000 | 0.9243 | 0.9895 | 0.9911 | 0.9591 | 0.9907 | 0.9955 | |
| 0.4603 | 0.4608 | 0.4609 | 0.9985 | 0.9986 | 0.9996 | 0.6301 | 0.6306 | 0.6309 | |
| 0.0000 | 0.0000 | 0.0000 | 0.0000 | 0.0000 | 0.0000 | 0.0000 | 0.0000 | 0.0000 | |
| 0.5519 | 1.0000 | 0.9943 | 1.0000 | 0.9996 | 0.9998 | 0.7112 | 0.9998 | 0.9971 | |
| 1.0000 | 1.0000 | 1.0000 | 0.9972 | 0.9981 | 0.9991 | 0.9986 | 0.9991 | 0.9995 | |
| 1.0000 | 1.0000 | 1.0000 | 0.9885 | 0.9857 | 0.9865 | 0.9942 | 0.9928 | 0.9932 | |
| 1.0000 | 1.0000 | 1.0000 | 0.1190 | 0.9961 | 0.9927 | 0.2126 | 0.9981 | 0.9963 | |
| 1.0000 | 1.0000 | 1.0000 | 1.0000 | 0.9958 | 0.9993 | 1.0000 | 0.9979 | 0.9997 | |
| Precision | Recall | F1score | |||||||
|---|---|---|---|---|---|---|---|---|---|
| Class Name | MAX | MIN | AVE. | MAX | MIN | AVE. | MAX | MIN | AVE. |
| 0.3892 | 0.9038 | 0.5414 | 1.0000 | 0.9970 | 0.9996 | 0.5603 | 0.9481 | 0.7023 | |
| 0.8252 | 0.6629 | 0.7140 | 0.6243 | 0.9608 | 0.6679 | 0.7108 | 0.7845 | 0.6902 | |
| 0.2500 | 0.9718 | 1.0000 | 0.0003 | 0.1780 | 0.0005 | 0.0005 | 0.3009 | 0.0011 | |
| 1.0000 | 0.9925 | 0.9994 | 0.9277 | 0.9781 | 0.9862 | 0.9625 | 0.9852 | 0.9928 | |
| 1.0000 | 0.7500 | 0.5000 | 0.0011 | 0.0011 | 0.0004 | 0.0022 | 0.0022 | 0.0007 | |
| . | 0.5396 | 0.5387 | 0.5390 | 0.9994 | 0.9991 | 0.9985 | 0.7008 | 0.7000 | 0.7000 |
| 0.9998 | 1.0000 | 1.0000 | 1.0000 | 0.9996 | 0.9998 | 0.9999 | 0.9998 | 0999 | |
| 1.0000 | 0.9985 | 1.0000 | 0.9997 | 0.9988 | 0.9991 | 0.9998 | 0.9986 | 0.9995 | |
| 1.0000 | 0.9993 | 0.9995 | 0.6181 | 0.9970 | 1.0000 | 0.7640 | 0.9982 | 0.9998 | |
| 1.0000 | 0.9992 | 1.0000 | 1.0000 | 1.0000 | 1.0000 | 1.0000 | 0.9996 | 1.0000 | |
| 1.0000 | 1.0000 | 1.0000 | 1.0000 | 0.9995 | 1.0000 | 1.0000 | 0.9998 | 1.0000 | |
| Classifier | Training Time (s) | Prediction Time (s) | Execution Time (s) | ||||||
|---|---|---|---|---|---|---|---|---|---|
| MAX | MIN | AVERAGE | MAX | MIN | AVERAGE | MAX | MIN | AVERAGE | |
| RF | 181.343 | 192.288 | 178.371 | 2.998 | 3.059 | 3.06 | 184.495 | 195.497 | 181.578 |
| XGB | 239.309 | 229.42 | 227.967 | 0.670 | 0.758 | 0.722 | 240.138 | 230.357 | 228.852 |
| K-nn | 20.928 | 10.732 | 20.622 | 68.744 | 30.085 | 24.474 | 89.820 | 40.977 | 45.242 |
| LR | 18.285 | 24.574 | 23.204 | 0.034 | 0.04 | 0.037 | 18.516 | 24.815 | 23.445 |
| GNB | 0.874 | 0.95 | 0.916 | 0.210 | 0.223 | 0.202 | 1.232 | 1.333 | 1.267 |
| SVM | 3144.112 | 4235.9 | 3308.709 | 266.762 | 229.278 | 218.782 | 3411.02 | 4465.33 | 3527.637 |
Publisher’s Note: MDPI stays neutral with regard to jurisdictional claims in published maps and institutional affiliations. |
© 2021 by the authors. Licensee MDPI, Basel, Switzerland. This article is an open access article distributed under the terms and conditions of the Creative Commons Attribution (CC BY) license (https://creativecommons.org/licenses/by/4.0/).
Share and Cite
Al-Sarem, M.; Saeed, F.; Alkhammash, E.H.; Alghamdi, N.S. An Aggregated Mutual Information Based Feature Selection with Machine Learning Methods for Enhancing IoT Botnet Attack Detection. Sensors 2022, 22, 185. https://doi.org/10.3390/s22010185
Al-Sarem M, Saeed F, Alkhammash EH, Alghamdi NS. An Aggregated Mutual Information Based Feature Selection with Machine Learning Methods for Enhancing IoT Botnet Attack Detection. Sensors. 2022; 22(1):185. https://doi.org/10.3390/s22010185
Chicago/Turabian StyleAl-Sarem, Mohammed, Faisal Saeed, Eman H. Alkhammash, and Norah Saleh Alghamdi. 2022. "An Aggregated Mutual Information Based Feature Selection with Machine Learning Methods for Enhancing IoT Botnet Attack Detection" Sensors 22, no. 1: 185. https://doi.org/10.3390/s22010185