1. Introduction
Every year in the U.S., nearly half a million sick infants are hospitalized and undergo close monitoring of vital signs such as blood pressure (BP). In critically ill neonates, continuous BP monitoring is achieved by inserting a catheter into the lumen of an artery. This catheterization procedure is risky, invasive, and expensive—it requires skill and time, and infants may require sedation. Multiple attempts may be required to place the catheter due to small arteries [
1,
2,
3]. A catheter may remain within the artery for several days and can lead to serious complications such as infection, bleeding, clots, tissue, and nerve damage [
1,
2,
3,
4].
Non-invasive alternatives to measure BP also have disadvantages. Oscillometry is the most widely used non-invasive method and measures BP by intermittently inflating a cuff. In general, continuous monitoring is preferred over intermittent, cuff-based, oscillometric monitoring for hypotensive neonates because premature neonatal BP values are often too low for an accurate measurement with a conventional cuff [
5] and application of the cuff can perturb the patient to artificially elevate the measured BP values [
6]. Moreover, the frequent use of cuffs can cause ischemic damage [
7], particularly for patients with fragile skin such as premature neonates.
Other non-invasive techniques have been developed for the measurement of adult BP values, such as volume clamping using partially inflated finger cuffs, pulse transit time analysis using multiple sensors, and pulsewave analysis using cuffs or optical or radiative sensors [
8]. These are summarized in
Table 1. Almost all methods require calibration with a known BP measurement so that the measured features can be used to estimate BP [
9,
10,
11], and none have been adopted for use with neonates. Machine learning (ML) methods can be used to analyze pulse waveform features and derive BP [
12] and other hemodynamic parameters [
13]. These include neural networks, probabilistic, decision tree, and rule-based induction.
Premature neonates have small wrists akin to an adult’s index finger and weigh as few as 400 g. For these infants, there is a critical need for a wearable, continuous, non-invasive BP (cNIBP) monitoring device that is accurate, affordable, and easy to use. For ease of use, it is necessary to overcome the need for calibration. Such a cNIBP device could eliminate the complications associated with IALs and obviate the need for sedation. Rapid and timely attachment could reduce latency for treating hypotension and potentially improve outcomes. Furthermore, less-skilled practitioners could use this device in resource-limited settings or during patient transport.
Here, we investigate the clinical feasibility and accuracy of estimating continuous BP in critically ill neonates with a wearable device (BoppliTM, PyrAmes Inc., Cupertino, CA, USA) using ML-based methods without the need for calibration.
2. Materials and Methods
2.1. Device Design and Working Principle
Boppli was designed to meet the BP monitoring requirements and physical dimensions of small, prematurely-born infants. It uses capacitive sensing methods, previously reported [
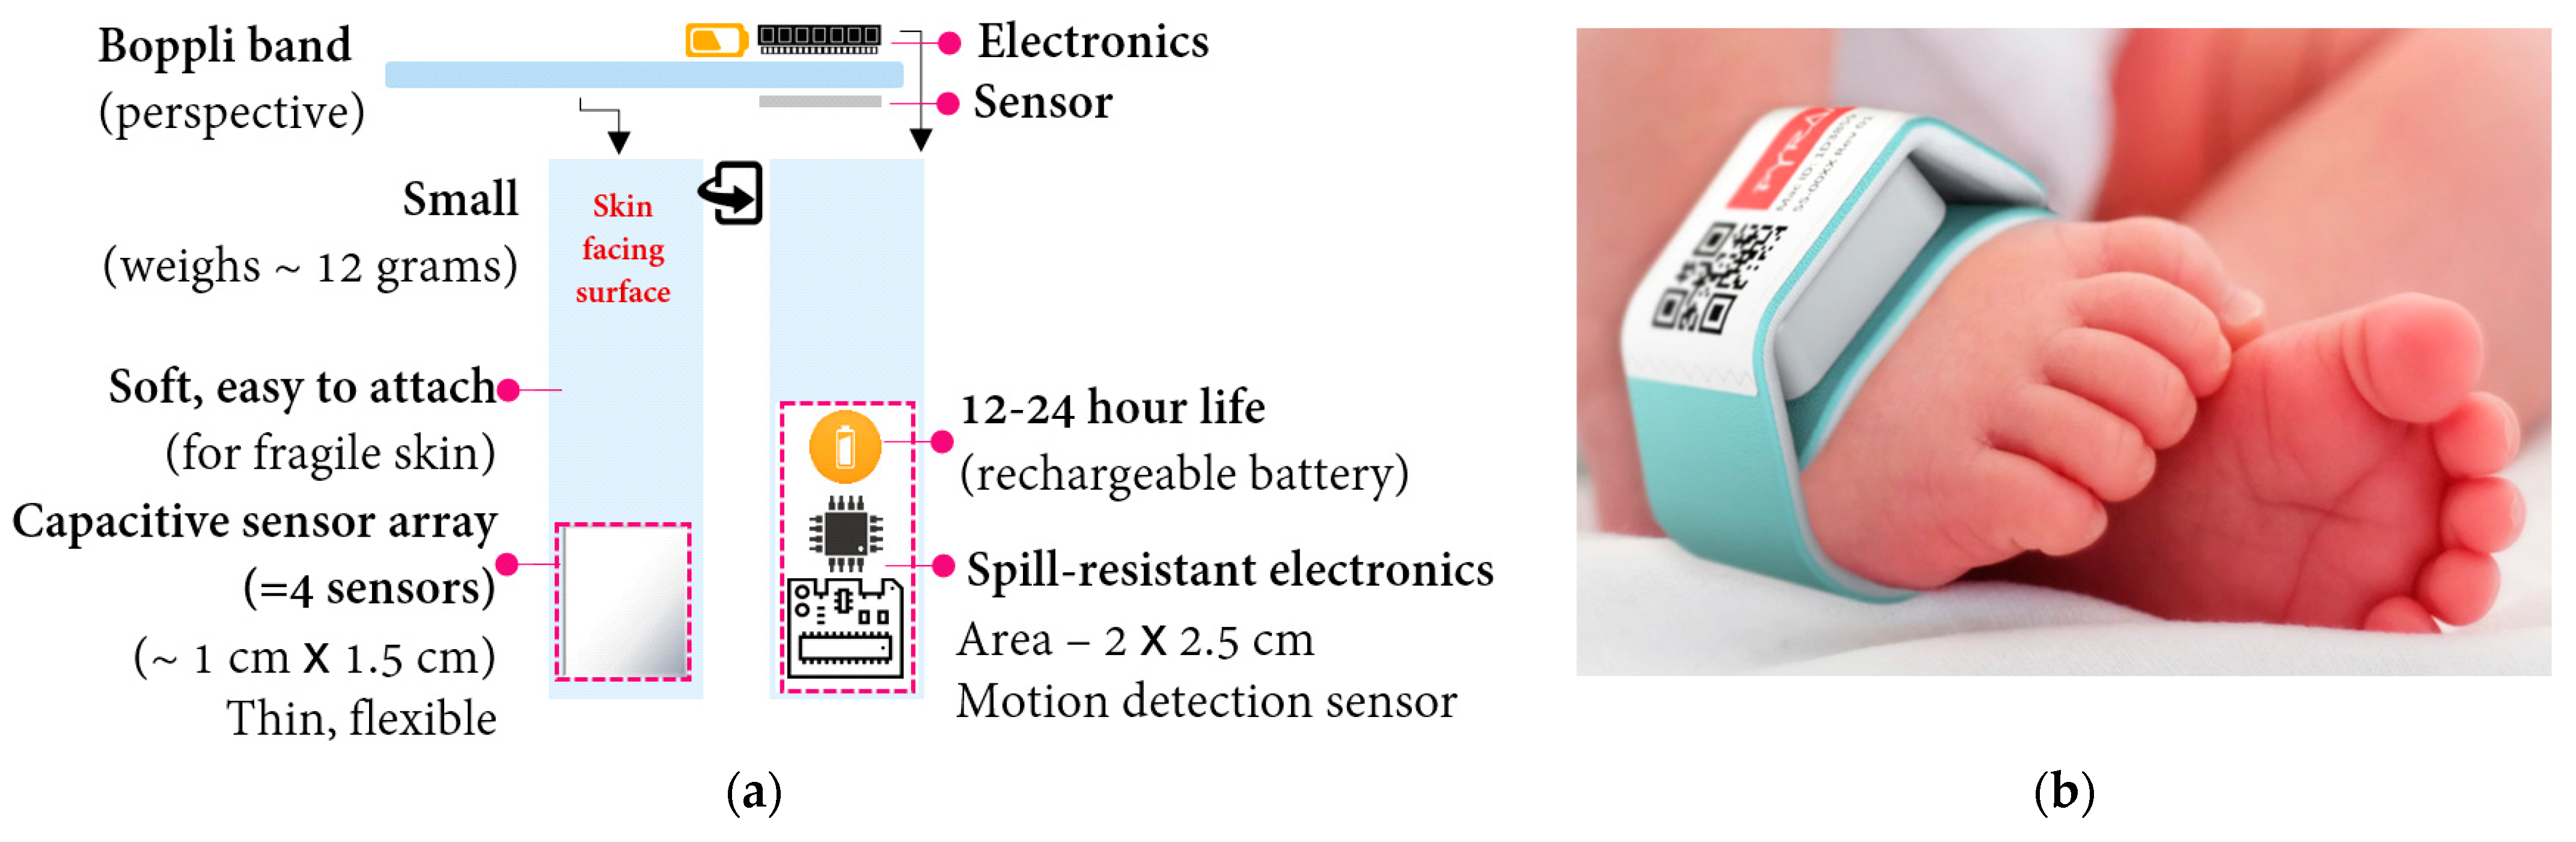
8]. The thin (~50 μm), capacitance sensor array comprises four sensing elements. It is flexible and conforms to the contour of the limb. This extremely sensitive sensor is coupled with low-power electronics (
Figure 1) to achieve a small form-factor and low weight (~12 g). The sensor and electronic components are incorporated into a disposable, foam band designed to ensure a snug fit without imposing excessive pressure on an infant’s delicate skin. The band does not use an adhesive, and its materials are hypoallergenic.
The device determines continuous BP in real-time by using two tandem processes: (1) capacitive sensing to quantify each pulse as a waveform, and (2) signal processing and machine learning methods to analyze and process the pulse waveform data to derive the systolic (SBP), diastolic (DBP), and mean arterial pressure (MAP).
2.1.1. Capacitive Sensing
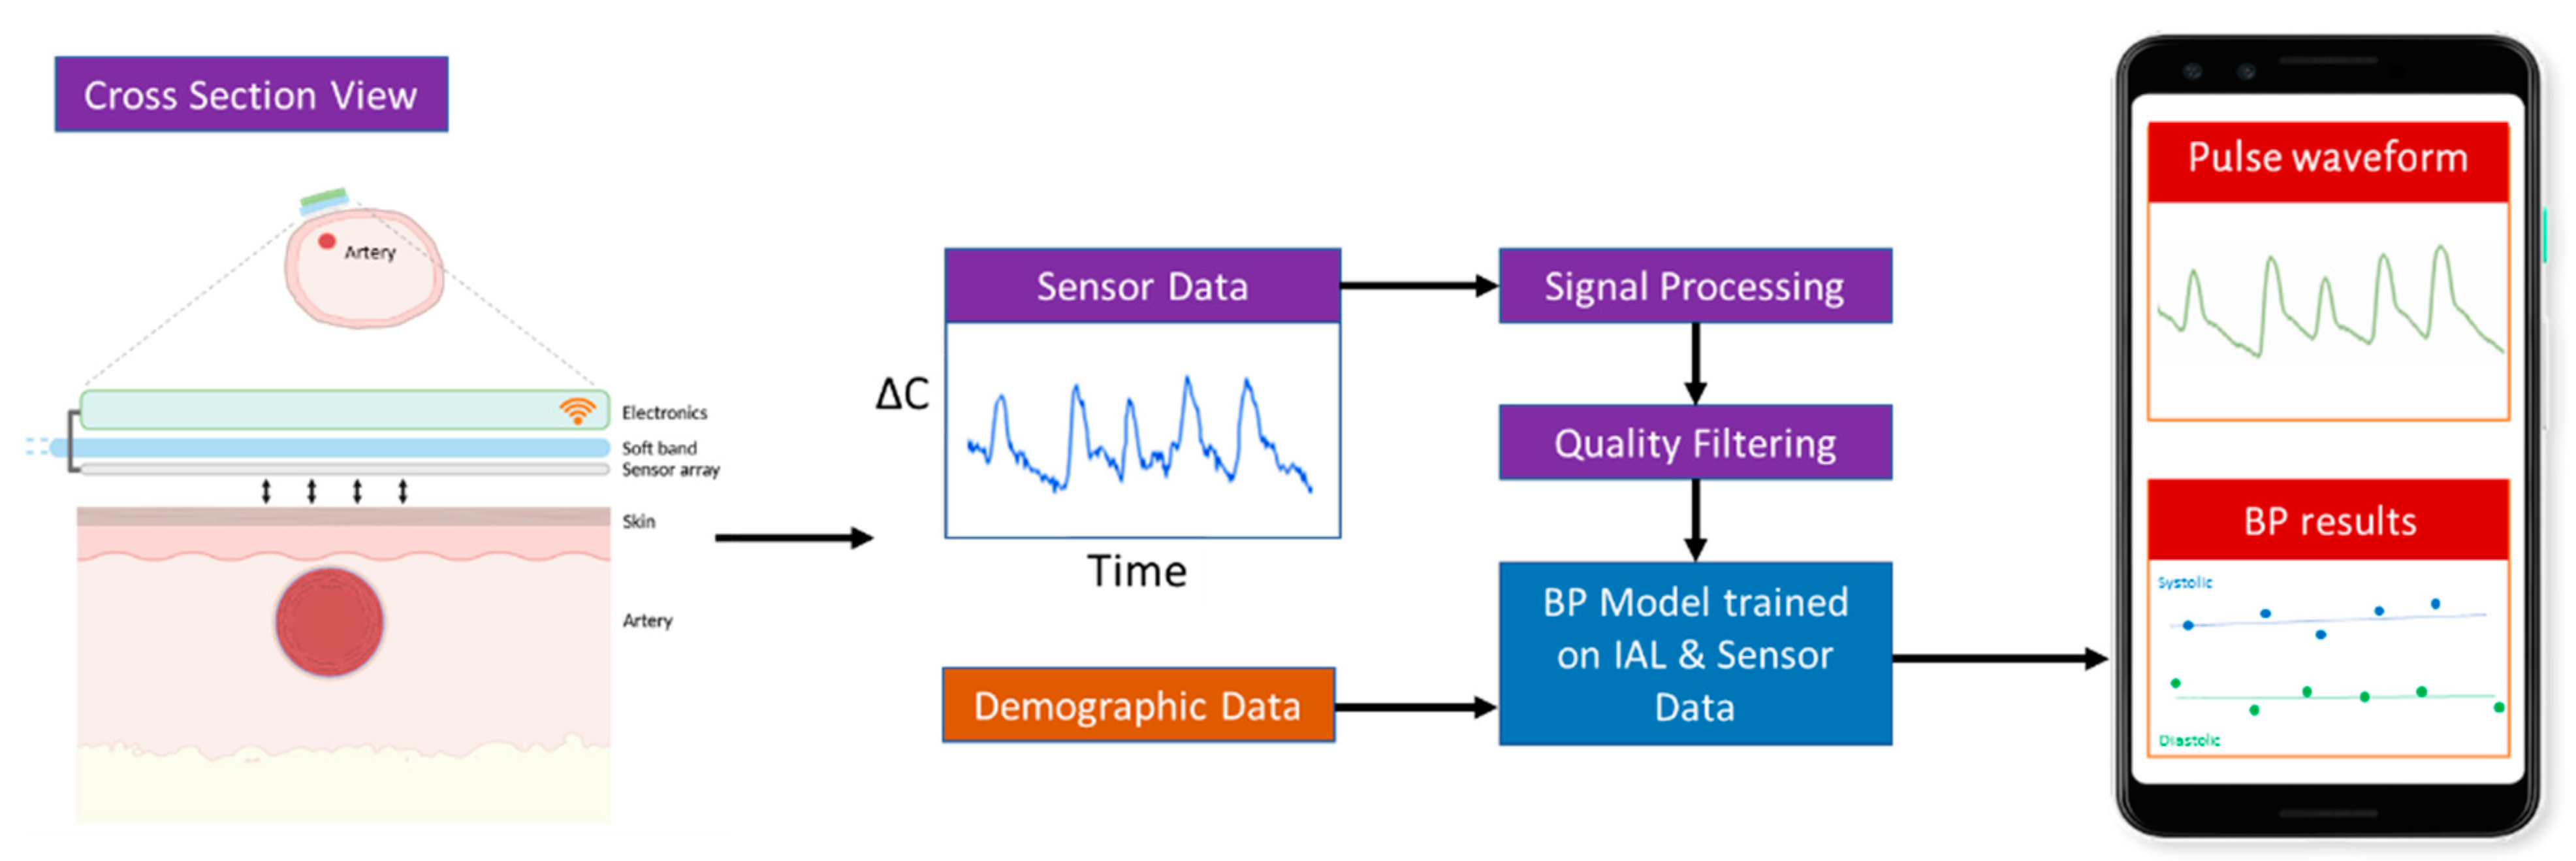
When the band is snugly wrapped around an infants’ wrist or foot, the sensor comes in contact with the skin that overlies the artery (
Figure 2). In this configuration, the sensor and skin function like a capacitor. Each arterial pulse displaces the overlying skin towards the sensor. This displacement alters the capacitance (∆C) of the system. With every pulse, the capacitance will fluctuate. This fluctuation in capacitance is sensed by the electronics and is displayed as a waveform (“pulse-waveform”). These unscaled pulse-waveforms directly correlate with arterial BP and are wirelessly transmitted in real-time to a mobile device uniquely paired with each sensor. The capacitance data are collected at 125 Hz, and estimated BP values are updated at approximately 1 Hz.
2.1.2. Pipeline for Real-Time Processing of Pulse Waveforms
The acquired pulse waveform data are streamed in real-time to a custom Android application (App). The App analyzes and displays the pulse waveforms (
Figure 2). The measured pulse waveforms require additional signal processing and the application of machine learning trained algorithms to derive the systolic, diastolic, and mean arterial pressure (SBP, DBP, and MAP). These processing steps are summarized in
Table 2.
2.1.3. Data Quality
To extract robust parameters for further analysis, the pulse waveform data must have sufficient quality. Raw pulse waveform data from both the IAL and sensor can be noisy for multiple reasons such as active or passive infant movement.
To evaluate the usability of the measured pulse waveforms signal, a visual metric,
|Qv|, was developed with a scale ranging from 0 (unusable) to 5 (best). This quality scale was based on a visual assessment of secondary peak resolution and the degree of signal noise by comparison to the corresponding IAL data according to a rubric. A training set of 10,000 pairs of Boppli/IAL pulse waveforms with
|Qv| and regression coefficients was used to train a convolutional ANN (CNN) model to automatically grade Boppli and IAL pulse waveforms. The outputs of this model are a quality metric
|Q| and estimated regression coefficient,
r. The methods used to establish data quality are described in [
8].
2.1.4. Signal Processing
To decrease noise and increase signal quality i.e., signal-to-noise ratio (SNR), a Butterworth bandpass filter (order 2) with limits of 0.1 to 20 Hz was used to remove baseline shifts, respiratory effects, and high frequency noise. For infants on high-frequency oscillatory ventilation (HFOV), a notch filter based on the ventilation frequency was used to mitigate the parasitic noise due to subtle motion of the patient.
2.1.5. Artifact Removal
Similarly, if the infant moves, the signal is momentarily distorted and that segment has low data quality |Q| and consequently cannot be used. Both IAL and sensor data were excluded if they did not meet the predefined |Q| and r. The IAL data were also required to have an SNR > 5 and to be within realistic ranges with a minimum value of 0 mmHg and maximum values of 200, 175, and 150 mmHg for SBP, MAP, and DBP, respectively. The pulse waveforms which met all these criteria were normalized and used to derive the SBP, MAP, and DBP with the BP model which was developed by using the process described below.
2.1.6. BP Model
The purpose of the BP model is to recognize and correlate certain characteristics of the shape of a pulse waveform to BP values. Once learned, the BP model can automatically infer SBP, DBP, and MAP from the pulse waveforms.
Training Data: To enable learning, we developed an arterial line BP training/learning database by collating de-identified, historical IAL waveforms of infants and pediatric patients previously admitted at Lucile Packard Children’s Hospital Stanford (Stanford) and Children’s National Hospital and Boppli sensor data collected from patients with arterial lines in place at Stanford. These patient data were associated with patient age and weight but were not labeled with a diagnosis. The IAL and sensor data were processed to improve the signal quality and curated to remove artifacts as described above to make IAL data more suitable for learning [
8].
Training database characteristics:
A total of 306 infants under 5-years-old in the historical database and 95 patients collected in this study, no exclusions, both sexes.
Up to 5000 pulse waveforms chosen randomly for each individual from a total of ~25,000 h of training data.
Same quality preprocessing metrics as the data from the Boppli sensor.
When the IAL and sensor data were taken simultaneously, the two data streams for each patient were synchronized pulse-by-pulse by correlating the amplitudes of the pulse waveform signals and heart rates for a set of high-quality windows randomly distributed across the entire time series to obtain a global time lag value. A local time lag was then determined for each individual window to compensate for any missing data. A database was created from the synchronized windows where ground truth BP values were generated from the IAL data and associated with the sensor data for each window.
We used this database to train artificial neural networks to ‘learn’ features from pulse waveforms which could be correlated to SBP, DBP, and MAP values extracted from the peaks, valleys, and areas, respectively, of the IAL pulse waveforms. Finally, the ANN model was validated (
Table 2, Step F) to ensure that it could perform well when presented with real-world data. Because of the limited amount of sensor data, 10-fold cross-validation (CV) sets were used (with 10% of the individuals with sensor data distributed into each CV set) where one set is held out as a test set while the nine other CV sets are used to train the model.
3. Clinical Study Design
The use of historical IAL data was approved by the Institutional Review Boards at Stanford University (IRB Protocol #47185) and at the Children’s National Hospital (IRB Protocol # Pro00014876). The observational study was approved by the Institutional Review Board at Stanford University (IRB Protocol #45892) and conducted in the neonatal (NICU) and cardiovascular intensive care units (CVICU) at Lucile Packard Children’s Hospital Stanford. The study complied with all relevant ethical guidelines for human subject research. Written consent was obtained from the parents of the study subjects prior to partaking in the study. We excluded those infants who were facing imminent demise and those undergoing extra corporeal membrane oxygenation (ECMO). After parental consent, we enrolled infants with umbilical arterial catheters (UACs) or peripheral arterial lines (e.g., radial, femoral, posterior tibial, axillary, or ulnar). The Boppli sensor was placed on an available wrist or foot with the sensor array overlying a pulse point. The wirelessly transmitted pulse waveforms were visualized in the App on a mobile device. The mobile device was kept in close proximity to the patient but not available to the clinical team. This was undertaken to ensure that clinical decisions were not made on the basis of the Boppli readings during the conduct of the clinical study.
3.1. Arterial-Line Data Collection
The catheter (UAC or peripheral arterial line) was connected to an electronic transducer for measuring continuous IAL BP. Measured BP waveforms sampled at 125 Hz were displayed on a Philips Intellivue (Philips Medical Systems, BG Eindhoven, The Netherlands) and stored in the Stanford data warehouse. The IAL data corresponding to each study subject was pre-processed as described above to improve quality and usability.
Correlation and Accuracy Metrics
Finally, we determined if the inferred, sensor-based BP (SBP, DBP, and MAP) correlated with BP from the IAL. Since the eventual clinical use of this device is to be determined by the US Food and Drug Administration (FDA), we compared the Boppli results to the accuracy specifications recommended by the FDA, i.e., a mean average error (MAE) < ±5 mmHg and standard deviation (SD) < 8 mmHg [
14].
4. Results
The demographics for 81 infants enrolled in this study are shown in
Table 3. These infants were admitted with a wide range of pathologies but were generally normotensive during the period of the study.
Table 4 describes the characteristics of the invasive arterial line data.
Table 5 provides characteristics of the IAL and Boppli placement locations. The gauge of the catheters used also varied (data not shown). Only patients with a weight below 5 kg and at least ten high-quality pulse waveforms were included in this analysis.
4.1. cNIBP (Sensor)
The average length of data collection was eight hours per patient, with a minimum of 10 min and a maximum of 14.5 h. The total length of sensor data examined was ~750 h. The data recording was stopped when the arterial line was removed, when the battery ran out (~13–15 h), in anticipation of a procedure, or if the band was removed in error. In some cases, the band was removed or slipped to an incorrect position during extended periods of time, and only poor-quality data were collected during those periods.
4.2. Degree of Agreement
Bland–Altman analysis [
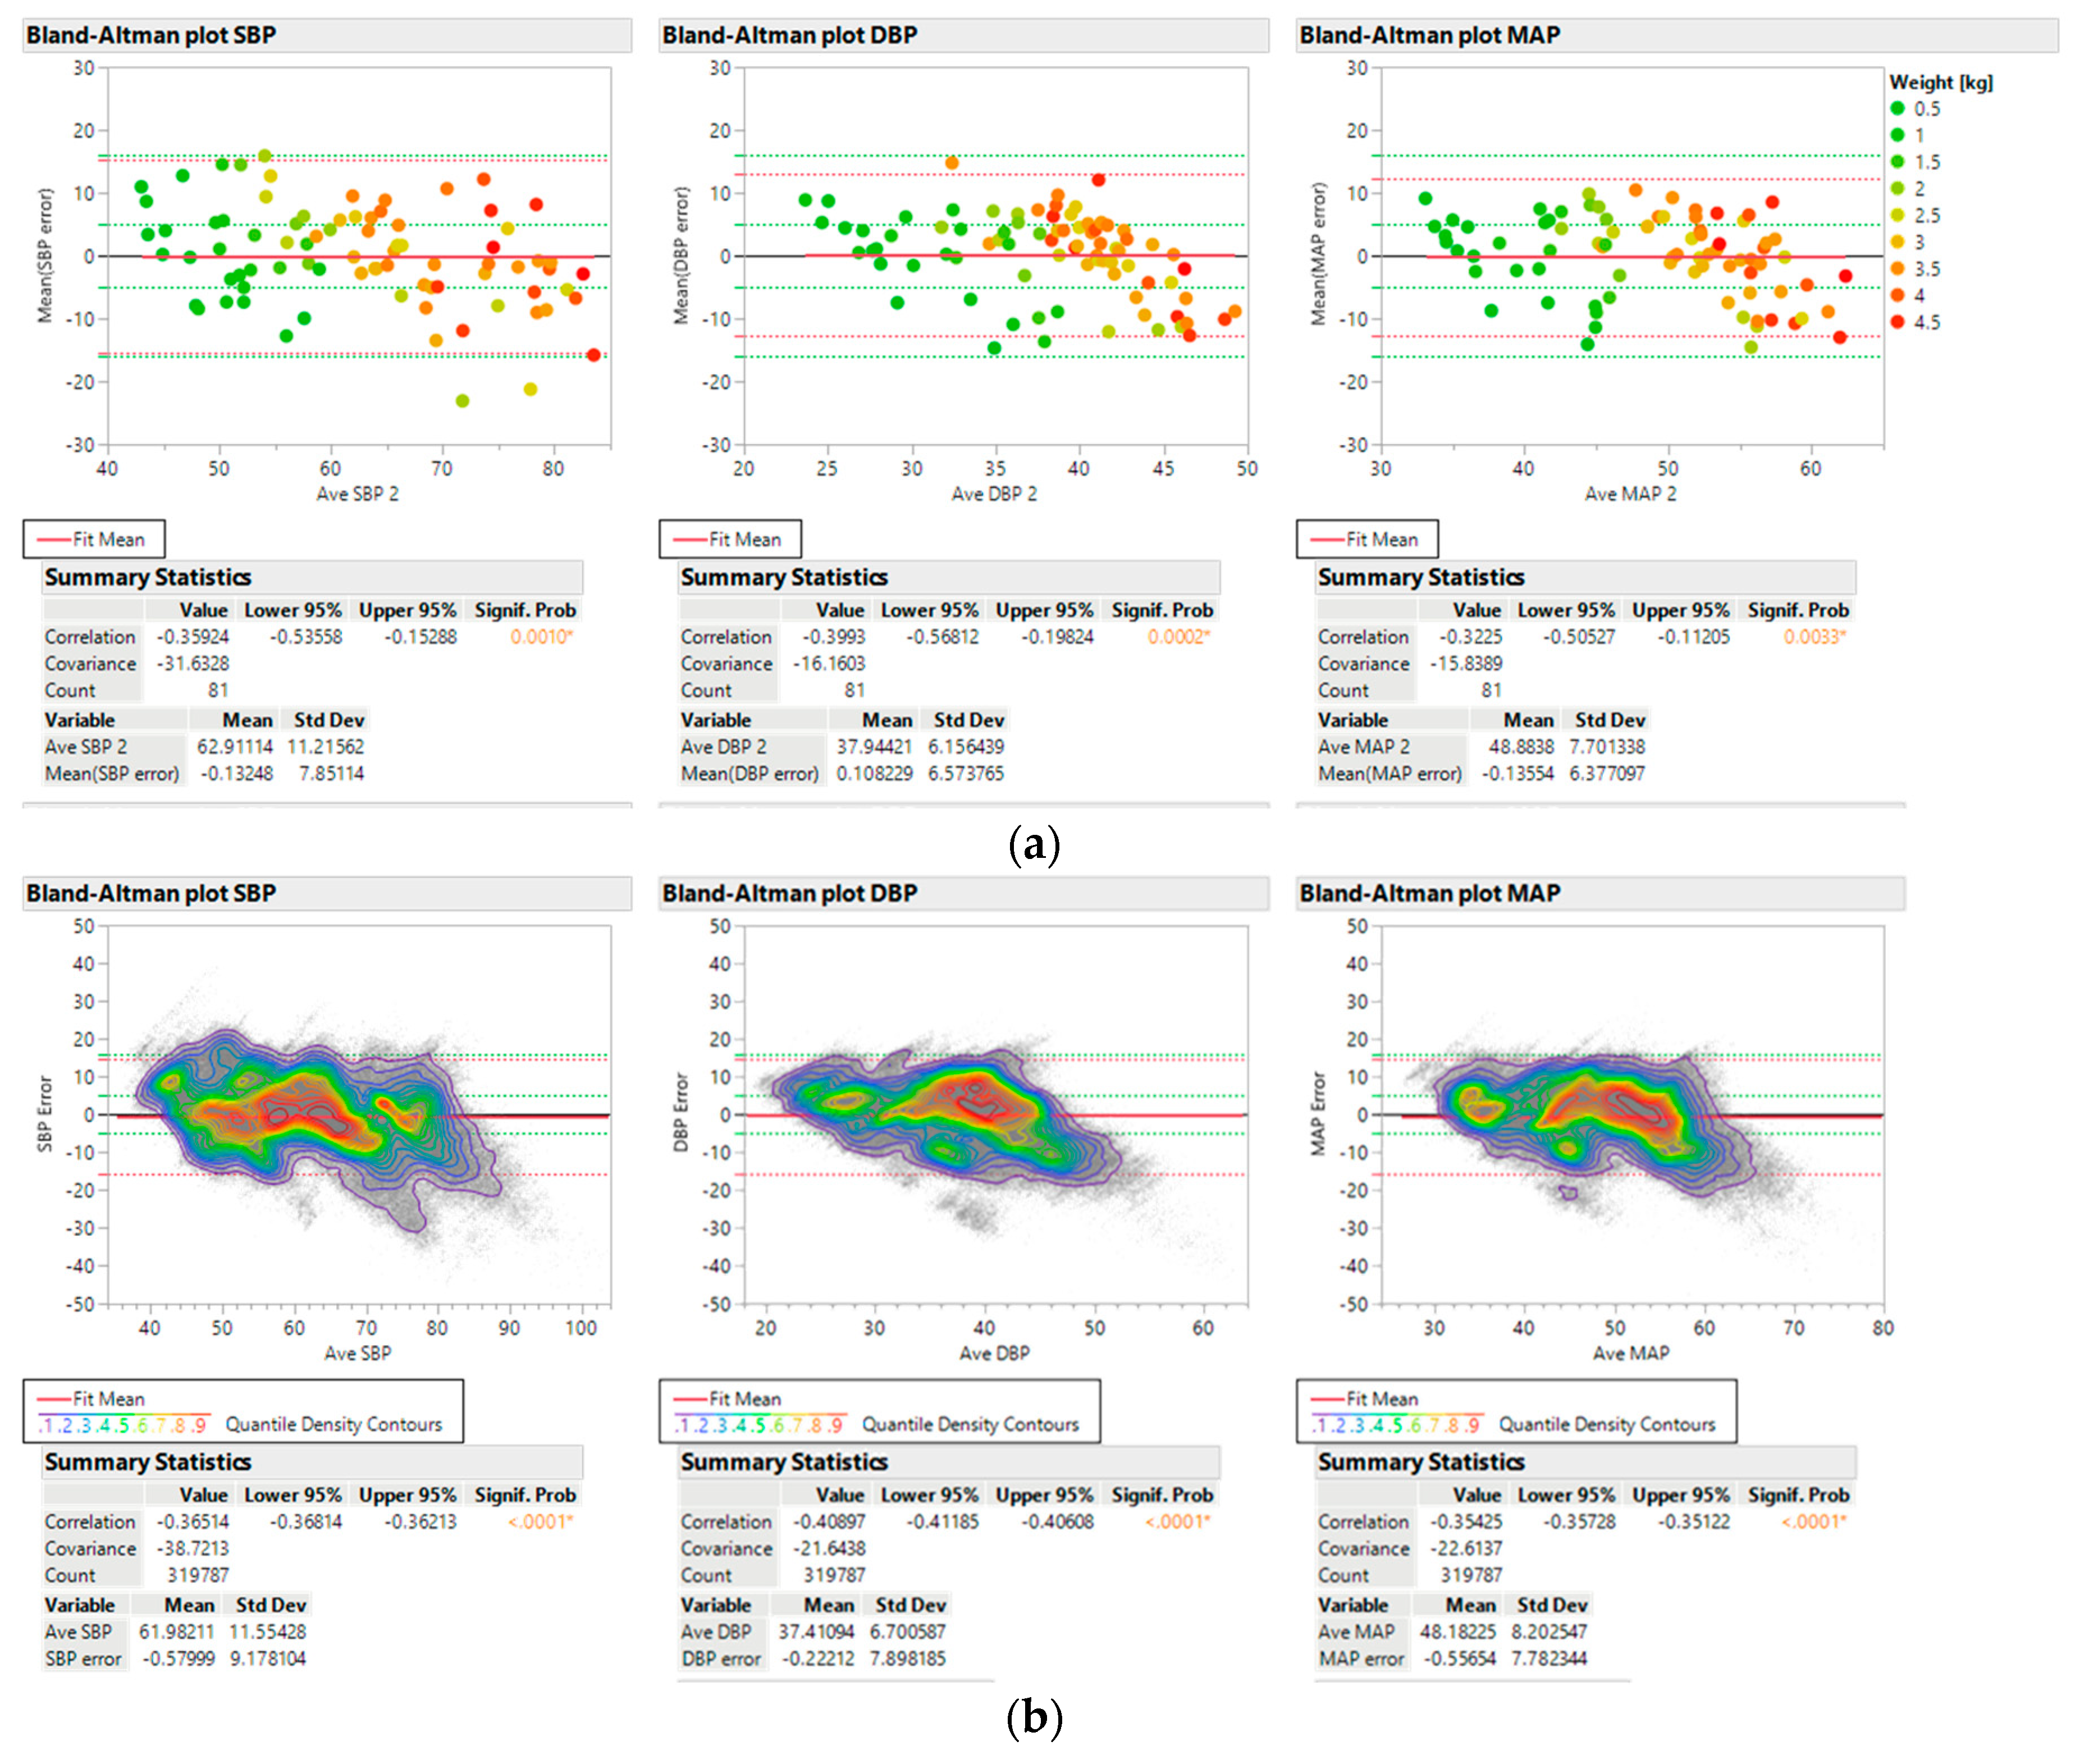
15] for the mean difference between predicted BP (SBP, DBP, and MAP) and A-line BP demonstrates that SBP, DBP, and MAP predictions are within the FDA specifications when the sensor data
|Q| > 2.5 and when averaged across each individual to account for the different number of data points per individual (
Figure 3a). These analyses were performed in accordance with the guidelines for new BP devices provided by the American National Standards Institute/Association of the Advancement of Medical Instrumentation (AAMI)/International Organization of Standardization (Association for the Advancement of Medical Instrumentation and American National Standards Institute 2003). Predicted values were obtained from the pulse waveform data with the additional inputs of patient age and weight at the beginning of data collection. The points are color coded by patient weight and do not show a systematic trend of error with patient weight or BP values.
Bland–Altman plots with all derived data points without averaging are also shown with contour lines indicating point densities in
Figure 3b. Again, the MAE specifications are met for SBP, DBP, and MAP and there is no systematic trend in error with BP values. However, all three BP values show increased variance and SBP does not meet the SD criterion.
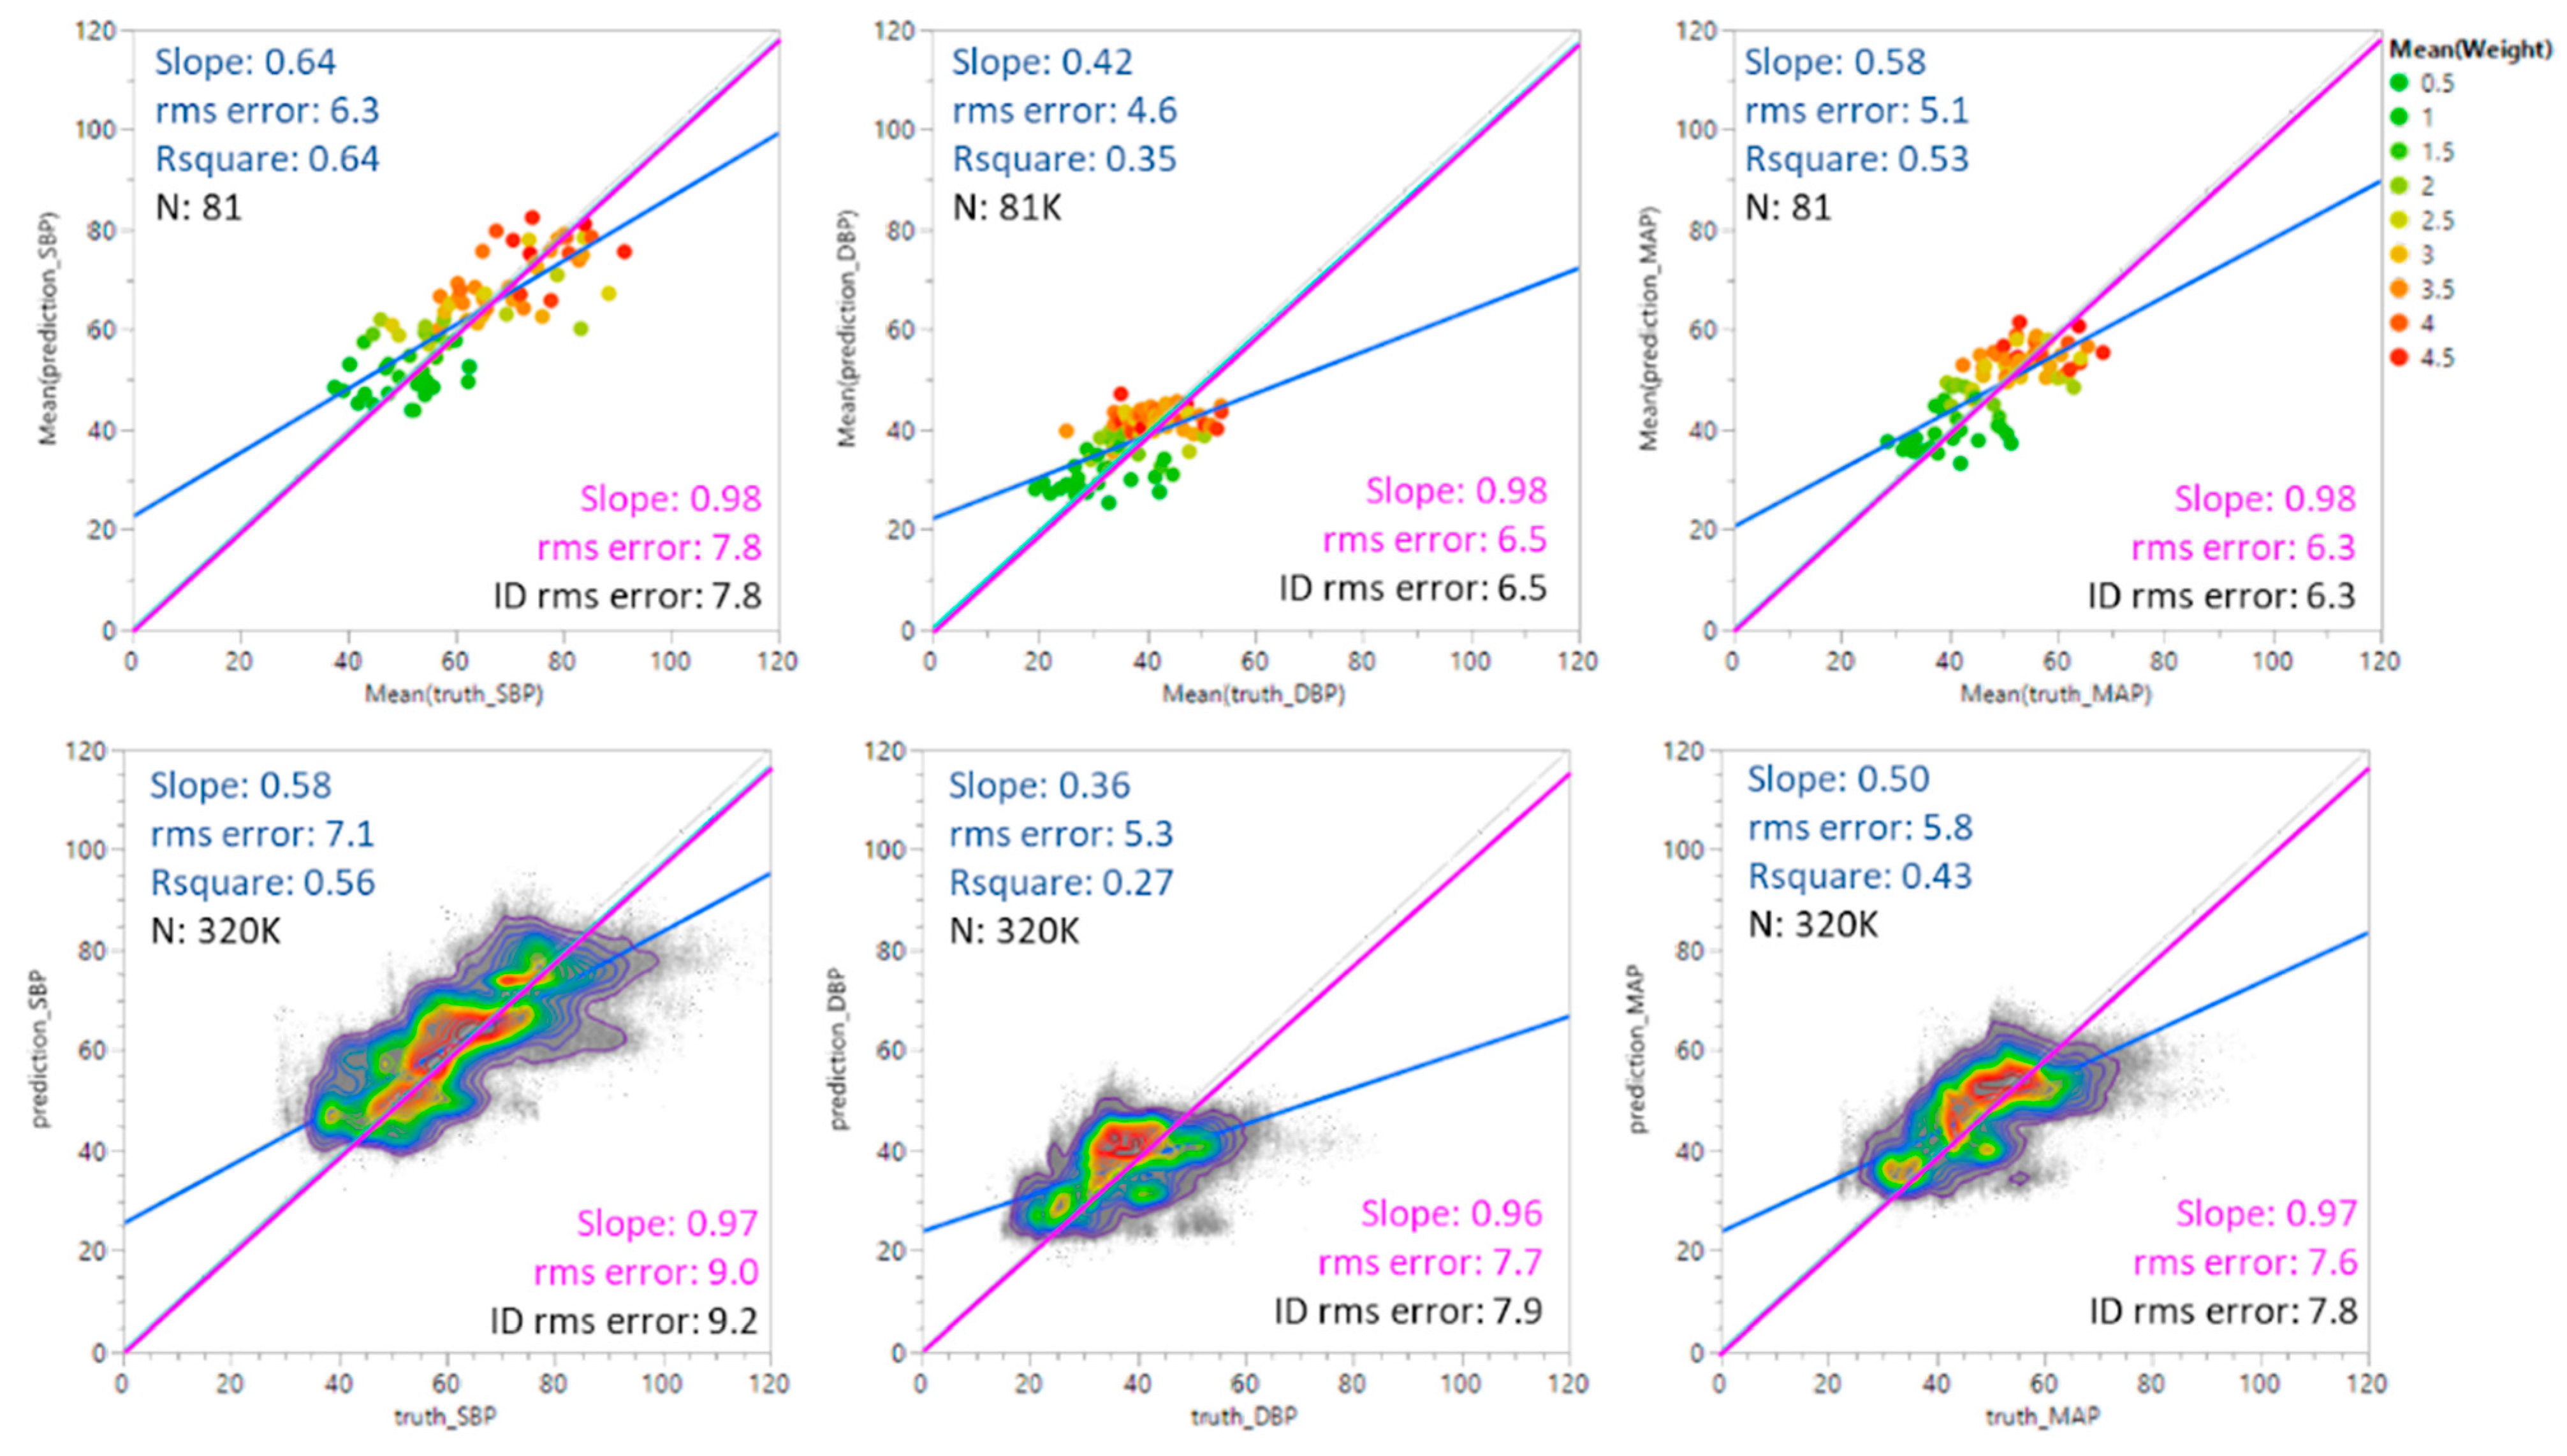
Figure 4 shows predicted SBP, DBP, and MAP values plotted against ground truth values. The top set of plots shows the results for average values weighted by individual; the bottom set shows all predicted values without averaging. Three linear fits are shown in each plot. The blue line shows the unconstrained fit to the data. The green line shows the fit of the data when the intercept is constrained to be 0. The grey line indicates the ideal (identity) case where predicted values equal the ground truth values with a slope of 1 and an intercept at 0. The root mean square (rms) errors are included for each fit for comparison.
Table 6 summarizes the degree of agreement for SBP, DBP, and MAP.
4.3. Effect of Gestational Age
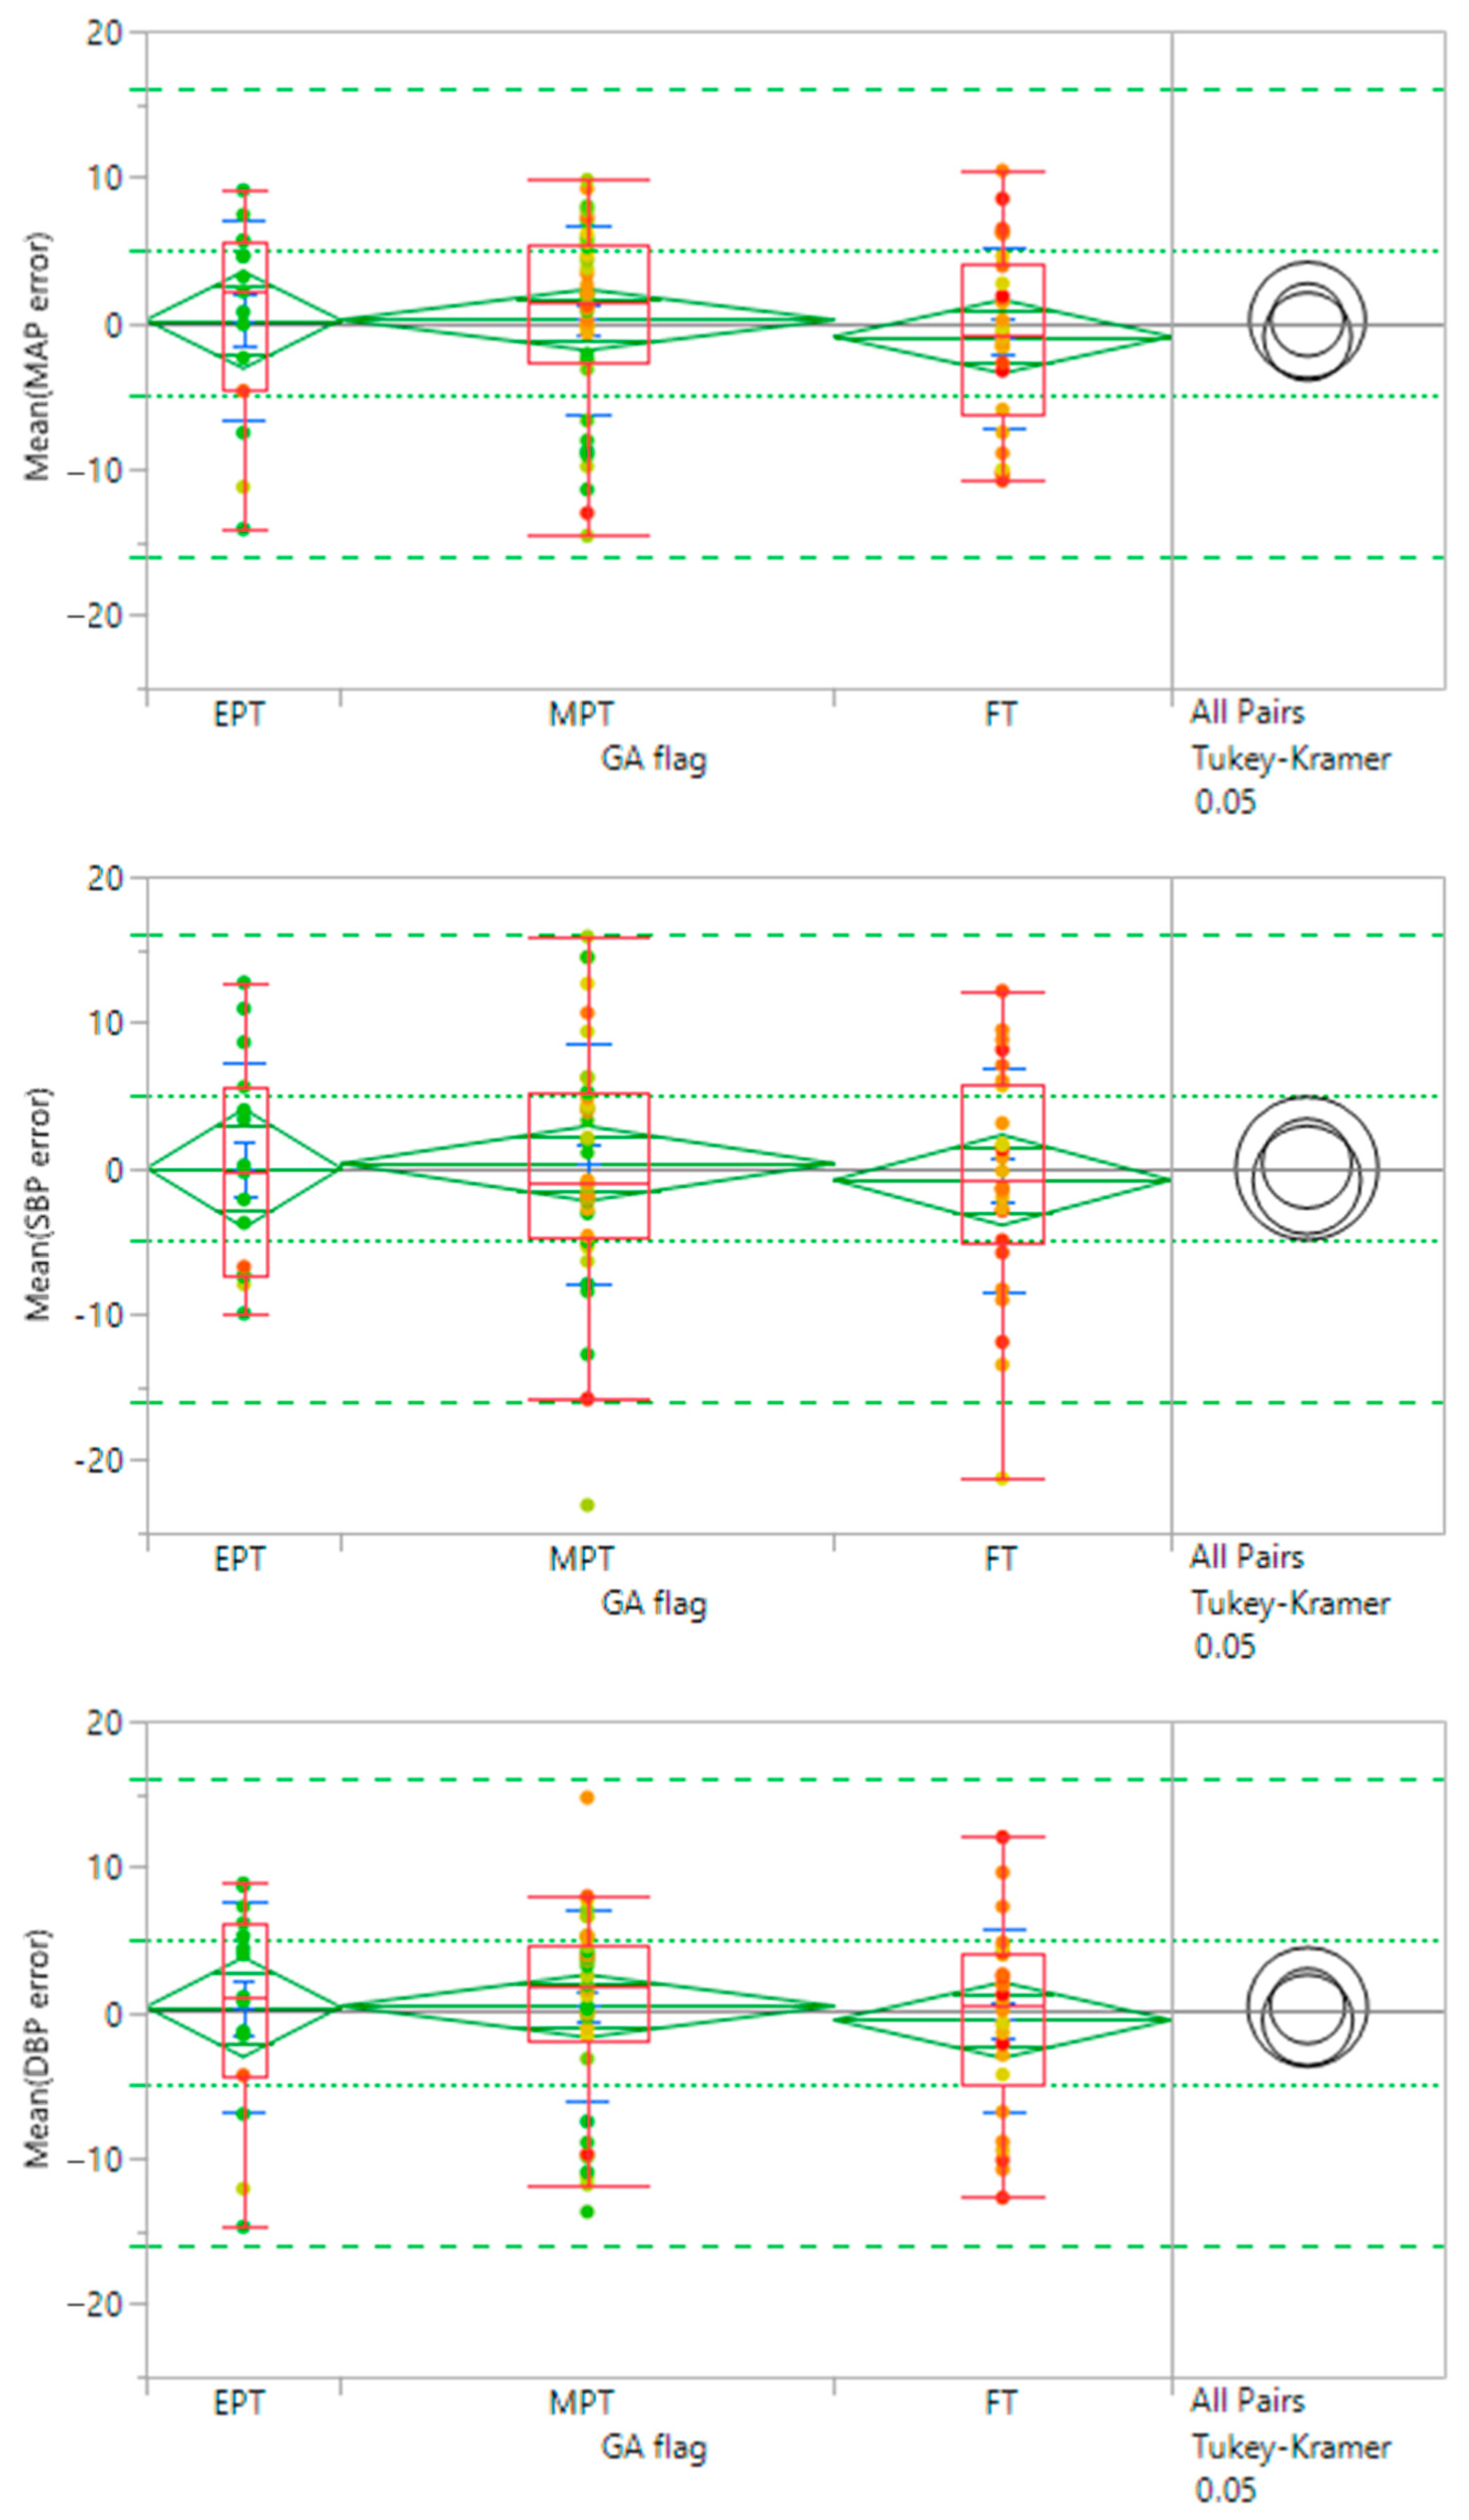
Table 7 summarizes the MAE and SD values for the study population by gestational age at birth (GA) to understand if the BP algorithm is generalizable across the range of GAs found in NICU patients less than 5 kg in weight. The population was separated into three categories of GA: <28 weeks (extremely preterm, EPT), 28–37 weeks (moderately preterm, MPT), and ≥38 weeks (full-term, FT). These categories correspond to the extremes of gestational age as defined by the World Health Organization [
1,
4]. For MAP and DBP, all subsets meet the efficacy specification of MAE ≤ ±5 mmHg, SD ≤ 8 mmHg. SBP meets the MAE criterion for all subsets but the MPT subset does not meet the SD criterion.
The differences in accuracy between the GA groups were evaluated using the Tukey–Kramer analysis on JMP, a statistical package from SAS. This is a variant of the Tukey HSD method and uses SDs when there is an uneven number of data points per test period. Due to the range of data collection periods and variations in the quality of both IAL and Boppli data with time, the number of points varied by individual.
In the Tukey–Kramer (Tukey HSD) analysis, a letter code is assigned to each test group which can be used to gauge the statistical significance of differences between pairs of test groups. If the comparison of a pair of test groups did not exceed the threshold of significant difference, they were given the same letter code. If the analysis of their SDs exceeded this threshold, they were assigned different letter codes. A given test group may have multiple letter codes if it did not exceed the threshold of significant difference with several other test groups but some of the others differed significantly from one another and thus were given different letter codes. Pairs are considered significantly different if they do not share a letter code. The broader the difference between letter codes between a pair of test groups, the higher the likelihood that the pairs are significantly different. In
Table 7, all groups show the same letter code and thus there does not appear to be a significant difference between GA groups.
Figure 5 shows the comparison results for the three GA categories of infants. Data points are colored by patient weight at the time of the study. A good overlap between the mean diamonds (green) and the Tukey–Kramer circles (black) indicates there is no significant difference between the GA groups. All subsets show MAP, SBP, and DBP mean values within the specification for accuracy (green dotted lines at ±5 mmHg error) and the 95% confidence level (green dashed lines at ±16 mmHg). As such, there does not appear to be an impact of gestational age on accuracy. Similar analyses show no significant trends in efficacy due to age, weight, race/ethnicity, IAL location, or Boppli location.
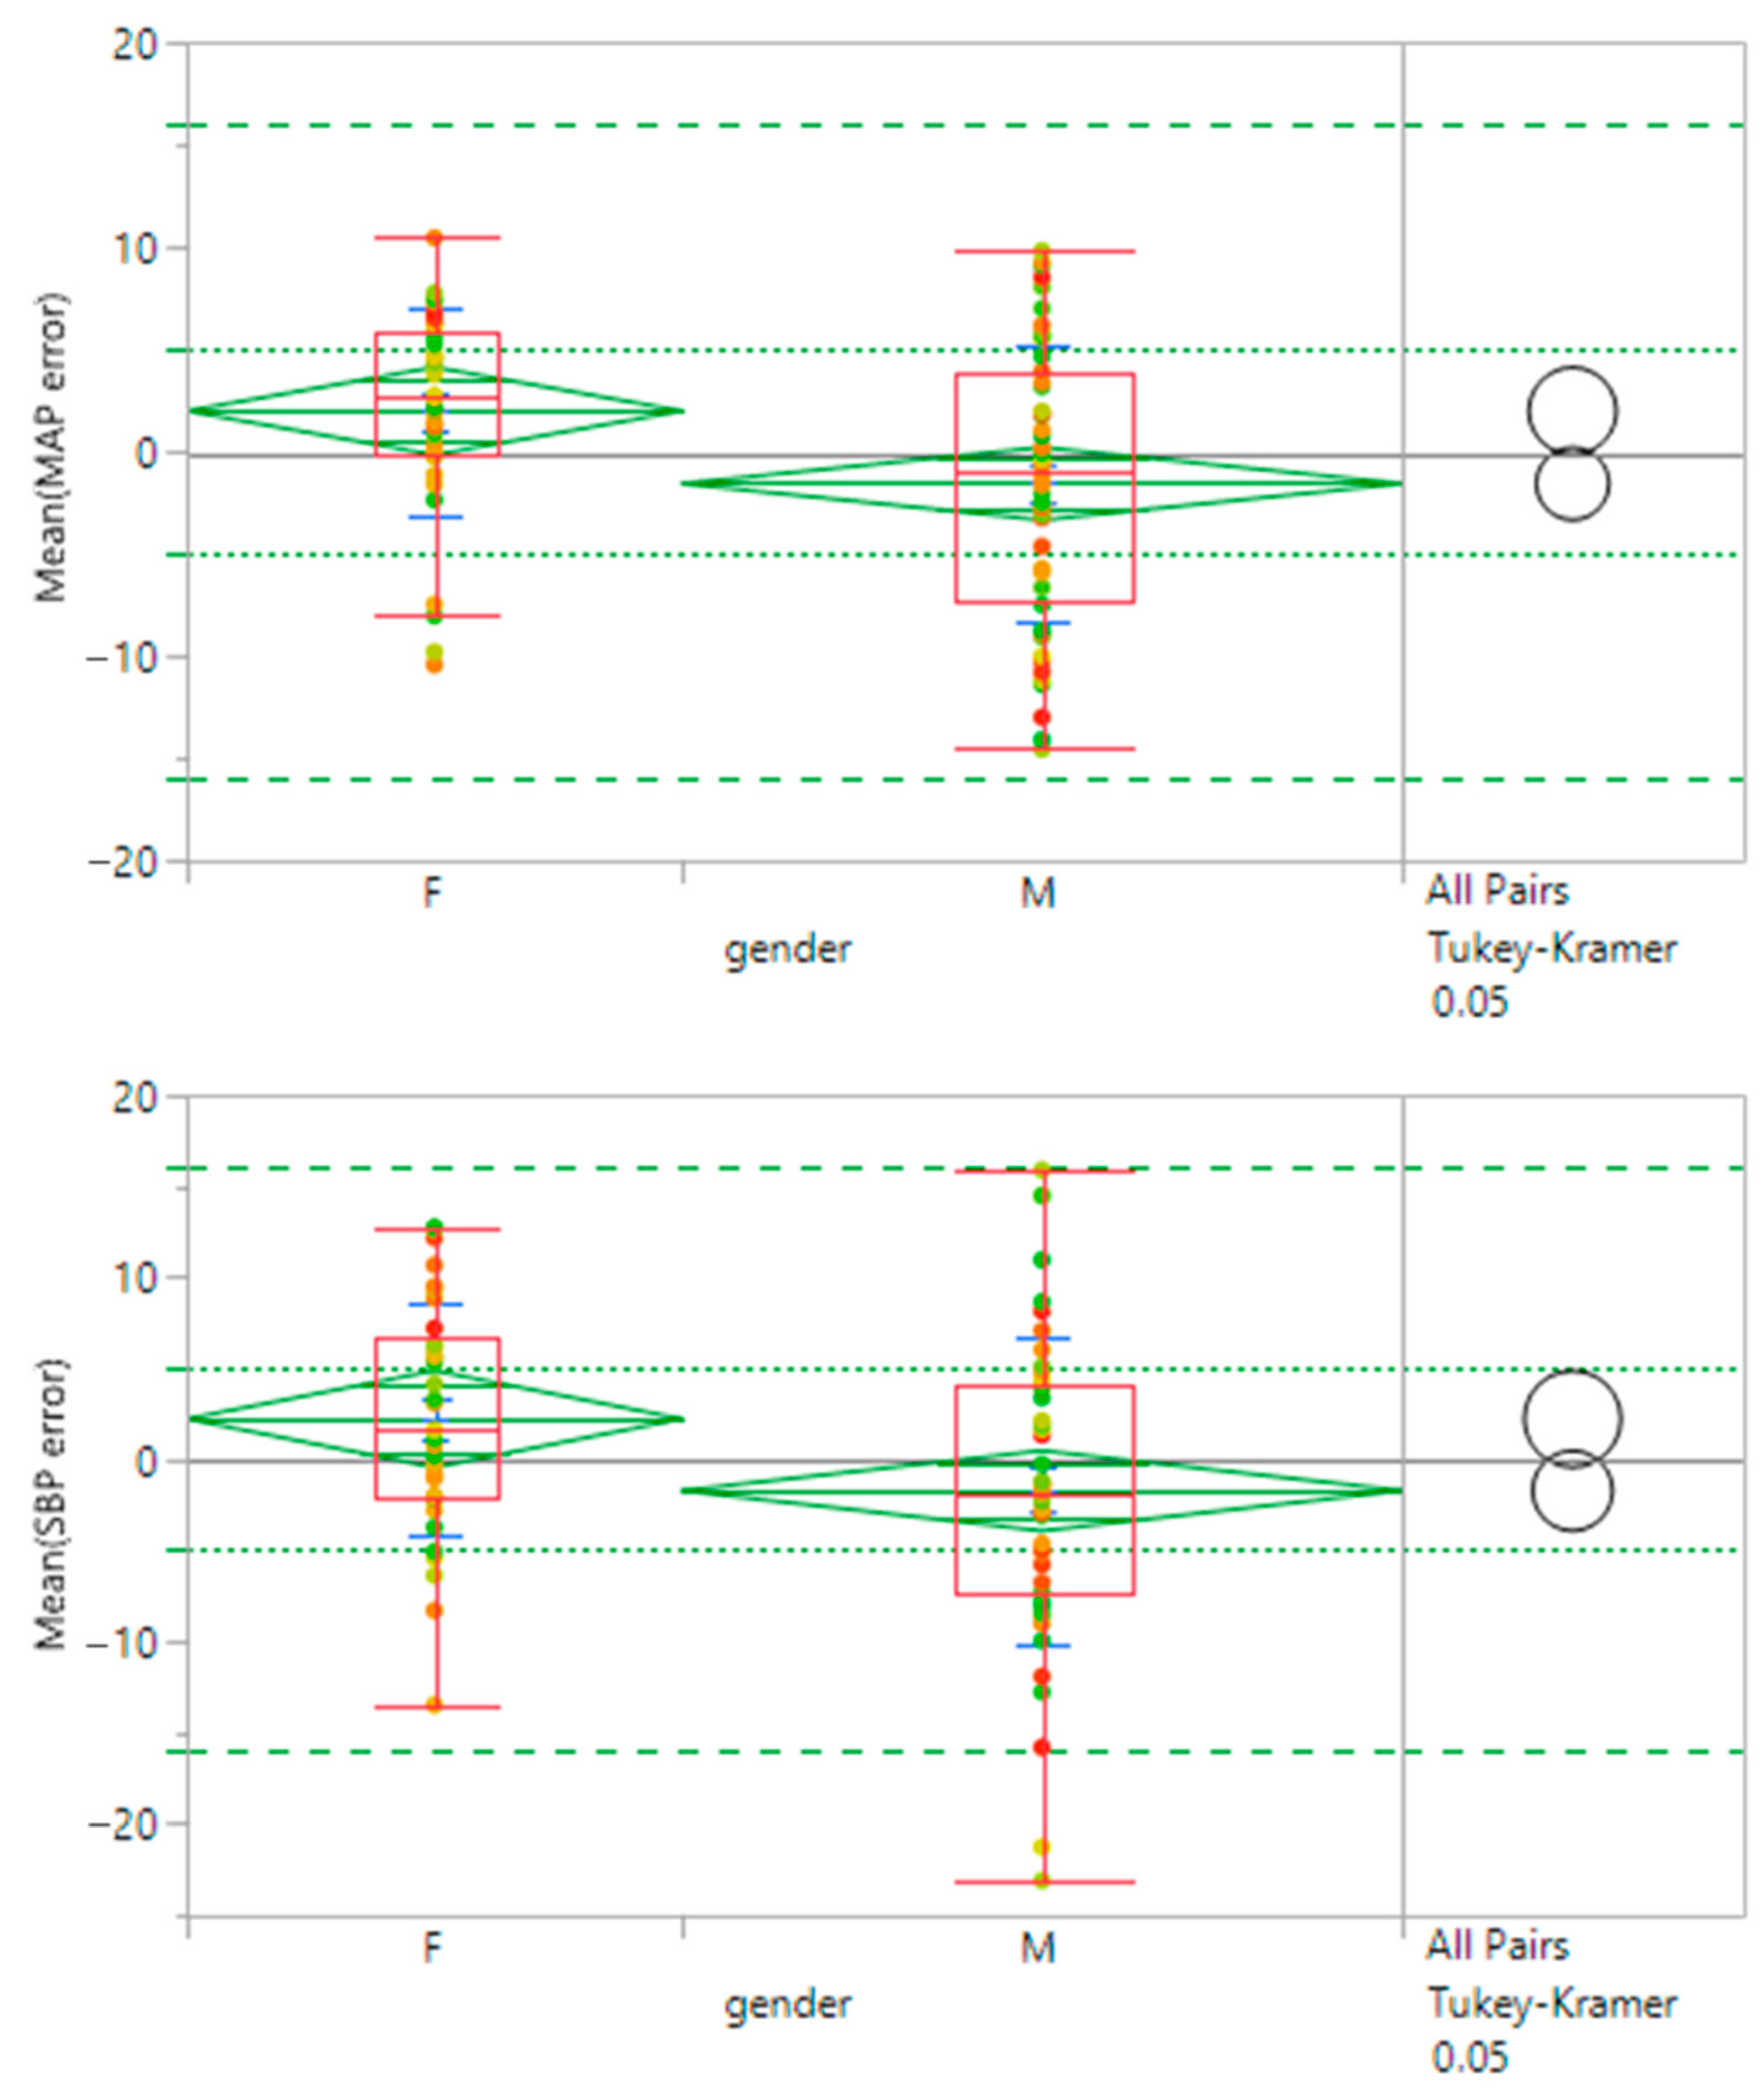
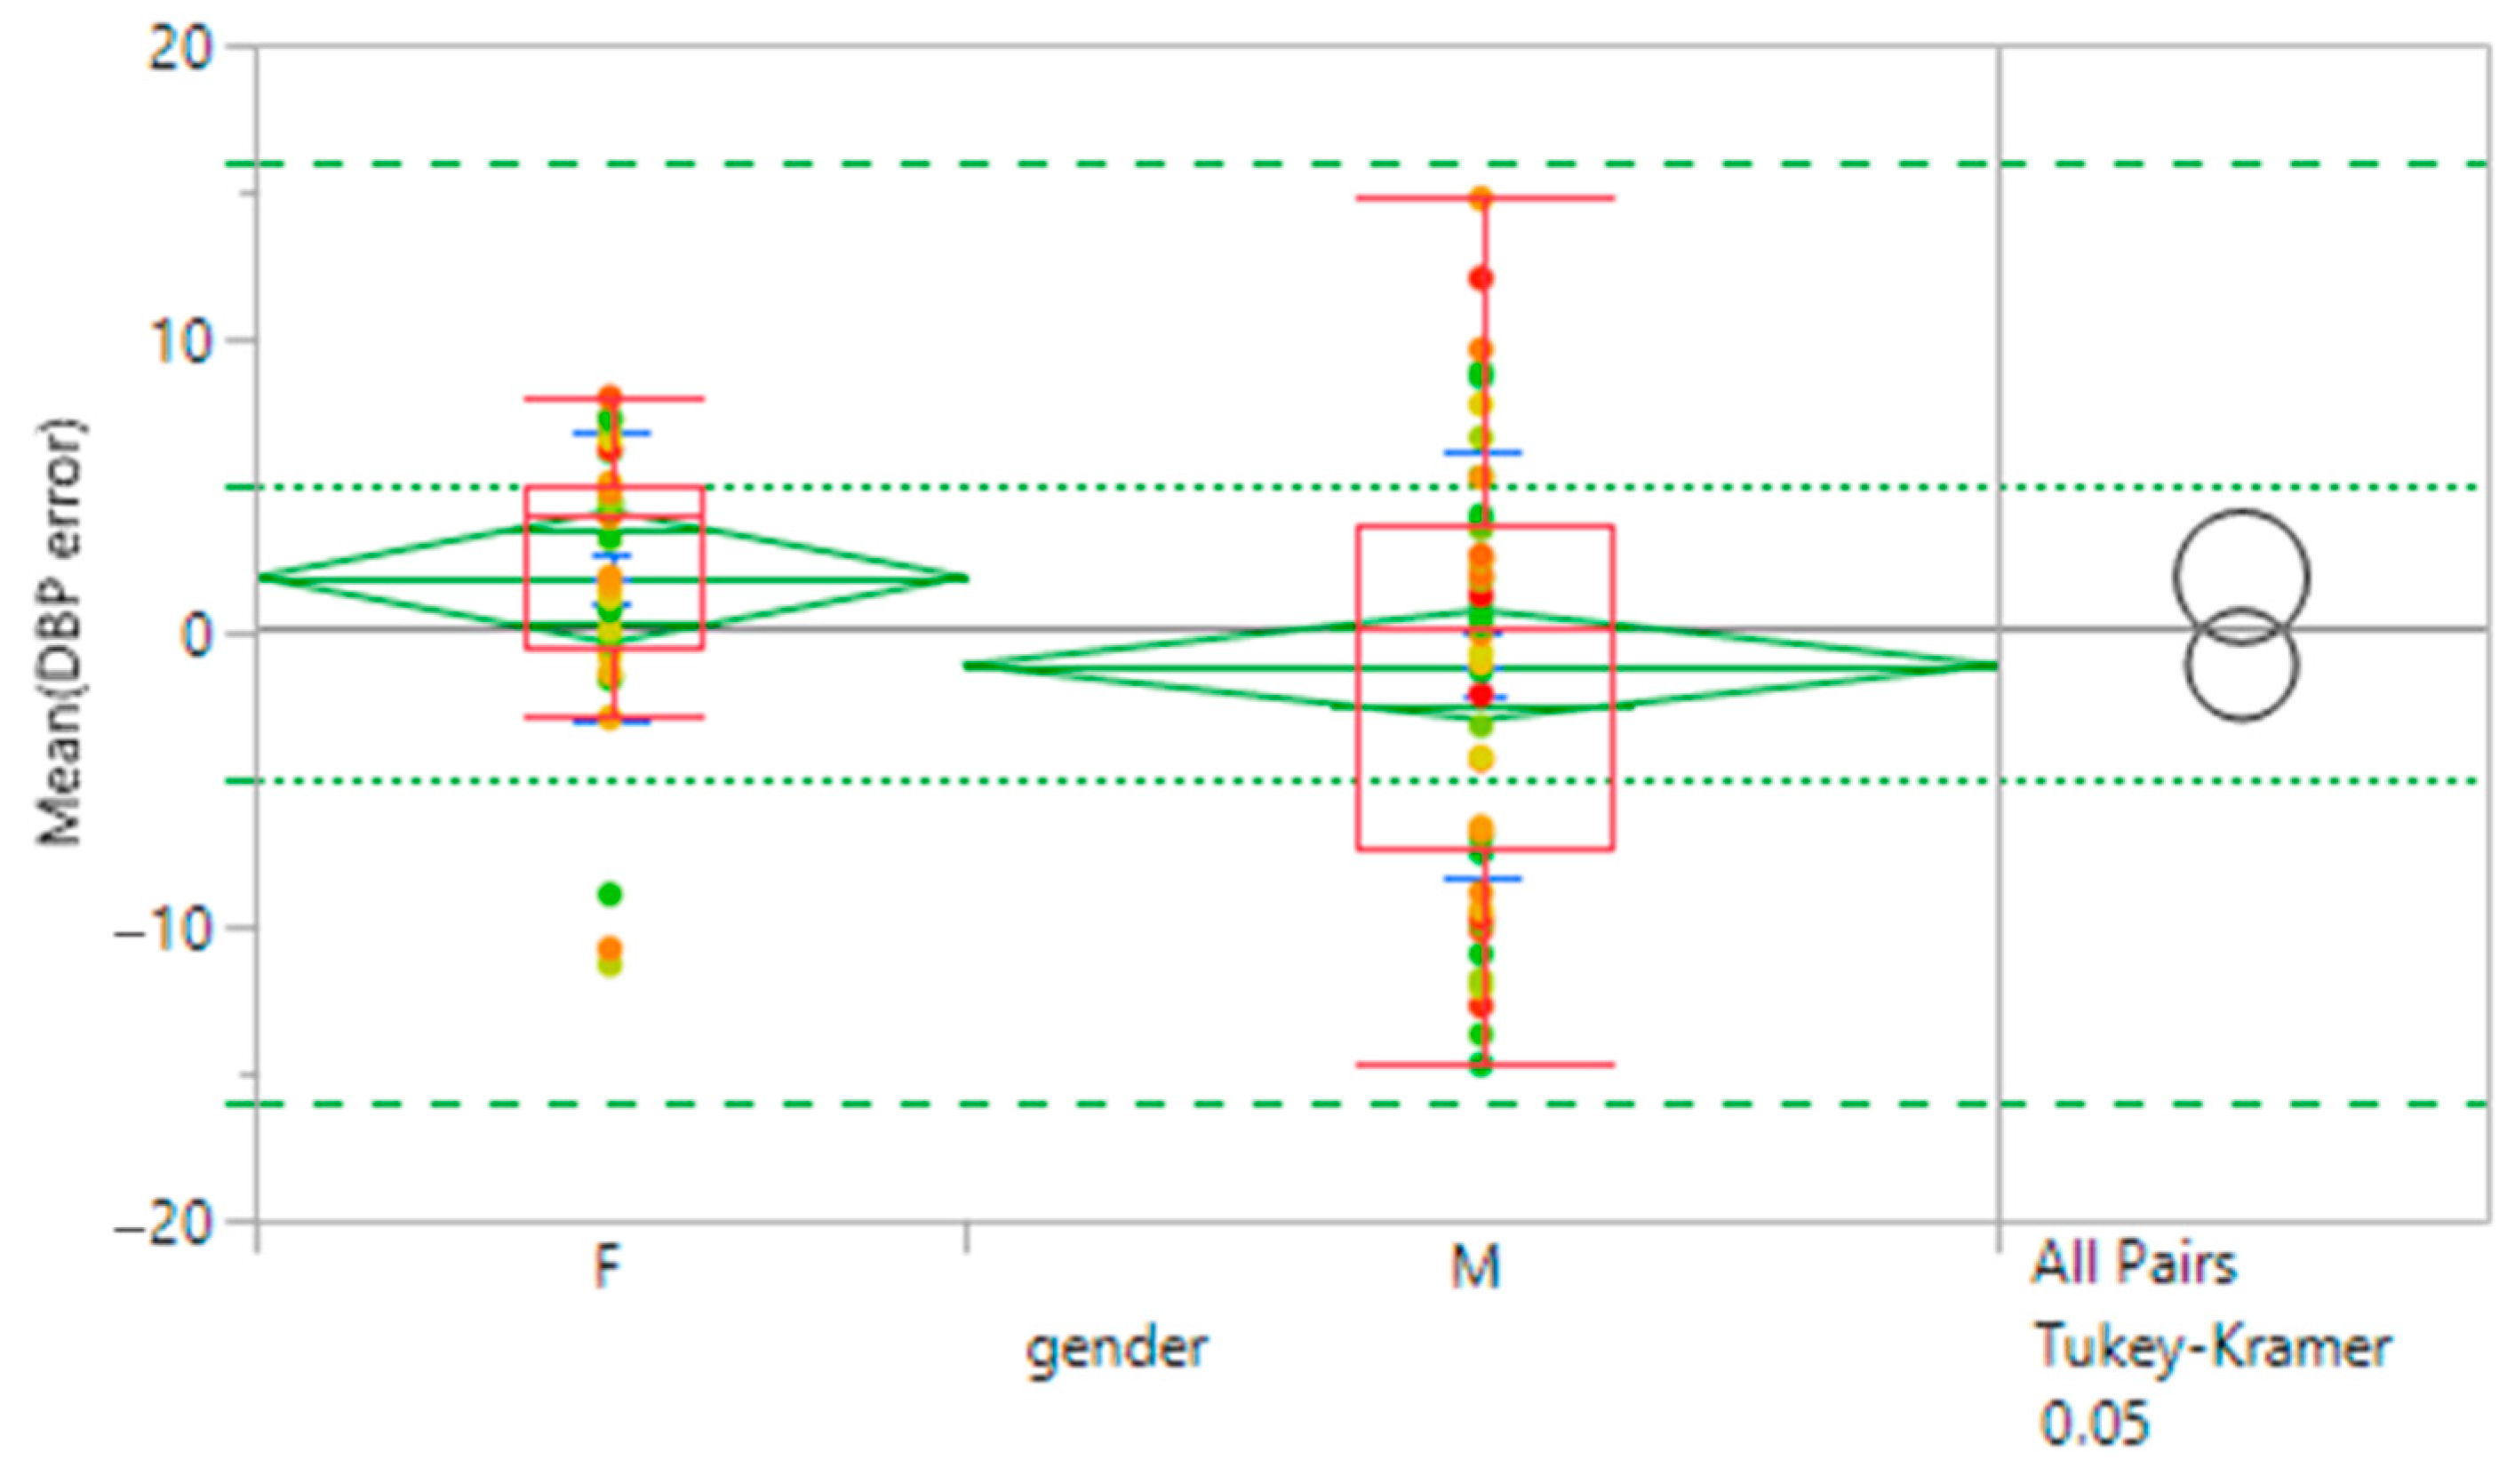
There is some indication of a significant difference due to sex although the results for both male and female cohorts meet the accuracy (MAE) guidelines. There is more variance for the male subset which exceeds the target of SD ≤ 8 mmHg for SBP. The results are shown in
Table 8 and
Figure 6.
5. Discussion
A non-invasive approach to monitoring BP is a vital unmet need in neonatal critical care. Currently, there are no commercially available neonatal cNIBP devices. Solving this unmet need can provide better, safer BP monitoring for the ~400,000 NICU patients annually in the U.S. [
16] and avoid the pain, stress, and risks of IALs. The novel Boppli cNIBP device can continuously and non-invasively infer BP without the need for external calibration. This is significant because it reduces the nursing burden at the bedside. The device does not use adhesives, which is relevant for premature neonates who lack a protective layer in the skin, i.e., stratum corneum [
17]. It is less perturbing to the patient than an IAL, cuff, or other bulky non-invasive options. This device can be strapped on like a wrist-watch and can be used while transporting patients. The electronics can be reused to a lower cost of care. Consequently, this device can change the management of neonates by avoiding arterial line placement in neonates who strictly need monitoring for BP issues.
A few prior studies have suggested that non-invasive methods of BP overestimate invasive arterial lines [
18,
19]. These studies used intermittent, cuff-based methods unlike the continuous, non-cuff-based method described here. Other studies have shown good agreement for non-invasive methods of BP measurement [
5,
20]. We expect that this device, once cleared by the FDA and adopted for clinical use, will potentially eliminate the complications associated with invasive arterial lines. This transition will pave the way for enabling continuous non-invasive monitoring, early detection of changes in BP, timely intervention, and tracking of the response to treatment. Although this study focuses on neonates, the technology platform is applicable to all age groups, and limited only by the availability of arterial waveform data for building neural network models.
The study had limitations. All enrolled neonates were critically ill but were normotensive. We acknowledge that the utility of this device and its accuracy is of utmost value in hypotensive patients and such a study is intended in the future. The correlation between a gold-standard arterial line and cNIBP sensor can depend on the precise location of the arterial line. We have not accounted for this issue in the current study. Critically ill infants often have fluids running through their umbilical lines. This can dampen the observed and recorded signals. Comparing the cNIBP signal from a limb to a presumably corrupted waveform, deemed as a “gold-standard” can be inaccurate. Another limitation is due to the blinding of the data to the clinical team which led to periods of time where the data quality was insufficient for analysis. In future studies, we will display the pulsewave to the clinical team to provide a visible cue of data quality. We have observed that the fraction of data with usable quality increases when the clinicians are able to see the Boppli signal in real time.
Our study also has strengths. First, we demonstrated the accuracy of the device in estimating BP in real-world ICU settings and in infants with a wide variety of clinical conditions. Additionally, capturing unscaled data is innovative because it overcomes the need to calibrate for skin type, edema, patient size and shape, sensor positioning, and temperature sensitivity. The BP model was generated with data obtained from 306 patients. We believe that additional data can refine the algorithms and increase accuracy. In several instances, IAL data were distorted due to over/underdamping and artifacts from transducer flushing, kinking of catheters, movement artifacts, BP cuff inflations, and high frequency oscillatory ventilation. However, using filtering techniques, we have extracted underlying cNIBP waveforms. This work is novel and significant because it can impact clinical practice and simultaneously enable real-time analytics [
21].
6. Conclusions
This study is significant because it addresses a critical gap faced by clinicians treating infants in the neonatal period. We have investigated the accuracy of a novel wearable device that utilizes capacitive sensing and algorithms trained through machine learning in tandem to infer BP, continuously and non-invasively, without external calibration. We showed that the use of the device is feasible for critically ill term and preterm infants with a wide variety of pathologies—from serious cardiac ailments, pre- and post-operative cases, neurologic conditions, and prematurity. The ANN model used in this study is one of several models we have developed to estimate BP in real-time without the need for calibration. The wearable meets the FDA specifications for accuracy and is a practical choice in clinical settings—it is easy to attach and operate and provides continuous BP readings with no latency. A pivotal multi-center study to assess accuracy and submit data to the FDA for device clearance is underway.
Author Contributions
Conceptualization, X.Q., A.R., W.R. and A.H.; methodology, X.Q., A.R., C.R., A.V. and A.H.; software, T.R., J.L., W.L. and A.W.; validation, A.R. and X.Q.; formal analysis, X.Q., J.L., T.R., and W.L.; investigation, X.Q., A.R., T.R., and W.L.; resources, X.Q., A.M. (Arthur Muir) and W.L.; clinical data collection, F.E.-A., Y.W., A.R., E.B., A.M. (Alexandra McMillin), N.S., X.Q. and A.J.; data curation, E.H., W.L., X.Q., A.R., A.W., G.G. and R.B.G.; writing—original draft preparation, X.Q. and A.R.; writing—review and editing, J.L., T.R., W.L. and K.D.; visualization, X.Q. and A.R.; supervision, X.Q. and A.R.; project administration, X.Q. and A.R.; funding acquisition, X.Q. and A.R. All authors have read and agreed to the published version of the manuscript.
Funding
This project was partially funded by NIH SBIR 1R43HD101175, Children’s Research Institute’s Pediatric Device Consortium grant funded by the Food and Drug Administration (P50FD006430), a Southwest Pediatric Device Consortium award, and a Stanford’s Maternal and Child Health Research Institute Grant. The sponsors had no role in the design, execution, interpretation, or writing of the study.
Institutional Review Board Statement
The studies were conducted according to the guidelines of the Declaration of Helsinki and approved by the Institutional Review Board of Stanford University (Protocol #45892 and #47185) and the Institutional Review Board of the Children’s National Hospital (Protocol #00014876).
Informed Consent Statement
Written informed consent was obtained from all subjects via their Legal Adult Representatives.
Data Availability Statement
Data presented in this document that were generated solely by PyrAmes are available from the corresponding author upon reasonable request. The data are not publicly available due to sensitive personal data that were collected during clinical studies on patients. Data generated or provided by Stanford University and Children’s National Hospital are restricted by the terms of contractual agreements and are available upon reasonable request with the permission of those organizations and if the requestor agrees to comply with the European General Data Protection Regulation and not to attempt to trace the origin of the data.
Acknowledgments
The authors are extremely grateful for the efforts and advice of our many collaborators including: Zhenan Bao and Amanda Nguyen for working with us on the initial development of this technology, and Vivek Bhalla, Tara Chang, Sandra Tsai, Andrei Afanasiev, and Olga Afanasiev for their contributions to the early development of this sensor.
Conflicts of Interest
Y.W., E.B., T.R., J.L., A.W., A.M., W.L., X.Q. and K.D. are/were employees/contractors of PyrAmes. No conflict are reported for A.R., F.E.-A., E.H., A.J., A.V., C.R., A.H., W.R., R.B.G. and N.S.
Code Availability Statement
The custom code used in this study is copyrighted by PyrAmes Inc. Any commercial use including the distribution, sale, lease, license or other transfer of the code to a third party is prohibited. For inquiries regarding commercial use of the code, please contact
[email protected].
References
- Cuper, N.J.; de Graaff, J.C.; Hartman, B.J.; Verdaasdonk, R.M.; Kalkman, C.J. Difficult Arterial Cannulation in Children: Is a near-Infrared Vascular Imaging System the Answer? Br. J. Anaesth. 2012, 109, 420–426. [Google Scholar] [CrossRef] [PubMed] [Green Version]
- Pedro, V.; Burd, A.; Mehta, R.; Hiatt, M.; Hegyi, T. Resolution of Peripheral Artery Catheter-Induced Ischemic Injury Following Prolonged Treatment with Topical Nitroglycerin Ointment in a Newborn: A Case Report. J. Perinatol. 2003, 23, 348–350. [Google Scholar] [CrossRef]
- Furfaro, S. Arterial Catheter—Related Infections in Children A 1-Year Cohort Analysis. Am. J. Dis. Child. 1991, 145, 1037–1043. [Google Scholar] [CrossRef] [PubMed]
- Nuttall, G.; Burckhardt, J.; Hadley, A.; Kane, S.; Kor, D.; Marienau, M.S.; Schroeder, D.R.; Handlogten, K.; Wilson, G.; Oliver, W.C. Surgical and Patient Risk Factors for Severe Arterial Line Complications in Adults. Anesthesiology 2016, 124, 590–597. [Google Scholar] [CrossRef] [PubMed]
- Takci, S.; Yigit, S.; Korkmaz, A.; Yurdakök, M. Comparison between Oscillometric and Invasive Blood Pressure Measurements in Critically Ill Premature Infants. Acta Paediatr. 2012, 101, 132–135. [Google Scholar] [CrossRef] [PubMed]
- Shimokaze, T.; Akaba, K.; Saito, E. Oscillometric and Intra-arterial Blood Pressure in Preterm and Term Infants: Extent of Discrepancy and Factors Associated with Inaccuracy. Am. J. Perinatol. 2015, 32, 277–282. [Google Scholar] [CrossRef] [PubMed]
- Tareerath, M.; Wongyingsinn, M. Comparison of the Incidences of Cuff-Related Trauma after Non-Invasive Arterial Blood Pressure Measurement with and without Padding in Patients Undergoing Elective Surgery. J. Med. Assoc. Thail. Chotmaihet Thangphaet 2018, 101, 1. [Google Scholar]
- Quan, X.; Liu, J.; Roxlo, T.; Siddharth, S.; Leong, W.; Muir, A.; Cheong, S.-M.; Rao, A. Advances in Non-Invasive Blood Pressure Monitoring. Sensors 2021, 21, 4273. [Google Scholar] [CrossRef]
- Andriessen, P.; Schoffelen, R.L.M.; Berendsen, R.C.M.; Beer, N.A.M.D.; Oei, S.G.; Wijn, P.F.F.; E Blanco, C. Noninvasive Assessment of Blood Pressure Variability in Preterm Infants. Pediatr. Res. 2004, 55, 220–223. [Google Scholar] [CrossRef] [PubMed] [Green Version]
- Drouin, E.; Gournay, V.; Calamel, J.; Mouzard, A.; Rozé, J.C. Feasibility of Using Finger Arterial Pressure in Neonates. Arch. Dis. Childhood. Fetal Neonatal Ed. 1997, 77, F139–F140. [Google Scholar] [CrossRef] [PubMed] [Green Version]
- Lemson, J.; Hofhuizen, C.M.; Schraa, O.; Settels, J.J.; Scheffer, G.J.; van der Hoeven, J.G. The Reliability of Continuous Noninvasive Finger Blood Pressure Measurement in Critically Ill Children. Anesth. Analg. 2009, 108, 814–821. [Google Scholar] [CrossRef] [PubMed]
- El Hajj, C.; Kyriacou, P.A. Recurrent Neural Network Models for Blood Pressure Monitoring Using PPG Morphological Features. In Proceedings of the Annual International Conference of the IEEE Engineering in Medicine and Biology Society, New Orleans, LA, USA, 4–7 November 2021; IEEE Engineering in Medicine and Biology Society: Piscataway, NJ, USA, 2021; pp. 1865–1868. [Google Scholar]
- Almeida, V.; Vieira, J.; Santos, P.; Pereira, T.; Pereira, H.; Correia, C.; Pego, M.; Cardoso, J. Machine Learning Techniques for Arterial Pressure Waveform Analysis. J. Pers. Med. 2013, 3, 82–101. [Google Scholar] [CrossRef] [PubMed] [Green Version]
- Association for the Advancement of Medical Instrumentation. American National Standard. In Manual, Electronic or Automated Sphygmomanometers ANSI/AAMI SP10-2002. 3330 Washington Boulevard; AAMI: Arlington, VA, USA, 2003. [Google Scholar]
- Altman, D.G.; Bland, J.M. Measurement in Medicine: The Analysis of Method Comparison Studies. Statistician 1983, 32, 307–317. [Google Scholar] [CrossRef]
- Harrison, W.; Goodman, D. Epidemiologic Trends in Neonatal Intensive Care, 2007–2012. JAMA Pediatr. 2015, 169, 855–862. [Google Scholar] [CrossRef] [PubMed] [Green Version]
- Visscher, M.; Ralf Adam, O.; Brink, S.; Odio, M. Newborn Infant Skin: Physiology, Development, and Care. Clin. Dermatol. 2015, 33, 271–280. [Google Scholar] [CrossRef] [PubMed]
- Dannevig, I.; Dale, H.C.; Liestøl, K.; Lindemann, R. Blood Pressure in the Neonate: Three Non-Invasive Oscillometric Pressure Monitors Compared with Invasively Measured Blood Pressure. Acta Paediatr. 2005, 94, 191–196. [Google Scholar] [CrossRef] [PubMed]
- Sonesson, S.E.; Broberger, U. Arterial Blood Pressure in the Very Low Birthweight Neonate. Evaluation of an Automatic Oscillometric Technique. Acta Paediatr. Scand. 1987, 76, 338–341. [Google Scholar] [CrossRef] [PubMed]
- Meyer, S.; Sander, J.; Gräber, S.; Gottschling, S.; Gortner, L. Agreement of Invasive versus Non-Invasive Blood Pressure in Preterm Neonates Is Not Dependent on Birth Weight or Gestational Age. J. Paediatr. Child Health 2010, 46, 249–254. [Google Scholar] [CrossRef] [PubMed]
- Kumar, N.; Akangire, G.; Sullivan, B.; Fairchild, K.; Sampath, V. Continuous Vital Sign Analysis for Predicting and Preventing Neonatal Diseases in the Twenty-First Century: Big Data to the Forefront. Pediatr. Res. 2020, 87, 210–220. [Google Scholar] [CrossRef] [PubMed]
Figure 1.
(a) Boppli sensor schematic: illustration of the sensor and wearable, continuous, non-invasive BP device for neonates (cross-sectional at the top; aerial view at the bottom); (b) Boppli sensor placement around the foot of an infant.
Figure 1.
(a) Boppli sensor schematic: illustration of the sensor and wearable, continuous, non-invasive BP device for neonates (cross-sectional at the top; aerial view at the bottom); (b) Boppli sensor placement around the foot of an infant.
Figure 2.
Overview of the working of the sensor and steps to infer blood pressure.
Figure 2.
Overview of the working of the sensor and steps to infer blood pressure.
Figure 3.
Bland–Altman plots for SBP, DBP, and MAP: (a) values averaged over each individual for 81 test patients; and (b) all data values without averaging. Bland–Altman plots represent a scatter plot of average versus difference of BP readings constructed for SBP, DBP, and MAP. Points are color coded by patient weight. Red dotted lines indicate 2 * SD of the calculated values. Green dotted lines indicate targets based on FDA guidelines for accuracy of MAE ≤ 5 mmHg and 2 * SD ≤ 2 * 8 mmHg. The figures were generated using JMP software version 16.2.0.
Figure 4.
Predicted BP values vs. ground truth values. The blue line represents an unconstrained linear fit to the data. The green line is a linear fit constrained by a zero-intercept. The grey line is the identity (ID) fit where the predicted values equal the ground truth values. The figures were generated using JMP software version 16.2.0.
Figure 5.
Effect of gestational age (GA) on efficacy. Groups categorized by prematurity are compared through mean diamonds (green) and Tukey–Kramer circles (black). EPT (<28 wks GA), MPT (28–37 wks GA), FT (≥38 wks GA). Overlap between diamonds and circles indicates there is no significant difference between groups. Mean diamonds are contained within the FDA guidelines for accuracy (dotted green lines). Targets for 95% confidence levels are indicated with dashed green lines. Points are color-coded by patient weight.
Figure 6.
Effect of sex on efficacy. Female and male patient subsets are compared through mean diamonds (green) and Tukey–Kramer circles (black). Minimal overlap between diamonds and circles indicates there is a significant difference between the two groups. Mean diamonds are contained within the FDA guidelines for accuracy (dotted green lines). Targets for 95% confidence levels are indicated with dashed green lines. Points are color-coded by patient weight.
Table 1.
Methods for determining BP. Adapted * from Ref. [
8].
Table 1.
Methods for determining BP. Adapted * from Ref. [
8].
| | Method | Measurement | Example
Companies | FDA |
|---|
| Cuff | Finger, tabletop | Continuous | BMEYE, Finapres, ADI,
Biopac, Edwards (ClearSight), CNAP | Yes |
| Finger, wearable | Continuous | Caretaker | Yes |
| Wrist | Intermittent | Omron, H2Care | Yes |
| Cuffless | PPG | Continuous | Aktiia, BioBeat, Apple, ASUS, Samsung, Sensifree | Yes |
| PWV, PTT | Continuous | Vital Insight, Quanttus, Scanadu, Blumio,
Sibel | No |
| Tonometer | Continuous | Tensys, HealthStat, LiveMetric | Yes |
| Capacitance | Continuous | PyrAmes,
Vena Vitals | Submitted |
Table 2.
Pipeline for real-time processing of pulse waveforms and artificial neural network (ANN) training.
Table 2.
Pipeline for real-time processing of pulse waveforms and artificial neural network (ANN) training.
| Modules | Steps | Relevance |
|---|
| A. Quality Model | Select data
Exclude data segments
Quality ranking
Classification elements | Boppli Band has an array of four sensors. The algorithm chooses data from the best sensor.
Infant moves ⇨ pulse waveform excluded if quality value is below the threshold.
Automated PW quality rating (0—bad, 5—good) using ANN, correlation coefficient Boppli/IAL.
Algorithm automatically detects if the pulse waveform is corrupted by HFOV. |
| B. Signal Processing | Noise filtering/↑SNR | If Classification element detects HFOV ⇨ then notch filter. Normalize pulse waveform. |
| C. BP Model | CNN trained on pulse waveform and IAL SHAPE | Determines systolic, diastolic, mean arterial blood pressure. |
| D. Training Data | Obtain Boppli/IAL data | Sources: Stanford and CNH patient data warehouse; Stanford Boppli/IAL data collection. |
| E. Data Curation | Clean IAL data
Synchronize data | Removes artifacts due to motion, damping, and other IAL operational issues.
Synchronize Boppli and IAL data taken simultaneously. |
| F. Training and Testing | Cross-validation (k-fold)
Model Ranking | Inputs: pulse waveform data, age, and weight.
Splits data into 10 groups. Takes one group as a test and the remainder as training. Recursively tests model using TensorFlow and proprietary code. Choose best model that minimizes MAE and SD while optimizing slope and correlation coefficient of regression fit of estimated vs. ground truth values. |
Table 3.
Characteristics of the study cohort. Normotensive, not on any inotropic support during the measurement period.
Table 3.
Characteristics of the study cohort. Normotensive, not on any inotropic support during the measurement period.
| Study Cohort | Patient Characteristics (N = 81) |
|---|
| Age (days) | Minimum
Maximum
Average
Median | 1
150
17
4 | ![Sensors 23 03690 i001]() |
| Gestational age (weeks) | Minimum
Maximum
Average
Median | 24.14
41.29
34.33
37.00 | ![Sensors 23 03690 i002]() |
| Weight (kg) | Minimum
Maximum
Average
Median | 0.55
4.85
2.60
2.80 | ![Sensors 23 03690 i003]() |
| Sex, n (%) | 60.5% male, 39.5% female |
| Race/Ethnicity | ![Sensors 23 03690 i004]() |
| Primary diagnosis at time of measurement | Cardiac (34), gastrointestinal (3), hyperbilirubinemia (2), multisystem congenital (4), neurological (8), prematurity (21), respiratory (4), Trisomy 21 (1), combination issues (3), and pulmonary hypertension (1) issues |
Table 4.
Characteristics of the invasive arterial line data.
Table 5.
Characteristics of the IAL and Boppli placement locations.
Table 5.
Characteristics of the IAL and Boppli placement locations.
IAL location(s)
(Some patients had more than one IAL) | ![Sensors 23 03690 i008]() |
Boppli location(s)
(Some patients wore more than one Boppli) | ![Sensors 23 03690 i009]() |
Table 6.
Summary of degree of agreement for SBP, DBP, and MAP including agreement with FDA guidelines (green) and agreement falling outside FDA guidelines (red).
Table 6.
Summary of degree of agreement for SBP, DBP, and MAP including agreement with FDA guidelines (green) and agreement falling outside FDA guidelines (red).
| | Systolic
BP | Diastolic
BP | Mean Arterial
BP | FDA
Guidelines |
|---|
| MAE | SD | MAE | SD | MAE | SD | MAE | SD |
|---|
Individual averages
(N = 81) | −0.1 | 7.9 | 0.1 | 6.6 | −0.1 | 6.4 | ≤±5 mmHg | <8 mmHg |
| All points (N = 327 K) | −0.6 | 9.2 | −0.4 | 7.9 | −0.6 | 7.8 |
| | r2 | Slope | r2 | Slope | r2 | Slope | |
Individual averages
(N = 81) | 0.64 | 0.64 | 0.35 | 0.42 | 0.53 | 0.58 |
| All points (N = 327 K) | 0.56 | 0.58 | 0.27 | 0.36 | 0.43 | 0.50 |
Table 7.
Efficacy by gestational age.
Table 7.
Efficacy by gestational age.
| GA | N | MAP | SBP | DBP |
|---|
| MAE | SD | Letter Code * | MAE | SD | Letter Code * | MAE | SD | Letter Code * |
|---|
EPT:
<28 wk
| 15 | 0.2 | 6.9 | A | −0.0 | 7.3 | A | 0.4 | 7.3 | A |
MPT:
28–37 wk
| 38 | 0.2 | 6.4 | A | 0.3 | 8.3 | A | 0.4 | 6.6 | A |
FT:
≥38 wk
| 26 | −0.9 | 6.2 | A | −0.8 | 7.8 | A | −0.5 | 6.4 | A |
Table 8.
Efficacy by sex.
Table 8.
Efficacy by sex.
| | N | MAP | SBP | DBP |
|---|
| MAE | SD | Letter Code * | MAE | SD | Letter Code * | MAE | SD | Letter Code * |
|---|
| Female | 33 | 2.0 | 5.1 | A | 2.2 | 6.4 | A | 1.9 | 4.9 | A |
| Male | 48 | −1.6 | 6.8 | B | −1.7 | 8.4 | B | −1.1 | 7.3 | B |
| Disclaimer/Publisher’s Note: The statements, opinions and data contained in all publications are solely those of the individual author(s) and contributor(s) and not of MDPI and/or the editor(s). MDPI and/or the editor(s) disclaim responsibility for any injury to people or property resulting from any ideas, methods, instructions or products referred to in the content. |
© 2023 by the authors. Licensee MDPI, Basel, Switzerland. This article is an open access article distributed under the terms and conditions of the Creative Commons Attribution (CC BY) license (https://creativecommons.org/licenses/by/4.0/).


 ,
, 


