Abstract
Changes in steady-state UV fluorescence emission from free or immobilized glucose oxidase have been investigated as a function of glucose concentration. Immobilized GOD has been obtained by entrapment into a gelatine membrane. Changes in steady-state UV fluorescence have been quantitatively characterized by means of optokinetic parameters and their values have been compared with those previously obtained for FAD fluorescence in the visible range. The results confirmed that greater calibration ranges are obtained from UV signals both for free and immobilized GOD in respect to those obtained under visible fluorescence excitation. An alternative method to the use UV fluorescence for glucose determination has been investigated by using time course measurements for monitoring the differential fluorescence of the redox forms of the FAD in GOD. Also in this case quantitative analysis have been carried out and a comparison with different experimental configurations has been performed. Time coarse measurements could be particularly useful for glucose monitoring in complex biological fluids in which the intrinsic UV fluorescence of GOD could be not specific by considering the presence of numerous proteins.
1. Introduction
In the last years the employment of glucose oxidase (GOD) in glucose optical sensing has been largely investigated for clinical and industrial applications [1- 8]. Different immobilization procedures have been adopted [9-11] aiming to extend the linear range of optical sensors, their sensibility, specificity, reproducibility and time stability. Recently new approaches to “in vivo” glucose measurements by means of fluorescence-based systems have been critically reviewed by Pickup et al [12,13]. As far as concerns glucose determination by means of GOD endogenoeus fluorescence, two different approaches have been followed. The former is based on the changes in steady-state fluorescence of the flavine (FAD) region during the enzymatic reaction [14-16]. This approach is very simple and highly specific to glucose and the use of visible light (λexc = 420 nm; emission range = 480 – 580 nm) makes it not very expensive as far as optical components. However, this approach requires large consumption of enzymes owing to the low quantum yield of flavine fluorescence. Moreover, fluorescence changes are not very strong and only particular immobilization procedures can allow a widening of linear calibration region for sensors operating in this wavelength range. The second approach exploits the GOD UV intrinsic fluorescence of some amino acids, basically tyrosine and tryptophan. This fluorescence is generally characterized by an excitation with two maxima at 224 and 278 nm and an emission around 340 nm and it is usually employed to obtain information about the enzyme configuration and bonding positions [17]. UV intrinsic fluorescence gives some advantages in comparison with flavine fluorescence: higher quantum yield and larger linear calibration range [2]. These features make interesting the optical glucose measurements in this region, even if the UV fluorescence has been considered not highly specific for glucose when biological samples are investigated owing to the presence of many proteins [18].
In 1997 some researchers [19] proposed an alternative method for using UV GOD fluorescence for glucose determination by exploiting the differential fluorescence of the redox forms of FAD bound to the enzyme and it was applied for determination of glucose concentration in the blood. The method is based on the evidence that the addition of glucose to GOD solution does not immediately change the UV fluorescence signal that remains still constant for a certain amount of time before increasing until a determined level. This fluorescence level remains stable for some time before slowly decreasing. The experiments [19] ruled out that this behaviour cannot be due to inner filter and oxygen quenching effects, but it has to be ascribed to a different energy transfer from tryptophan to reduced and oxidised FAD [20]. In such a way, by monitoring the high but not specific UV fluorescence signal, it is possible to characterize the lower but highly specific glucose-FAD fluorescence [19]. The time to reach the stable fluorescence level depends on the glucose concentration and then can be used for its determination. In addition, by changing the oxygen and enzyme concentrations it is possible to modulate the linear calibration range. In this paper we investigated the feasibility of using the fluorescence temporal changes to quantify the glucose concentration when GOD is not more free, as in reference 19, but it is immobilized by entrapment in a gelatine membrane. The latter system is more appropriate for sensor applications. The performances of this approach have been quantified by means of optokinetic parameters as in our previous paper [16]. These parameters have also been evaluated for the free GOD fluorescence temporal changes and for the steady-state UV fluorescence changes in free and immobilized GOD.
2. Materials and Methods
2.1. Materials
Glucose oxidase (GOD, EC 1.1.3.4) from Aspergillus niger (154 U mg-1) was employed for our study. GOD catalyses the oxidation of glucose to gluconic acid through the following reactions:
The reaction mechanism is the following: glucose reduces FAD of glucose oxidase to FADH2 with formation of gluconolactone, which is rapidly hydrolysed to gluconic acid. At this point the dissolved oxygen reoxidizes FADH2 to GOD and produces H2O2.
The enzyme was immobilized by entrapment into bovine gelatine (average molecular weight 100 kDa). Gelatine was a gift of Deutsche Gelatine Fabric Stress, Eberbach, Germany.
All chemical products, including the enzyme, were purchased from Sigma (Sigma-Aldrich, Milano, Italy) and used without further purification.
2.1. Methods
2.2.1 Preparation of the catalytic membranes
A 10% gelatine (w/v) aqueous solution was heated in a water-bath at 90 °C for 15 min, then the solution was gradually cooled at 40 °C before adding a 50% (v/v) ethanol/formaldehyde solution to give a 1% final HCOH concentration. After 20 min of treatment at this temperature, GOD (final concentration 5 mg mL−1) was added under vigorous stirring and then the mixture was poured into a Plexiglas square frame, 4 x 4.5 cm in size and 5 mm in depth. The preparation was quickly put into a freezer at −24 °C and after 16 h brought back to room temperature, thus obtaining a flexible gelatine membrane, which was extensively washed with distilled water. At this point rectangular pieces of the same size (40 mm × 13 mm) were cut and used for fluorescence measurements. In this way, catalytic membrane comparable for dimension and amount of entrapped GOD were obtained. The gelatine membranes had a lattice structure, which efficiently held the biocatalyst and allowed free diffusion of substrate and reaction products. When not used, the membranes were stored at 4 °C in 0.1 M acetate buffer, pH 5.0.
2.2.2 Fluorescence measurements
2.2.2.1 Intrinsic fluorescence emission measurements
GOD is an oxidase and exhibits at pH 6.5 a very intense UV fluorescence with an emission maximum at 334 nm and two absorption maxima at 224 nm and 278 nm due to tryptophan. GOD is also a typical flavoprotein. GOD from A. niger is a dimmer with two very tightly bound FAD molecules per dimer. As all flavoproteins, GOD shows absorption maxima at about 380 and 450 nm and an intrinsic fluorescence with an emission maximum at about 530 nm, at pH 7.0. As previously reported changes in the fluorescence of free and immobilized GOD have been found during its interaction with glucose, since the oxidized and reduced flavines have been found to exhibit different fluorescences [12, 14, 18].
In this research the emission fluorescence spectra have been collected by means of a spectrofluorimeter (Perkin-Elmer, model LS55) equipped with a Xenon discharge lamp with an emission spectrum ranging from 200 to 800 nm. Sample excitation was performed at 295 nm, while the emission spectrum was recorded in the range 310 – 400 nm. Spectra have been acquired with entrance and exit slits fixed at 5 nm and with a scan speed of 100 nm s-1. Just to give an example, in Figure 1a the normalized emission fluorescence spectra of free GOD in the presence (2 mM) or in the absence of glucose are reported. Figure 1a shows a fluorescence increase (about 20% for both peak and integral values) when glucose is in the aqueous solution. In Figure1b the normalized emission fluorescence spectra for GOD entrapped into the gelatine membrane in the presence (20 mM) or in the absence of glucose are reported. Also in this case a fluorescence increase (nearly equal to 20% for both peak and integral values) is evident in the presence of glucose. We have checked that the changes in the fluorescence were not due to GOD diffusion from gelatine to solution. In fact fluorescence spectra were absent after removing the catalytic gelatine membrane. Either in Figure 1a or in Figure 1b normalization has been carried out by taking as unit the maximum intensity of the recorded spectra in presence of glucose. From a comparison between curves (i) of figures 1a and 1b it is also evident that the immobilization procedure doesn't significantly alter the UV fluorescence spectra according to ref. 21.
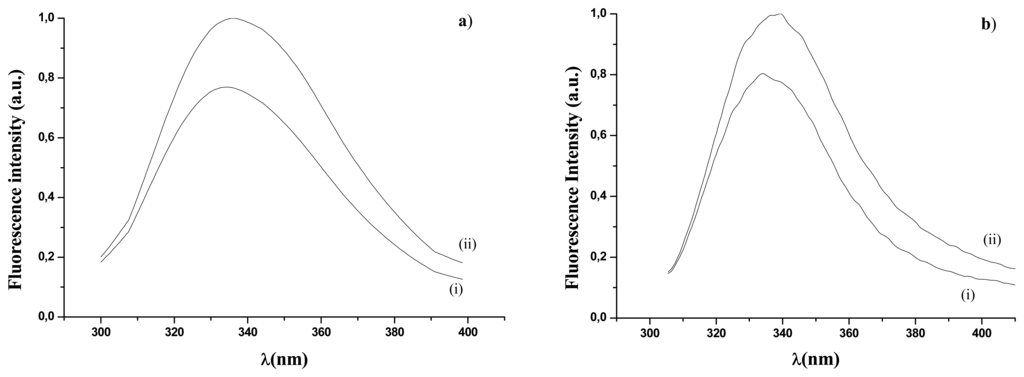
Figure 1.
Fluorescence emission spectra (λexc = 278 nm; λem= 340 nm): (a) free GOD, in the absence (curve i) and in the presence (curve ii) of glucose concentration (2mM); (b) immobilized
For analytical purposes the emission fluorescence spectrum can be treated as size of the peak value at 340 nm or as size of the integral area under the spectrum in the region 310 - 400 nm. Both experimental parameters have been used in the elaboration of our figures.
2.2.2.2 UV fluorescence time course measurements
Also in this case, the changes in fluorescence measurements during the enzymatic reaction were followed with the same spectrofluorimeter above-mentioned. At the beginning the fluorescence of either free or immobilized GOD at 340 nm was measured. This measure constituted the baseline for the subsequent measurements. After addition of 200 μl of glucose solution at different concentrations the time course of the fluorescence intensity was monitored. Figure 2a shows the UV fluorescence signal obtained upon addition of 200μl of 1 mM glucose solution to the GOD solution to obtain a final glucose concentration of 0.2 mM. As is evident the fluorescence intensity initially remains constant at I0, except for a small decrease resulting from dilution. After some time referred as “appearance time” , tapp, the fluorescence intensity increases gradually to a final value I1 at t1. I1 remains constant for some time and then gradually decreases. Similar measurements were performed for GOD entrapped into a gelatine membrane and the results are shown in Figure 2b. At t = t0, 200 μl of 10 mM glucose solution were added to the buffered solution where the gelatine membrane was positioned. In this way a final glucose concentration of 2mM was obtained. After some time, tapp, the UV fluorescence signal started to increase. No initial decrease of the fluorescence signal was observed since it was coming from immobilized GOD and therefore no dilution effect on GOD concentration was present. Also in this case it has been checked that the changes in fluorescence were not due to the GOD presence in solution. According to ref. 19, the determination of glucose has been done by means of two different parameters: tapp and the linear slope of the intensity signal rise.
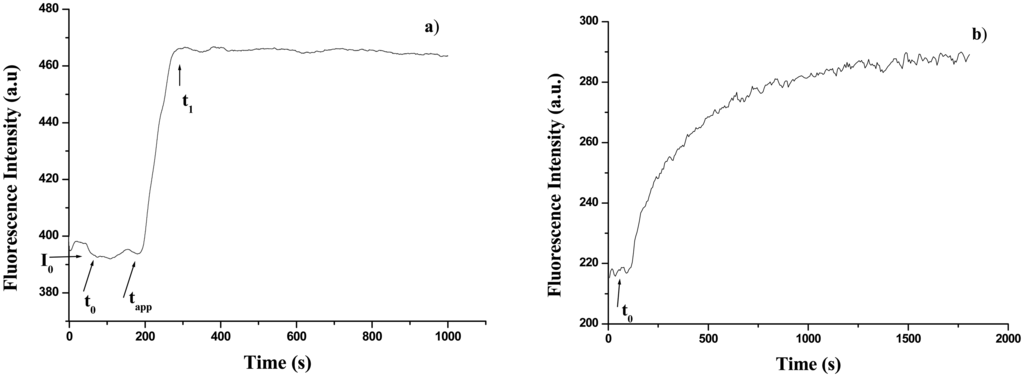
Figure 2.
Fluorescence intensity as a function of time during the enzymatic reaction: (a) free GOD (0.2 mM glucose concentration); (b) immobilized GOD (2 mM glucose concentration).
3. Results and Discussion
3.1. Calibration curves of glucose concentration through emission spectra
3.1.1. Free GOD
In Figure 3a the peak intensities, Pc,free, of the emission spectra of free glucose oxidase are reported as a function of glucose concentration. Subscripts “c” and “free” indicate the glucose concentration and the enzyme form, respectively. Pc, free values in Figure 3a have been decreased by P0, free = 403 arbitrary units, i.e. the peak value of free GOD in the absence of glucose, i.e. when c = 0. The experimental conditions were: temperature 25°C and glucose in 0.1 M acetate buffer solution, pH 5.0. Data in Figure 3a exhibit a Michaelis-Menten behaviour and are well fitted by an equation of the type:
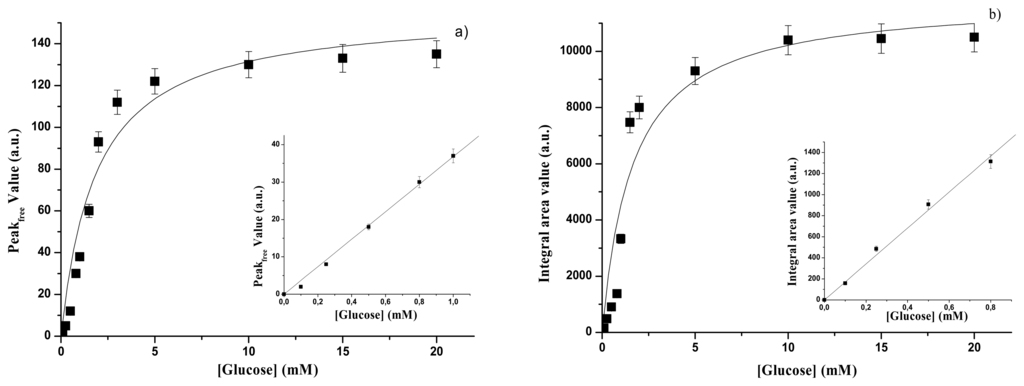
Figure 3.
Free GOD - (a) Fluorescence emission peak as a function of glucose concentration. Inset: glucose calibration curve. (b) Fluorescence emission integral area as a function of glucose concentration. Inset: glucose calibration curve.
where now the subscript “sat” indicates the peak value at saturation and KP is a “pseudo” Michaelis-Menten constant. A Lineweaver-Burk plot of the results reported in Figure 3a allows us to derive the KP, free and Psat,free values reported in Table 1. As in reference 16, KP and Psat are the optokinetic parameters.

Table 1.
Optokinetic parameters from fluorescence peak size analysis for free and immobilized GOD evaluated from UV and visible emission spectra measurements.
The inset of Figure 3a shows the range where it is possible to have a linear relationship (R= 0.99) between the value of the intensity of the emission peak and the glucose concentration:
The value of the SP,free coefficient represents the sensitivity of the measure method. The SP,free value, calculated from the inset in Figure 3a, is reported in Table 1 together with the indication of the extension of the linear range of the calibration curve.
In Figure 3b the integral area values, Ac,free, of the intrinsic fluorescence emission spectra in the range 300-380 nm are reported as a function of glucose concentration. Also in the case of Figure 3b the Ac,free, values have been corrected for the value of the integral area of the GOD emission spectrum in the absence of glucose, i.e. A0,free= 23,836 arbitrary units. The experimental conditions were the same that in Figure 3a. Also in this case the data are well fitted by a Michaelis-Menten relationship
KA, free and Asat, free values, obtained by Lineweaver-Burk plot of the results of Figure 3b, are reported in Table 2.
Table 2.
Optokinetic parameters from fluorescence area integral analysis for free and immobilized GOD evaluated from UV and visible emission spectra measurements.
In the inset in Figure 3b the linear range between the integral area values and the glucose concentration is reported. Data are well fitted (R= 0.98) by the linear equation :
where SA,free is the sensitivity of the method. The SA,free value is reported in Table 2 together with the indication of the extension of the linear range of the calibration curve.
In Tables 1 and 2 we have also reported, for comparison, the analogous parameters obtained by us in the visible region in a previous paper [16]. Data reported in Table 1 and 2 show values of optokinetic parameters in UV spectral range higher than those obtained under visible conditions, the ratio ranging from 3.3 for the peak to 4 for the area. Also the extension of the calibration linear range is improved in the case of the measurement performed in the UV spectral range, while, as expected, the sensitivities calculated for the visible spectral range are higher than those obtained in the UV range. This circumstance confirms the general observation that the extension of the linear calibration range and the sensitivity are quantities not directly proportional.
3.1.2. GOD – gelatine membrane
In figure 4a the values of the peak intensity of the intrinsic fluorescence emission spectrum of GOD entrapped into the gelatine membrane are reported as a function of glucose concentration. The experimental points in the figure have been obtained by taking into account for the intensity of the fluorescence peak of GOD-gelatine membrane in the absence of glucose, i.e. P0,gel = 900 arbitrary units. The experimental conditions (temperature, pH, and buffer solution) were the same that in Figure 3. Also in this case a Michaelis-Menten behaviour is observed. It follows that all the consideration done for free GOD are still valid for immobilized GOD. The inset in Figure 4a shows the linear range between the fluorescence peak intensity of GOD-gelatine membrane and the glucose concentration, as deduced from Figure 4a. The values of KP, gel, Psat, gel and SP, gel, calculated by means of equations identical to (1) and (2), are reported in Table 1. The subscript gel, in this case, indicates gelatine.
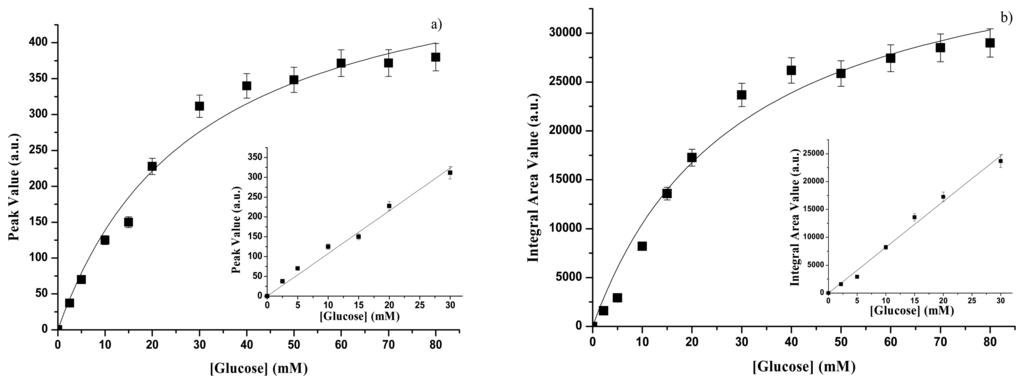
Figure 4.
Immobilized GOD - (a) Fluorescence emission peak as a function of glucose concentration. Inset: glucose calibration curve. (b) Fluorescence emission integral area as a function of glucose concentration. Inset: glucose calibration curve.
When reference is done to the integral area of the emission fluorescence spectrum of the GOD-gelatine membrane one obtains the results reported in Figure 4b. Also in this case, the data in the figure have been obtained by subtracting from the measured values of the integral area of the emission spectra in the presence of glucose, the integral area value of the emission spectrum of the GOD-gelatine membrane in the absence of glucose, i.e. A0, gel = 50,000 arbitrary units. In the inset in Figure 4b the linear range between the integral area of the emission spectrum and the glucose concentration is reported. Also in the case of Figure 4 b the considerations done for the free enzyme are still good, so that through equations similar to (3) and (4) one obtains the value of KA,gel, Asat, gel and SA, gel listed in Table 2.
3.2. Calibration curves of glucose concentration through time course measurements
3.2.1 Free GOD
According to reference 19, the dynamic changes in the emission spectra can be used for determination of glucose concentration by utilizing two different parameters: the linear slope (Sl = dI/dt) of the intensity rise of fluorescence signal and the appearance time (tapp). Reference 19, moreover, allows us to use the parameter (tm−t0) in place of the appearance time (tapp) that is more difficult to determine. (tm−t0) is equal to the time required for the fluorescence intensity signal to reach a value equivalent to 10% of the overall increase. In the present study we used both the parameters Sl and (tm−t0).
In Figure 5a the values of the linear slope of the fluorescence intensity increase at different glucose concentrations are reported. A Michaelis-Menten behaviour is observed and the curve through the experimental points is well fitted by the equation:
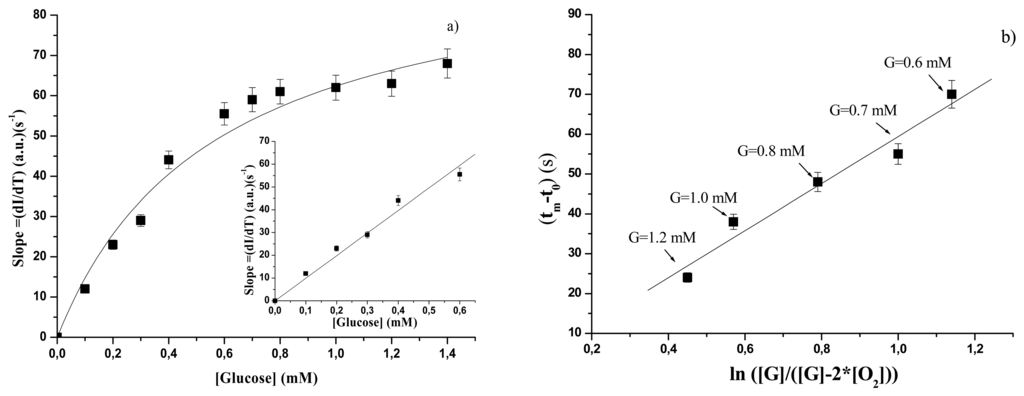
Figure 5.
Free GOD – (a) Slope of the intensity rise of fluorescence signal as a function of glucose concentration. Inset: glucose calibration curve. b) (tm − t0) values as a function of ln([G]/([G]-2([O2])) at different glucose concentration.
where now Sl indicates the slope of the initial increase of the fluorescence signal, and C, sat and free have the same meaning as in previous sections.
In the inset in Figure 5a the linear calibration range relative to the experimental points of Figure 5a is reported. The corresponding linear relationship can be written as follows:
where SSl,free, now, is the sensitivity of the method. Values of Slsat, KSl, free and SSl are reported in Table 3.
Table 3.
Optokinetic parameters for free and immobilized GOD evaluated from fluorescence time course and from the analysis of the slope of signal intensity rise.
Coming now to the (tm-to) parameter, the model [19] predicts that this time is influenced by both the concentrations of oxygen [O2] and glucose [G] according to a linear relationship between (tm − t0) and
. Obviously this relationship is valid for glucose concentrations greater than twice [O2] concentration. The authors [19] tested the model reliability with respect to enzyme and [O2] concentrations and their results confirmed the potential use of this approach for glucose determination. In particular, it was found that the linear calibration range depends on the GOD concentration used and on the initial [O2] concentration. In our case [O2] concentration, measured with an oxygen electrode, resulted equal to 2.2 10-4 M and then for the new calibration curve we used glucose concentrations higher than 4. 4 10-4 M. The linear range of the values of (tm − t0) vs ln([G]/([G]- 2([O2])) at different glucose concentrations is reported in Figure 5b. The experimental points are the same reported in Figure 5a, but the data elaboration is now different. The results in Figure 5b indicate that by using this approach it is possible to extend (from 0.6 mM to 1.2 mM) the linear range in which a new calibration curve can be used. It is not clear if it is fortuitous that the new calibration curve starts from the glucose concentration (0.6 mM) which represents the upper limit of the calibration curve related to the linear slope of the intensity rise. If this is not fortuitous, it should be feasible to use different GOD and oxygen concentrations to modulate the whole range in which it is possible to perform accurate measurements of glucose concentrations by means of technologies based on fluorescence time course.
The characteristic parameters relative to this approach have been indicated by TC (for Time Course) and are reported in Table 4. STC (measured in seconds) is the slope of best fitting line of experimental points reported in Figure 5b.
Table 4.
Optokinetic parameters for free and immobilized GOD evaluated from fluorescence time course measurements and from (tm − t0) values analysis.
3.2.2 GOD – gelatine membrane
Our main goal in this work was to investigate the possibility of broadening the field of application of the method proposed in reference 19 to immobilized GOD, since no industrial applications can be devised for the free enzyme. For this reason we investigated the changes in fluorescence signals of GOD immobilized in a gelatine membrane in the presence of different glucose concentrations. As shown in Figure 2 and as reported in reference 21, the immobilization procedure does not significantly alter the spectroscopic emission spectrum of enzyme in the UV region.
In Figure 6a the values of the linear slope dI/dt, i.e. the values of Sl, are reported as a function of glucose concentration when GOD is immobilized into the gelatine membrane. Also in this case a Michaelis-Menten behaviour is observed and the values of KSl,gel and Slsat,gel can be accordingly derived from a linearization process as that of Lineweaver-Burk. These values are reported in Table 3. Since we are interested to a linear calibration curve, in the inset in Figure 6a the linear of the experimental points of Figure 6a are reported. The experimental points are well fitted (R = 0.99) by the equation:
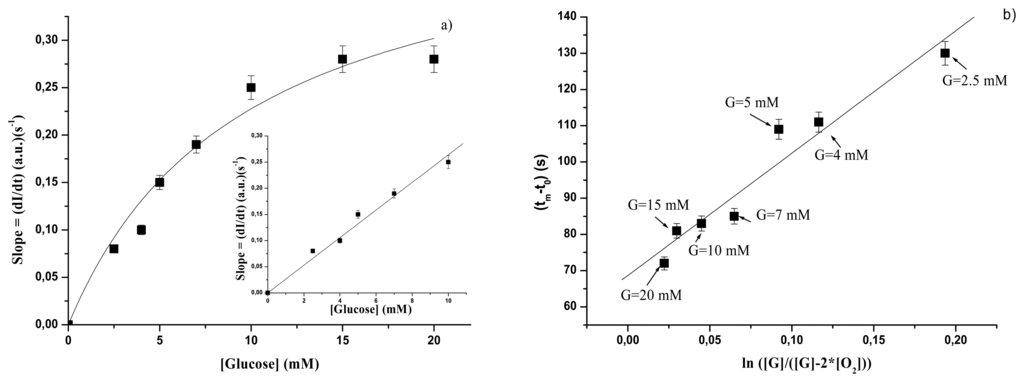
Figure 6.
Immobilized GOD – (a) Slope of the intensity rise of fluorescence signal as a function of glucose concentration. Inset: glucose calibration curve. (b) (tm − t0) values as a function of ln([G]/([G] - 2([O2])) at different glucose concentration.
where the variables have the usual meaning and SSl,gel is a constant giving the sensitivity of the method. The value of SSl,gel is also reported in Table 3.
When the parameter (tm−t0) is considered, the plot of Figure 6b is obtained. As for Figure 5b, also data in Figure 6b show that by using the plot of (tm−t0) versus ln([G]/([G] - 2([O2])) it is possible to find a new calibration curve beyond the 10 mM glucose concentration which represents the upper limit for the calibration curve obtained by plotting the rate of intensity increase as a function of glucose concentration. All the considerations done for the free enzyme are still valid for the immobilized one.
Before concluding, let us make some observations emerging from data in Figures 5b and 6b. The straight lines fitting the experimental points allows us to define a “pseudo-sensitivity” of the method. Values of STC and the corresponding extensions of the linear range, for free and immobilized GOD, are reported in Table 4. It is interesting to observe that when the approach of reference 19 is followed, the pseudo-sensitivity parameters and the extension of the calibration linear range for the immobilized GOD are higher than those obtained for the free GOD.
4. Conclusions
From data reported in the Tables it is possible to conclude that also for UV fluorescence signal, either for steady-state or for time course measurements, by using immobilized GOD an increase of more than one magnitude order of the linear calibration range is obtained. In a previous paper [16] we noticed a linear relationship between the Koptokinetic values and the corresponding extensions of the linear range. Also the Koptokinetic values evaluated for steady-state UV fluorescence emission follow the same relationship, as it can be shown in Figure 7 in which all the values for visible and UV emission are reported. Looking at the “sensitivity” of the measure method it is evident that for UV steady–state fluorescence the sensitivity decreases when GOD is immobilized but not in so high percentage as for visible emission: a factor of ten for visible and a factor of three for UV. For the method based on the slope of the intensity increase, the sensitivity decrease is still evident when immobilized GOD is considered, but for the (tm- t0) method the sensitivity for immobilized enzyme is higher than the corresponding value of the free GOD. This is particularly encouraging in order to apply this method when using complex biological fluids in which many proteins are present and UV steady-state fluorescence is claimed to be not very specific to glucose (14). In our previous paper we already noticed that our systems operating in visible region were more sensitive than other GOD sensors using absorption changes [22]. Presently the use of UV fluorescence allowed us to get better results especially when time course method with immobilized GOD is adopted. In particular, this method can allow us to reach sensitivities higher than those shown in reference 23 where exogenous luminescent probes were used in sol-gel based glucose biosensors. Furthermore our method appears to be competitive also with the most recent fluorescence-based systems [12,13]. The results here reported indicate that it would be possible to design an optical biosensor for glucose determination based on GOD entrapped into a gelatine membrane coupled to optical fibers.
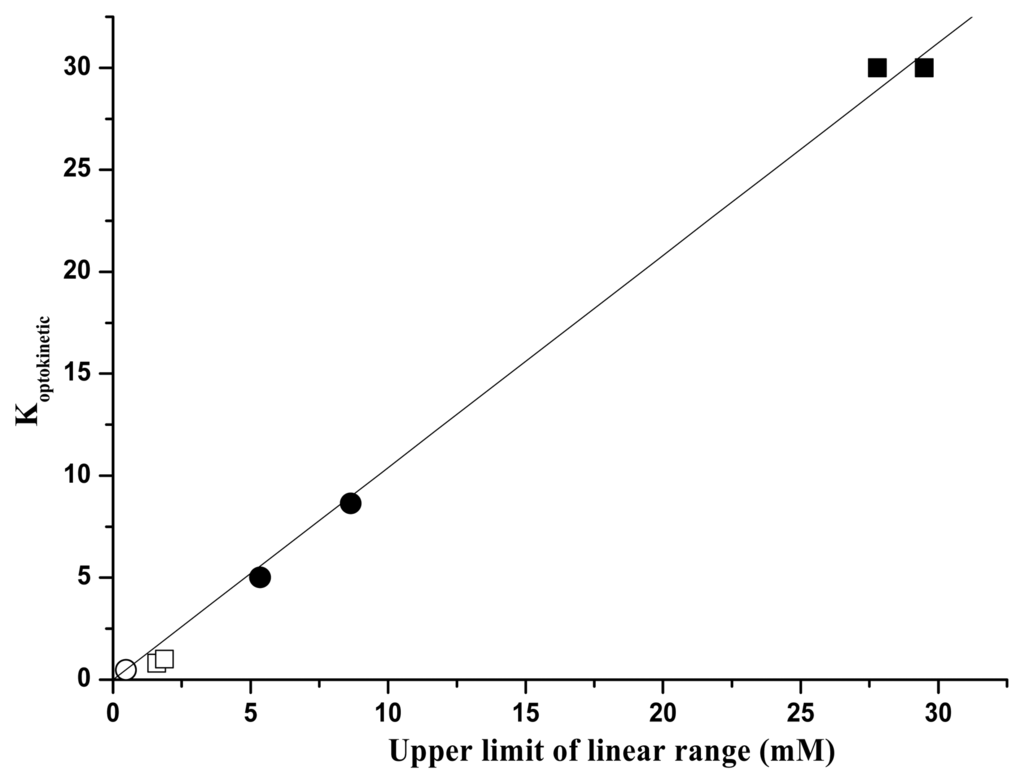
Figure 7.
Optokinetic parameter K as a function of the extent of the linear range. Fluorescence emission of free GOD in visible range(
 ), in UV range (□). Fluorescence emission of immobilized GOD in visible range (●), in UV range (▪).Empty and full dots refer to results in reference 16.
), in UV range (□). Fluorescence emission of immobilized GOD in visible range (●), in UV range (▪).Empty and full dots refer to results in reference 16.
References and Notes
- Raba, J.; Mottola, H.A. Glucose oxidase as an analytical reagents. Crit. Rev. Anal. Chem. 1995, 25, 1–42. [Google Scholar]
- Wolfbeis, O.S.; Bohmer, M.; Durkop, A.; Enderlein, J.; Gruber, M.; Klimant, I.; Krause, C.; Kurner, J.; Liebsch, G.; Lin, Z.; Ostwald, B.; Lu, M. Fluorescence Spectroscopy, Imaging and Probes; Kraayenhof, R., Visser, A.J.W.G., Gerritsen, H.G, Eds.; Springer Verlag: Heidelberg, 2002. [Google Scholar]
- McShane, M.J. Potential for glucose monitoring with nanoengineered fluorescent biosensors. Diabetes Technol. Ther. 2002, 4, 533–538. [Google Scholar]
- Srivastava, R.; Brown, J.Q.; Zhu, H.; McShane, M.J. Stable encapsulation of active enzyme by application of multiplayer nanofilm coatings to alginate microspheres. Macromol. Biosci. 2005, 5, 717–727. [Google Scholar]
- Brown, J.Q.; Srivastava, R.; Zhu, H.; McShane, J. Enzymatic Fluorescent Microsfere Glucose Sensors: evaluation of response under dynamic conditions. Diabetes Technol. Ther. 2006, 8, 288–295. [Google Scholar]
- Chinnayelka, S.; McShane, M.J. Glucose-sensitive nanoassemblies comprisingaffinity-binding complexes trapped in fuzzy microshells. J. Fluorescence 2004, 14, 585–595. [Google Scholar]
- Brown, J.Q.; McShane, J.M. Modeling of spherical fluorescent glucose microsensor systems: design of enzymatic smart tattoos. Biosens. Bioelectron. 2004, 21, 212–216. [Google Scholar]
- Koo, Y.E.L.; Cao, Y.; Kopelman, R.; Koo, S.M.; Brasuel, M.; Philbert, M.A. Real-time measurement of dissolved oxygen inside live cells by organically modified silicate fluorescent nanosensors. Anal.Chem. 2004, 76, 2498–2505. [Google Scholar]
- Kuswandi, B.; Andres, R.; Narayanaswamy, A.R. Optical fibre biosensors based on immobilised enzymes. Analyst 2001, 126, 1469–1491. [Google Scholar]
- Marangoni, A.G. Enzyme Kinetics: A Modern Approach; J. Wiley & Sons: New York, 2003. [Google Scholar]
- Cao, L. Carrier-bond Immobilized Enzymes: Principles, Application & Design; J. Wiley & Sons: New York, 2003. [Google Scholar]
- Pickup, J.; Hussain, F.; Evans, N.D.; Rolinski, O.J.; Birch, D.J.S. Fluorescence-based glucose sensors. Biosens. Bioelectron. 2005, 20, 2555–2565. [Google Scholar]
- Pickup, J.; Hussain, F.; Evans, N.D.; Sachedina, N. In vivo glucose monitoring: the clinical reality and the promise. Biosens. Bioelectron. 2005, 20, 1897–1902. [Google Scholar]
- Trettnak, W.; Leiner, M.J.P.; Wolfbeis, O.S. Optical sensors. Part 34. Fibre optic glucose biosensor with an oxygen optrode as the transducer. Analyst 1988, 113, 1519–1523. [Google Scholar]
- Trettnak, W.; Wolfbeis, O.S. Fully reversible fibre-optic glucose biosensor based on the intrinsic fluorescence of glucose oxidase. Analytica Chimica Acta 1989, 211, 196–203. [Google Scholar]
- Lepore, M.; Portaccio, M.; De Tommasi, E.; De Luca, P.; Bencivenga, U.; Maiuri, P.; Mita, D.G. Glucose concentration determination by means of fluorescence emission of soluble and insoluble glucose oxidase: some useful indications for optical fibre-based sensors. J. Mol. Catal. B: Enzym. 2004, 31, 151–158. [Google Scholar]
- Lakowicz, J.R. Principles of Fluorescence Spectroscopy; Kluwer Academic Plenum Publisher: New York, 1999. [Google Scholar]
- D'Auria, S.; Lakowicz, J.R. Enzyme fluorescence as a sensing tool: new perspectives in biotechnology. Current Opinion in Biotechnology 2001, 12, 99–104. [Google Scholar]
- Sierra, J.F.; Galban, J.; Castello, J.R. Determination of glucose in blood based on the intrinsic fluorescence of glucose oxidase. Anal. Chem. 1997, 69, 1471–1476. [Google Scholar]
- Haouz, A.; Twist, C.; Zentz, C.; de Kersabiec, A.M.; Pin, S.; Alpert, B. Forster Energy transfer from trytophan to flavin in glucose oxydase enzymes. Chem. Phys. Lett. 1998, 294, 197–203. [Google Scholar]
- Haouz, A.; Glandières, J.M.; Alpert, B. Involvement of protein dynamics in enzyme stability. The case of glucose oxidase. FEBS Letters 2001, 506, 216–220. [Google Scholar]
- White, B.J.; Harmon, H.J. Novel optical solid-state glucose sensor using immobilized glucose oxidase. Biochem. Biophys. Res. Comm. 2002, 296, 1069–1071. [Google Scholar]
- Wolfbeis, O.S.; Oheme, I.; Papkovskaya, N.; Klimant, I. Sol–gel based glucose biosensors employing optical oxygen transducers, and a method for compensating for variable oxygen background. Biosens. Bioelectron. 2000, 15, 69–76. [Google Scholar]
© 2007 by MDPI ( http://www.mdpi.org). Reproduction is permitted for noncommercial purposes.