Article

Rapid Characterization of Monoclonal Antibodies using the Piezoelectric Immunosensor

by
Miroslav Pohanka
1,
Oto Pavliš
1 and
Petr Skládal
2,*
1
Center of Biological Defense, Těchonín, Czech Republic
2
Institute of Biochemistry, Masaryk University, Kotlářská 2, 611 37 Brno, Czech Republic
*
Author to whom correspondence should be addressed.
Sensors 2007, 7(3), 341-353; https://doi.org/10.3390/s7030341
Submission received: 22 February 2007 / Accepted: 15 March 2007 / Published: 20 March 2007

Abstract

:
Monoclonal antibodies with specificity against the Francisella tularensis outer lipopolysaccharide (LPS) membrane were prepared and characterized using the piezoelectric immunosensor with immobilized LPS antigen from F. tularensis. Signals obtained by the immunosensor were compared with ELISA and similar sensitivity was noticed. Signal of negative controls obtained using the biosensor was below 0.5% of the signal obtained for the selected specific antibody clone 4H3B9D3. Testing of cross reactivity based on the sensors with immobilized LPS from Escherichia coli and Bacillus subtilis confirmed selectivity of this antibody. Furthermore, the 4H3B9D3 antibody was successfully isotypized as IgM using the piezoelectric sensors with secondary antibodies. Kinetics parameters of antibody were evaluated in the flow-through arrangement. The kinetic rate constants for the antibody 4H3B9D3 were ka = (2.31 ± 0.20)·105 l mol-1s-1 (association) and kd = (0.0010 ±0.00062) s-1 (dissociation) indicating very good affinity to the LPS antigen.

1. Introduction

Antibodies represent important analytical reagents providing excellent affinity and specificity of recognition towards complementary antigen partners. Though recombinant antibodies are known and preparation procedures were proposed for different antigens [1], monoclonal (mAb) and polyclonal (pAb) antibodies are still predominantly used in immunoanalytical methods. Live animals such as mouse or rabbit are typically used for pAb production. Although the production is not very difficult and simple purification methods were developed, legislative regulations for laboratory animal use create the main obstacle for this type of antibodies. On the other side, each host animal responds uniquely to a given immunization protocol, requiring validation of the obtained pAb product and re-optimization of immunological assays. In comparison with pAb, the mAb-producing hybridoma technology takes a single antibody-producing B cell from mouse and immortalizes it by fusion with myeloma cell line, creating hybridoma cell line. From the analytical point of view, the main difference between pAb and mAb is the fact that mAb recognizes on the molecule of antigen a single epitope only.
For detection of pathogenic bacteria, the best antibodies are those specific against surface structures such as lipopolysacharides (LPS). These amphipathic structures are typical for gram-negative bacteria, an important group of human and animal pathogens. LPS are very versatile; the basic structure consists of three regions [2] – a hydrophobic lipid A, hydrophilic core oligosaccharide and an outer polysaccharide O-antigen playing an important role in the infection process [3] as well as in activation of the immunity response [4]. For the target pathogen - Francisella tularensis - monoclonal antibodies against its O-antigen were described [5].
Classical methods for measurement and characterization of antibodies include immunological assays such as agglutination tests, enzyme-linked immunosorbent assay (ELISA), western blot, immunofluorescence and flow cytometry [6]. The dot immunobinding assay was used for characterization of monoclonal antibodies against the laminin receptor [7], mycobacterial antigen [8] and serotypization [9]. From the biosensor-based tools, surface plasmon resonance (SPR) is convenient for observation of immunological interactions [10]. The main advantage is possibility to work without any label and interaction is followed in real time providing detailed kinetic characterization. Similar results are obtained using the resonant mirror (RM) technique; interaction of antibodies with antigen immobilized on sensor surface was tested [11]. Microarray with LPS immobilized on nitrocellulose-coated glass slides represents a multiparallel format suitable for detection of antibodies [12].
In the present study, the piezoelectric biosensor was tested for detection and preliminary characterization of mAb produced against the intracellular pathogenic bacterium Francisella tularensis. The aim was to develop a simple and rapid method for selection of the best antibody clone specific to the surface structures, isotypization and kinetic characterization of the selected antibody. Performance of the piezoelectric biosensor was compared with the indirect ELISA in the classical arrangement, which is routinely used for the same purpose.

2. Experimental Section

2.1 Monoclonal antibodies preparation

Monoclonal antibodies against Francisella tularensis LVS were produced using the standard hybridoma technology as described in the literature [5] using live F. tularensis LVS cells as the antigen for immunization. All manipulation with living cells of this pathogen was carried out in the certified microbiological facilities holding the required permissions. The female mice BALB/c were obtained from ANLAB (Prague, Czech Republic), the myeloma cell line was Sp2/0-Ag14. Isotypes of selected antibodies were evaluated by the Mouse monoclonal antibody isotyping kit from Roche (Indianapolis, IN, USA). Total protein was determined using the protein kit TP0100 and bovine serum albumin (BSA) was from Sigma (St. Louis, MO, USA). Concentration of mouse antibodies was evaluated by the solid phase extraction (SPE) using CBind L column (Fluka, Buchs, Switzerland) with immobilized protein L [13] and consequently protein content of the purified fraction was determined.

2.2 Lipopolysaccharides preparation

Lipopolysaccharides were prepared consequently from Francisella tularensis LVS (ATCC 29648), Escherichia coli (ATCC 9637) and Bacillus subtilis (ATCC 11774). LPS fractions were released from whole cells (109 CFU, colony-forming unit) by continuous suspendation; 1 ml of buffer consisting of 0.25 M EDTA and 0.5 M Tris-HCl (pH=7.2) in the suspendation tube was placed into an ice bath for 30 min [14,15]. The suspension was centrifuged (9000 g, 10 min) and the pellet was discarded. Thus obtained crude LPS was dialyzed against 5 l of PBS (50 mM phosphate pH=7.4 with 150 mM NaCl) overnight, concentrated by membrane filtration and stored in a freezer for further use. LPS prepared in this manner contained no detectable amount of protein according to the total protein kit. For detection purpose, concentration was adjusted to 0.1 mg/ml (the amount in the dry state) from the pooled solution.

2.3 Indirect ELISA

A 96-well polystyrene microplate (Gama, České Budějovice, Czech Rep.) was coated with 100 μl of the LPS solution overnight. The plate was washed with PBS, blocked with 150 μl gelatin (Merck, Whitehouse Station, NJ, USA) for one hour, emptied and washed with PBS. 100 μl antibody sample per well (in triplicate) was added diluted in the scale: 1:10, 1:50, 1:100, 1:150, 1:200, 1:250 and 1:300, alternatively 100 μl PBS was used as blank, and incubated at 37 °C for 60 min. After washing with PBS containing 0.2% Triton X-100, the antibodies specific against either IgM or IgG, both labeled with peroxidase (Serotec, Oxford, UK) diluted 1:100 were added in the amount of 100 μl per well and incubated at 37 °C for 30 min. The microplate was again washed with the PBS / Triton X-100 solution. Finally, a fresh solution of 0.5 mg/ml o-phenylenediamine (OPD) and 5 mM H2O2 was added in dark for 1 min and the reaction was stopped with 100 μl of 2 M H2SO4. Absorbance at 490 nm was measured using the ELISA reader MRX (Dynatech Laboratories, Chantilly, VA, USA).

2.4 Immobilization of LPS on the sensor surface

The piezoelectric 10 MHz quartz crystals were obtained from International Crystal Manufacturing (ICM, Oklahoma City, OK, USA). The 14 mm quartz discs involved 5 mm diameter gold electrodes on both sides. Each new sensor was cleaned by dipping into acetone at laboratory temperature for 30 min and then washed by distilled water and dried. The self-assembled monolayer (SAM) was formed using 10 mg/ml aqueous solution of cystamine spread over the electrode (20 μl) and incubated for 2 hours. After washing with water and drying, the obtained SAM was activated in 3% glutaraldehyde aqueous solution for 2 hours, washed with water and dried. Next, LPS solution obtained from either F. tularensis, E. coli or B. subtilis was deposited onto the electrode surface and let in the refrigerator overnight. The remaining non-specific binding sites were eliminated by incubation with 10 mg/ml BSA for 2 hours.

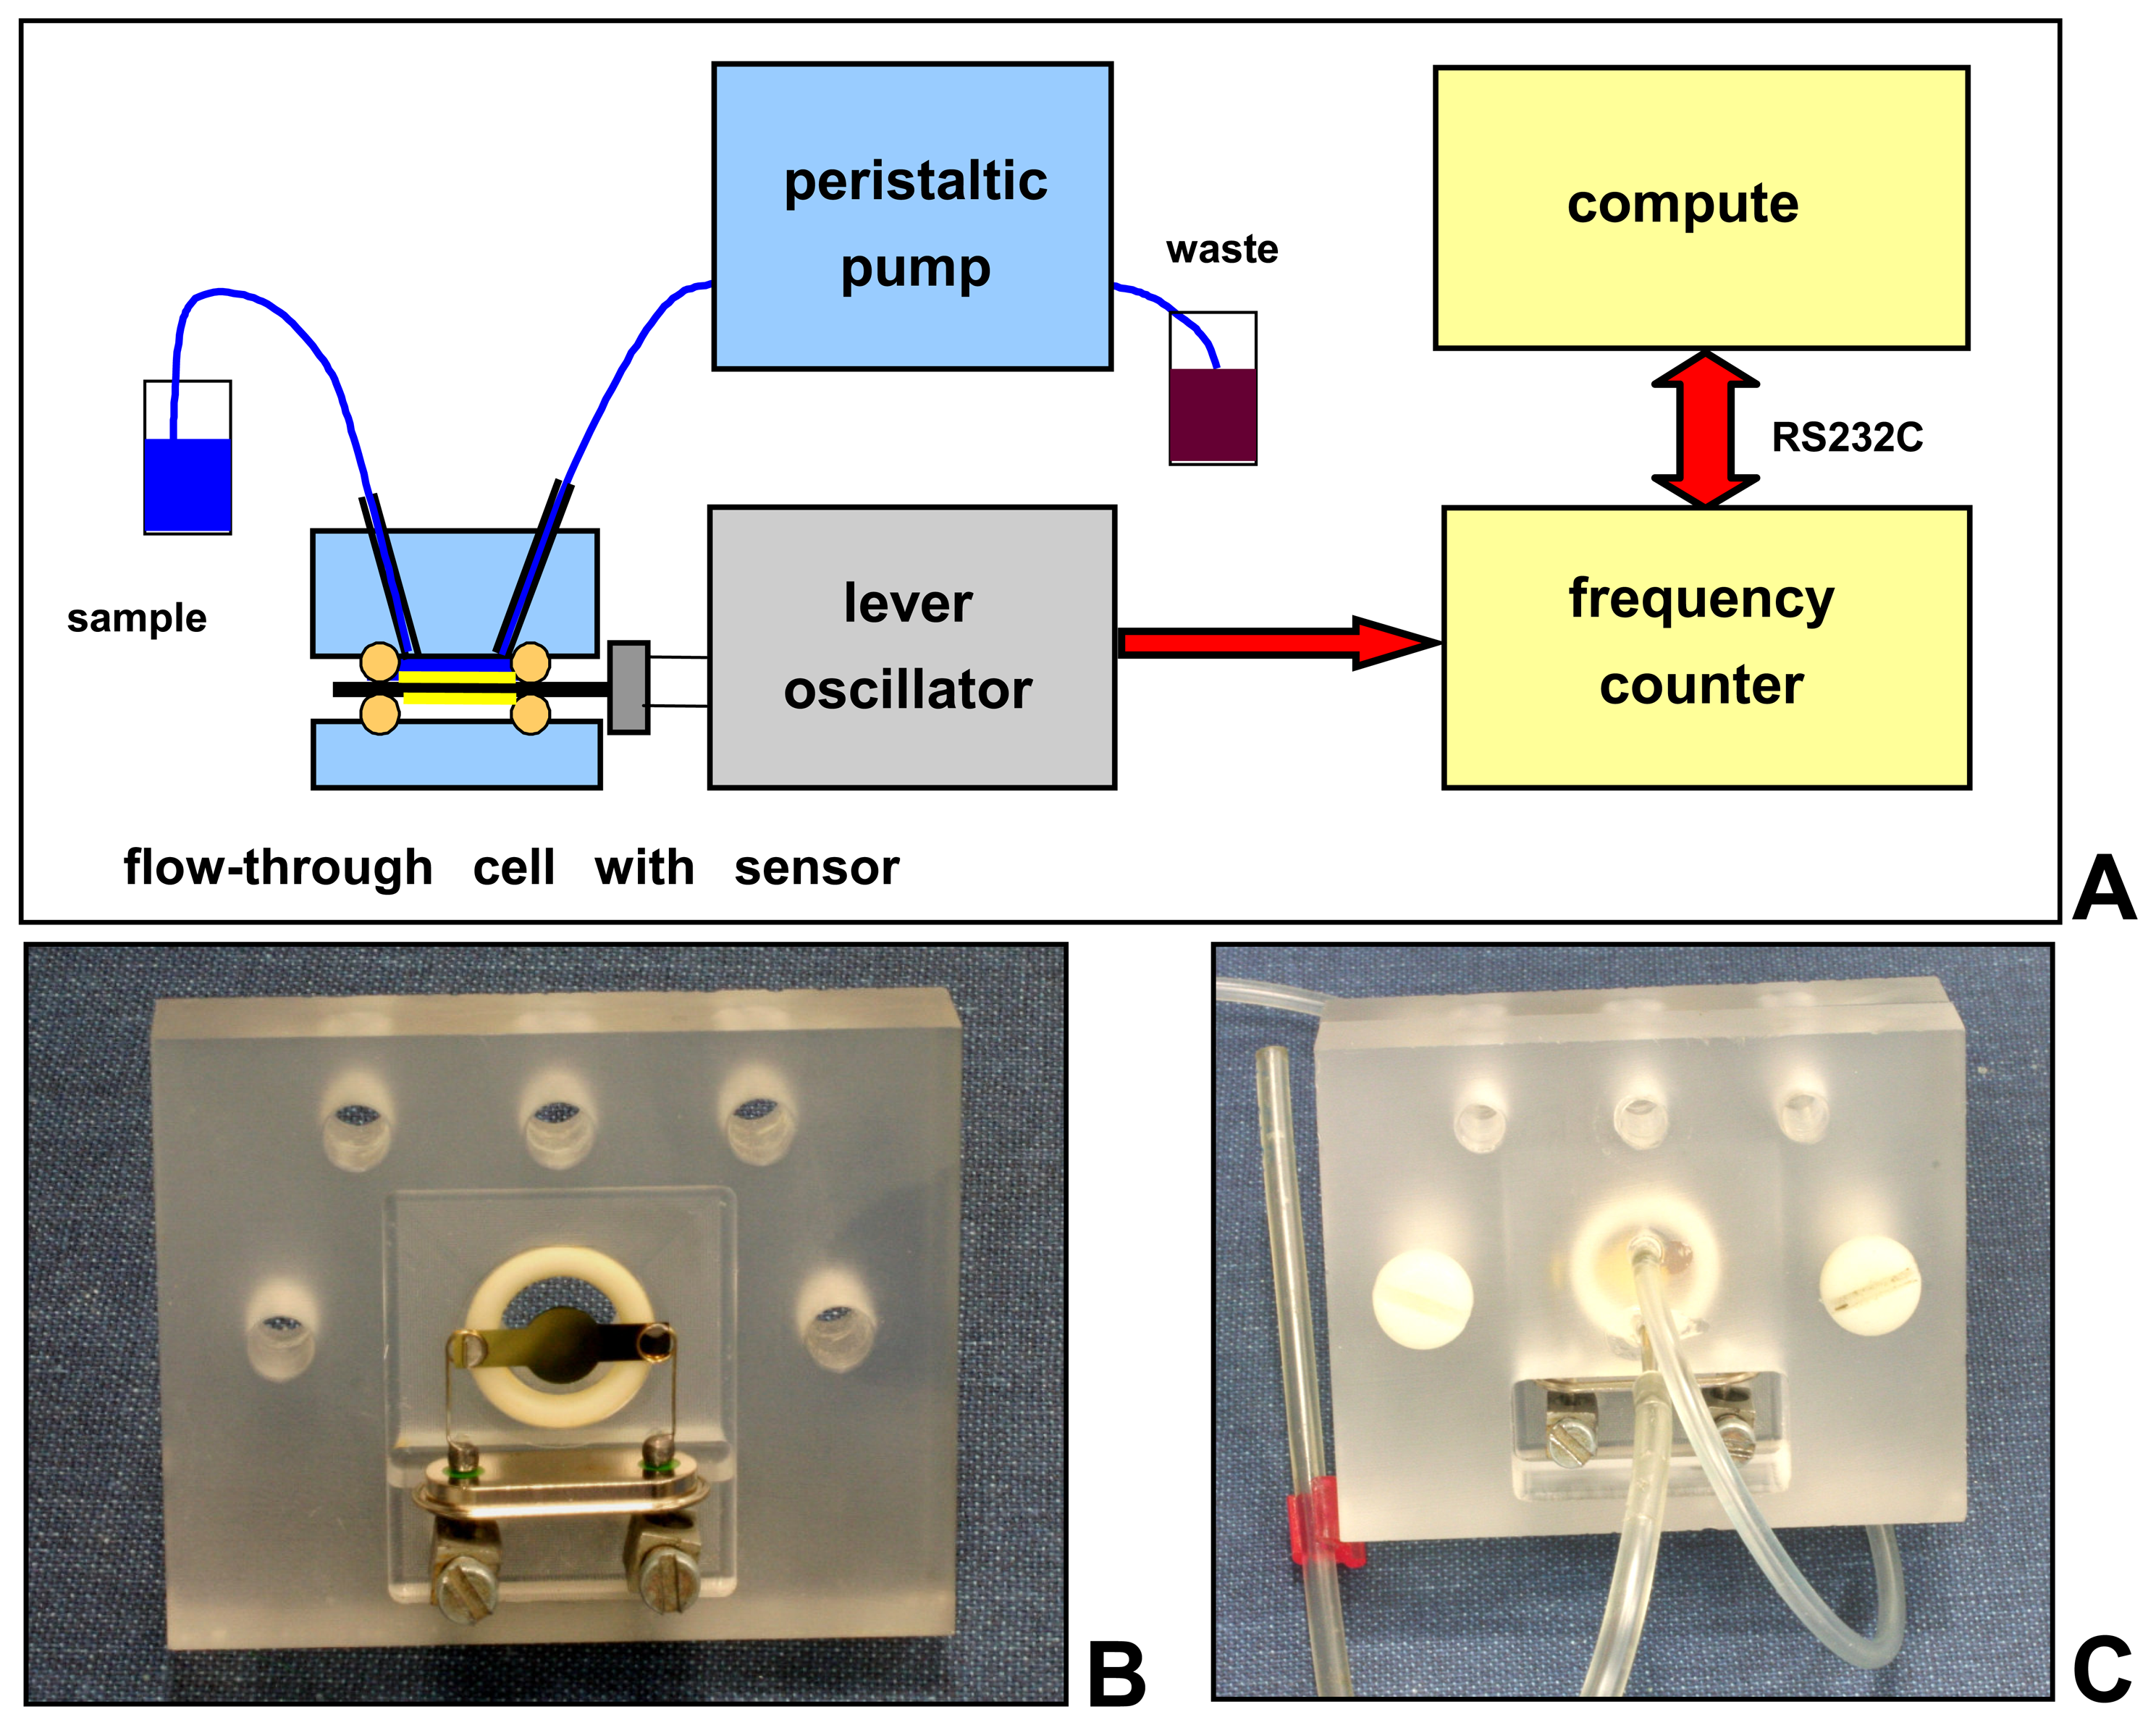
2.5 Experimental setup

The piezoelectric system in a flow through arrangement was used. The Lever Oscillator (ICM) and counter (Grundig, Fuerth, Germany) worked under the own software LabTools (Fig. 1), sampling time was 1 s and frequency resolution 0.2 Hz. Samples were transported by the peristaltic pump (PCD 21M, Kouřil, Kyjov, Czech Rep.) using silicon tubes into the flow through cell with the piezoelectric biosensor fixed between two silicone rubber o-rings (Fig. 1B and C), internal volume was 10 μl. The cell was oriented vertically in order to facilitate release of occasionally formed bubbles. Flow rate was adjusted to 50 μl/min, this is sufficiently high to avoid mass transfer limitations. PBS was used for dilution of samples and as the carrier buffer. Each measuring cycle consisted of the following steps: 2 min flow of the carrier to stabilize baseline signal, 2 min sample, 2 – 5 min flow of the carrier for signal stabilization. When isotypization was required, 2 min flow of the secondary antibody was applied (either anti IgG or anti IgM, supplied from Serotec, Oxford, UK), followed again with 2 – 5 min of the carrier. Regeneration was realized with a 2 min flow of 50 mM NaOH. Samples and other reagents were diluted with PBS, the dilution ratio for samples was from 1:10 up to 1:300. For statistical purpose, each sample was measured three times.

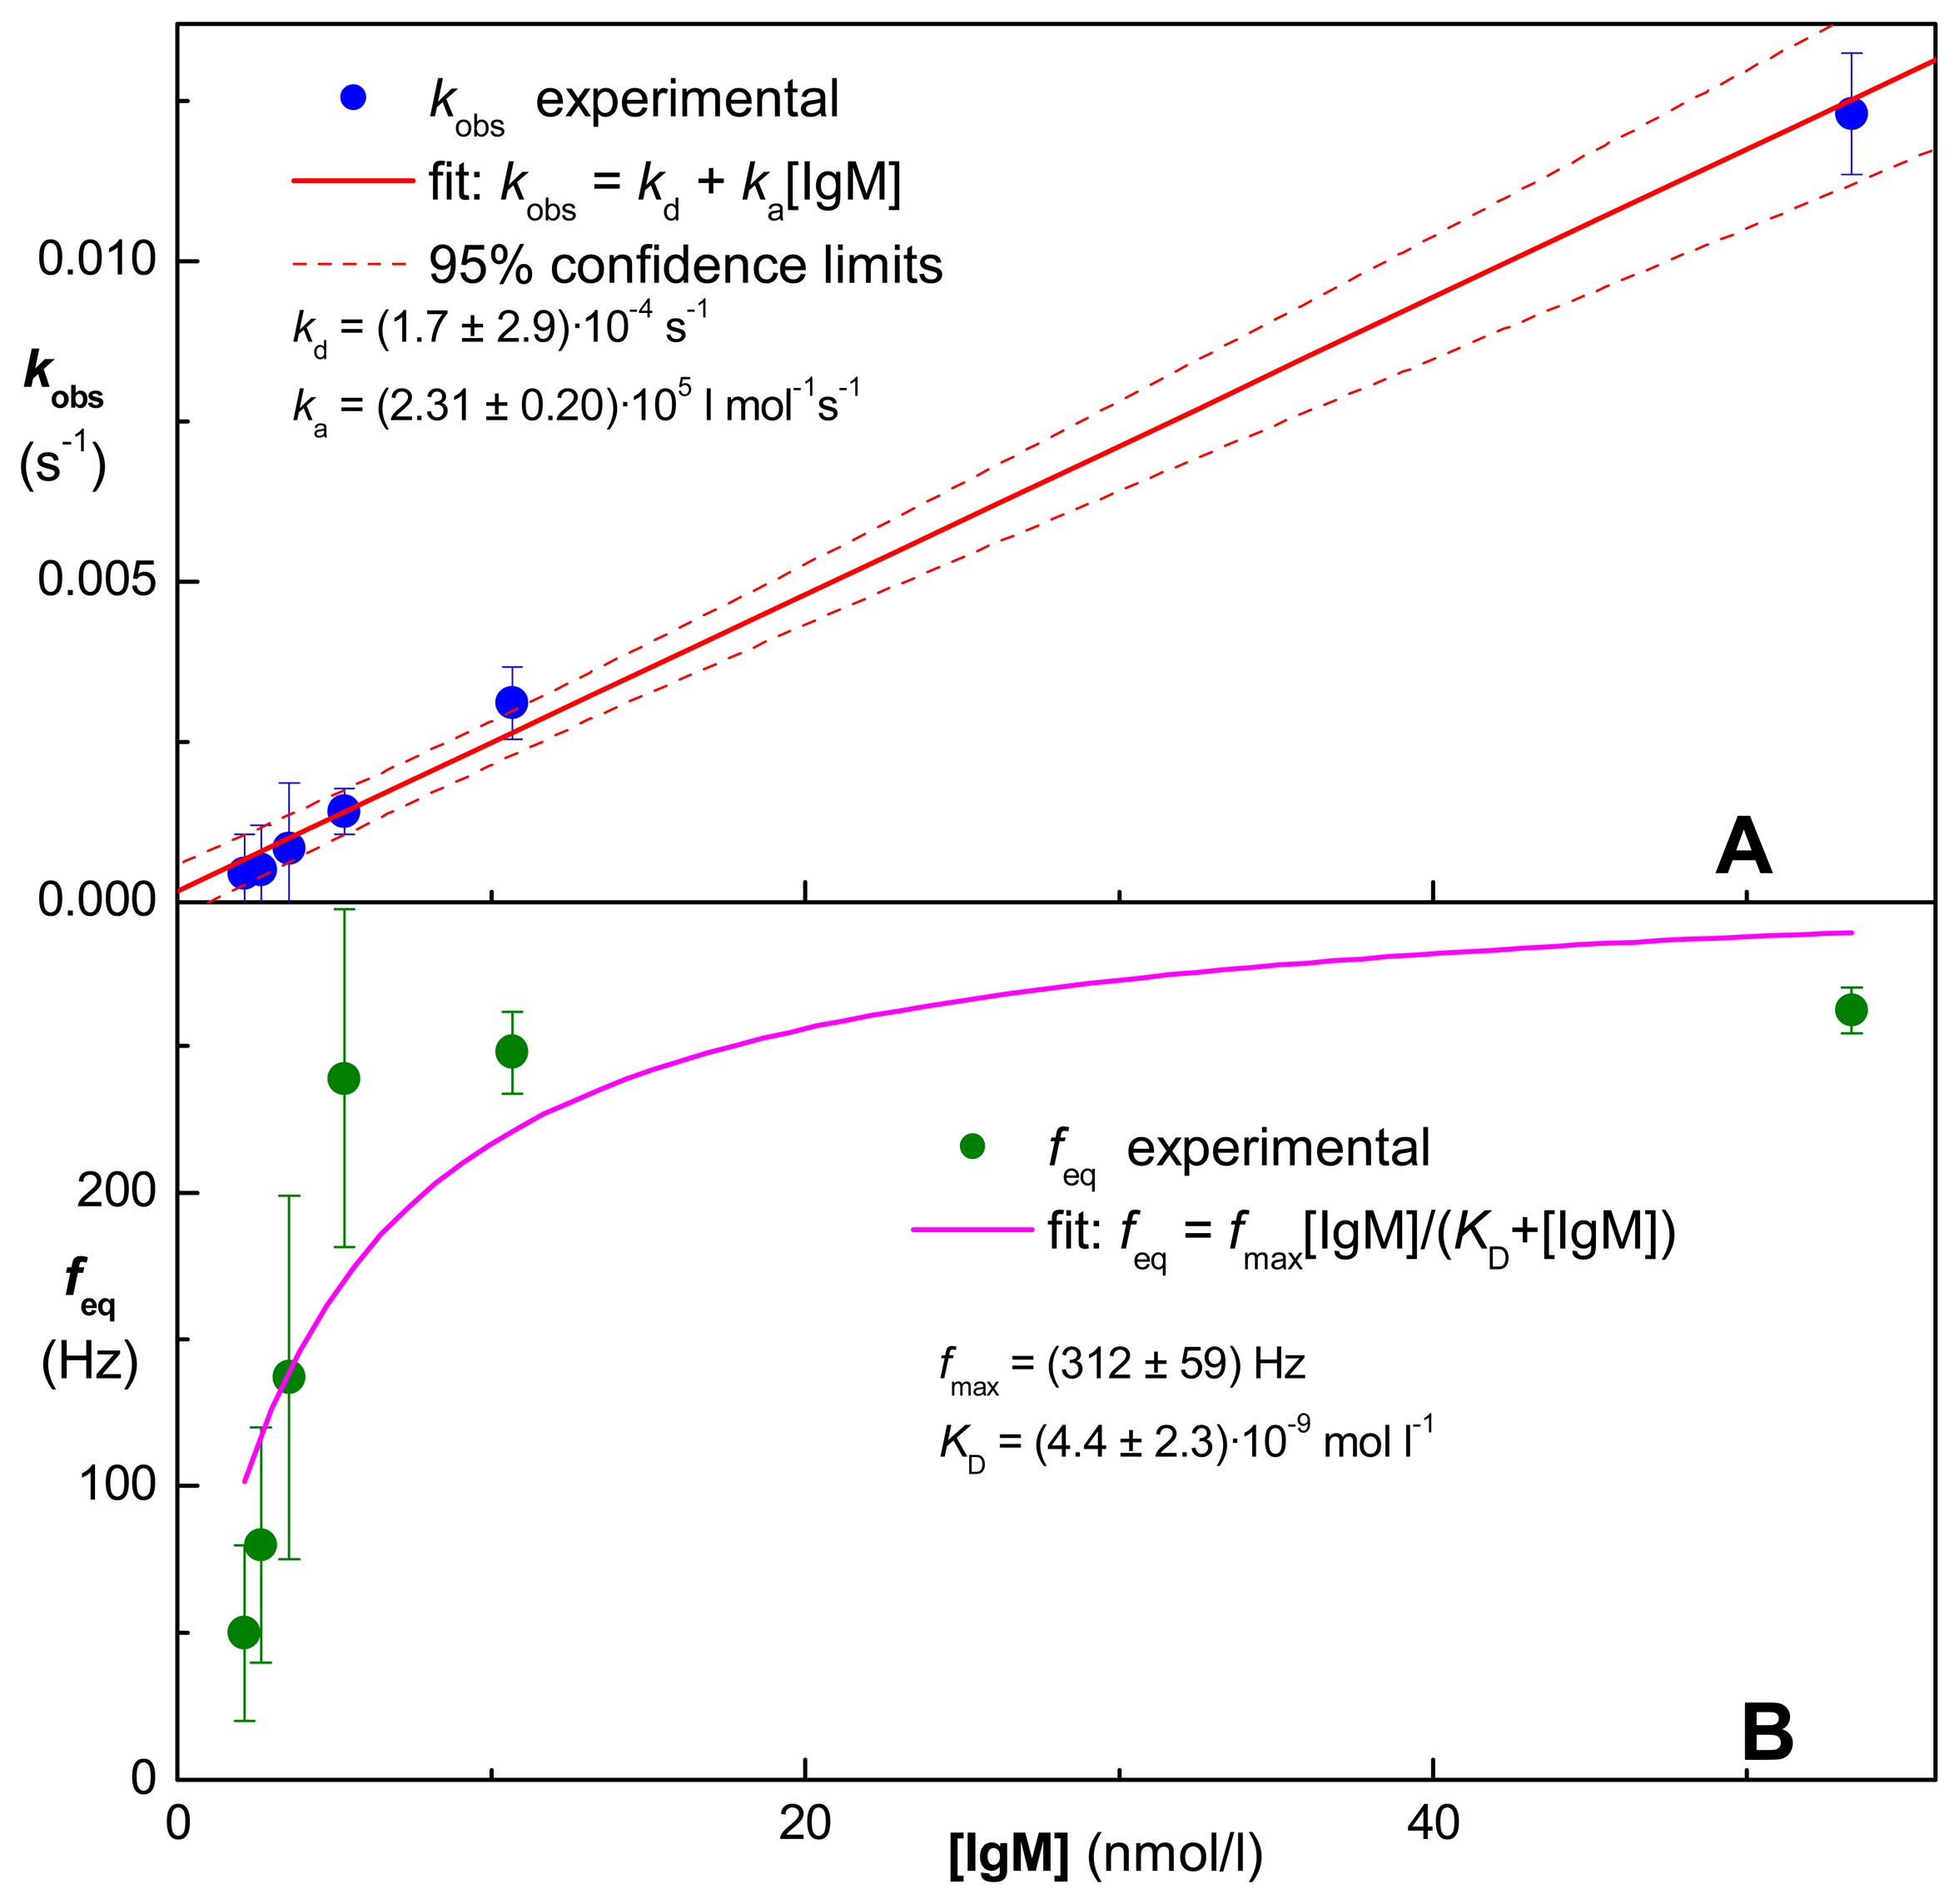
2.6. Kinetic calculations of the antigen-antibody interaction

The binding of the sample containing antibody IgM on the piezoelectric biosensor surface with immobilized lipopolysaccharide (|-LPS) represents the forward reaction - the association phase of the immunointeraction described by the kinetic rate association constant ka, the following reverse breakdown of the surface-bound immunocomplex (|-LPS-IgM) in buffer corresponds to the dissociation step characterized by the kinetic rate dissociation constant kd:
| LPS + IgM k d k a | LPS IgM
For kinetic interpretation of the whole process, the previously reported approach [16] was adopted. The change of the resonant frequency f in time t was measured as the response; fmax represents the maximal binding capacity of the sensor and the initial frequency is considered as zero. IgM concentration in solution was c and its molecular weight was considered as 900 kDa. Kinetics parameters ka and kd for dissociation were obtained using eq. 1:
f = k a c f max k a + k d { 1 exp [ ( k a c + k d ) t ] } = f e q [ 1 exp ( k obs t ) ]
Non-linear regression (Origin, Microcal, Northampton, MA, USA) employed the simplified form of eq. 1 containing only feq (change of signal at the equilibrium) and kobs (the observed kinetic rate constant) substituting parameters which depend on the concentration c. The value of kd can also be obtained independently from the dissociation step with the help of eq. 2 where fa means the achieved binding signal existing at the beginning of the dissociation:
f = f a exp ( k d t )
From thus obtained kinetic rate constants, it was possible to calculate the kinetic equilibrium association KA and dissociation KD constants:
K A = 1 / K D = k a / k d

3. Results and Discussion

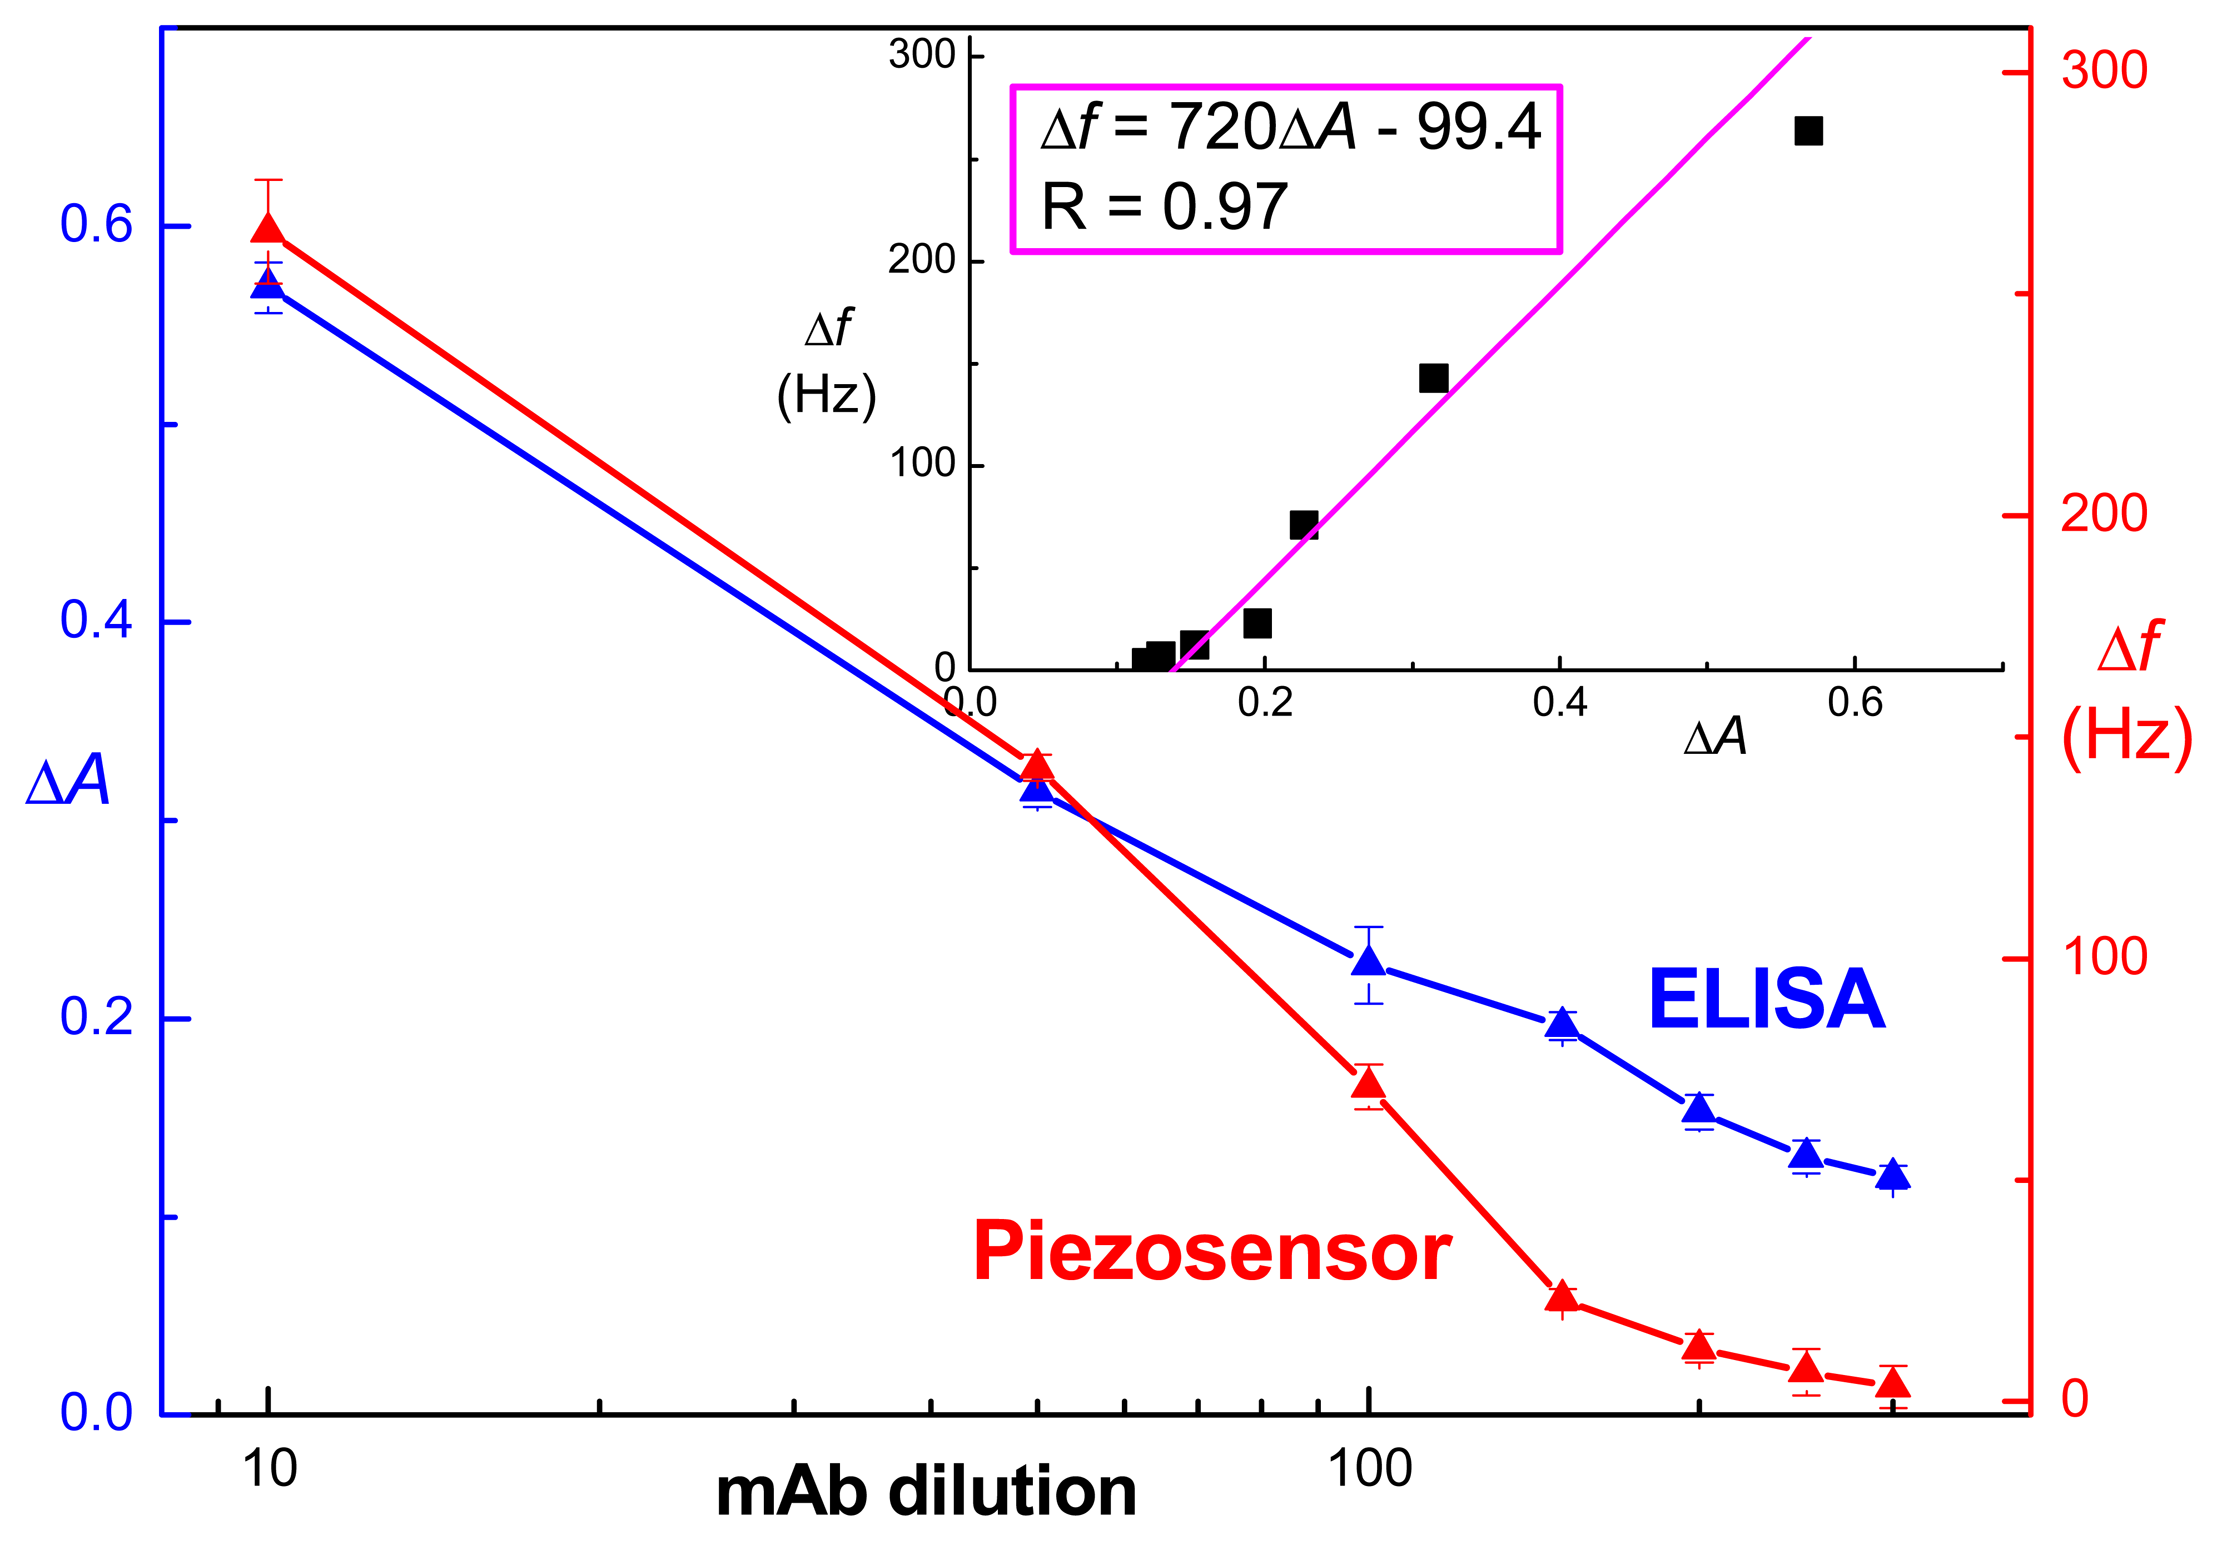
3.1. Screening of antibodies

In the present study, the selection and characterization of monoclonal antibodies specific against the pathogenic microorganism Francisella tularensis was realized with the help of a piezoelectric immunosensor. The screening of hybridoma cell cultures potentially producing specific antibodies was realized using ELISA as a standard procedure and the immunosensor as a promising alternative method. ELISA provided the commonly used value of titer, the immunosensor responded directly to the binding reaction. In both cases, the lipopolysaccharide fraction of the bacterium was utilized as the screening ligand either coated on the microwell surface or covalently immobilized at the immunosensing area. From the total number of hybridoma cultures evaluated - 96 (equal to number of wells on the plate) the four identified positive clones are summarized in Tab. 1.
Obviously, only one of the clones (designed as 4H3B9D3) exhibited reasonably good preliminary parameters. The antibody 4H3B9D3 titre was defined by the indirect ELISA as 1:320, and also the immunosensor indicated very high binding signal in this case. The other three weakly positive clones were not further considered, as their parameters were substantially worse. The selected monoclonal antibody was isotypized as IgM. For further use, a pooled fraction was prepared which exhibited total protein concentration of 6.7 mg/ml and the content of immunoglobulin was determined as 0.48 mg/ml using affinity purification on the CBind-L column. The other evaluated clones appeared as negative according to both methods.
Furthermore, the antibody 4H3B9D3 was diluted in the scale 1:10, 1:50, 1:100, 1:150, 1:200, 1:250, 1:300 and tested by the piezoelectric immunosensor and ELISA to investigate shapes of dilution curves. The output signal of the piezoelectric sensor was expressed as a difference between baseline frequency and the frequency achieved after sample injection, the difference of absorbance between blank and sample wells was used as the ELISA output. Similar dilution curves were obtained for both approaches (Fig. 2). For the ELISA method, the lowest positively detected dilution was 1:300 (corresponds to 1.6 μg/ml total immunoglobulins), this was slightly higher for the immunosensor -1:250 (1.9 μg/ml immunoglobulins).
The correlation between both methods was linear (Fig. 2, inset graph); however, the linearization of the frequency vs. absorbance dependence provided rather high value of the intercept. This indicates that the absorbance values contain a significant portion of the non-specific interactions. It is more obvious from the absorbance dilution curve, which levels off for the higher dilutions near 0.1, but the zero value is not achieved. On the contrary, response from the immunosensor approaches zero signal change for the lowest concentrations of antibody. This is a great advantage of the direct measurements, where the background signal is quite low. On the other hand, the enzyme and other labels make the ELISA-like approaches more sensitive, but several reaction steps usually contribute significantly to the background values.
Regarding the reproducibility of measurements, for 1:10 / 1:100 diluted samples, the relative standard deviations (RSD) were 2.3% / 8.6% and 4.4% / 7.0% for the ELISA and immunosensor-based methods, respectively. The single-channel piezoelectric immunosensor arrangement was found sufficiently stable under laboratory conditions, though differential arrangements with a reference sensing are might provide even better stability and reproducibility of signals [17].
A main advantage of the piezoelectric immunosensor is the label-free arrangement with significantly shorter time of measurement. One analysis cycle for the immunosensor takes at most only 17 min while 90 min is required for ELISA. Therefore, the immunosensor is most useful when only few samples have to be characterized; otherwise the highly parallel format of ELISA remains more productive. On the other hand, one should also consider the additional kinetic characterization of antibodies resulting from the immunosensor-based measurements.

3.2 Selectivity of the immunosensor and antibody

For evaluation of the sensing selectivity, the signal of mAb 4H3B9D3 diluted 1:10 was compared with negative controls - commercial antibodies without any specificity against Francisella; anti-IgM and anti-IgG antibodies were used; in all cases the total protein was adjusted to 0.67 mg/ml. Commonly used albumin was included, too (1 mg/ml solution). The binding signals obtained using the sensor with immobilized Francisella LPS proved good selectivity of the immunosensor (Fig. 3, left panel). The signal of mAb 4H3B9D3 (264 ± 11 Hz) was approximately two hundred times higher than the negative controls providing 0.7, 1.0 and 1.0 Hz for anti-IgM, anti-IgG and BSA, respectively. Such a high difference is quite sufficient for distinguishing monoclonal antibodies against the target antigen from other immunoglobulins.
Selectivity of the antibody 4H3B9D3 was tested on different immobilized antigens, three types of LPS and albumin (Fig. 3, right panel). The antibody exhibited lowest binding on the surface with immobilized albumin. The other two sensors with immobilized LPS from E. coli and B. subtilis provided signals of 5.7 and 9.3 Hz, respectively, i.e. substantially less than the sensor with LPS from F. tularensis. These results demonstrate excellent recognition selectivities of the immunosensor and quite low cross-reactivity of the developed anti-Francisella antibody.

3.3 Isotypization

One of the most important antibody characteristics is the known isotype. Here, the piezoelectric immunosensor was able to determine not only the antigen-specific antibody, but also the isotype of the surface-bound antibody can be easily tested during the subsequent injection of secondary antibodies specific against murine either IgM or IgG. Such experiment is demonstrated in Fig. 4. Antibody 4H3B9D3 diluted 100 times provided sufficiently high response (71 ± 5.0 Hz) on the LPS-modified surface; thus formed LPS-antibody complex was allowed to interact with the subsequently added anti - mouse IgM secondary antibody (0.1 mg/ml) which caused change of frequency of 29.0 ± 2.7 Hz. In a similar experiment, anti – mouse IgG provided a negligible signal of 0.9 ± 0.6 Hz. These results clearly confirm the isotype of mAb 4H3B9D3 as IgM. Results correspond also with the Isotyping Kit (Tab. 1).
In the immunosensor-based systems, isotypization might be carried out simultaneously with the screening of antibodies, when positive response is obtained in the initial screening step.

3.4. Kinetic calculations

Another important properties of antibody (as well as of any affinity biomolecule) include its kinetic parameters; the equilibrium kinetic constants KA (or alternatively KD, which is its reciprocal value) are accessible from the end-point or (near) equilibrium-based methods as ELISA. However, the more informative kinetic rate constants ka and kd (their values are independent) can be very conveniently obtained using the direct biosensor-based methods following the affinity interaction continuously and in real time [16].
To study the kinetics of binding of the antibody 4H3B9D3 with LPS, the LPS-modified sensor was used and allowed to interact with several different dilutions of antibody; an example of such signal traces is provided in Fig. 5. Each trace consists of the association phase - decrease of frequency during formation of the LPS-IgM immunocomplex in the sensing area; next, dissociation of thus formed immunocomplex is followed in buffer. During the dissociation phase, the immunocomplex appeared to be very stable and practically no dissociation was observed; the signal remained stable in buffer. This behavior did not allow using eq. 3 for determination of kd and only the association phase was evaluated.
The association part of the interaction traces was fitted to the simplified form of eq. 1 and thus obtained values of the parameters kobs and feq were plotted against the corresponding concentration of IgM (Fig. 6). The molar concentration of IgM in the stock antibody solution was estimated as the fraction of immunoglobulins binding to the CBind L column and measuring the protein content in the eluate. Considering the relative molecular mass of IgM equal to 900 kDa, the stock antibody concentration was [IgM] = 530 nmol/l. The dependence of kobs on [IgM] was linear as expected from the substitution in eq. 1 (see also the linear equation inside Fig. 6A), and the linear regression provided the association rate constant as the slope, ka = (2.31 ± 0.20)·105 l mol-1s-1. The intercept corresponds to the dissociation rate constant kd = (1.7 ± 2.9)·10-4 s-1; the standard deviation was very high indicating rather poor precision of this parameter. This was due to the fact that the intercept was quite small (very slow dissociation) and therefore the obtained value seemed to be questionable.
Alternatively, one should consider the meaning of feq used as substitution in eq. 1; the dependence of feq on [IgM] should be hyperbolic as typical for saturated binding to the limited amount of LPS sites on the sensing surface (see also the equation inside Fig. 6B). Non-linear regression provided values of the parameters, the binding capacity of the LPS-modified surface for IgM was fmax = (312 ± 59) Hz and especially the dissociation equilibrium constant KD = (4.4 ± 2.3)·10-9 mol l-1. With the help of equation 3 and using the previously determined value of ka, the rate dissociation constant was kd = (0.0010 ±0.00062) s-1. In this case, the standard deviation was significantly lower than for the previous value of kd based on the kobs plot in Fig. 6A.

4. Conclusions

A novel method for direct detection of monoclonal antibodies was developed using the piezoelectric immunosensor as a convenient tool for screening, isotyping and kinetic characterization. This method was demonstrated on the selection of monoclonal antibodies against F. tularensis, the sensing surface contained the covalently attached lipopolysaccharide from Francisella as the specific immunorecognition element. The measuring set-up was flow-through and the successfully regenerated immunosensor was used repeatedly, thus fulfilling basic requirements for future automation of the whole screening process.
In particular, the monoclonal antibody 4H3B9D3 was selected as the best from the carried out hybridoma screening process. This antibody was selected by both ELISA and the immunosensor as the best binder with the target LPS antigen. Furthermore, the immunosensor was able to carry out screening and isotypization within 25 min using only 100 μl of the (diluted) antibody sample; preliminary kinetic information about the antibody was available, too. A detailed kinetic characterization of the antibody provided both rate and equilibrium constants for its binding with the LPS antigen. The chosen piezoelectric sensor seems to be a competitive affordable alternative to the surface plasmon resonance (SPR) based biosensors. In comparison with the traditional microplate-based screening procedures, the immunosensor carries out the screening in real time and the acquired binding curve provides more focused information about the individual antibody clones.

Acknowledgments

The support through the grant from the Czech Ministry of Education (MSM 0021622413) is gratefully acknowledged.

References and Notes

  1. Emanuel, P.A.; Dang, J.; Gebhardt, J.S.; Aldrich, J.; Garber, E.A.E.; Henrieta, K.; Stopa, P.; Valdes, J.J.; Schultz, A.D. Recombinant antibodies: a new reagent for biological agent detection. Biosens. Bioelectron. 2000, 14, 761–770. [Google Scholar]
  2. Hitchcock, P.J.; Leive, L.; Makela, H.; Rietschel, E.T.; Strittmatter, W.; Morrison, D.C. Lipopolysaccharide nomenclature - past, present, and future. J. Bacteriol. 1986, 166, 699–705. [Google Scholar]
  3. Lerouge, I.; Vanderleyden, J. O-antigen structural variation: mechanisms and possible roles in animal/plant-microbe interactions. FEMS Microbiol. Rev. 2002, 26, 17–47. [Google Scholar]
  4. Weintraub, A. Immunology of bacterial polysaccharide antigens. Carbohydrate Res. 2003, 338, 2539–2547. [Google Scholar]
  5. Fulop, M.J.; Webber, T.; Manchee, R.J.; Kelly, D.C. Production and characterization of monoclonal-antibodies directed against the lipopolysaccharide of Francisella tularensis. J. Clin. Microbiol. 1991, 29, 1407–1412. [Google Scholar]
  6. Özcürümez, M.P.; Kischel, N.; Priebe, H.; Splettstösser, W.; Finke, E.J.; Grunow, R. Comparison of enzyme-linked immunosorbent assay, western blotting, microagglutination, indirect immunofluorescence assay, and flow cytometry for serological diagnosis of tularemia. Clin. Diagn. Lab. Immun. 2004, 11, 1008–1015. [Google Scholar]
  7. Ota, M.; Sawamura, D.; Yokota, K.; Ueda, M.; Horiguchi, Y.; Kodama, K.; Goto, M.; Shimizu, H. 2005. A unique monoclonal antibody 29A stains the cytoplasm of amniotic epithelia and cutaneous basement membrane. J. Deratol. Sci. 2006, 42, 23–29. [Google Scholar]
  8. Sumi, M.G.; Mathai, A.; Sarada, C.; Radhakrishnan, V.V. Rapid diagnosis of tuberculous meningitis by a dot immunobinding assay to detect mycobacterial antigen in cerebrospinal fluid specimens. J. Clin. Microbiol. 1999, 37, 3925–3927. [Google Scholar]
  9. Llorente, M.J.; Jimenez, J.; Gonzalez, C.; Alarcon, I.; Alsina, M.; Casas, L.M.; Benedito, J.E.; Araquistain, L.J.; Farre, V.; Gonzalez-Buitrago, J.M. Effectiveness of different methods for anti-Sm antibody identification. A multicentre study. Clin. Chem. Lab. Med. 2005, 43, 748–752. [Google Scholar]
  10. Kikuchi, Y.; Uno, S.; Nanami, M.; Yoshimura, Y.; Iida, S.; Fukushima, N.; Tsuchiya, M. Determination of concentration and binding affinity of antibody fragments by use of surface plasmon resonance. J. Biosci. Bioeng. 2005, 100, 311–317. [Google Scholar]
  11. Skládal, P. Effect of methanol on the interaction of monoclonal antibody with free and immobilized atrazine studied using the resonant mirror-based biosensor. Biosens. Bioelectron. 1999, 14, 257–263. [Google Scholar]
  12. Thirumalapura, N.R.; Morton, R.J.; Ramachandran, A.; Malayer, J.R. Lipopolysaccharide microarrays for the detection of antibodies. J. Immunol. Meth. 2005, 298, 73–81. [Google Scholar]
  13. Thomas, T.M.; Shave, E.E.; Bate, I.M.; Gee, S.C.; Franklin, S.; Rylatt, D.B. Preparative electrophoresis: a general method for the purification of polyclonal antibodies. J. Chromatogr. A. 2002, 944, 161–168. [Google Scholar]
  14. Leive, L.; Shovlin, V.K. Physical, chemical and immunological properties of lipopolysaccharide released from Escherichia coli by ethylenediaminetetraacetate. J. Biol. Chem. 1968, 243, 4384–4391. [Google Scholar]
  15. Laegreid, W.; Hoffman, M.; Keen, J.; Elder, R.; Kwang, J. Development of a blocking enzym-linked immunosorbent assay for detection of serum antibodies to O157 antigen of Escherichia coli. Clin. Diagn. Lab. Immun. 1998, 5, 242–246. [Google Scholar]
  16. Horáček, J.; Skládal, P. Effect of organic solvents on immunoassays of environmental pollutants studied using a piezoelectric biosensor. Anal. Chim. Acta 2000, 412, 37–45. [Google Scholar]
  17. Lieberzeit, P.A.; Glanznig, G.; Jenik, M.; Gazda-Miarecka, S.; Dickert, F.L.; Leidl, A. Softlithography in Chemical Sensing – Analytes from Molecules to Cells. Sensors 2005, 5, 509–518. [Google Scholar]
Fig. 1. (A) Schema of the measuring setup consisting of the flow-through cell with the piezoelectric quartz crystal; opened (B) and assembled (C) views. The sensor is driven by the lever oscillator and the output frequency is recorded using a general-purpose counter and continuously transferred to the computer. Flow is realized using the peristaltic pump.
Sensors 07 00341f1
Fig.2. Dilution curves (scale from 1:10 to 1:300) for the monoclonal antibody 4H3B9D3 obtained using the indirect ELISA and the piezoelectric immunosensor. The ELISA microplates were coated with F. tularensis LPS, and 100 μl of sample was used for testing. The secondary anti mouse Ab labeled with peroxidase was the tracer and the response is presented as absorbance of the enzyme product corrected for the blank value (blue symbols). Similar experiment was carried out using the piezoelectric sensor covalently modified with LPS, response (red symbols) indicates the change of frequency after the flow of 100 μl sample. The inset graph shows the correlation between the values from ELISA and immunosensor including parameters of the linear regression. The error bars indicate estimated standard deviations (n = 3).
Sensors 07 00341f2
Fig. 3. Specificity of the piezoelectric sensor with immobilized LPS from F. tularensis (left, blue bars). The specific sample (100 μl) was the monoclonal antibody 4H3B9D3 diluted 1:10 (final protein concentration 0.67 mg/ml). As negatives controls, commercials antibodies anti-IgM (Ab1) and anti-IgG (Ab2) (both adjusted to the total protein 0.67 mg/ml) were used as well as BSA at 1 mg/ml. At right (red bars), specificity of the monoclonal antibody 4H3B9D3 (100 μl sample, protein concentration 0.67 mg/ml) was tested using piezoelectric immunosensors with immobilized LPS obtained from either F. tularensis, E. coli or B. subtilis, and also immobilized albumin (BSA) was used. The error bars indicate estimated standard deviations (n = 3).
Sensors 07 00341f3
Fig. 4. Isotyping of the mAb 4H3B9D3 using the piezoelectric sensor modified with LPS from F. tularensis. At first, the tested antibody was allowed to bind on the surface and after washing with buffer, either anti-IgG (blue curve) or anti-IgM (red curve) secondary antibody was injected.
Sensors 07 00341f4
Fig. 5. The influence of the mAb 4H3B9D3 dilution (indicated inside the figure) on the binding response obtained with the piezoelectric sensor modified with the LPS from F. tularensis. The sample volume was 100 μl.
Sensors 07 00341f5
Fig. 6. Evaluation of the kinetic parameters for the mAB 4H3B9D3. The binding traces (similar as shown in Fig. 5) were approximated by the eq. 2 and the parameters kobs (top, blue) and feq (bottom, olive) obtained using the non-linear regression are plotted vs. the corresponding molar concentration of the antibody. The dependence of kobs was linearized (top, red line), the dependence of feq was fitted to a hyperbolic equation (bottom, magenta curve).
Sensors 07 00341f6
Tab. 1. Selection of monoclonal antibodies against F. tularensis from the best producing hybridomas identified as positive ones. Comparison of results obtained by the ELISA procedure (Titer) and response of the piezoelectric biosensor. The type of antibody was determined using the commercial Isotyping kit.
AntibodyIsotypeTiterSignal (Hz)
6E5D7E11IgG2a≥105
3E5E3G12IgG2a≥108
4H3B9D3IgM≥320264
4H3H6B8IgM≥106

