Measurement of the Mass and Rigidity of Adsorbates on a Microcantilever Sensor

1
BioNanoMechanics Lab, National Centre for Microelectronics, IMM-CNM, CSIC, Isaac Newton 8 (PTM), Tres Cantos 28760, Madrid, Spain
2
Genomics Functional Unit, Department of Immunology and Oncology, CNB-CSIC, Darwin 3, Madrid 28049, Spain
*
Author to whom correspondence should be addressed.
Sensors 2007, 7(9), 1834-1845; https://doi.org/10.3390/s7091834
Submission received: 27 July 2007
/
Accepted: 6 September 2007
/
Published: 7 September 2007
(This article belongs to the Special Issue Cantilever, Microcantilevers and Nanocantilever Sensors and Biosensors)
Abstract
:When microcantilevers are used in the dynamic mode, the resonance shift upon material adsorption depends on the position of the adsorbate along the microcantilever. We have previously described that the adsorbate stiffness needs to be considered in addition to its mass in order to correctly interpret the resonance shift. Here we describe a method that allows obtaining the Young's modulus of the adsorbed bacteria derived from the measurement of the frequency shift when adsorbates are placed close to the clamping region. As a model system we have used E. Coli bacteria deposited on the cantilever surface by the ink-jet technique. We demonstrate that the correct information about adsorbed mass can be extracted by recording the cantilever profile and its resonance response. Also, the position and extent of adsorbates is determined by recording the microcantilever profile. We use a theoretical model based on the Euler – Bernouilli equation for a beam with both mass and flexural rigidity local increase due to the deposited material.
1. Introduction
Microcantilevers have demonstrated their potential to be used as highly sensitive sensors. They have been applied in diverse fields, such as nanocalorimetry [1], infrared detection [2], gas sensing [3], particle flux measurements [4], acoustic waves detection [5] and also as biosensors [6]. They are used by applying two different principles of actuation, the static and the dynamic modes. The static mode measures the deflection of the beam due to the adsorption of molecules on one side of the cantilever. This adsorption produces a differential surface stress and the consequent bending of the beam. The dynamic operation mode is devoted to measure the resonance of the cantilever. Usually, the resonant frequency is changed by the mass bounded to the cantilever surface [7]. It has been demonstrated that the resonating microcantilevers can detect added mass at the level of zeptograms [8] and single biological entities [6]. The mass measurements are handicapped by the presence of damping forces and inertial masses when we are trying to operate in the natural environment of the molecules of interest [9,10]. These external factors are related with the low quality factor measured in liquids and the poor signal – to – noise ratio. To improve the sensitivity of the frequency measurements the experiments are usually performed in air or vacuum. Also, the intrinsic sensitivity of the measurements can be enhanced by using higher resonance frequencies. These frequencies can be reached by shrinking the structures or by using higher resonant modes. Therefore, it is predictable an increased sensitivity in the mass detection by improving the nanofabrication techniques.
The shrinking of cantilever devices raises new questions when adsorbed masses are to be detected and measured with them. It is known that when the adsorbate is not uniformly distributed over the cantilever, the position of the adsorbate affects the dynamic response in different ways depending on the mass position with respect to the cantilever end [11]. However, as the size of the device approaches the dimensions of the adsorbed material, the change in the local moment distribution along the cantilever length plays a very important role that in some conditions can overpass the response due to the added mass [12,13].
Here we describe a method that allows fast and reliable determination of the mass position through the recording of the cantilever profile. This information, together with the read-out of the vibration response, allows the correct determination of the adsorbed mass. The model used here accounts for both the effect of the adsorbate stiffness and the effect of the added mass [12,13]. According to this theoretical scenario, to calculate the mass of an inhomogeneous layer it is necessary to determine the position and the flexural rigidity of the target, besides the frequency shift. The position is recorded here taking into account the change of curvature caused by the material adsorption on the cantilever surface. If the adsorption takes place only on a restricted region of the surface, a local change of curvature is observed. This change of curvature is observed in the profile, acquired by using a recently developed technique [14], of the cantilever recorded before and after the adsorbate deposition. The use of this technique allows obtaining the curvature of the cantilever as a function of the position.
In this work, the resonance frequencies of the cantilevers are measured by acquiring the spectrum of the Brownian motion of the cantilevers vibrating in air. The relative frequency shift of the first three resonant modes is compared in order to choose the mode that provides the major sensitivity for the mass measurements. Here, we present experiments showing how the resonance is shifted to lower frequencies when the bacteria cells are placed at the free end of the cantilever and to higher frequencies when the same added mass is placed close to the clamped end. We show that the stiffness can be experimentally measured if the adsorbates are placed near the clamping of the microcantilever.
2. Materials and Methods
The E. Coli suspension was obtained by centrifugation of the Luria Bertani (LB) broth in which the E. Coli bacteria were grown. The resulting pellet was resuspended in ultrapure water to avoid the effects of the salt crystals when buffer solutions are used. By using the ink–jet technique, 0.5 nanoliter droplets of bacteria suspension were achieved. The micropipette (Microdrop Gmbh) was mounted on a microposition XY stage in order to control the position of the deposited drop along the cantilever with ±10 μm accuracy. Commercial rectangular with triangular free end tipless silicon cantilevers (NanoWorld) were used for the experiments. Their length, width and thickness were 500 μm, 100 μm and 1 μm respectively. In order to simplify the theoretical calculations, the triangular free end was substituted by an effective rectangular cantilever, taking the barycentre of the triangle as the end of the effective rectangular shape.
Since the quality factor of the oscillation of cantilevers immersed in liquids is very low, the resonance frequency was measured in air, comparing the effects of the adsorption on the resonance before and after the deposition of the cells. The short time delay between the measurements (about 15 min) assures that the temperature and pressure of the surrounding air in the laboratory conditions do not sufficiently change to affect the resonance of the cantilevers.
The out of plane vibrational resonant modes of the cantilever used in this work were measured using the optical beam deflection method. A laser diode (3 mW, 635 nm, Edmund optics Ltd.) was focused on the free end of the cantilever and the reflected spot was collected by a double split photodiode used as a position sensitive detector (Hamamatsu). The photocurrents are preamplified by current to voltage converters (HMS). The signals of the different quadrants of the photodiode are then processed by a summing amplifier (Stanford Research Systems, SIM 980). The amplified signals are connected to the PC via digital-to-analog converters (National Instruments) which separate the AC and the DC coupling of the signal. To measure the resonant peaks, fast frequency sweeps were performed in the range of 1 ms. Then a Fast Fourier Transform of the vibration is performed to obtain the resonant peaks.
The profile of the cantilever before and after bacteria deposition is recorded by a scanning laser set-up. This readout technique combines the optical beam deflection method and the automated two-dimensional scanning of a single laser beam by voice-coil actuators. Fig. 1 shows a schematic drawing of the experimental set-up. The laser diode is mounted on two perpendicular linear voice coil actuators (Physik Instrumente GmbH & Co.) for two-dimensional scanning of the cantilever array. Voice coil actuators are based on the Lorentzian force between a radial field created by permanent magnets embedded on the inside diameter of a ferromagnetic cylinder and a current-carrying coaxial tubular coil that moves along the axial direction. The force is proportional to the applied current to the coil. Conversely, a voltage is induced in the coil that is proportional to the velocity, allowing accurate readout of the position. The advantages of using voice coil actuators include non-hysteretic displacement, a range of several millimetres, speeds of up to 50 mm/s and an accuracy of 100 nm. In our set-up, one of the scanning axes is oriented parallel to the cantilever longitudinal axis to record the cantilever profile. The laser beam is focused and directed in order to illuminate different locations of each cantilever of the array. The reflected beams off the chip are collected by a two-dimensional linear position detector (On-Trak Photonics, Inc.). The photocurrents generated on the PSD are processed by a four channel current amplifier system using a position sensing algorithm to give three analog outputs which are directly proportional to the total light collected on the PSD and to the coordinates of the reflected laser beam on the PSD, independently of the light intensity fluctuations.
3. Results and Discussion
3.1. Theory
In order to describe the response of the microcantilevers upon adsorption of an inhomogeneous layer, we propose a model that is based on the Rayleigh's method. This method consists of an energy – work balance during a vibration cycle. Assuming a harmonic vibration u(x,t)∼ ψn(x)cos(ωnt+α) where ψn is the flexural vibration mode shape of the unloaded cantilever; ωn is the nth flexural eigenfrequency of the loaded cantilever and α is an arbitrary value of the oscillation phase, the resonant frequency can be calculated as [13]
Where x is the spatial coordinate along the cantilever, ρc and Tc are the cantilever mass density and thickness, respectively; ρa is the mass density of the material adsorbed on the cantilever, Ta is the adsorbate thickness that depends on x, w is the width and D(x) is the cantilever flexural rigidity that depends on x. The adsorbate locally modifies the flexural rigidity according to [15],
where Ec and Ea are the Young's modulus of the cantilever and adsorbed material, respectively. The flexural rigidity is a measure of the stiffness of the cantilever. It can be obtained as the product of the modulus of elasticity and the moment of inertia per unit length.
The flexural vibration shape of the unloaded cantilever is given by [16]
where kn satisfy the boundary conditions and are given by kn =1.8751, 4.6941, 7.8548,…
We have applied the above equations to estimate the frequency shift of the first three resonant modes due to the adsorption of a finite structure on the cantilever. In order to simplify the theoretical calculation and compare it to the experiments, the adsorbates are modelled as a solid disc. The diameter of this disc is 120 μm, approximately the diameter of the droplet obtained by the ink-jet technique. By equalling the volume of the all bacterial cells to the volume of a pad, we deduce an effective thickness of 800 nm, smaller than the bacteria thickness, 1 μm. The estimated adsorbed mass is 3.3 ng which is equivalent to 4200 cells, and the Young's modulus is 1GPa, which is in the range of values obtained by atomic force microscopy measurements in dried bacteria [17].
Fig. 2 shows the relative frequency shift of the first three resonant modes versus the position of the bacteria drop attached on the cantilever. The clamping is placed at x = 0 μm and the free end at x = 433 μm. The solid line represents the theoretical calculation of the frequency shift of the first resonant mode, the dash line the effect on the frequency shift of the second resonant mode, the dotted line the calculated frequency shift for the third flexural mode. The experimental values of the resonance frequency shift are also included (symbols). The open squares represent the frequency shift of the first flexural mode, the open circles and triangles respectively show the effect on the second and third flexural modes. The theory shows a good agreement with the experimental data indicating the consistency of the presented model.
We observe that the mass and the flexural rigidity have opposite effects on the resonance. The added mass always produces a decrease of the resonance, whereas the increase of the rigidity produces a positive shift of the frequency. The different maxima and minima of the frequency shift are related with the shape of the eigenmodes. As can be deduced from eq. (1) the contribution of the stiffness to the resonant frequency is proportional to the curvature of the cantilever, whereas the effect of the mass is maximal at the antinodes, where the amplitude of oscillation is maximal.
Therefore, from the theoretical analysis it can be derived a frequency shift that depends on the position of the adsorbate along the cantilever length and on its mechanical properties in addition to the added mass. It is demonstrated also that the relative frequency shift is higher for the first resonant mode, although its resonant frequency is smaller than the rest of the modes. This is due to the presence of the nodes in the higher modes where the stiffness contribution is as sufficient as to practically cancelling the mass effect.
3.2. Measuring the adsorbed mass
Figure 3 shows the optical micrograph of four cantilevers in which the drops containing the E. Coli bacteria have been placed at different positions: close to the clamping, at the middle and near the free end and also on the back side of the cantilever. The number of cells deposited ranges from 3000 to 5000 depending on the final size of the drop. The observed ring – pattern is due to the original shape of the drop. Although the pattern used in the theoretical depiction is circular, the qualitative behaviour is not affected because the ring keeps the axial symmetry along the cantilever length. This figure also shows the profile of the cantilevers before (dashed line) and after bacteria deposition (solid line). It can be clearly observed that the attached bacteria locally change the cantilever curvature. Using this profiling technique the local change of surface stress induced by bacteria adsorption can be determined. These measurements indicate surface stress changes ranging from 0.05 N/m to 0.10 N/m. By applying the existing theoretical models in the literature [18], these values can be neglected for the dynamical calculations.
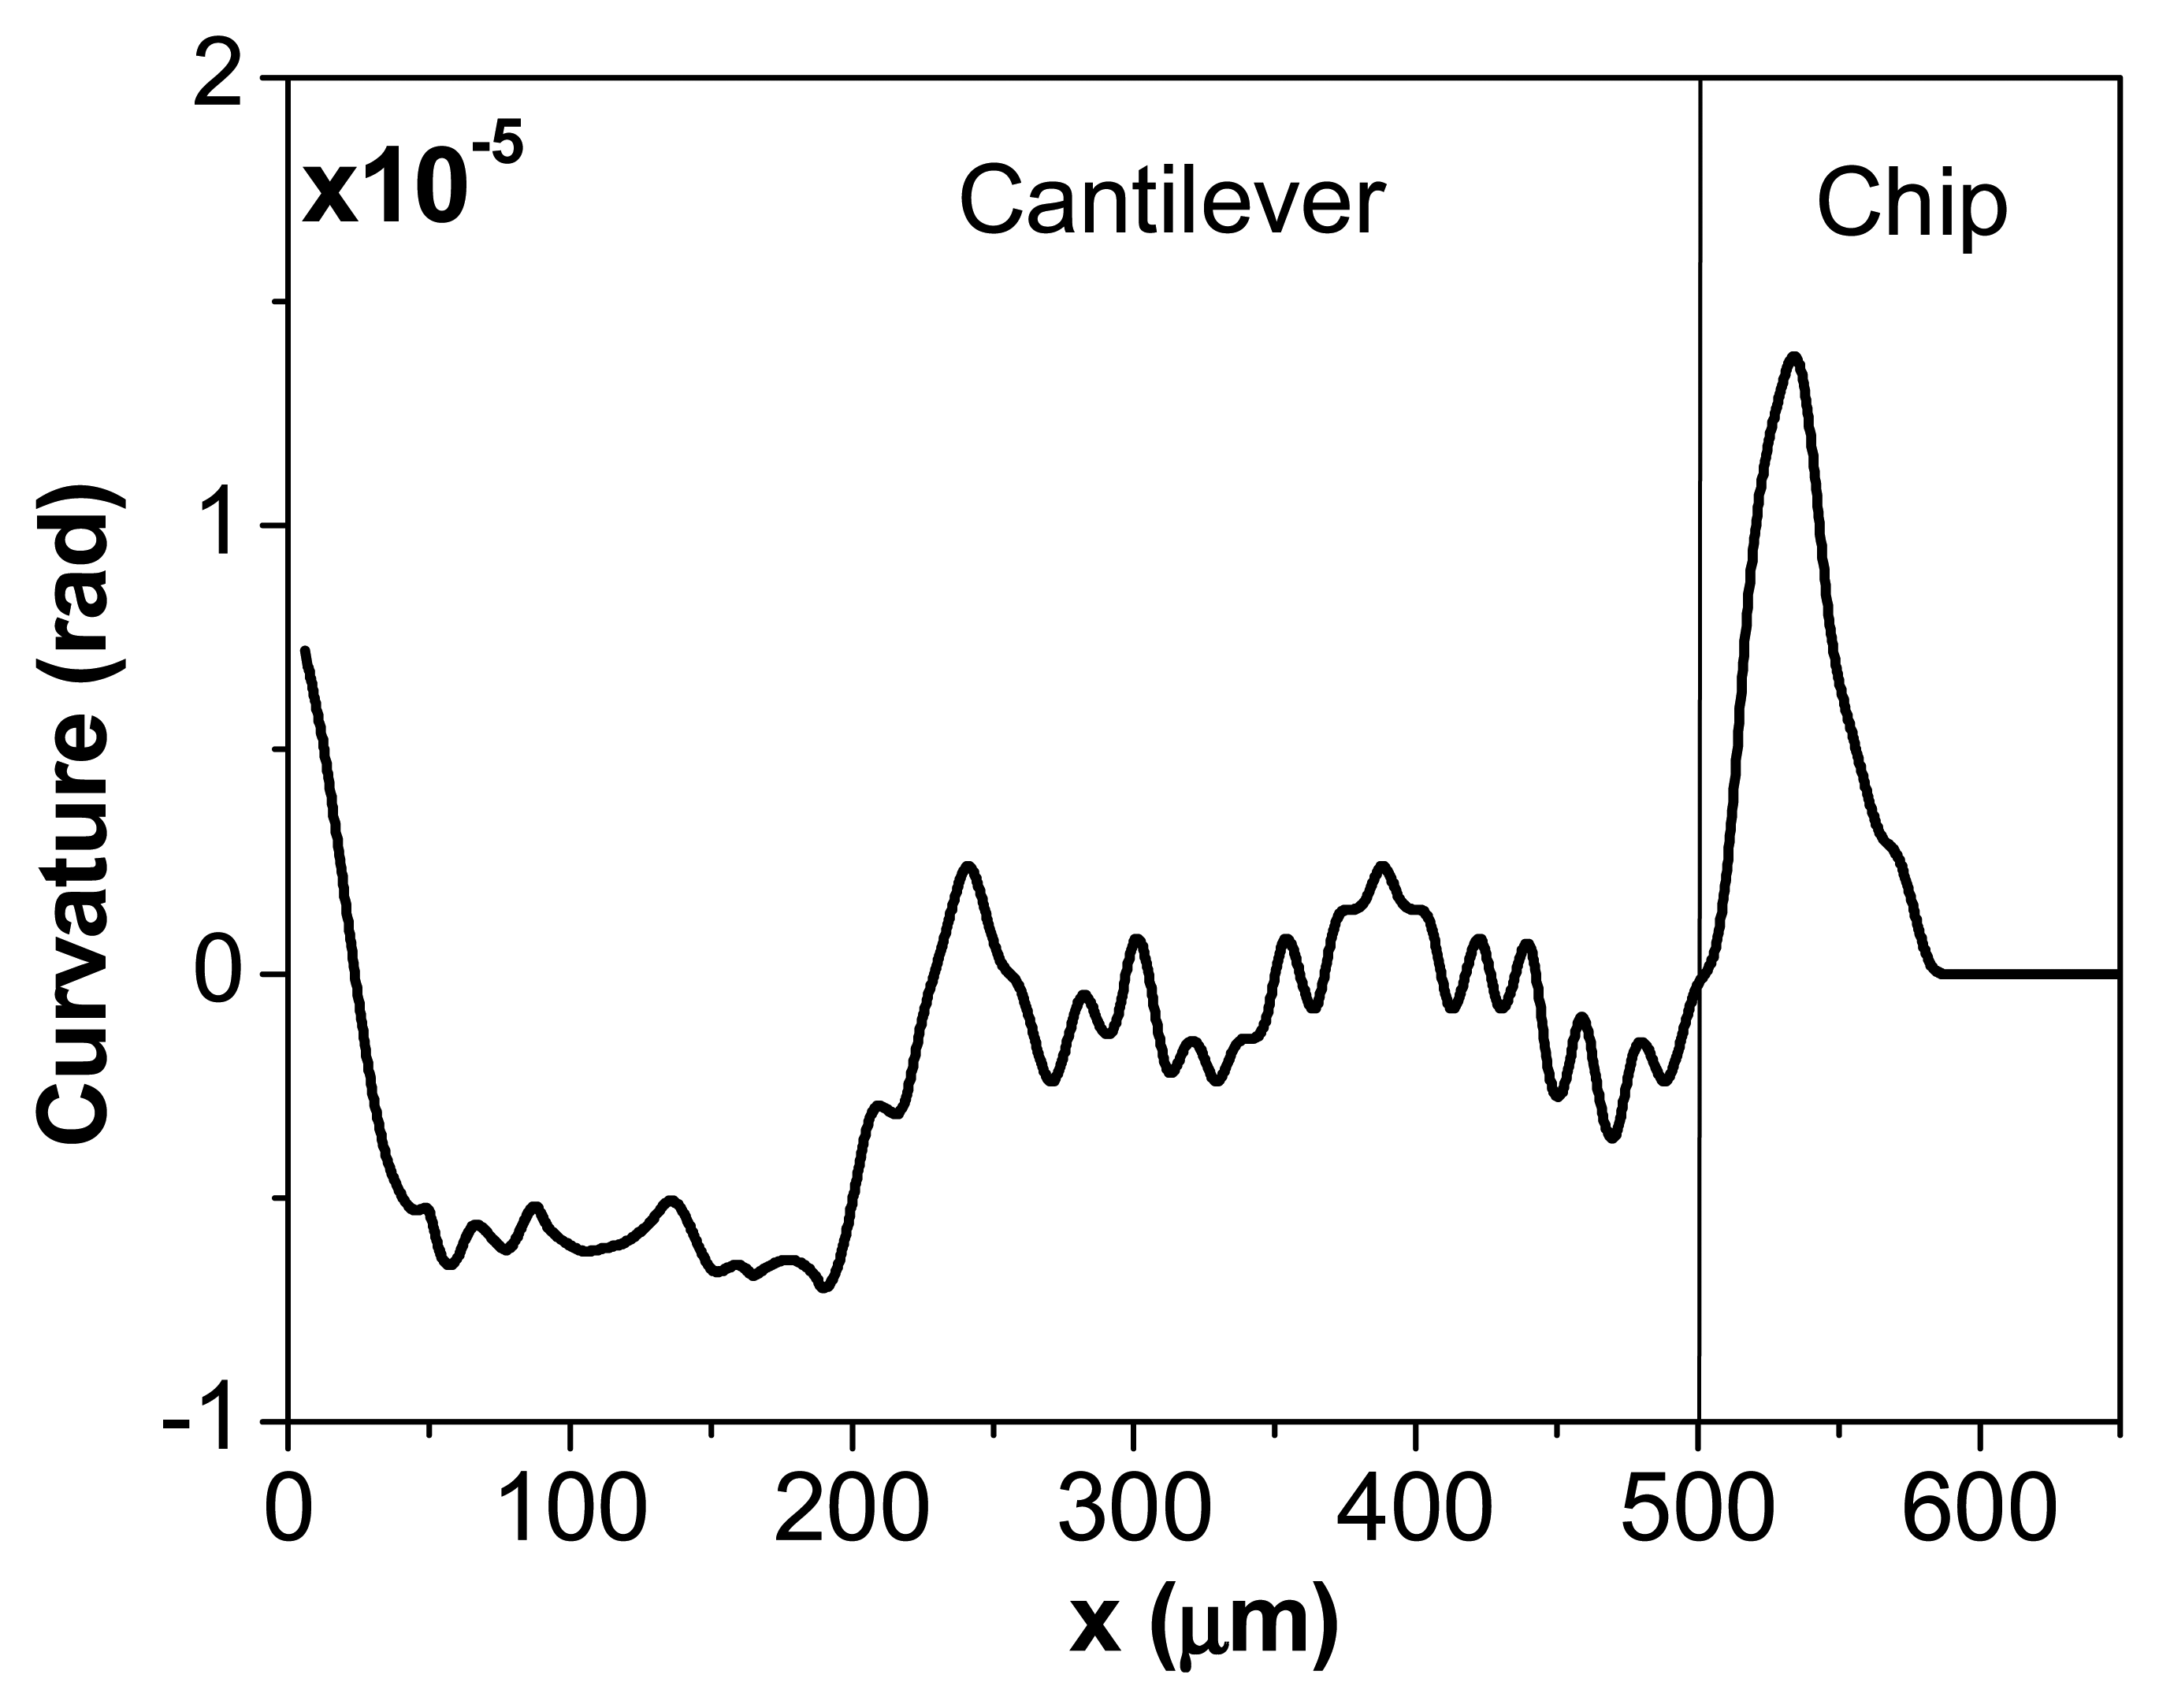
In figure 4 the curvature has been derived from the cantilever profile in figure 3d) after the deposition of a droplet of bacteria. From this information the exact location and size of the droplet of bacteria can be determined. In this case the size of the droplet is of about 150 μm and it is placed at 380 μm from the cantilever clamping region on the back side of the microcantilever.
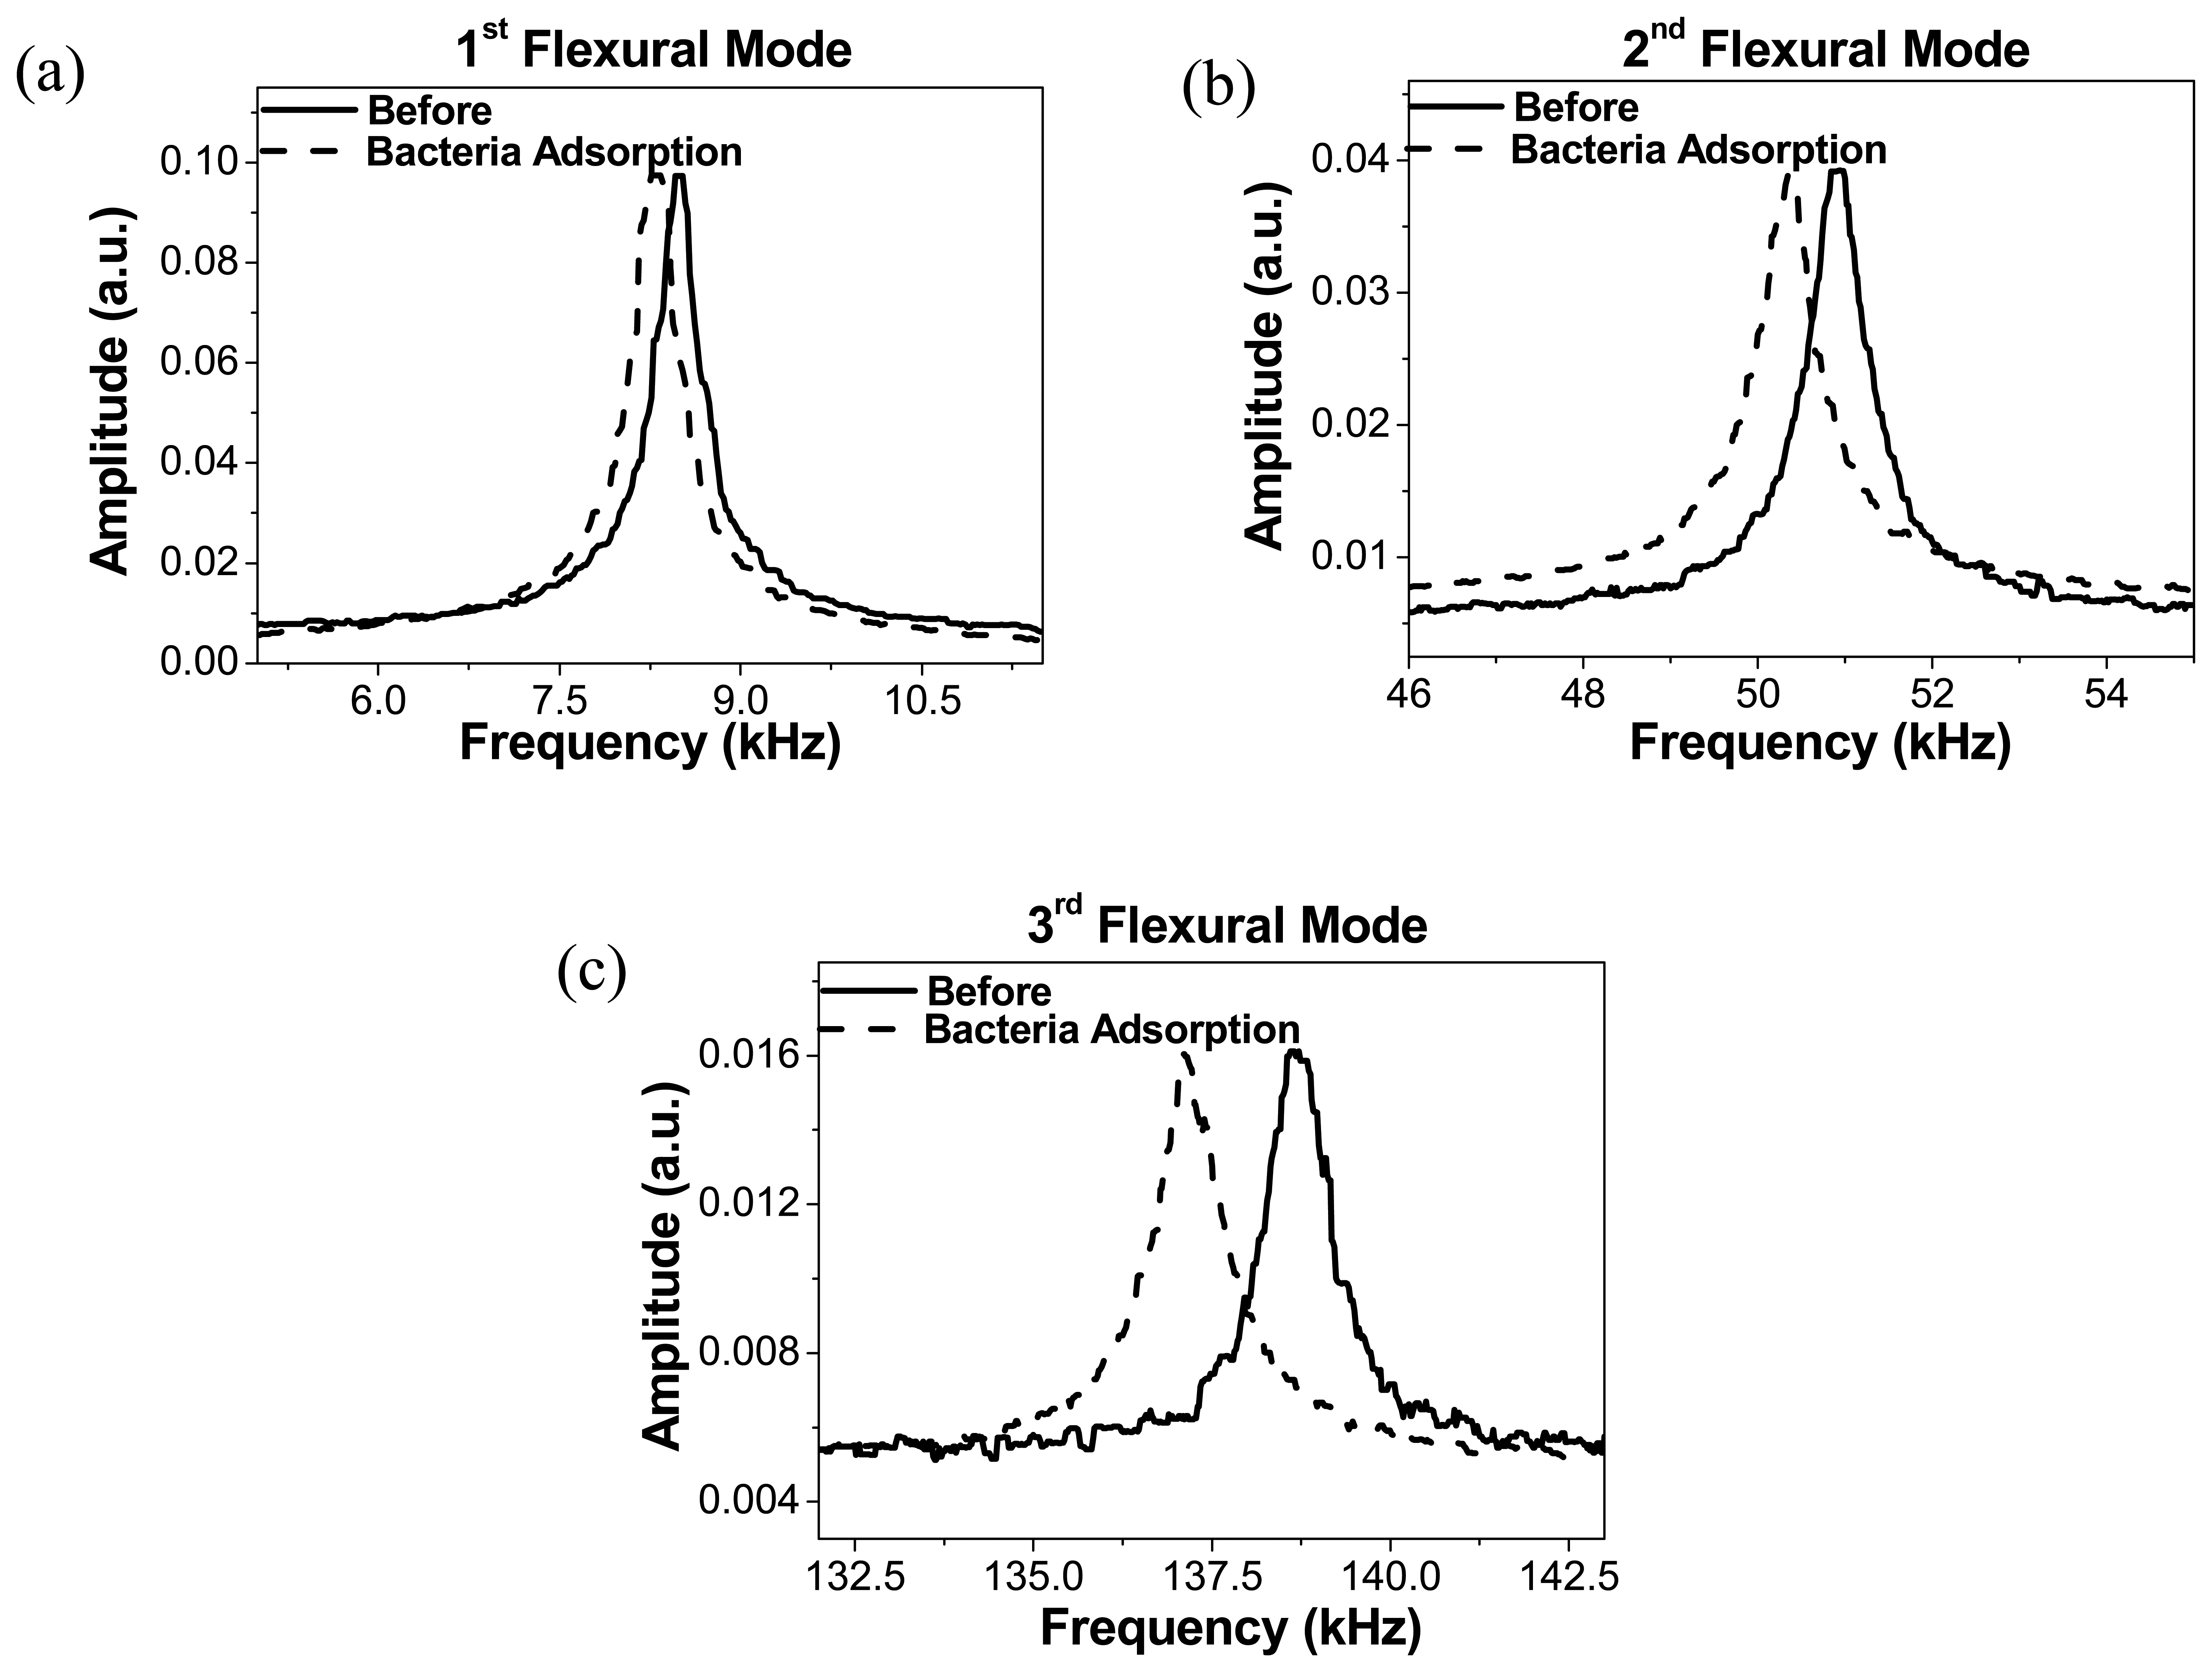
We have also measured the spectra of the Brownian motion of this cantilever before and after bacteria deposition, fig. (5). The shown peaks are the result of the average of 50 measurements. The resonance frequencies are then calculated by using the harmonic oscillator approximation. The fundamental resonance frequency before adsorption is 8.5 kHz. For the first resonant mode, a negative resonance frequency shift of −2.18% was observed, whereas for the second and third flexural modes the measured frequency shift is respectively –1.13% and –1.09%. Taking into account the procedure used to determine the resonance frequency, the error can be estimated bellow than 0.01% in all cases. As can be observed in this figure, the change in the quality factor is negligible, indicating that the damping constant in air introduced by the attached bacteria is also negligible.
By using eq. (1) and the data obtained previously, we can determine the adsorbed mass on the cantilever. We obtain 1.6 ± 0.5 ng for the first flexural mode, 1.1 ± 0.5 ng by using the second mode and 8.8 ± 21 ng when we use the frequency shift measured for the third flexural mode.
On repeated measurements, we observed that the third mode produces a value with the larger dispersion. This can be explained as the bacteria are adsorbed close to a node of the vibration so the error in the mass determination is maximal. The main source of experimental error in this measurements is the determination of the size of the drop. The above calculated errors take into account an indetermination of 20% in this parameter and 50% in the Young's modulus of the bacteria, the later considering the different values reported for the bacteria in the literature [17].
If the harmonic oscillator approximation Δm/m=-2Δω/ω is employed to calculate the mass, the mass calculated from the measured resonance shift corresponding to the first flexural mode is 4.4 ng, the second resonance mode provides a value of 2.3 ng and the shift for the third mode gives 2.2 ng. In this case the mass calculated using the first flexural mode overestimates the adsorbed mass by a factor of four because this model neglects the contribution of the flexural rigidity to the resonance shift.
3.3. Measuring the Young's modulus
From the Equation (1) it is possible to estimate the Young's modulus of the adsorbed material
where D0 is the flexural rigidity of the unloaded cantilever and a and b are the limits over the cantilever in which the mass is spread out expressed as spatial coordinates.
For the cantilever shown in fig. 3 (a), the relative frequency shift is 3.63 %, the centre of the droplet is positioned at 70 μm from the clamping and the drop length is 100 μm (the drop width equals that of the microcantilever). Using these parameters and Equation (4), the Young's modulus obtained for the bacteria cells is of about 0.4 ± 0.6 GPa. This value is of the order of magnitude of those reported in the literature. Usually values of 1 GPa are obtained by AFM measurements in dried bacteria [16]. As was discussed above, the main source of error is the determination of the position.
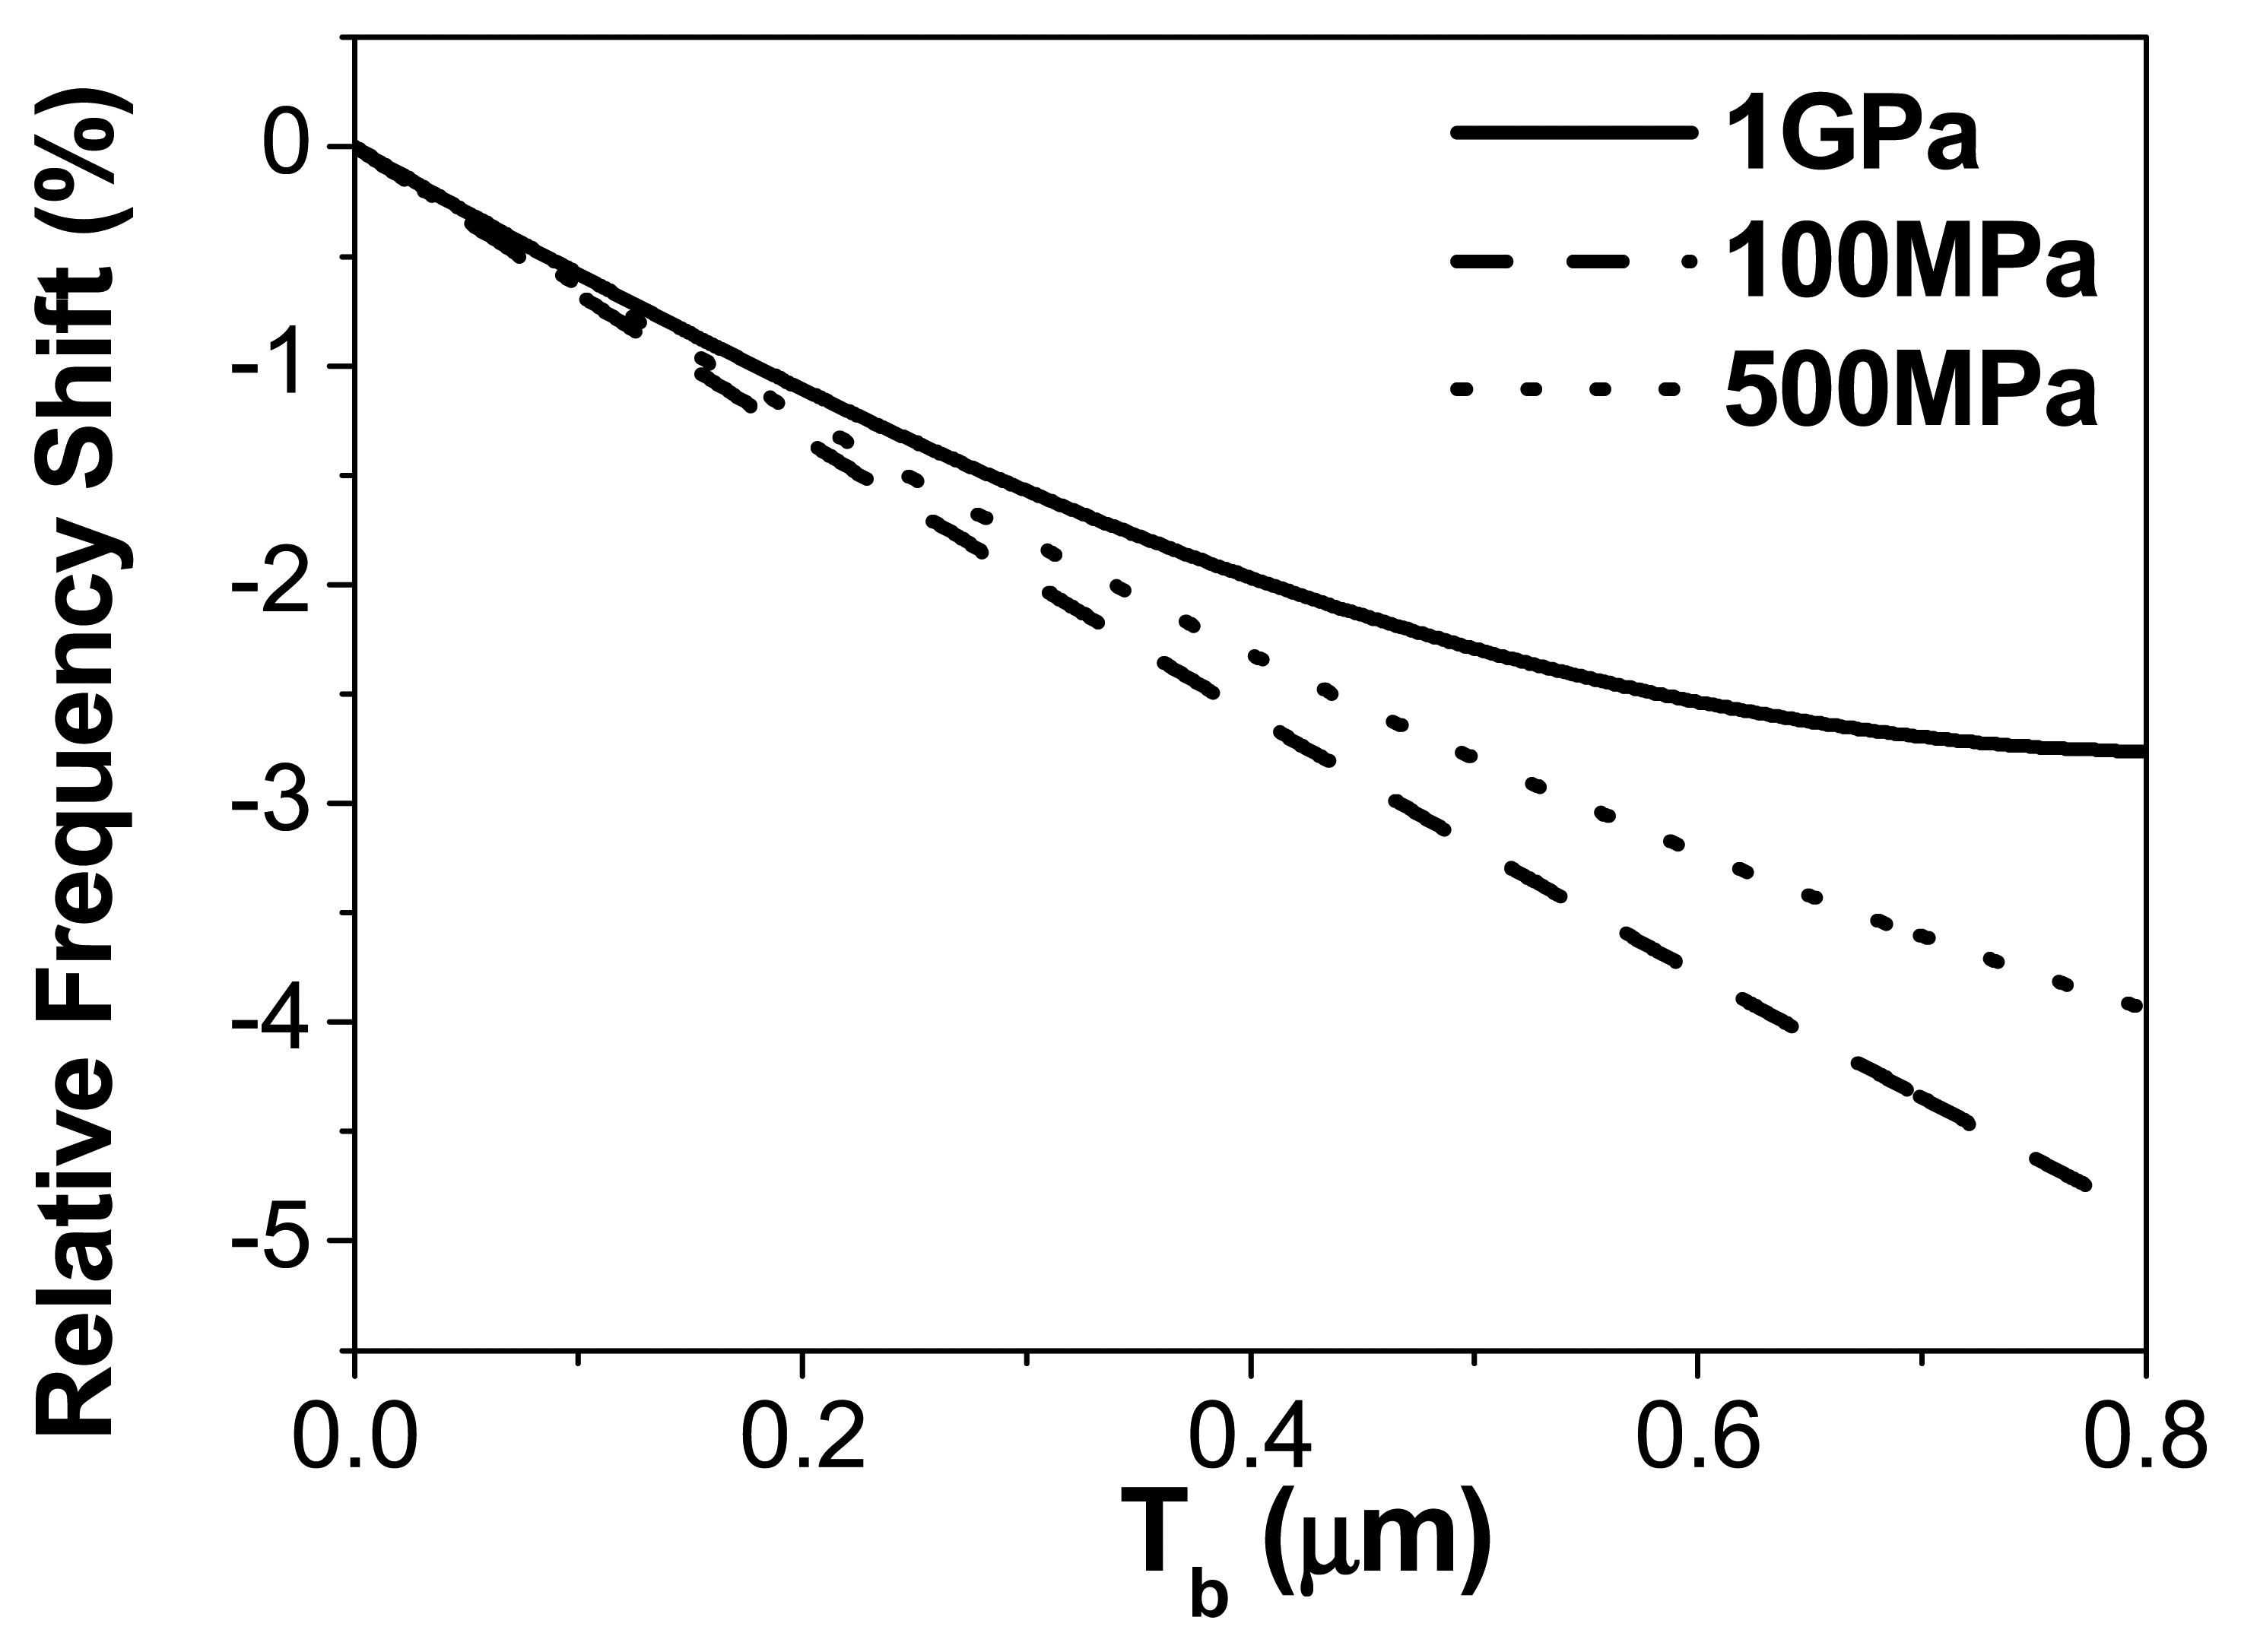
Note that this value does not correspond to what was used in the previous section to simulate the biological layer. In fig. (6), we plot the frequency shift as a function of the thickness of the adsorbed layer for three different values of the adsorbed material Young's modulus. In this theoretical calculation the layer is supposed homogeneous to simplify the interpretation. As can be observed in the figure, the differences in the relative frequency shift are of about 2.5% for the thickness employed in previous simulations, which is of the order of magnitude of the discrepancy observed in fig.2 between the experimental measurements and the theory. Therefore, both values are compatible in the assumed error range.
Conclusions
We have presented a method to accurately determine the adsorbed mass on a cantilever when adsorbates are inhomegeneously distributed over the cantilever surface. The measurement of the cantilever profile is needed to determine the position and extension of the adsorbed material. Then, these data can be used, together with the measured resonance shift, to derive the adsorbed mass by using the presented theoretical model. By recording the profile, the local surface stress induced by the adsorbates can also be measured.
In addition, we have theoretically demonstrated and experimentally tested that the use of higher vibration modes gives a relative frequency shift smaller than the first mode. This is due to the presence of vibration nodes. At these positions the amplitude of oscillation is zero, hence the added mass has no effect in the dynamic response. Therefore, when the added mass has a size comparable to the node – antinode separation, the use of higher flexural modes overestimates the measured mass values. Thus, to improve the sensitivity by working at high frequencies it is necessary to shrink the cantilevers.
As a model system, we have chosen the detection of E.Coli bacteria. We have also shown that by placing the bacteria close to the clamping region, we can measure its rigidity by recording the resonance frequency and the cantilever profile. From the results shown in this work, we conclude that the design of highly sensitive cantilevers to be used for pathogen detection must take into account the inhomogeneous nature of the adsorbed layers and also the important effect of the mechanical properties of the adsorbates in the dynamic response. Designs of microcantilevers that promote adsorption near the clamping region will take advantage of the large positive resonance shifts produced due to the local increase of stiffness given by pathogen adsorption. These new designs can produce highly sensitive biosensors that rely on the response due to the mechanical properties of the adsorbed pathogens rather than on the change of mass.
Acknowledgments
The authors acknowledge financial support from Ministerio de Educación y Ciencia (TEC2006-10316/MIC), CSIC and Comunidad de Madrid (200550M056). D. Ramos acknowledges the Comunidad de Madrid fellowship.
References
- Barnes, J. R.; Stephenson, R. J.; Woodburn, C. N. A femtojoule calorimeter using micromechanical sensors. Rev. Sci. Instrum. 1994, 65, 3793–3798. [Google Scholar]
- Wachter, E. A.; Thundat, T.; Oden, P. I. Remote optical detection using microcantilevers. Rev. Sci. Instrum. 1996, 67, 3434–3439. [Google Scholar]
- Lang, H. P.; Berger, R.; Battiston, F. A chemical sensor based on a micromechanical cantilever array for the identification of gases and vapours. Appl. Phys. A 1998, 66, S61–S64. [Google Scholar]
- Stephan, A. C.; Gaulden, T.; Brown, A. D. Microcantilever charged-particle flux detector. Rev. Sci. Instrum. 2002, 73, 36–41. [Google Scholar]
- Passian, A.; Evans, P.G.; Varma, V.K. Piezoresistive detection of acoustic waves. Rev. Sci. Instrum. 2003, 74, 1031–1035. [Google Scholar]
- Ilic, B.; Yang, Y.; Craighead, H. G. Virus detection using nanoelectromechanical devices. Appl. Phys. Lett. 2004, 85, 2604–2606. [Google Scholar]
- Cleveland, J. P.; Manne, S.; Bocek, D.; Hansma, P. K. A non-destructive method for determining the spring constant of cantilevers for scanning force microscopy. Rev. Sci. Instrum. 1995, 64, 403. [Google Scholar]
- Ilic, B.; Craighead, H.G.; Krylov, S.; Senaratne, W.; Ober, C.; Neuzil, P. Attogram detection using nanoelectromechanical oscillators. J. Appl. Phys. 2004, 95, 3694–3703. [Google Scholar]
- Sader, J. E.; Larson, I.; Mulvaney, P.; White, L. R. Method for the calibration of atomic force microscope cantilevers. Rev. Sci. Instrum. 1995, 66, 3789. [Google Scholar]
- Mertens, J.; Finot, E.; Thundat, T.; Fabre, A.; Nadal, M.-H.; Eyraud, V.; Bourillot, E. Effects of temperature and pressure on microcantilever resonance response. Ultramicroscopy 2003, 97, 119. [Google Scholar]
- Dohn, S.; Sandberg, R.; Svendsen, W.; Boisen, A. Enhanced functionality of cantilever based mass sensors using higher modes. Appl. Phys. Lett. 2005, 86, 233501. [Google Scholar]
- Tamayo, J.; Ramos, D.; Mertens, J.; Calleja, M. Origin of the response of nanomechanical resonators to bacteria adsorption. Appl. Phys. Lett. 2006, 89, 224104. [Google Scholar]
- Ramos, D.; Tamayo, J.; Mertens, J.; Calleja, M.; Zaballos, A. Effect of the adsorbate stiffness on the resonance response of microcantilever sensor. J. Appl. Phys. 2006, 100, 106105. [Google Scholar]
- Mertens, J.; Álvarez, M.; Tamayo, J. Real-time profile of microcantilevers for sensing applications. Appl. Phys. Lett. 2005, 87, 2344102. [Google Scholar]
- Sandberg, R.; Svendsen, W.; Molhave, K.; Boisen, A. Temperature and pressure dependence of resonance in multi-layer microcantilevers. J. Micromech. Microeng. 2005, 15, 1454–1458. [Google Scholar]
- Rast, S.; Wattinger, C.; Gysin, U.; Meyer, E. Dynamics of damped cantilevers. Rev. Sci. Instrum. 2000, 71, 2772–2775. [Google Scholar]
- Yao, X.; Jericho, M.; Pink, D.; Beveridge, T. Thickness and Elasticity of Gram-Negative Murein Sacculi Measured by Atomic Force Microscopy. J. Bacteriol. 1999, 181, 6865–6875. [Google Scholar]
- MacFarland, A. W.; Poggi, M. A.; Doyle, M. J.; Bottomley, L. A.; Colton, J. S. Influence of surface stress on the resonance behavior of microcantilevers. Appl. Phys. Letts. 2005, 87, 053505. [Google Scholar]
Figure 1.
Schematic drawing of the set-up for the read-out of the cantilever profiles in arrays. The laser is mounted in a 2-D voice-coil scanner that allows obtaining the profile of an arbitrary number of cantilevers in the array. Measurements can also be performed in real-time.
Figure 1.
Schematic drawing of the set-up for the read-out of the cantilever profiles in arrays. The laser is mounted in a 2-D voice-coil scanner that allows obtaining the profile of an arbitrary number of cantilevers in the array. Measurements can also be performed in real-time.
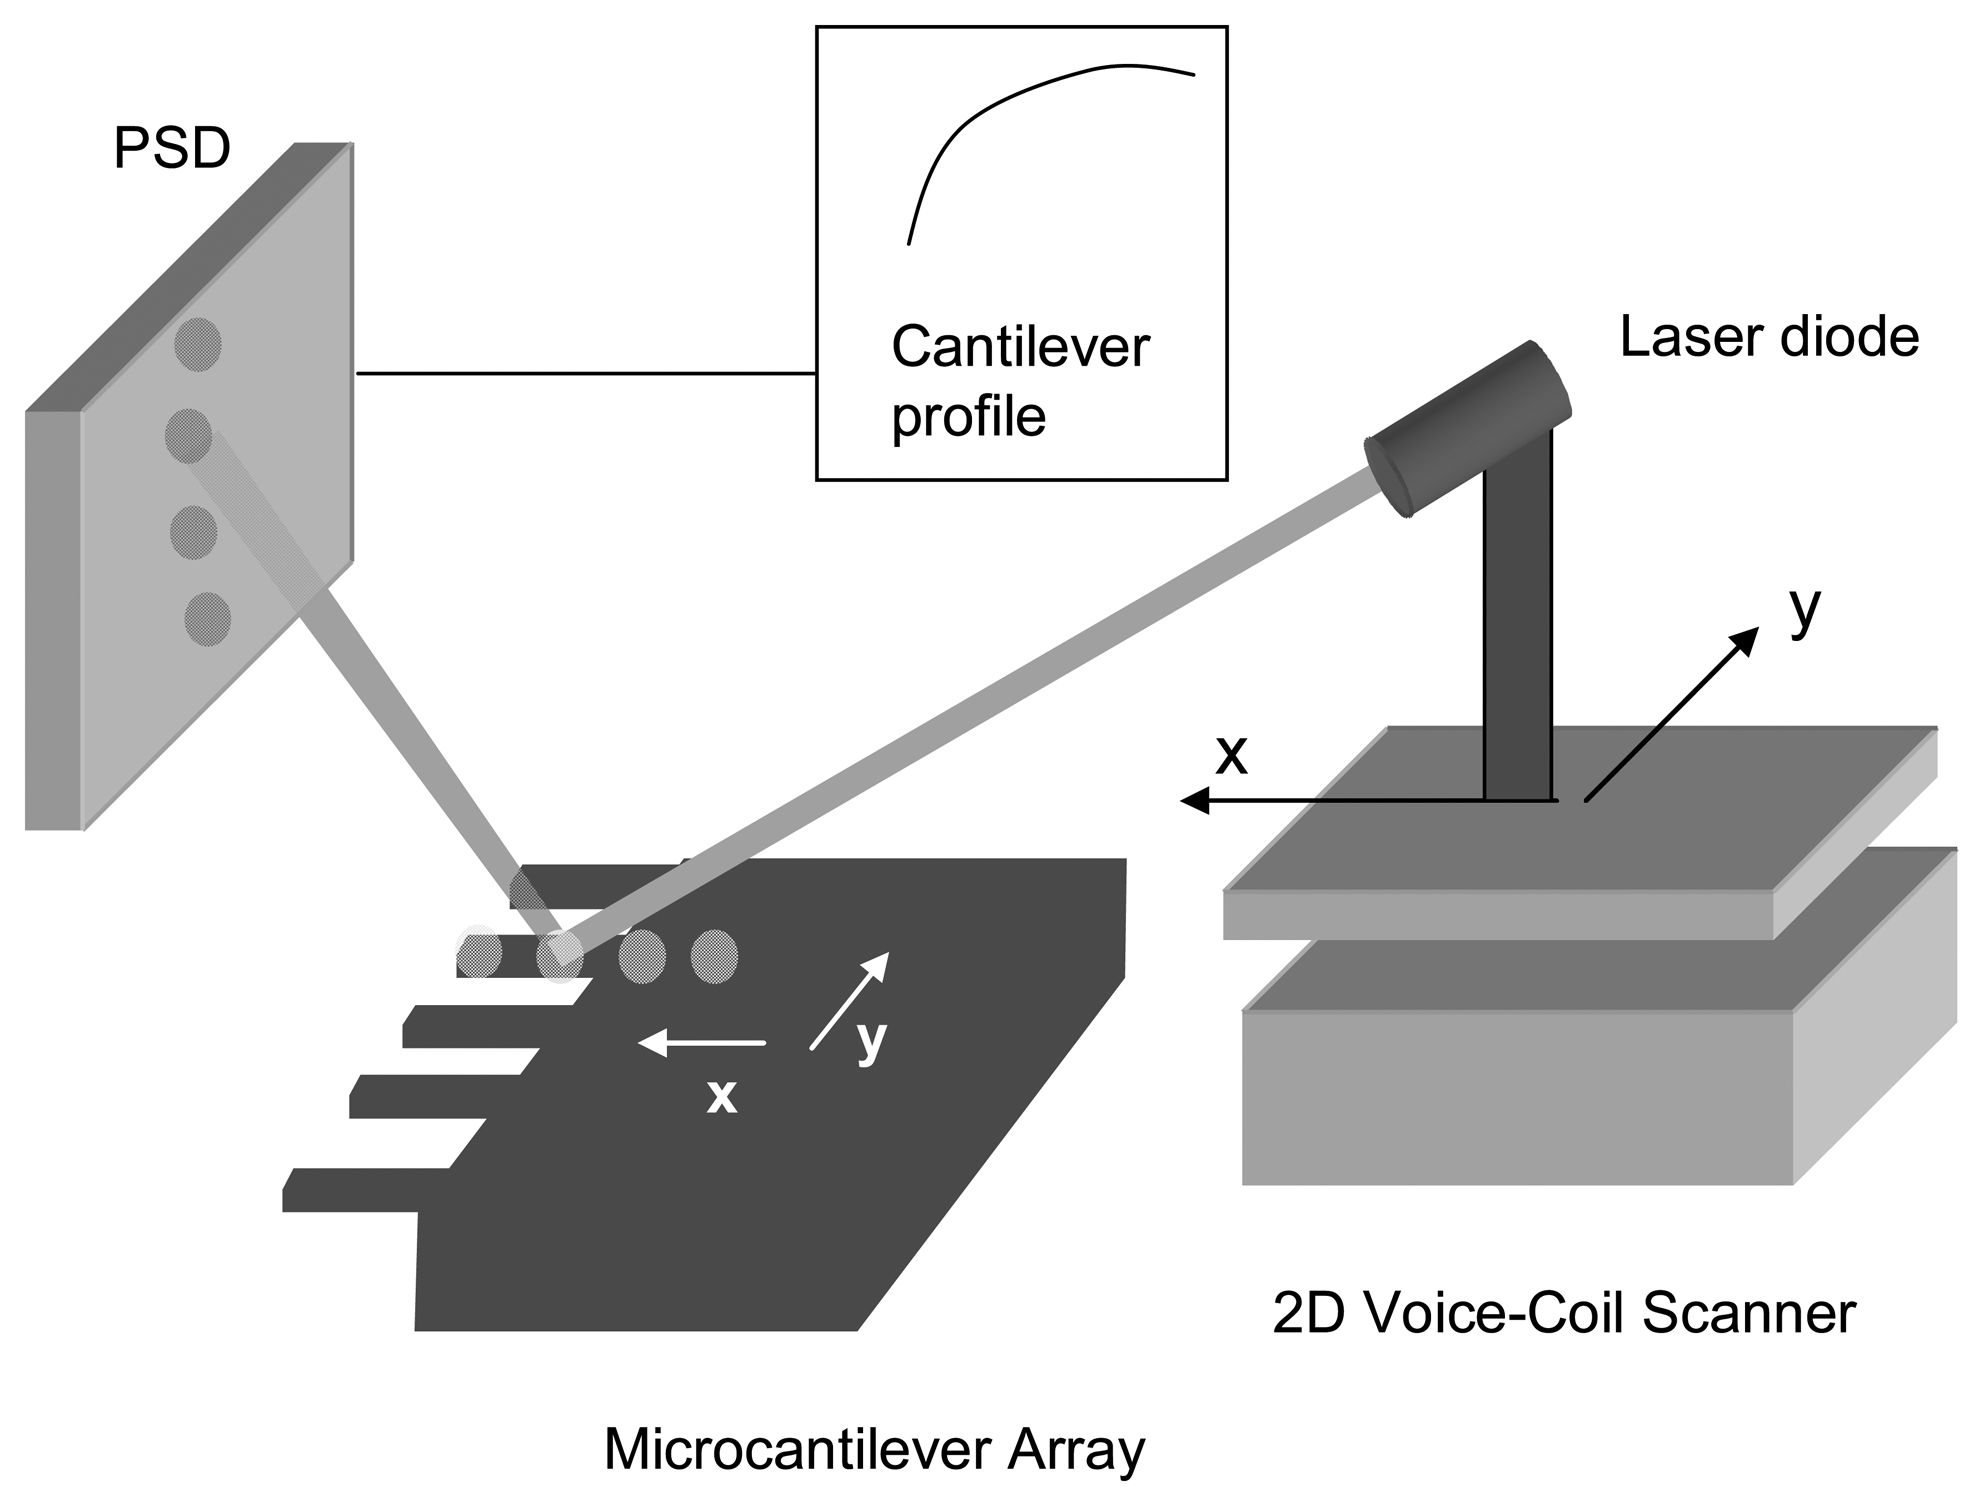
Figure 2.
Experimental measurements of the resonance frequency shift as a function of the longitudinal position of the adsorbed bacteria with respect to the clamping for the first (open squares), second (open circles) and third (open triangles) flexural modes. The lines represent the theoretical calculations for the first (solid), second (dash) and third (dotted) flexural modes.
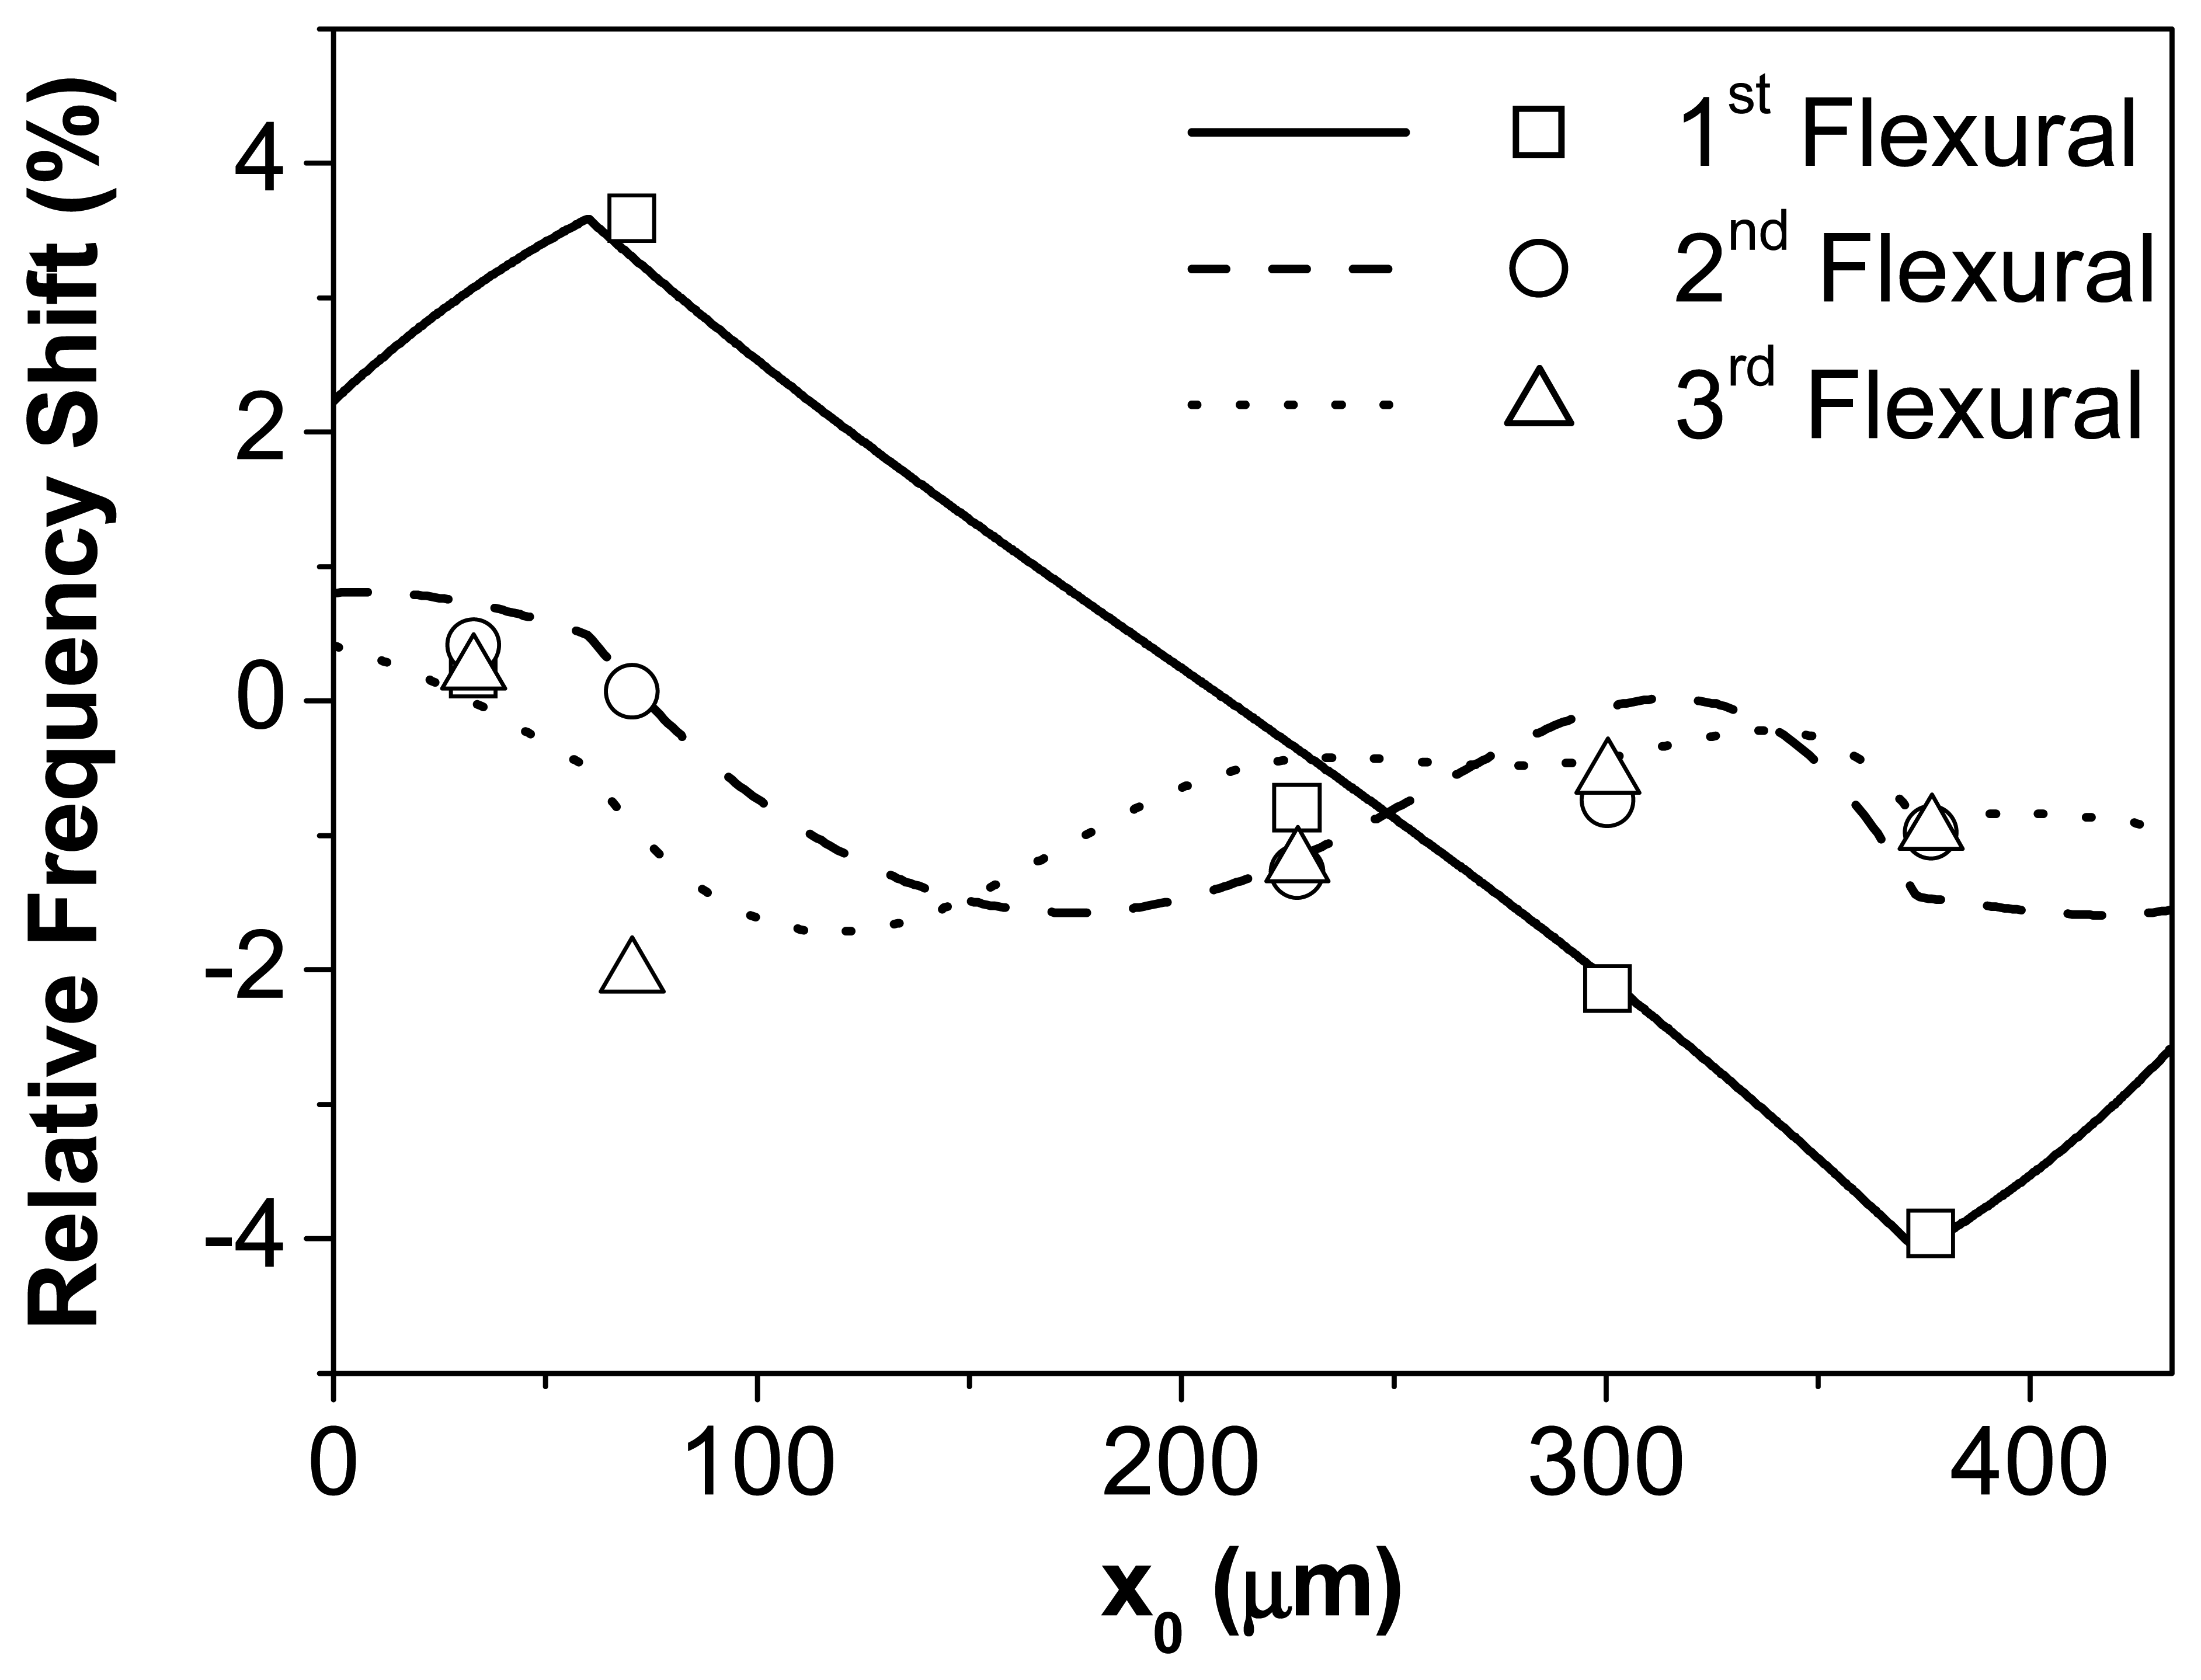
Figure 3.
Optical micrographs of the cantilevers after deposition of droplets containing E. Coli bacteria. Above each picture the cantilever profile measured before (dotted line) and after (continuous line) bacteria deposition are presented. The cantilever profile is modified at the position of the adsorbed bacteria due to the induced surface stress by the adsorbed inhomogeneous layer of bacteria.
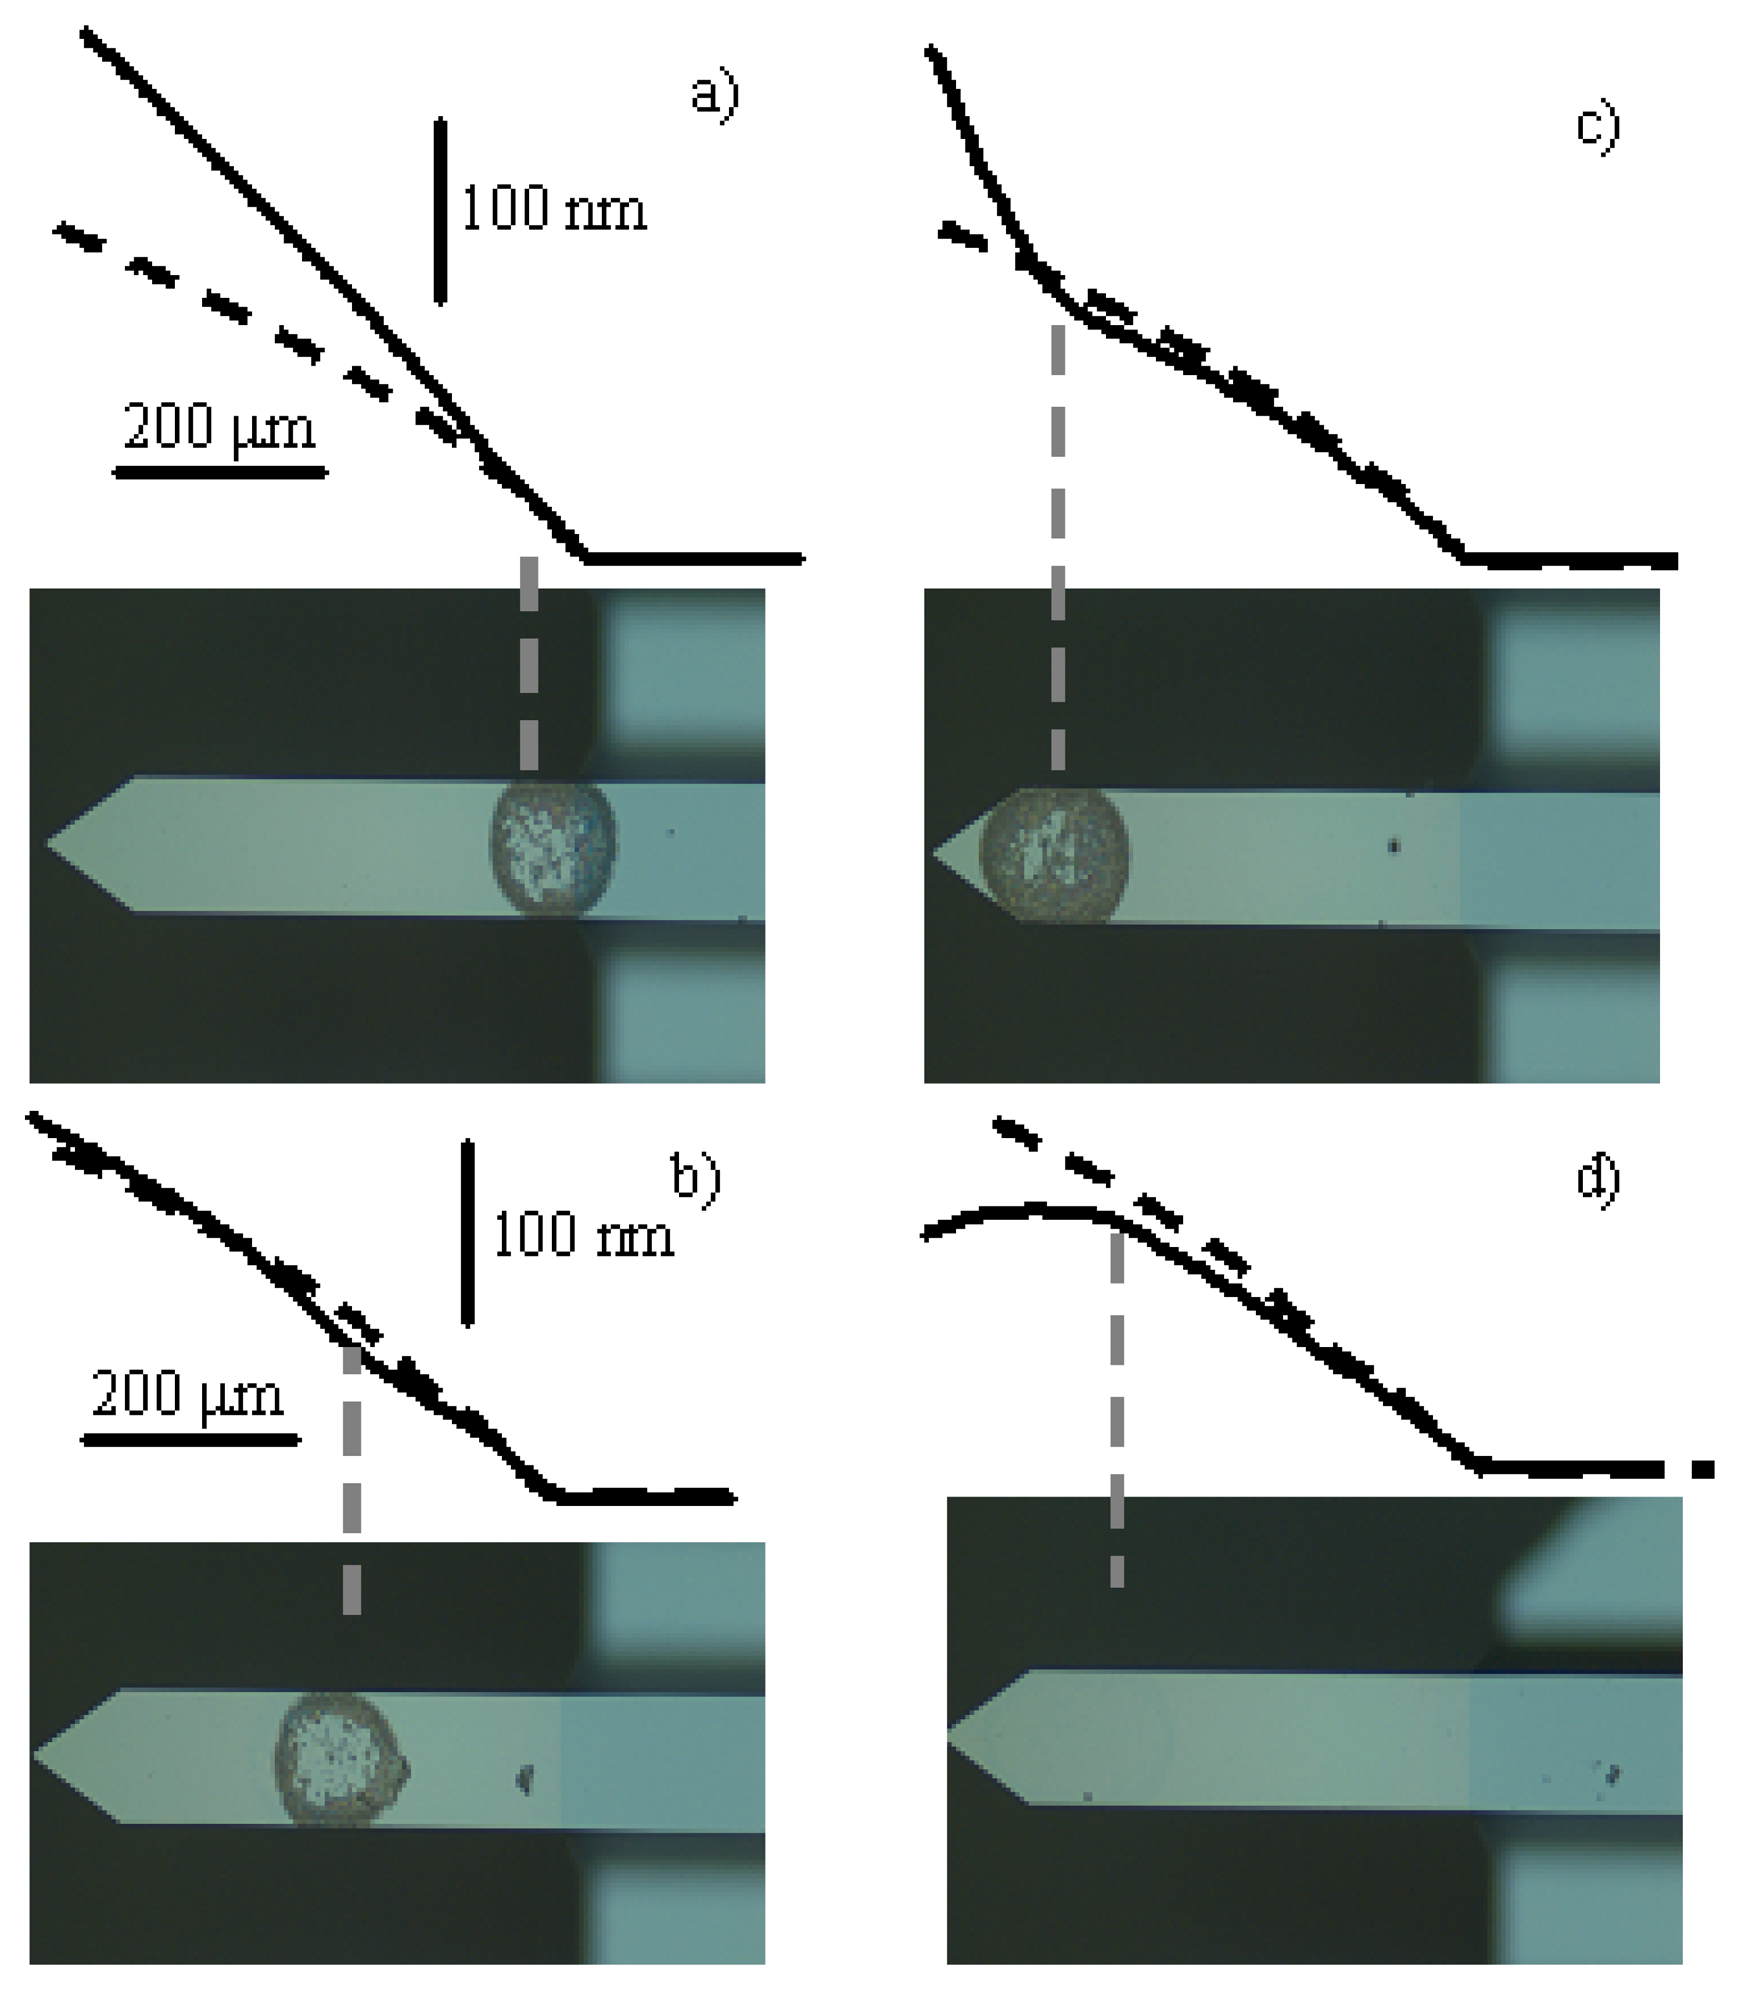
Figure 4.
Curvature of the cantilever recorded by the scanning laser set-up. The local change of curvature indicates the position and extension of the adsorbed droplet on the cantilever.
Figure 4.
Curvature of the cantilever recorded by the scanning laser set-up. The local change of curvature indicates the position and extension of the adsorbed droplet on the cantilever.

Figure 5.
Spectra of the Brownian motion of the cantilever before (solid line) and after (dashed line) bacteria adsorption.
Figure 5.
Spectra of the Brownian motion of the cantilever before (solid line) and after (dashed line) bacteria adsorption.

Figure 6.
Theoretical calculation of the frequency shift as a function of the adsorbate thickness for three different values of the Young's Modulus: 1Gpa (solid line), 100 Mpa (dashed line) and 500 Mpa (dotted line).
Figure 6.
Theoretical calculation of the frequency shift as a function of the adsorbate thickness for three different values of the Young's Modulus: 1Gpa (solid line), 100 Mpa (dashed line) and 500 Mpa (dotted line).

© 2007 by MDPI ( http://www.mdpi.org). Reproduction is permitted for noncommercial purposes.
Share and Cite
MDPI and ACS Style
Ramos, D.; Calleja, M.; Mertens, J.; Zaballos, A.; Tamayo, J. Measurement of the Mass and Rigidity of Adsorbates on a Microcantilever Sensor. Sensors 2007, 7, 1834-1845. https://doi.org/10.3390/s7091834
AMA Style
Ramos D, Calleja M, Mertens J, Zaballos A, Tamayo J. Measurement of the Mass and Rigidity of Adsorbates on a Microcantilever Sensor. Sensors. 2007; 7(9):1834-1845. https://doi.org/10.3390/s7091834
Chicago/Turabian StyleRamos, Daniel, Montserrat Calleja, Johann Mertens, A. Zaballos, and Javier Tamayo. 2007. "Measurement of the Mass and Rigidity of Adsorbates on a Microcantilever Sensor" Sensors 7, no. 9: 1834-1845. https://doi.org/10.3390/s7091834