Two-dimensional Co-Seismic Surface Displacements Field of the Chi-Chi Earthquake Inferred from SAR Image Matching

Abstract
:
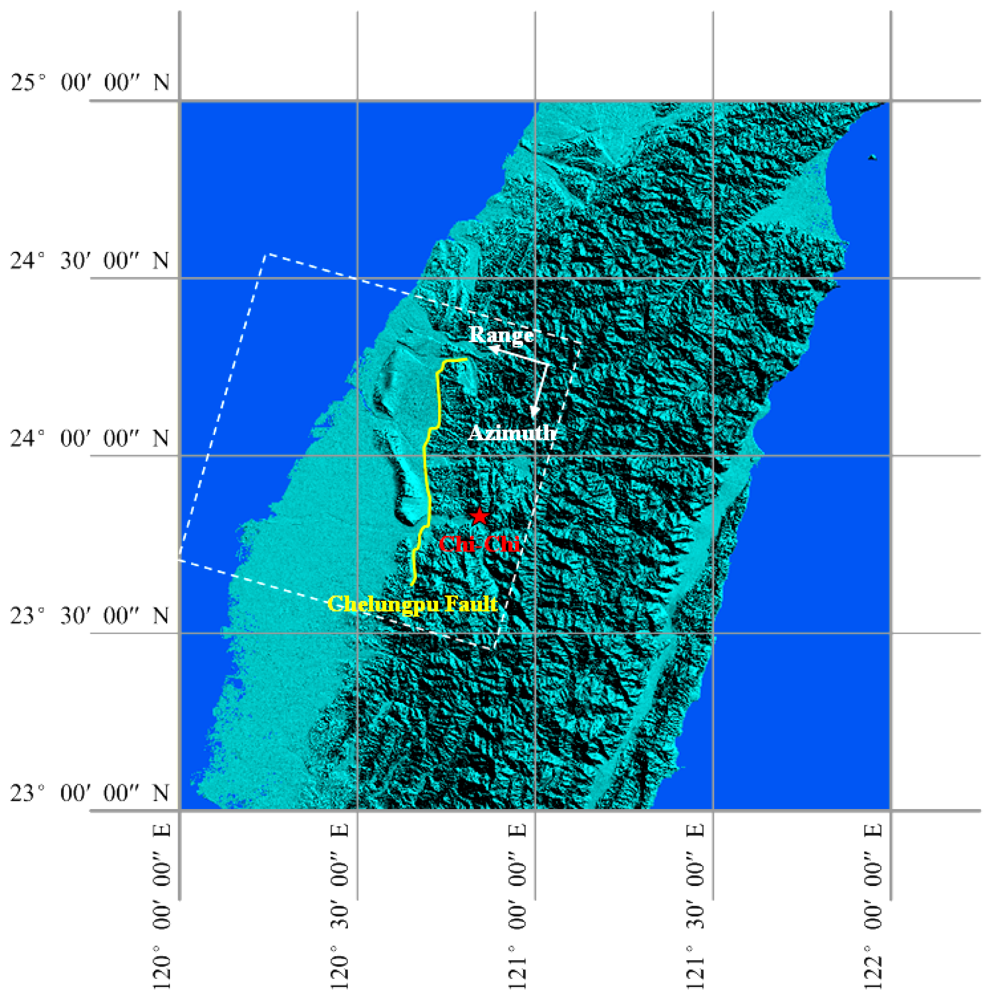
1. Introduction
2. Data Analysis
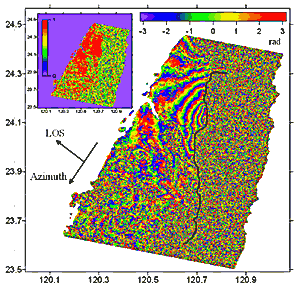
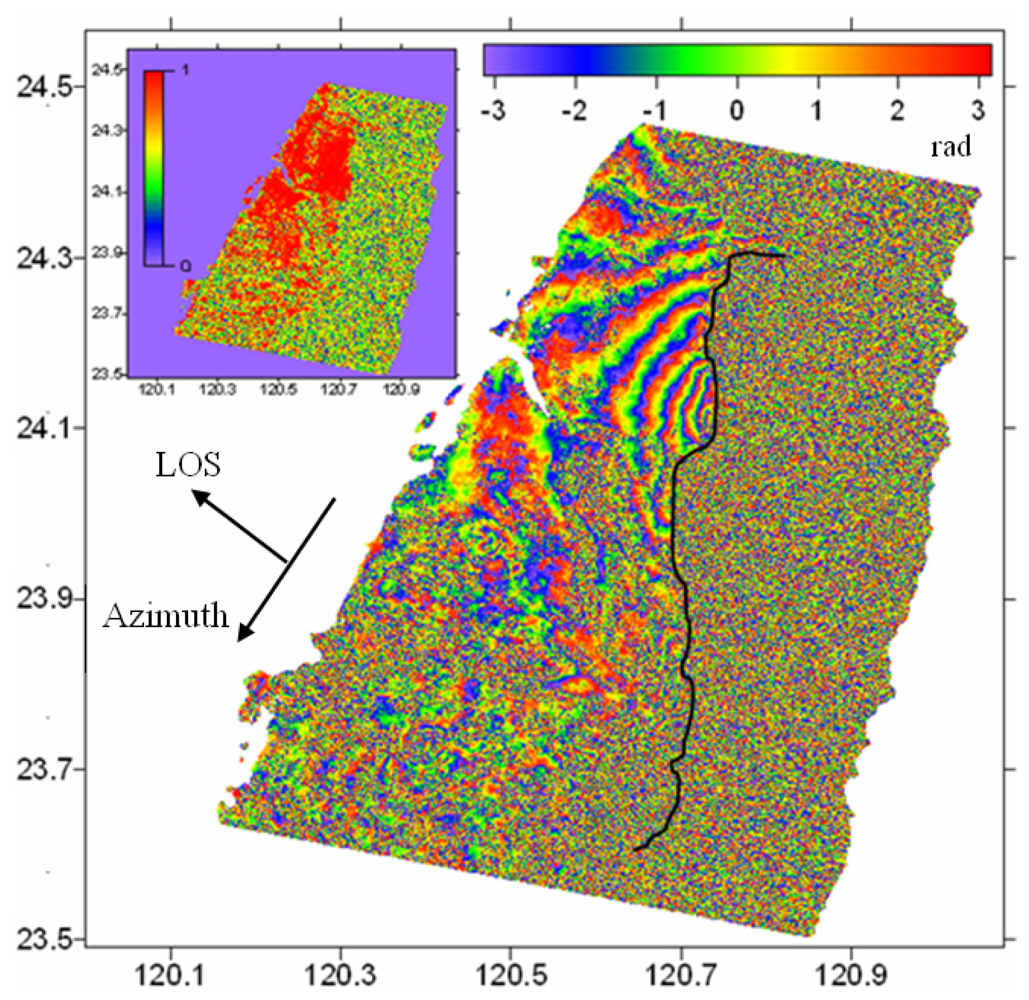
2.1 Analysis of Co-Seismic Interferogram
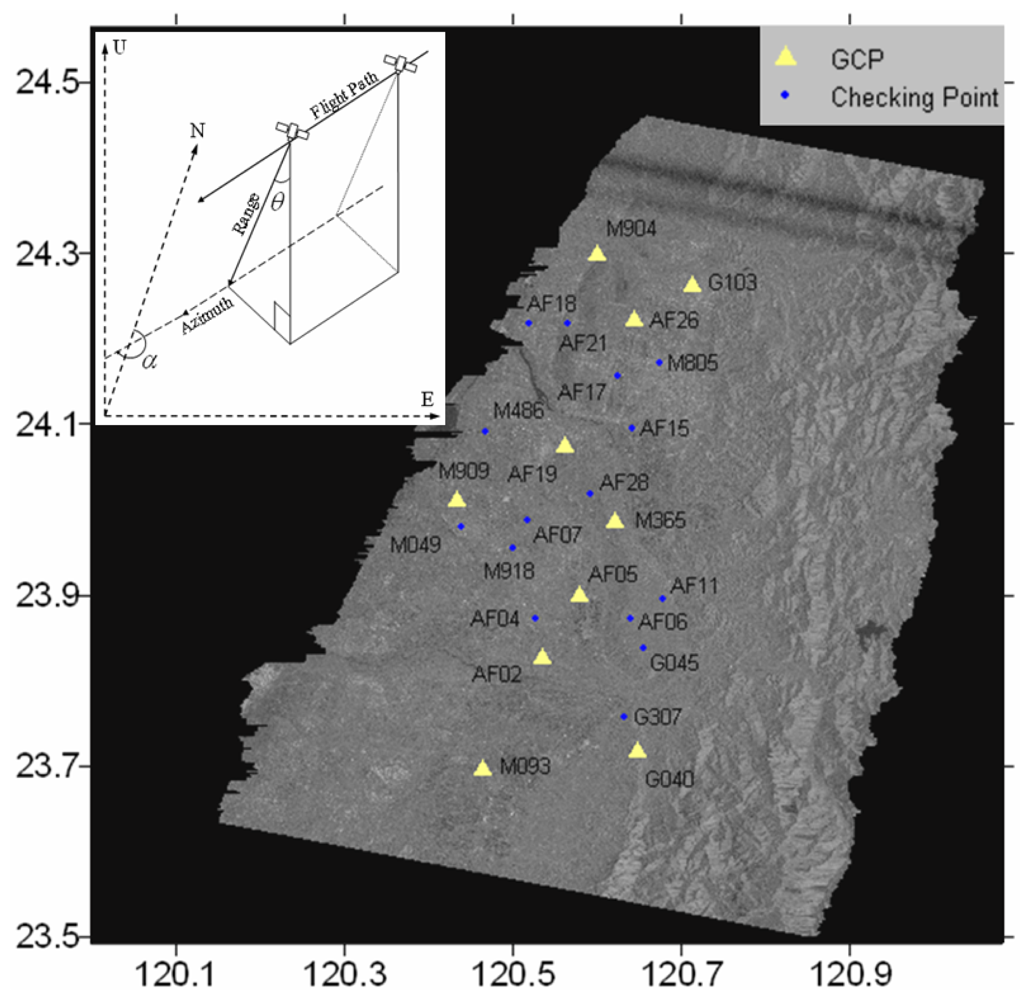
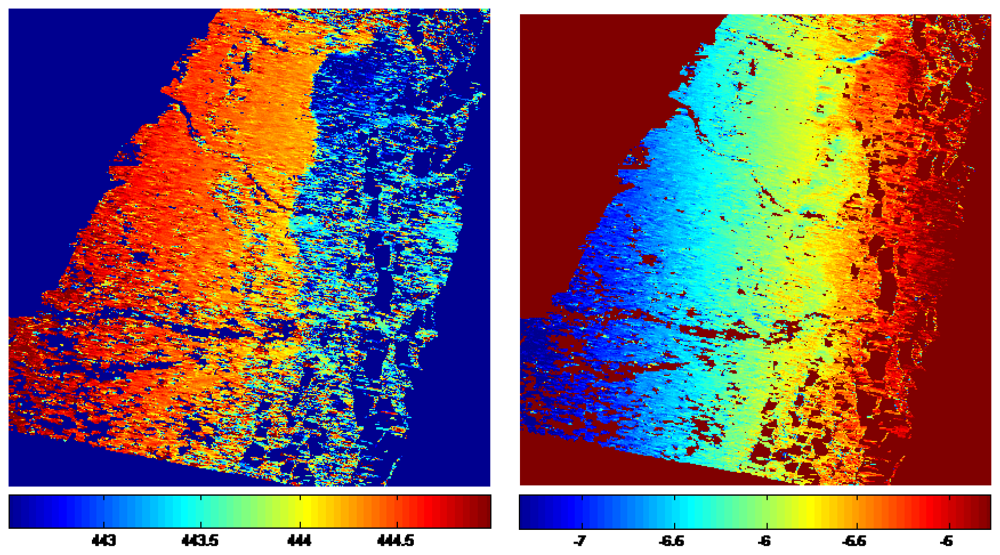
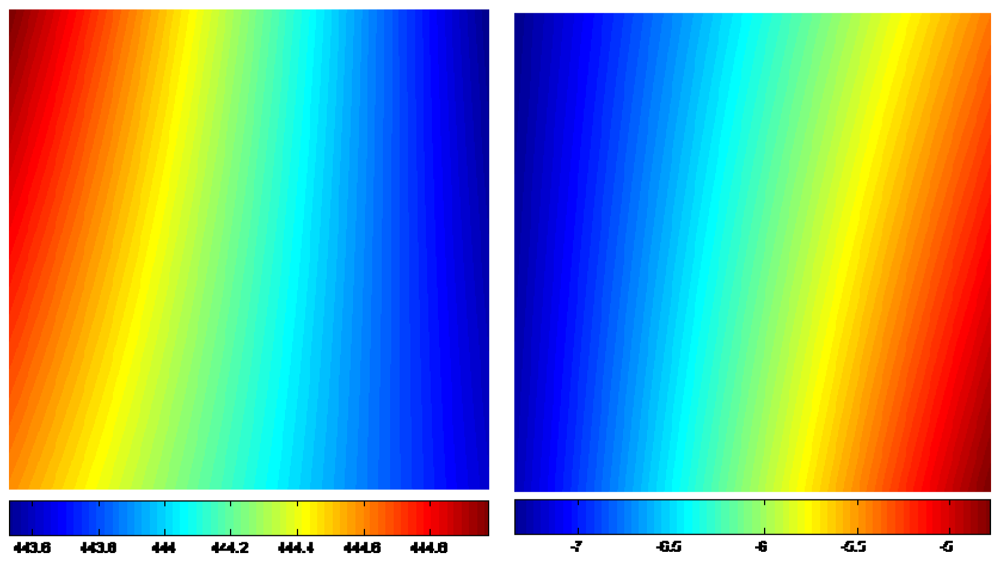
2.2 Offsets Derived from Co-Seismic Amplitude Images
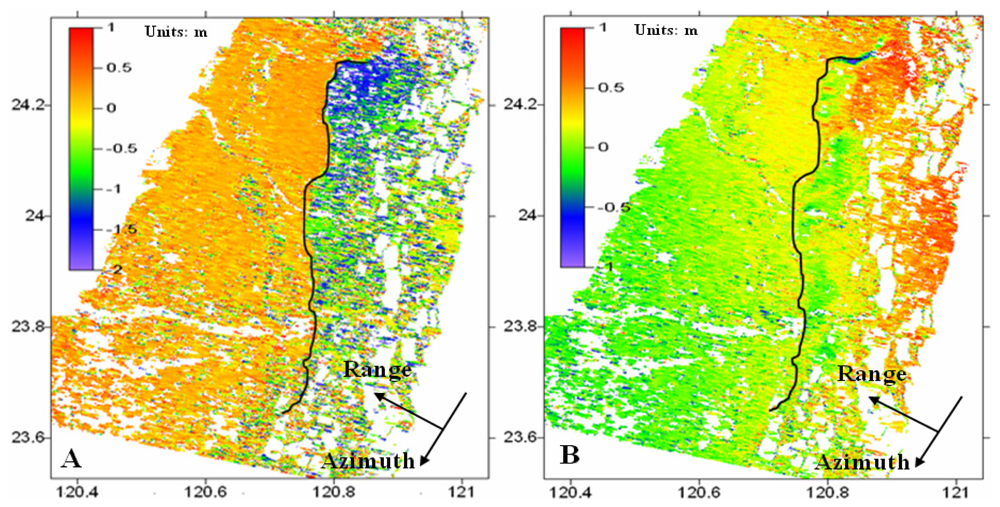
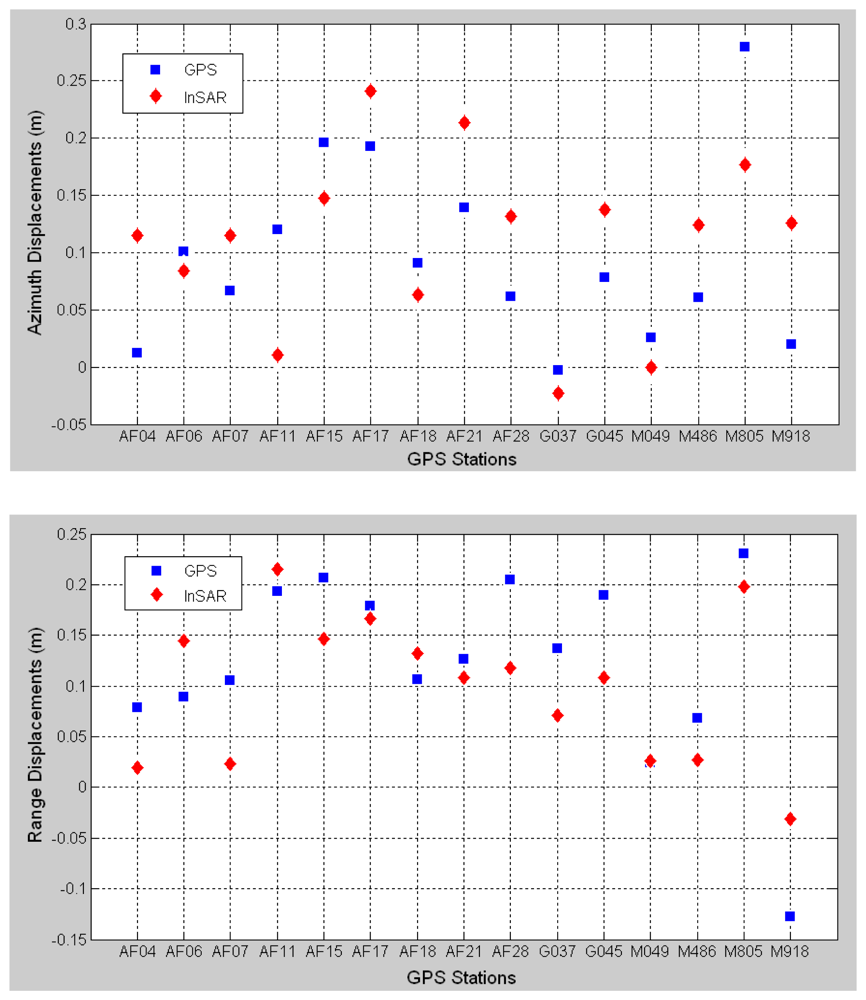
3. Results
4. Conclusions
Acknowledgments
References and Notes
- Chang, C.P.; Wang, C.T.; Chang, T.Y.; Chen, K.S.; Liang, L.S.; Pathier, E. Application of SAR interferometry to a large thrust deformation: the 1999 Mw=7.6 Chi-Chi earthquake in central Taiwan. Geophys. J. Int. 2004, 159, 9–16. [Google Scholar]
- Suga, Y.; Takeuchi, S.; Oguro, Y.; Chen, A.J.; Ogawa, M.; Konishi, T.; Yonezawa, C. Application of ERS-2/SAR data for the 1999 Taiwan earthquake. Adv. Space Res. 2001, 28, 155–163. [Google Scholar]
- Pathier, E.; Fruneau, B.; Deffontaines, B.; Angelier, J.; Chang, C.P.; Yu, S.B.; Lee, C.T. Coseismic displacements of the footwall of the Chelungpu fault caused by the 1999, Taiwan, Chi-Chi earthquake from InSAR and GPS data. Earth Planet. Sci. Lett. 2003, 212, 73–88. [Google Scholar]
- Liu, G.X.; Ding, X.L.; Chen, Y.Q.; Li, Z.L. Crustal deformation mapping with Satellite SAR interferometry: applied to 1999 Chi-Chi, Taiwan earthquake. Abstract of Eos Transactions; In AGU 2002 Fall Meeting.; San Fransisco, California, December 6-10 2002; Volume 83. [Google Scholar]
- Liu, G.X.; Ding, X.L.; Li, Z.L.; Li, Z.W.; Chen, Y.Q.; Yu, S.B. Pre- and co-seismic ground deformations of the 1999 Chi-Chi, Taiwan earthquake, measured with SAR interferometry. Comput. Geosci. 2004, 30, 333–343. [Google Scholar]
- Just, D; Bamler, R. Phase statistics of interferograms with applications to synthetic aperture radar. Appl. Optics. 1994, 33, 4361–4368. [Google Scholar]
- Yu, S.B.; Kou, L.C.; Hsu, Y.J.; Su, H.H.; Liu, C.C.; Hou, C.S.; Lee, J.F.; Lai, T.C.; Liu, C.C.; Liu, C.L.; Tseng, T.F.; Tsai, C.S.; Shin, T.C. Preseismic deformation and coseismic displacements Associated with the 1999 Chi-Chi, Taiwan, earthquake. Bull. Seismol. Soc. Am. 2001, 91, 995–1012. [Google Scholar]
- Michel, R.; Avouac, J.P.; Taboury, J. Measuring near field coseismic displacements from SAR images: Application to the Landers earthquake. Geophys. Res. Lett. 1999, 26, 3017–3020. [Google Scholar]
- Michel, R.; Avouac, J.P.; Taboury, J. Measuring ground displacements from SAR amplitude images: Application to the Landers earthquake. Geophys. Res. Lett. 1999, 26, 875–878. [Google Scholar]
- Fialko, Y.; Sandwell, D.; Simons, M.; Rosen, P. Three-dimensional deformation caused by the Bam, Iran, earthquake and the origin of shallow slip deficit. Nature 2005, 435, 295–299. [Google Scholar]
- Simons, M.; Fialko, Y.; Rivera, L. Coseismic deformation from the 1999 Mw 7.1 Hector Mine, California, earthquake as inferred from InSAR and GPS observations. Bull. Seismol. Soc. Am. 2002, 92, 1390–1402. [Google Scholar]
- Werner, C.; Wegmüller, U.; Strozzi, T.; Wiesmann, A. Gamma SAR and Interferometric Processing Software. Proc. ERSENVISAT Symposium, Gothenburg, Sweden, Oct. 16-20 2000.
- Farr, M.; Kobrick, M. Shuttle radar topography mission produces awealth of data. EOS Transactions 2000, 81, 583–585. [Google Scholar]
- Scharoo, R.; Visser, P. Precise orbit determination and gravity field improvement for the ERS satellites. J. Geophys. Res. 1998, 103, 8113–8127. [Google Scholar]
- ERS Precise Orbit Determination. Departmentof Earth Observation & Space Systems, Delft University of Technology. http://www.deos.tudelft.nl/ers/precorbs/orbits/ (access on April 26 2008).
- Li, Z.W.; Ding, X.L.; Huang, C.; Zheng, D.W.; Zou, W.B.; Shea, Y.K. Filtering method for radar interferogram with strong noise. Int. J. Remote Sens. 2006, 27, 2991–3000. [Google Scholar]
- Zhang, L.; Wu, J.C.; Ge, L.L.; Ding, X.L.; Chen, Y.L. Determining fault slip distribution of the Chi-Chi Taiwan earthquake with GPS and InSAR data using triangular dislocation elements. J. Geodyn. 2007, 45, 163–168. [Google Scholar]
- Werner, C.; Wegmuller, U.; Strozzi, T.; Wiesmam, A. Precision estimation of local offsets between pairs of SAR SLCs and detected SAR images. International Geoscience and Remote Sensing Symposium, Seoul, Korea; 2005; pp. 4803–4805. [Google Scholar]
- Liu, H.X.; Zhao, Z.Y.; Yu, J.Y.; Jezek, K. Simultaneous least squares adjustment of multiframe velocities derived from interferometric and Speckle-Tracking methods. IEEE Geosci. Remote Sens. Lett. 2008, 5, 289–293. [Google Scholar]
- Wang, H.; Ge, L.L.; Xu, C. J. 3-D Coseimic displacement field of the 2005 Kashmir earthquake inferred from satellite radar imagery. Earth Planets Space 2007, 59, 343–349. [Google Scholar]
- Tobita, M.; Murakami, M.; Nakagawa, H.; Yarai, H.; Fujiwara, S. 3-D surface deformation of the 2000 Usu eruption measured by matching of SAR images. Geophys. Res. Lett. 2001, 28, 4291–4294. [Google Scholar]
- Dominguez, S.; Avouac, J. -P.; Michel, R. Horizontal coseismic deformation of the 1999 Chi-Chi earthquake measured from SPOT satellite images: Implications for the seismic cycle along the western foothills of central Taiwan. J. Geophys. Res. 2003, 108(B2), 2083–2101. [Google Scholar]
- Bechor, N.B.D.; Zebker, H.A. Measuring two-dimensional movements using a single InSAR pair. Geophys. Res. Lett. 2006, 33, L16311. [Google Scholar]
- Barbot, S.; Hamiel, Y.; Fialko, Y. Space geodetic investigation of the coseismic and postseismic deformation due to the 2003 Mw7.2 Altai earthquake: Implications for the local lithospheric rheology. J. Geophys. Res. 2008, 113, B03403. [Google Scholar]


| No. | Date | Orbit | Frame | Track |
|---|---|---|---|---|
| 1 | 15 July 1999 | 22130 | 3123 | 232 |
| 2 | 28 October 1999 | 23633 | 3123 | 232 |
© 2008 by the authors; licensee Molecular Diversity Preservation International, Basel, Switzerland. This article is an open access article distributed under the terms and conditions of the Creative Commons Attribution license (http://creativecommons.org/licenses/by/3.0/).
Share and Cite
Hu, J.; Li, Z.-w.; Ding, X.-L.; Zhu, J.-J. Two-dimensional Co-Seismic Surface Displacements Field of the Chi-Chi Earthquake Inferred from SAR Image Matching. Sensors 2008, 8, 6484-6495. https://doi.org/10.3390/s8106484
Hu J, Li Z-w, Ding X-L, Zhu J-J. Two-dimensional Co-Seismic Surface Displacements Field of the Chi-Chi Earthquake Inferred from SAR Image Matching. Sensors. 2008; 8(10):6484-6495. https://doi.org/10.3390/s8106484
Chicago/Turabian StyleHu, Jun, Zhi-wei Li, Xiao-Li Ding, and Jian-Jun Zhu. 2008. "Two-dimensional Co-Seismic Surface Displacements Field of the Chi-Chi Earthquake Inferred from SAR Image Matching" Sensors 8, no. 10: 6484-6495. https://doi.org/10.3390/s8106484
APA StyleHu, J., Li, Z.-w., Ding, X.-L., & Zhu, J.-J. (2008). Two-dimensional Co-Seismic Surface Displacements Field of the Chi-Chi Earthquake Inferred from SAR Image Matching. Sensors, 8(10), 6484-6495. https://doi.org/10.3390/s8106484