
In Silico Prediction of New Inhibitors for Kirsten Rat Sarcoma G12D Cancer Drug Target Using Machine Learning-Based Virtual Screening, Molecular Docking, and Molecular Dynamic Simulation Approaches
 and
and
Abstract
: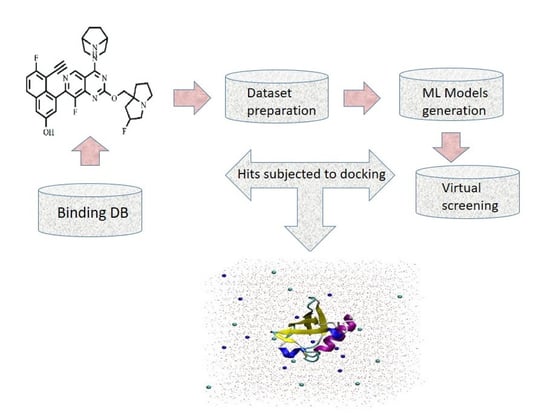
1. Introduction
2. Results
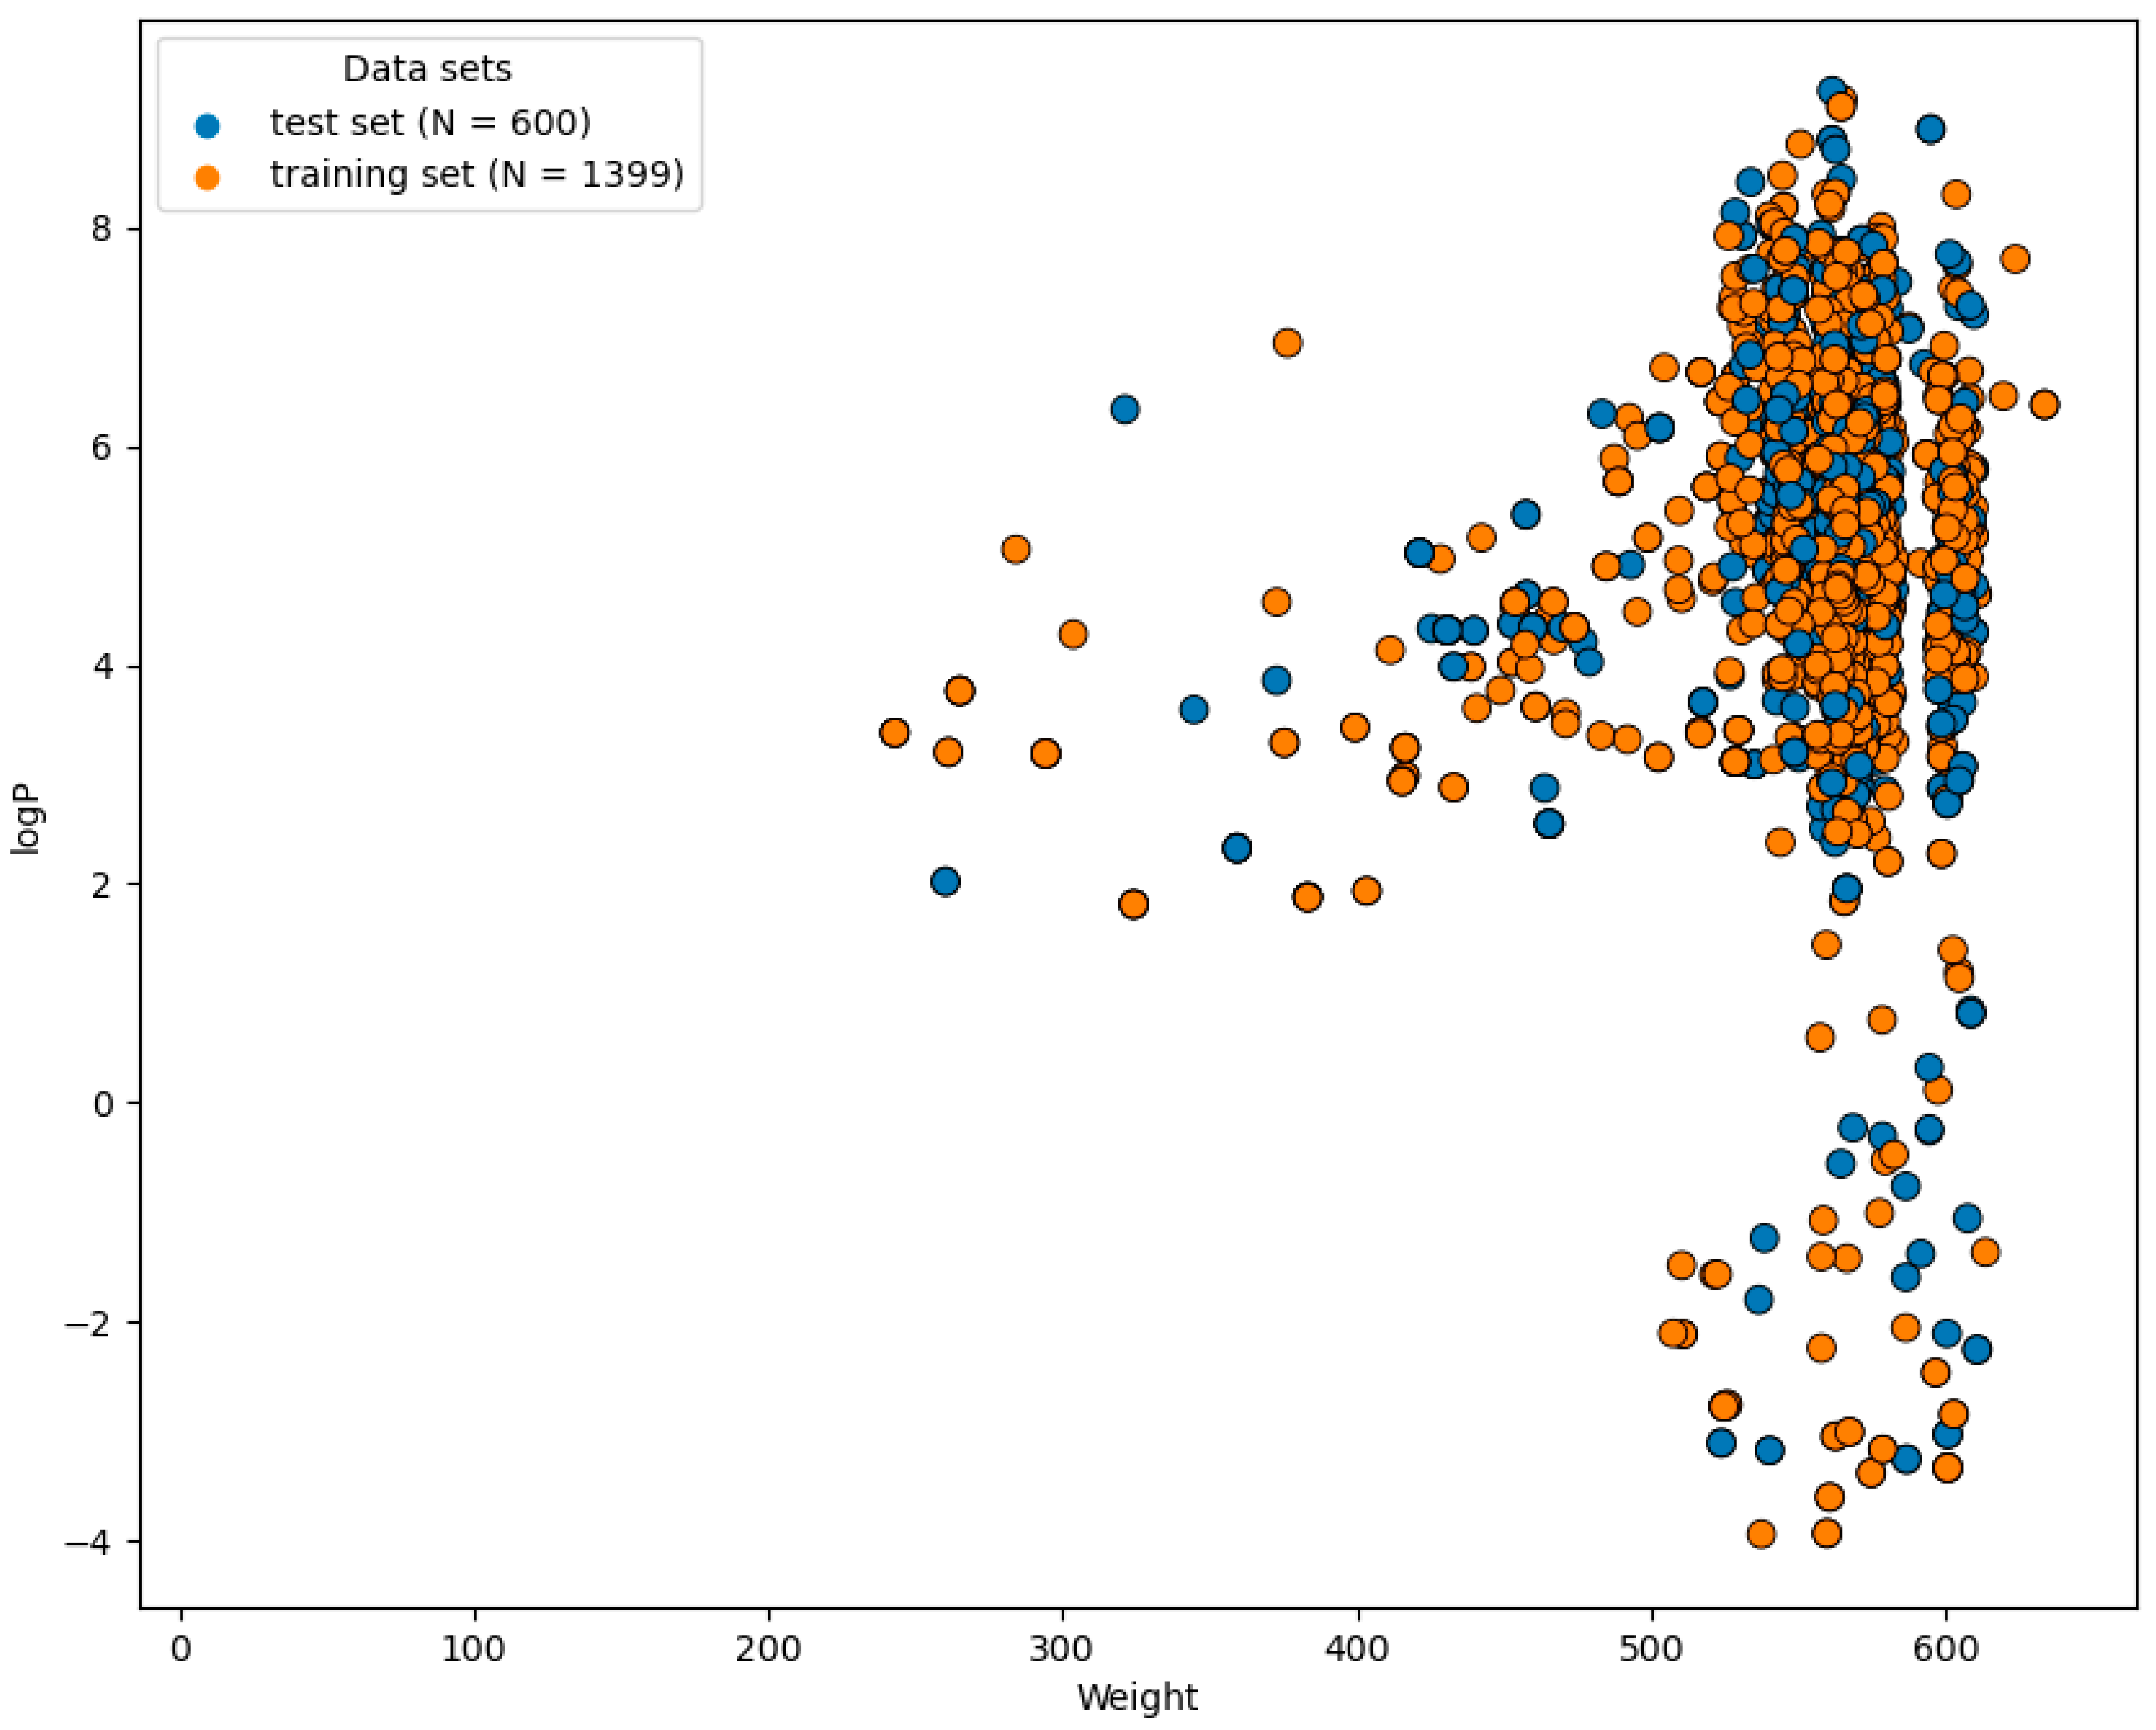
2.1. Preparation of Dataset
2.2. Optimum Features Selection
2.3. Chemical Space and Diversity
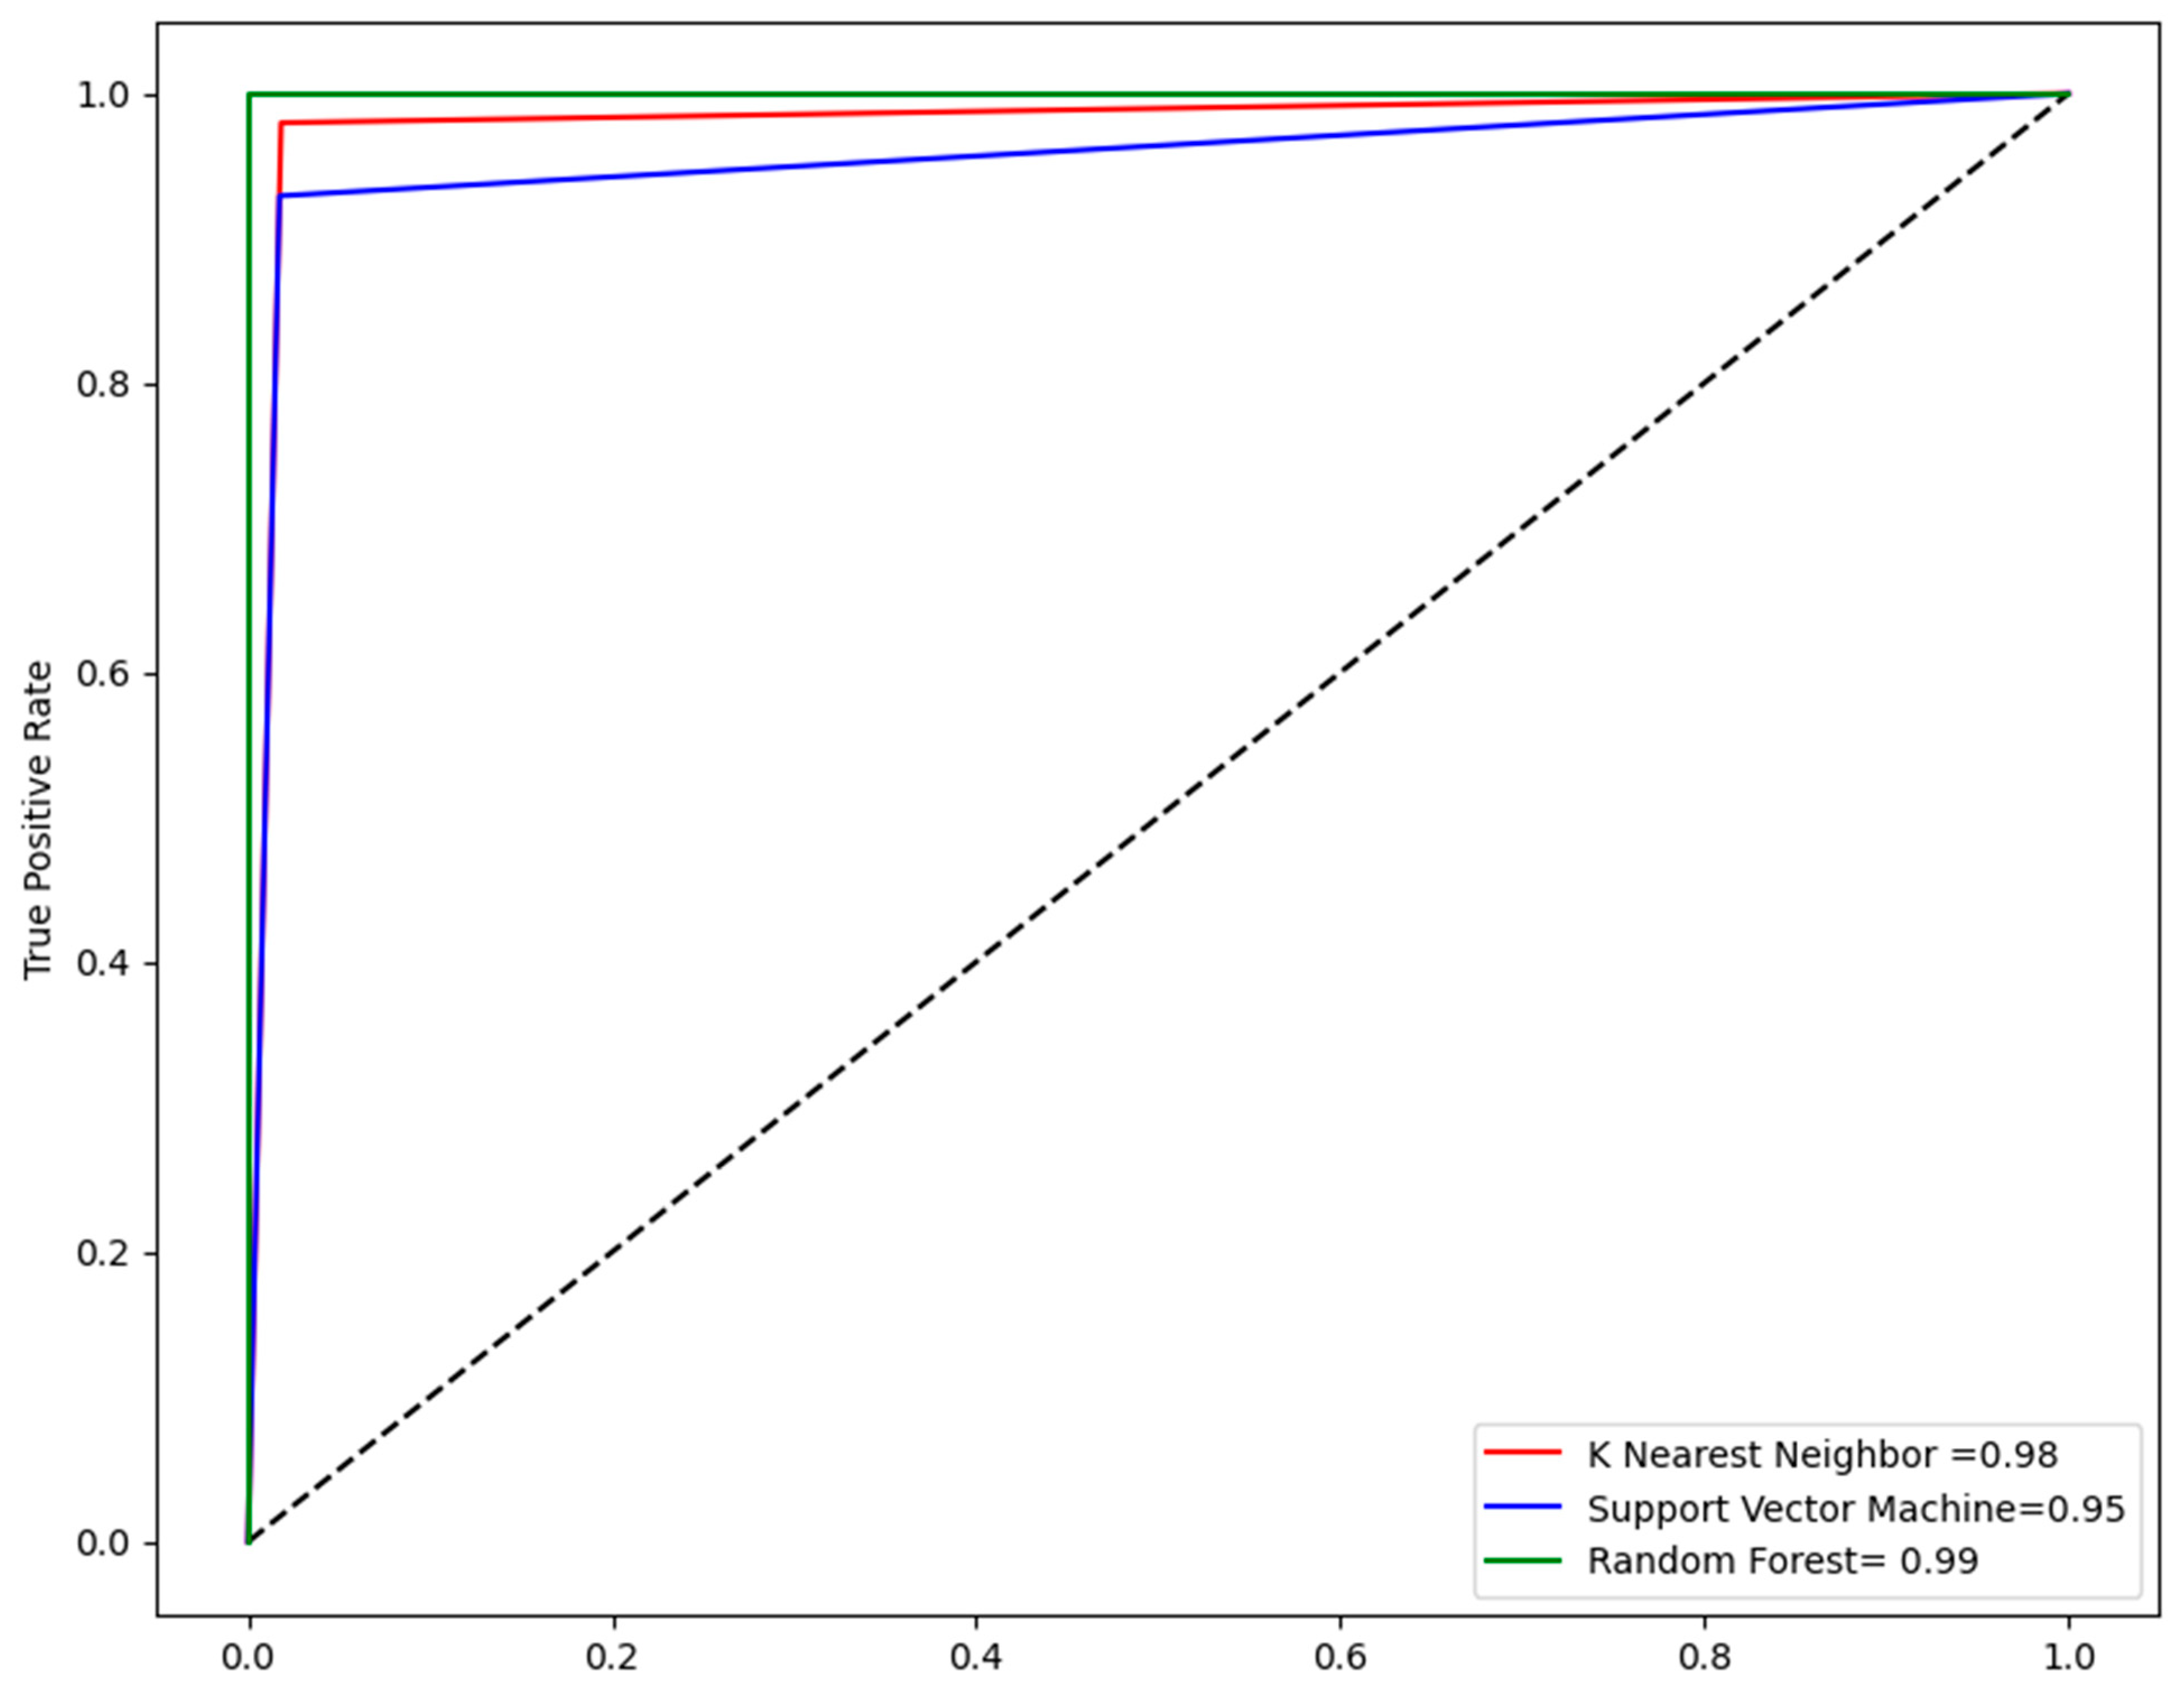
2.4. Performance Evaluation of Models
2.5. Virtual Screening
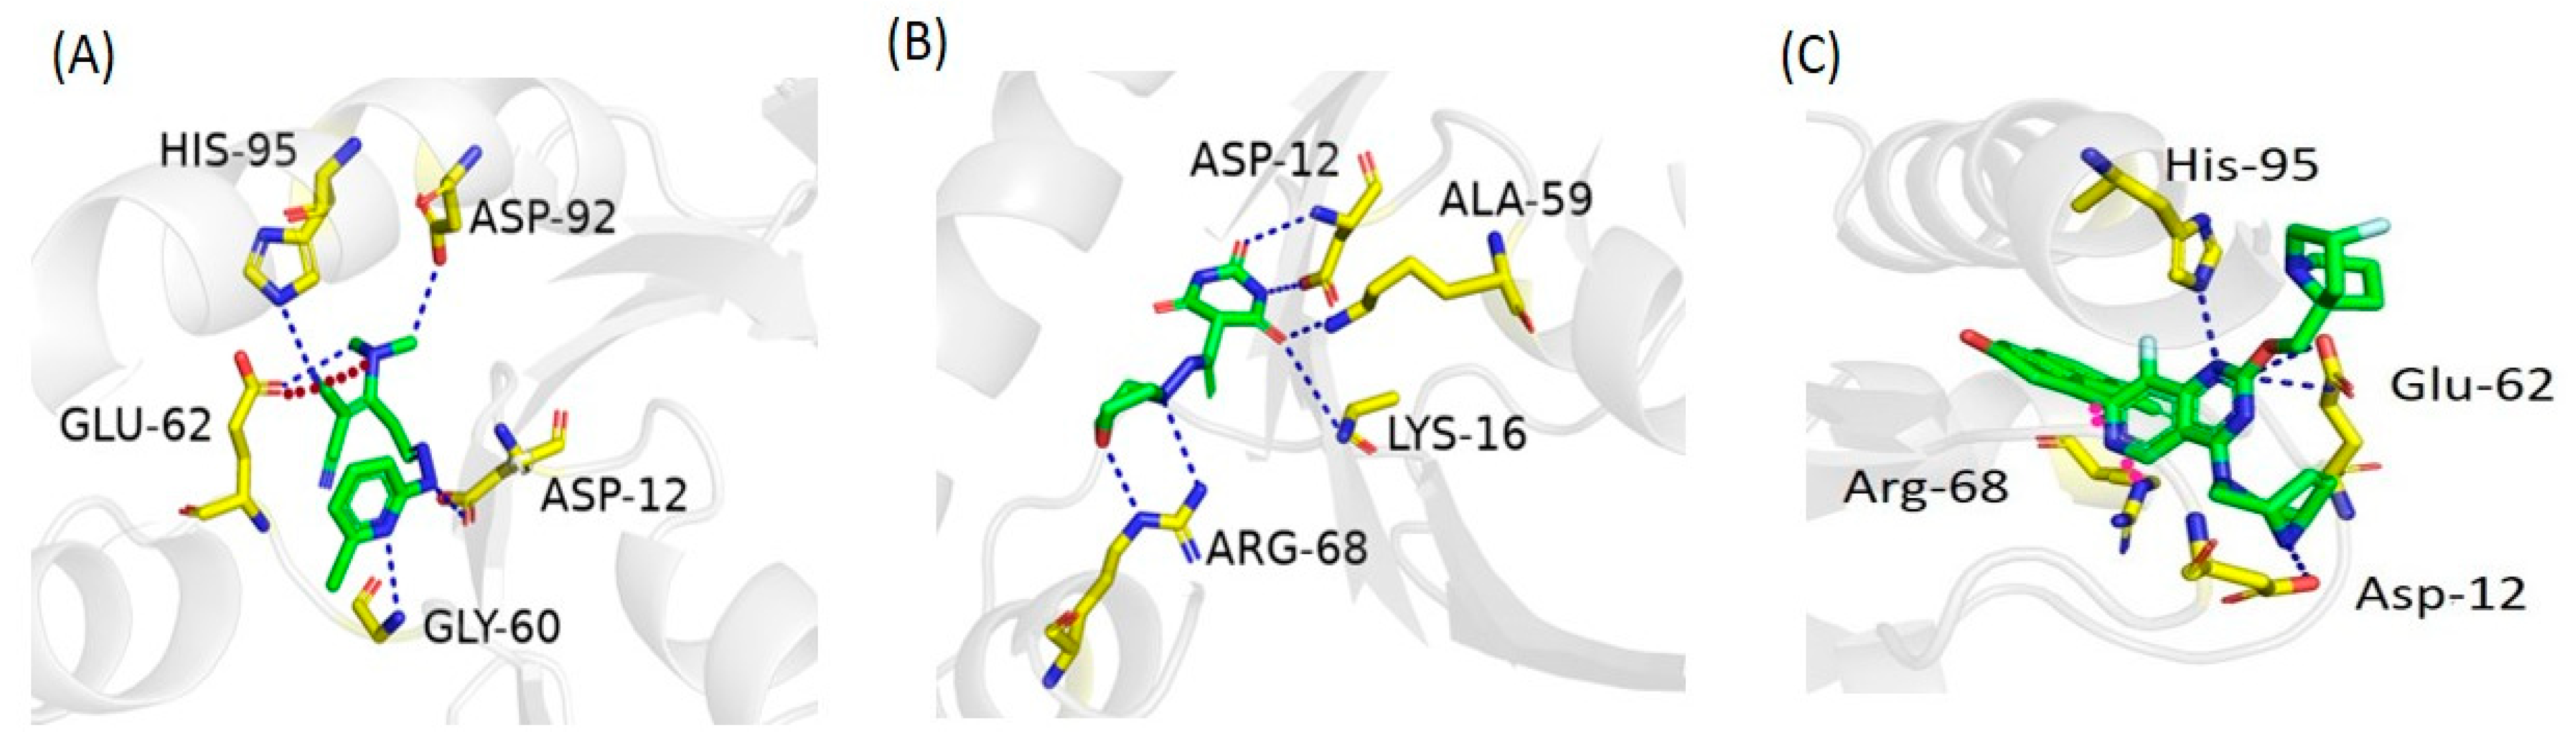
2.6. Molecular Docking Study
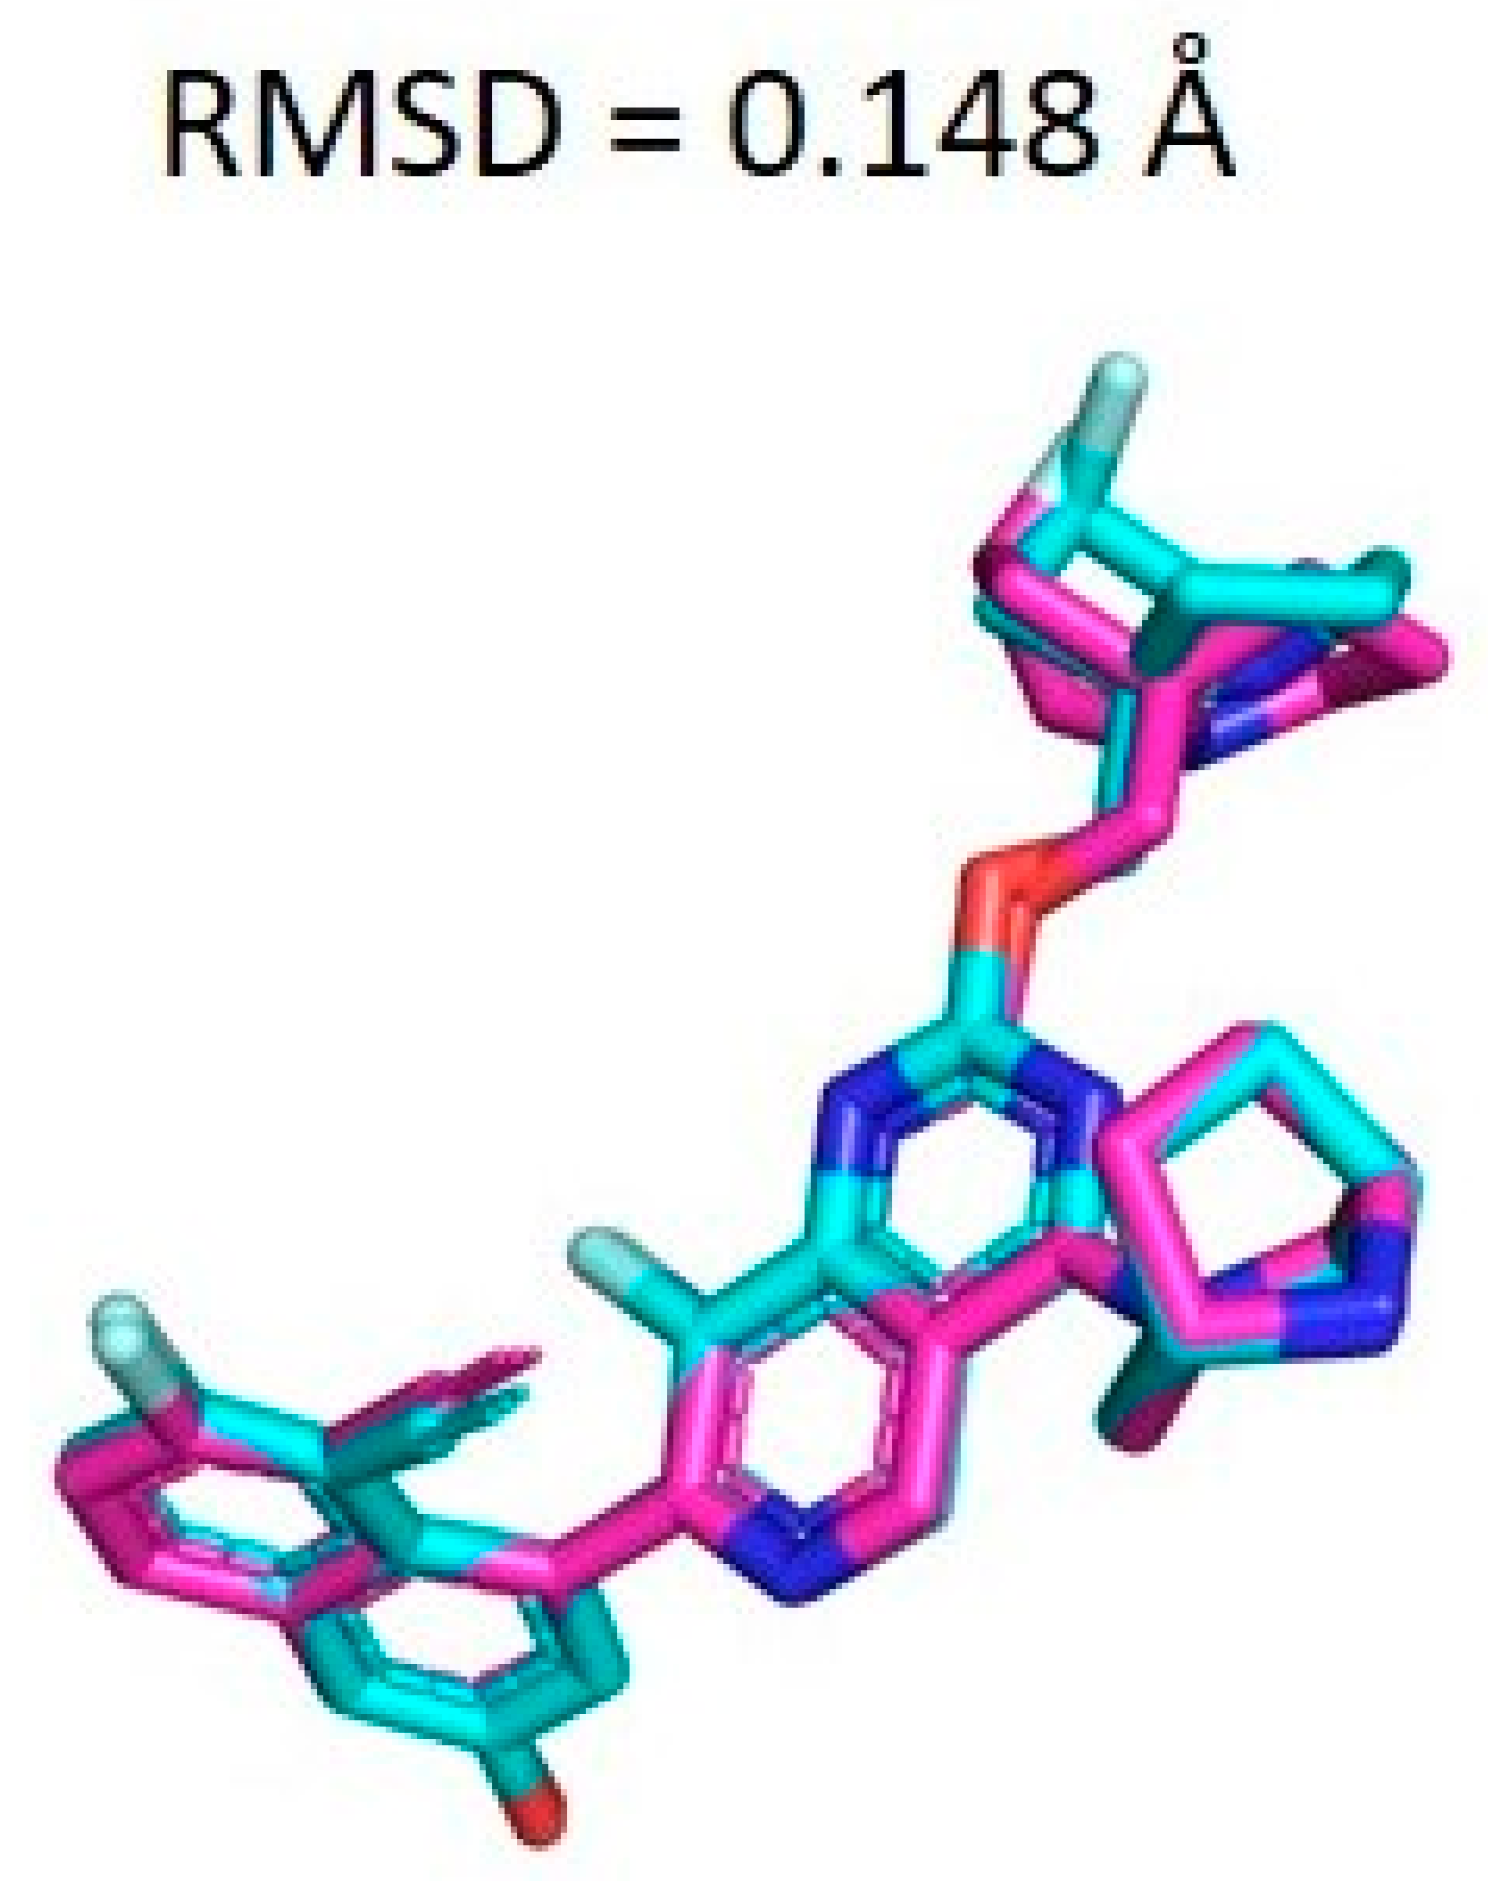
2.7. Docking Validation
2.8. Drug-Likeness and Toxicity Analysis of the Compounds
2.9. Post-Simulation Analysis
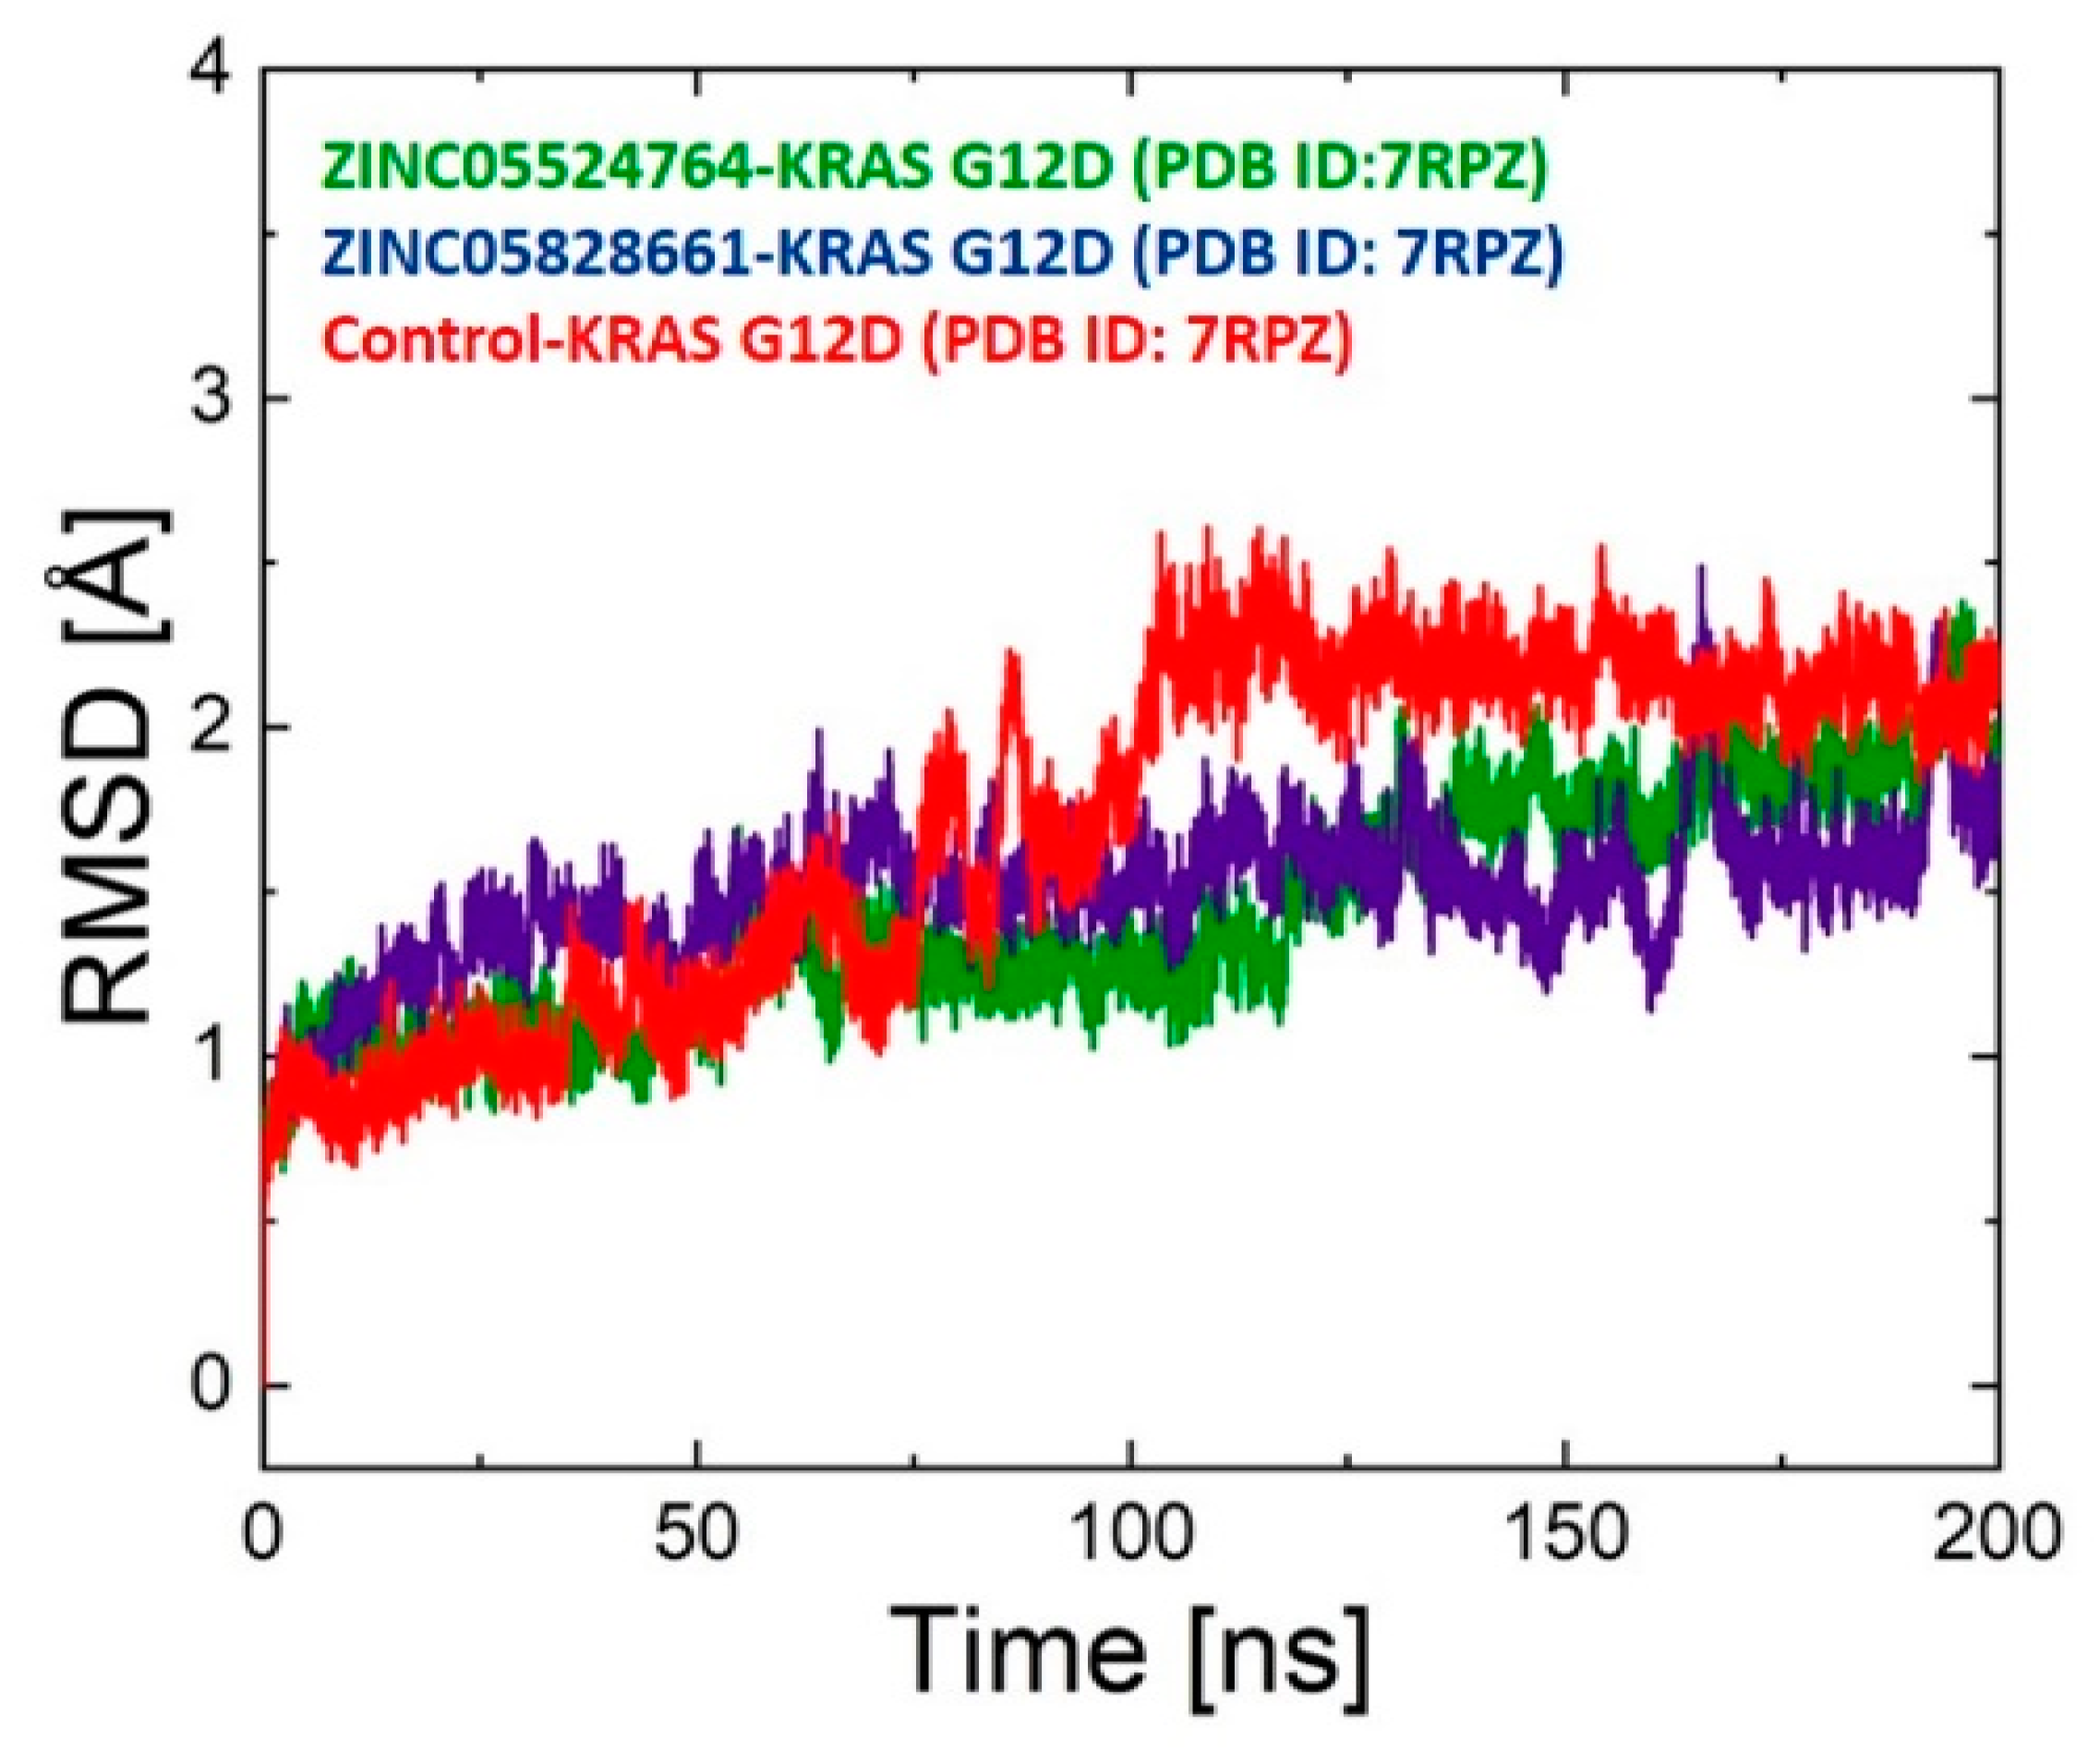
2.9.1. RMSD Analysis
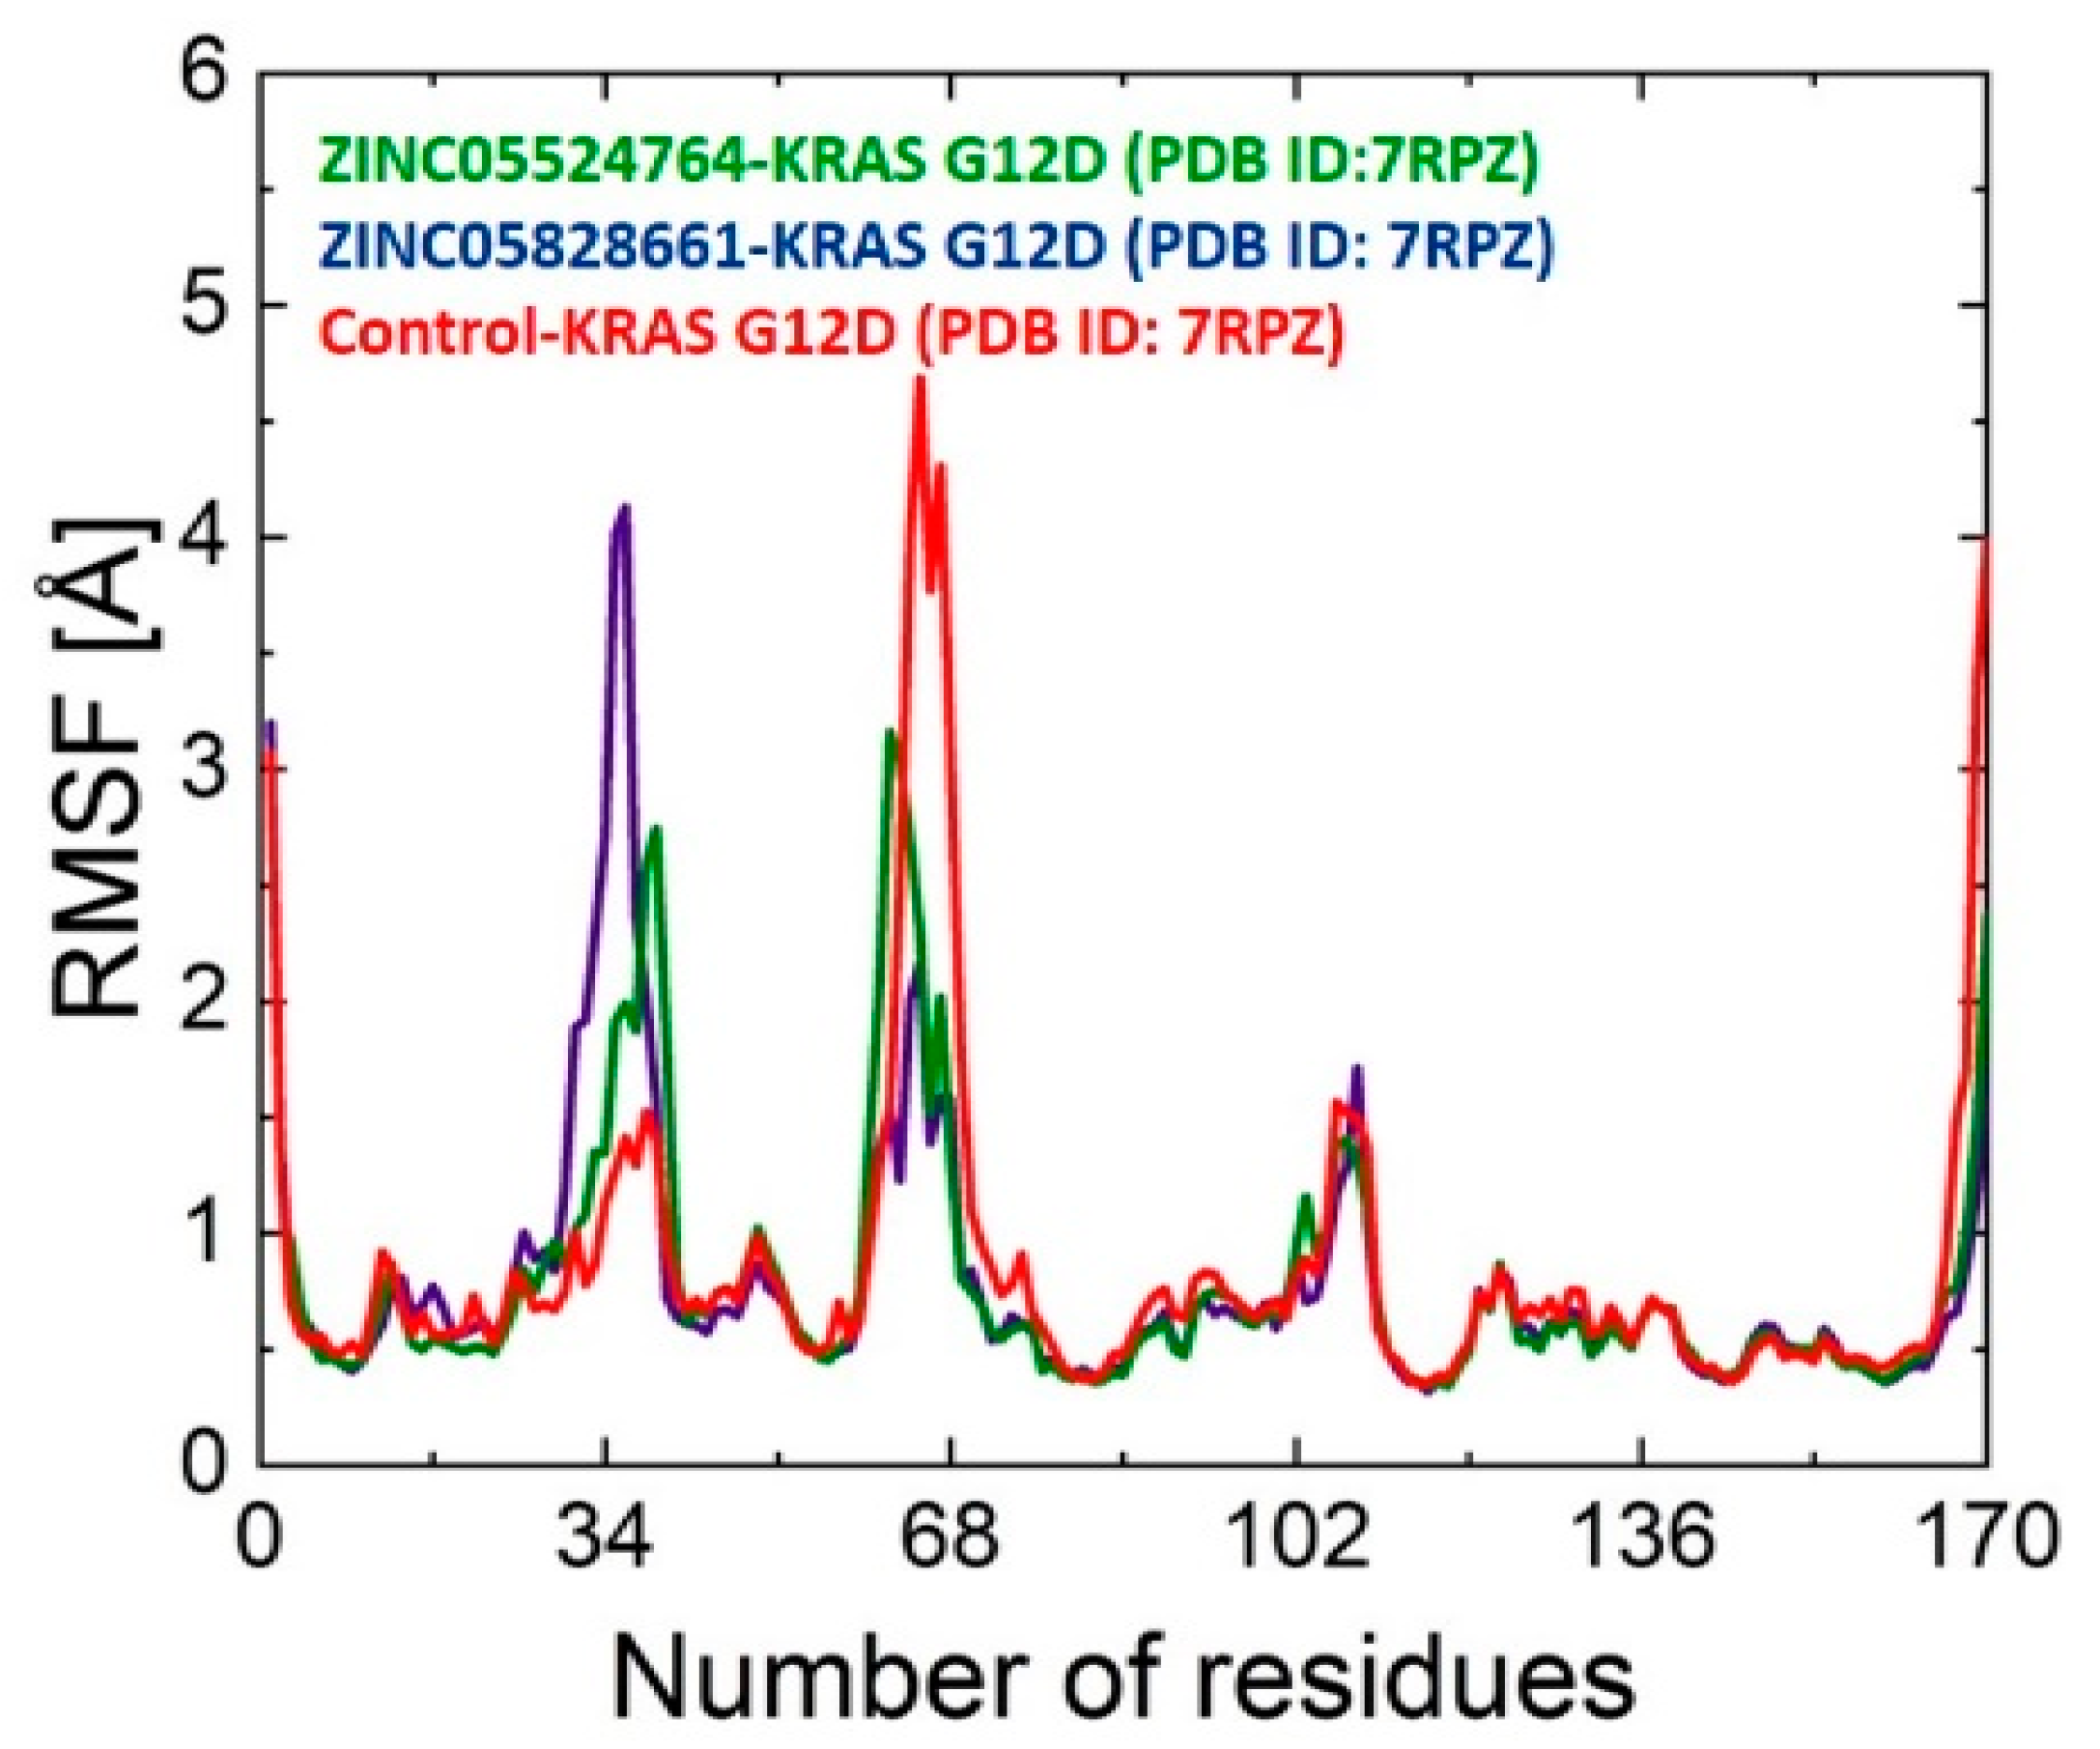
2.9.2. RMSF Analysis
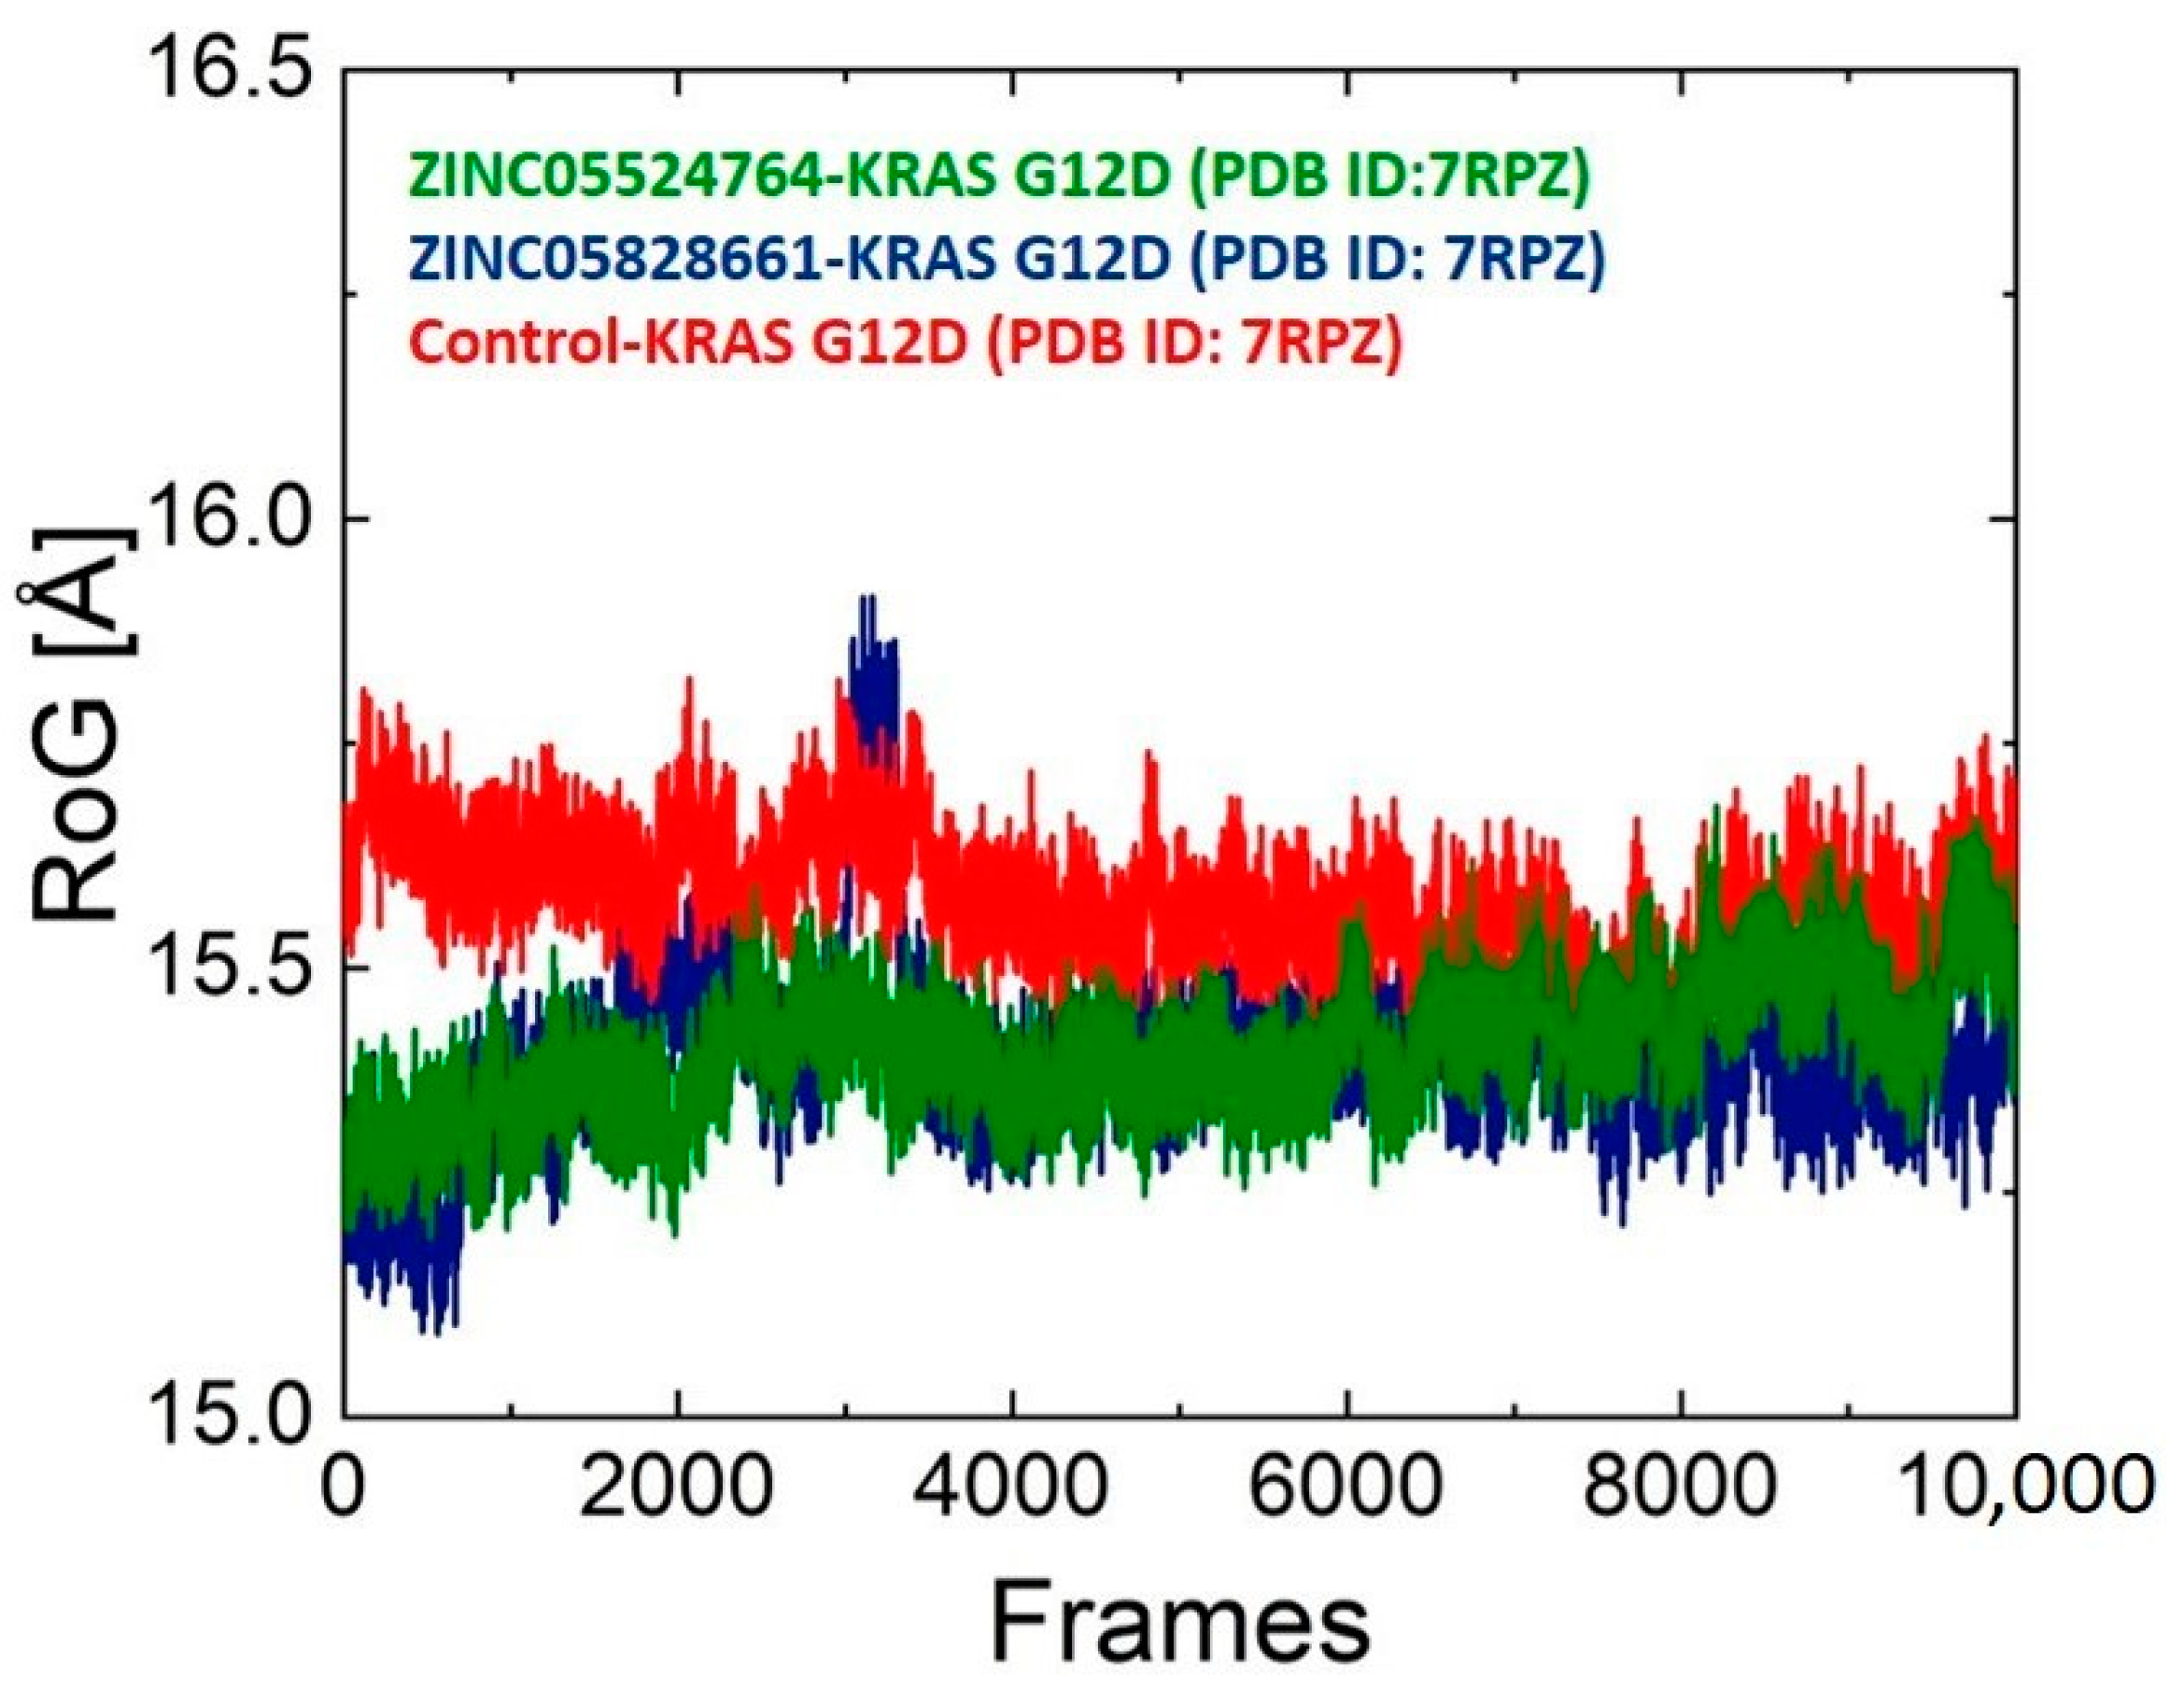
2.10. Structure Compactness Analysis
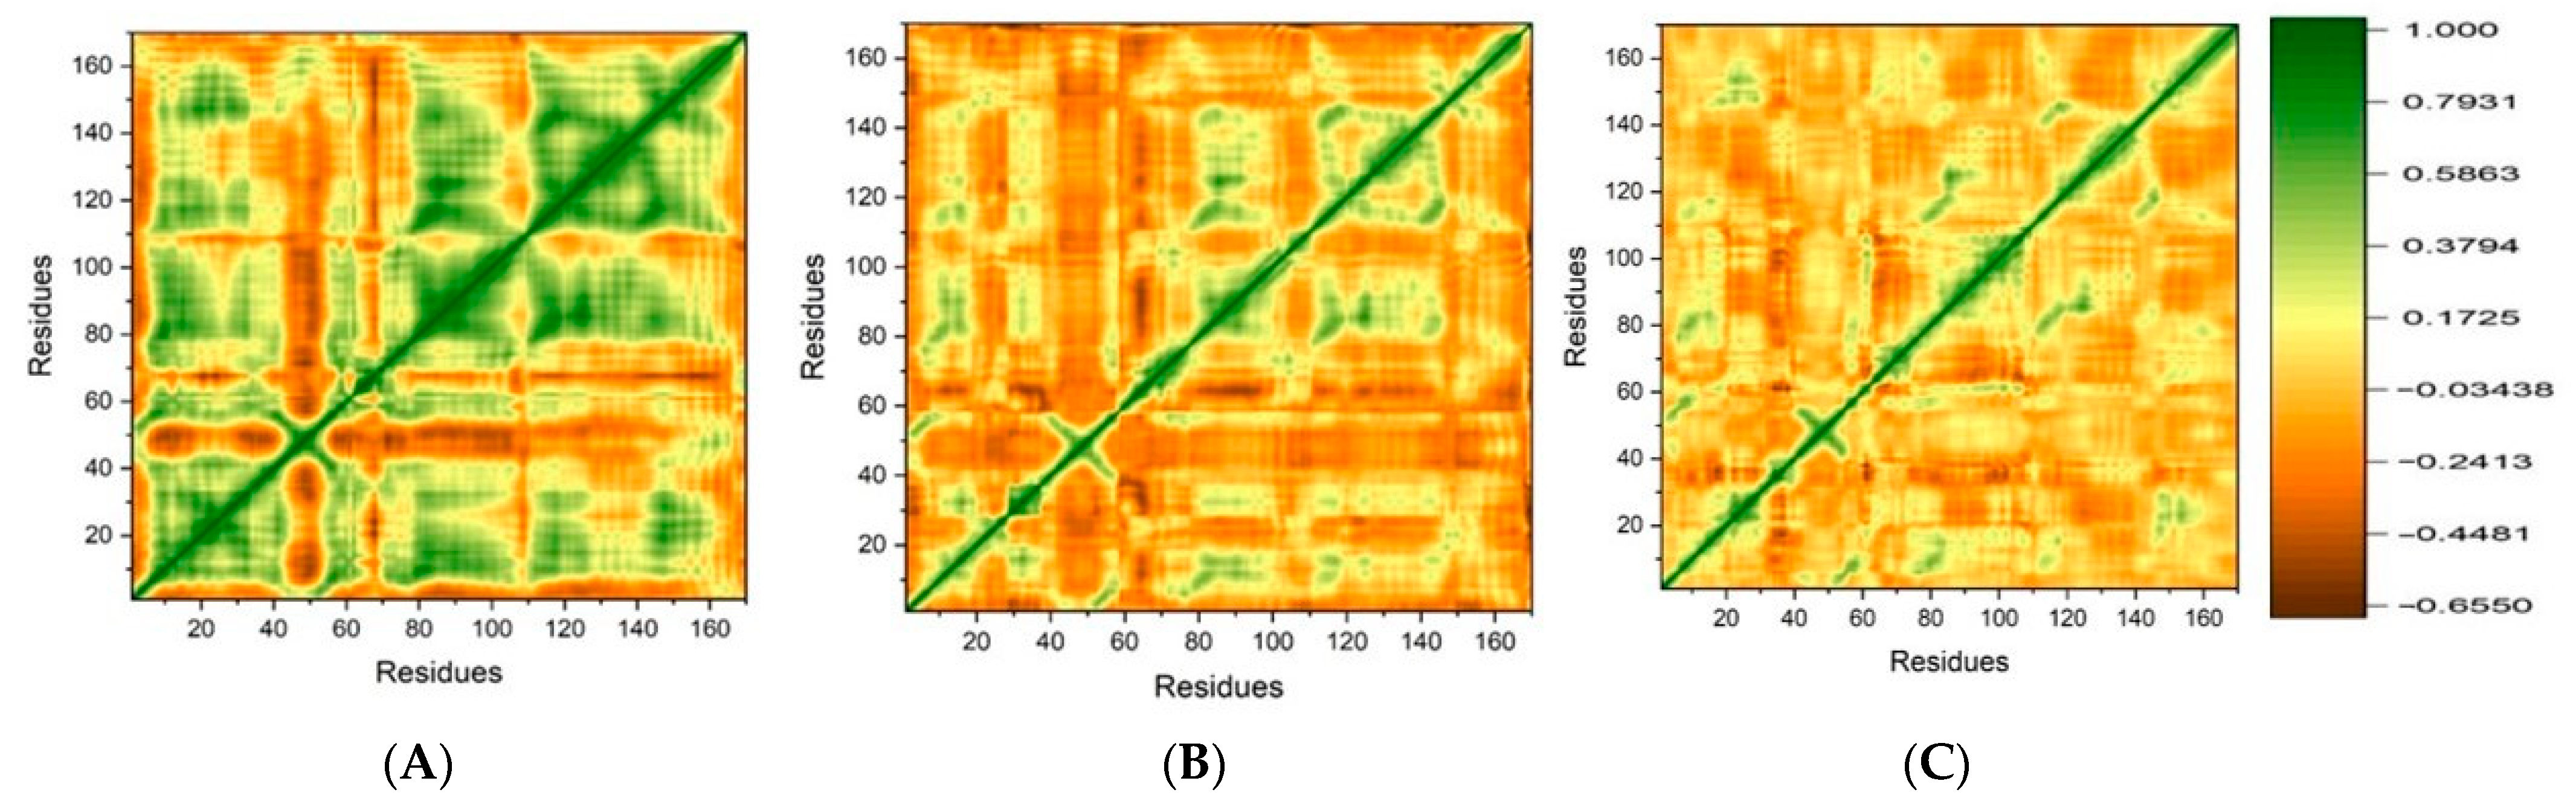
DCCM Analysis
2.11. Binding Energy Calculation
3. Discussion
4. Materials and Method
4.1. Dataset Preparation
4.2. Features Extraction and Dataset Cleaning
4.3. Feature Selection
4.4. ML Models
4.5. K-Nearest Neighbor (kNN)
4.6. Support Vector Machine (SVM)
4.7. Random Forest (RF)
4.8. Models Validation and Performance Evaluation
4.9. Virtual Screening and Molecular Docking Study
4.10. MD Simulation
4.11. Binding Free Energy Calculations
5. Conclusions
Supplementary Materials
Author Contributions
Funding
Institutional Review Board Statement
Informed Consent Statement
Data Availability Statement
Acknowledgments
Conflicts of Interest
References
- Sung, H.; Ferlay, J.; Siegel, R.L.; Laversanne, M.; Soerjomataram, I.; Jemal, A.; Bray, F. Global cancer statistics 2020: GLOBOCAN estimates of incidence and mortality worldwide for 36 cancers in 185 countries. CA Cancer J. Clin. 2021, 71, 209–249. [Google Scholar] [CrossRef] [PubMed]
- Siegel, R.L.; Miller, K.D.; Wagle, N.S.; Jemal, A. Cancer statistics, 2023. CA Cancer J. Clin. 2023, 73, 17–48. [Google Scholar] [CrossRef] [PubMed]
- Parkin, D.M. The global health burden of infection-associated cancers in the year 2002. Int. J. Cancer 2006, 118, 3030–3044. [Google Scholar] [CrossRef] [PubMed]
- Almasmoum, H. Characterization of Mucin 2 Expression in Colorectal Cancer with and without Chemotherapies. Vivo Vitr. Study. JUQUMS 2021, 7, 18–22. [Google Scholar] [CrossRef]
- Meng, M.; Zhong, K.; Jiang, T.; Liu, Z.; Kwan, H.Y.; Su, T. The c urrent understanding on the impact of KRAS on colorectal cancer. Biomed. Pharmacother. 2021, 140, 111717. [Google Scholar] [CrossRef] [PubMed]
- Chen, J.; Zhang, S.; Wang, W.; Pang, L.; Zhang, Q.; Liu, X. Mutation-induced impacts on the switch transformations of the GDP-and GTP-bound K-ras: Insights from multiple replica Gaussian accelerated molecular dynamics and free energy analysis. J. Chem. Inf. Model. 2021, 61, 1954–1969. [Google Scholar] [CrossRef] [PubMed]
- Favazza, L.A.; Parseghian, C.M.; Kaya, C.; Nikiforova, M.N.; Roy, S.; Wald, A.I.; Landau, M.S.; Proksell, S.S.; Dueker, J.M.; Johnston, E.R. KRAS amplification in metastatic colon cancer is associated with a history of inflammatory bowel disease and may confer resistance to anti-EGFR therapy. Mod. Pathol. 2020, 33, 1832–1843. [Google Scholar] [CrossRef] [PubMed]
- Chakrabarti, M.; Jang, H.; Nussinov, R. Comparison of the conformations of KRAS isoforms, K-Ras4A and K-Ras4B, points to similarities and significant differences. J. Phys. Chem. B 2016, 120, 667–679. [Google Scholar] [CrossRef]
- Cox, A.D.; Der, C.J. Ras history: The saga continues. Small GTPases 2010, 1, 2–27. [Google Scholar] [CrossRef]
- Lam, K.K.; Wong, S.H.; Cheah, P.Y. Targeting the ‘Undruggable’Driver Protein, KRAS, in Epithelial Cancers: Current Perspective. Cells 2023, 12, 631. [Google Scholar] [CrossRef]
- Shen, H.; Lundy, J.; Strickland, A.H.; Harris, M.; Swan, M.; Desmond, C.; Jenkins, B.J.; Croagh, D. KRAS G12D Mutation Subtype in Pancreatic Ductal Adenocarcinoma: Does It Influence Prognosis or Stage of Disease at Presentation? Cells 2022, 11, 3175. [Google Scholar] [CrossRef] [PubMed]
- Hofmann, M.H.; Gerlach, D.; Misale, S.; Petronczki, M.; Kraut, N. Expanding the reach of precision oncology by drugging all KRAS mutants. Cancer Discov. 2022, 12, 924–937. [Google Scholar] [CrossRef] [PubMed]
- Nagasaka, M.; Li, Y.; Sukari, A.; Ou, S.-H.I.; Al-Hallak, M.N.; Azmi, A.S. KRAS G12C Game of Thrones, which direct KRAS inhibitor will claim the iron throne? Cancer Treat. Rev. 2020, 84, 101974. [Google Scholar] [CrossRef]
- Kargbo, R.B. Targeting KRASG12D Mutations: Discovery of Small Molecule Inhibitors for the Potential Treatment of Intractable Cancers. ACS Med. Chem. Lett. 2023, 14, 1041–1042. [Google Scholar] [CrossRef] [PubMed]
- Paul, D.; Sanap, G.; Shenoy, S.; Kalyane, D.; Kalia, K.; Tekade, R.K. Artificial intelligence in drug discovery and development. Drug Discov. Today 2021, 26, 80. [Google Scholar] [CrossRef]
- Noor, F.; Noor, A.; Ishaq, A.R.; Farzeen, I.; Saleem, M.H.; Ghaffar, K.; Aslam, M.F.; Aslam, S.; Chen, J.-T. Recent advances in diagnostic and therapeutic approaches for breast cancer: A comprehensive review. Curr. Pharm. Des. 2021, 27, 2344–2365. [Google Scholar] [CrossRef] [PubMed]
- Noor, F.; Tahir ul Qamar, M.; Ashfaq, U.A.; Albutti, A.; Alwashmi, A.S.; Aljasir, M.A. Network pharmacology approach for medicinal plants: Review and assessment. Pharmaceuticals 2022, 15, 572. [Google Scholar] [CrossRef]
- Floresta, G.; Zagni, C.; Gentile, D.; Patamia, V.; Rescifina, A. Artificial intelligence technologies for COVID-19 de novo drug design. Int. J. Mol. Sci. 2022, 23, 3261. [Google Scholar] [CrossRef] [PubMed]
- Sadaqat, M.; Qasim, M.; ul Qamar, M.T.; Masoud, M.S.; Ashfaq, U.A.; Noor, F.; Fatima, K.; Allemailem, K.S.; Alrumaihi, F.; Almatroudi, A. Advanced network pharmacology study reveals multi-pathway and multi-gene regulatory molecular mechanism of Bacopa monnieri in liver cancer based on data mining, molecular modeling, and microarray data analysis. Comput. Biol. Med. 2023, 161, 107059. [Google Scholar] [CrossRef]
- Yang, J.; Cai, Y.; Zhao, K.; Xie, H.; Chen, X. Concepts and applications of chemical fingerprint for hit and lead screening. Drug Discov. Today 2022, 27, 103356. [Google Scholar] [CrossRef]
- Tang, D.; Kang, R. Glimmers of hope for targeting oncogenic KRAS-G12D. Cancer Gene Ther. 2023, 30, 391–393. [Google Scholar] [CrossRef] [PubMed]
- Lin, X.; Yang, F.; Zhou, L.; Yin, P.; Kong, H.; Xing, W.; Lu, X.; Jia, L.; Wang, Q.; Xu, G. A support vector machine-recursive feature elimination feature selection method based on artificial contrast variables and mutual information. J. Chromatogr. B 2012, 910, 149–155. [Google Scholar] [CrossRef] [PubMed]
- Samad, A.; Ajmal, A.; Mahmood, A.; Khurshid, B.; Li, P.; Jan, S.M.; Rehman, A.U.; He, P.; Abdalla, A.N.; Umair, M. Identification of novel inhibitors for SARS-CoV-2 as therapeutic options using machine learning-based virtual screening, molecular docking and MD simulation. Front. Mol. Biosci. 2023, 10, 1060076. [Google Scholar] [CrossRef]
- Ajmal, A.; Ali, Y.; Khan, A.; Wadood, A.; Rehman, A.U. Identification of novel peptide inhibitors for the KRas-G12C variant to prevent oncogenic signaling. J. Biomol. Struct. Dyn. 2023, 41, 8866–8875. [Google Scholar] [CrossRef] [PubMed]
- Khan, A.; Randhawa, A.W.; Balouch, A.R.; Mukhtar, N.; Sayaf, A.M.; Suleman, M.; Khan, T.; Ali, S.; Ali, S.S.; Wang, Y. Blocking key mutated hotspot residues in the RBD of the omicron variant (B. 1.1. 529) with medicinal compounds to disrupt the RBD-hACE2 complex using molecular screening and simulation approaches. RSC Adv. 2022, 12, 7318–7327. [Google Scholar] [CrossRef] [PubMed]
- Mizrahi, J.D.; Surana, R.; Valle, J.W.; Shroff, R.T. Pancreatic cancer. Lancet 2020, 395, 2008–2020. [Google Scholar] [CrossRef] [PubMed]
- Rahib, L.; Wehner, M.R.; Matrisian, L.M.; Nead, K.T. Estimated projection of US cancer incidence and death to 2040. JAMA Netw. Open 2021, 4, e214708. [Google Scholar] [CrossRef] [PubMed]
- Moore, A.R.; Rosenberg, S.C.; McCormick, F.; Malek, S. RAS-targeted therapies: Is the undruggable drugged? Nat. Rev. Drug Discov. 2020, 19, 533–552. [Google Scholar] [CrossRef] [PubMed]
- Akkapeddi, P.; Hattori, T.; Khan, I.; Glasser, E.; Koide, A.; Ketavarapu, G.; Whaby, M.; Zuberi, M.; Teng, K.W.; Lefler, J. Exploring switch II pocket conformation of KRAS (G12D) with mutant-selective monobody inhibitors. Proc. Natl. Acad. Sci. USA 2023, 120, e2302485120. [Google Scholar] [CrossRef]
- Waters, A.M.; Der, C.J. KRAS: The critical driver and therapeutic target for pancreatic cancer. Cold Spring Harb. Perspect. Med. 2018, 8, a031435. [Google Scholar] [CrossRef]
- Yousef, A.; Yousef, M.; Chowdhury, S.; Abdilleh, K.; Knafl, M.; Edelkamp, P.; Alfaro-Munoz, K.; Chacko, R.; Peterson, J.; Smaglo, B.G. Impact of KRAS mutations and co-mutations on clinical outcomes in pancreatic ductal adenocarcinoma. NPJ Precis. Oncol. 2024, 8, 27. [Google Scholar] [CrossRef] [PubMed]
- Patel, L.; Shukla, T.; Huang, X.; Ussery, D.W.; Wang, S. Machine learning methods in drug discovery. Molecules 2020, 25, 5277. [Google Scholar] [CrossRef] [PubMed]
- Sharma, G.; Shukla, R.; Singh, T.R. Identification of small molecules against the NMDAR: An insight from virtual screening, density functional theory, free energy landscape and molecular dynamics simulation-based findings. Netw. Model. Anal. Health Inform. Bioinform. 2022, 11, 31. [Google Scholar] [CrossRef]
- Zhu, J.; Wu, Y.; Wang, M.; Li, K.; Xu, L.; Chen, Y.; Cai, Y.; Jin, J. Integrating machine learning-based virtual screening with multiple protein structures and bio-assay evaluation for discovery of novel GSK3β inhibitors. Front. Pharmacol. 2020, 11, 566058. [Google Scholar] [CrossRef]
- Oyedele, A.-Q.K.; Owolabi, N.A.; Odunitan, T.T.; Christiana, A.A.; Jimoh, R.O.; Azeez, W.O.A.; Titilayo, M.B.-H.; Soares, A.S.; Adekola, A.T.; Abdulkareem, T.O. The discovery of some promising putative binders of KRAS G12D receptor using computer-aided drug discovery approach. Inform. Med. Unlocked 2023, 37, 101170. [Google Scholar] [CrossRef]
- Wadood, A.; Ajmal, A.; Junaid, M.; Rehman, A.U.; Uddin, R.; Azam, S.S.; Khan, A.Z.; Ali, A. Machine learning-based virtual screening for STAT3 anticancer drug target. Curr. Pharm. Des. 2022, 28, 3023–3032. [Google Scholar] [CrossRef] [PubMed]
- Sahoo, K.; Samal, A.K.; Pramanik, J.; Pani, S.K. Exploratory data analysis using Python. Int. J. Innov. Technol. Explor. Eng. 2019, 8, 4727–4735. [Google Scholar] [CrossRef]
- Datta, R.; Das, D.; Das, S. Efficient lipophilicity prediction of molecules employing deep-learning models. Chemom. Intell. Lab. Syst. 2021, 213, 104309. [Google Scholar] [CrossRef]
- Akbar, S.; Hayat, M.; Tahir, M.; Chong, K.T. cACP-2LFS: Classification of anticancer peptides using sequential discriminative model of KSAAP and two-level feature selection approach. IEEE Access 2020, 8, 131939–131948. [Google Scholar] [CrossRef]
- Zhang, Z. Introduction to machine learning: K-nearest neighbors. Ann. Transl. Med. 2016, 4, 218. [Google Scholar] [CrossRef]
- Di Stefano, M.; Galati, S.; Ortore, G.; Caligiuri, I.; Rizzolio, F.; Ceni, C.; Bertini, S.; Bononi, G.; Granchi, C.; Macchia, M. Machine learning-based virtual screening for the identification of CDK5 inhibitors. Int. J. Mol. Sci. 2022, 23, 10653. [Google Scholar] [CrossRef]
- Ahmad, I.; Basheri, M.; Iqbal, M.J.; Rahim, A. Performance comparison of support vector machine, random forest, and extreme learning machine for intrusion detection. IEEE Access 2018, 6, 33789–33795. [Google Scholar] [CrossRef]
- Halwani, A.A. Development of pharmaceutical nanomedicines: From the bench to the market. Pharmaceutics 2022, 14, 106. [Google Scholar] [CrossRef]
- Denisko, D.; Hoffman, M.M. Classification and interaction in random forests. Proc. Natl. Acad. Sci. USA 2018, 115, 1690–1692. [Google Scholar] [CrossRef]
- Akbar, S.; Rahman, A.U.; Hayat, M.; Sohail, M. cACP: Classifying anticancer peptides using discriminative intelligent model via Chou’s 5-step rules and general pseudo components. Chemom. Intell. Lab. Syst. 2020, 196, 103912. [Google Scholar] [CrossRef]
- Jiao, Y.; Du, P. Performance measures in evaluating machine learning based bioinformatics predictors for classifications. Quant. Biol. 2016, 4, 320–330. [Google Scholar] [CrossRef]
- Alotaibi, B.S.; Ajmal, A.; Hakami, M.A.; Mahmood, A.; Wadood, A.; Hu, J. New drug target identification in Vibrio vulnificus by subtractive genome analysis and their inhibitors through molecular docking and molecular dynamics simulations. Heliyon 2023, 9, e17650. [Google Scholar] [CrossRef] [PubMed]
- Qazi, S.; Das, S.; Khuntia, B.K.; Sharma, V.; Sharma, S.; Sharma, G.; Raza, K. In silico molecular docking and molecular dynamic simulation analysis of phytochemicals from Indian foods as potential inhibitors of SARS-CoV-2 RdRp and 3CLpro. Nat. Prod. Commun. 2021, 16, 1934578X211031707. [Google Scholar] [CrossRef]
- Ullah, H.; Nawaz, A.; Rahim, F.; Uddin, I.; Hussain, A.; Hayat, S.; Zada, H.; Khan, M.U.; Khan, M.S.; Ajmal, A. Synthesis, in vitro β-glucuronidase inhibitory potential and molecular docking study of benzimidazole analogues. Chem. Data Collect. 2023, 44, 100996. [Google Scholar] [CrossRef]
- Ajmal, A.; Mahmood, A.; Hayat, C.; Hakami, M.A.; Alotaibi, B.S.; Umair, M.; Abdalla, A.N.; Li, P.; He, P.; Wadood, A. Computer-assisted drug repurposing for thymidylate kinase drug target in monkeypox virus. Front. Cell. Infect. Microbiol. 2023, 13, 618. [Google Scholar] [CrossRef]
- Muhammad, N.; Khan, R.; Seraj, F.; Khan, A.; Ullah, U.; Wadood, A.; Ajmal, A.; Ali, B.; Khan, K.M.; Nawaz, N.U.A. In vivo analgesic, anti-inflammatory and molecular docking studies of S-naproxen derivatives. Heliyon 2024, 10, e24267. [Google Scholar] [CrossRef] [PubMed]
- He, Y.; Liu, K.; Cao, F.; Song, R.; Liu, J.; Zhang, Y.; Li, W.; Han, W. Using deep learning and molecular dynamics simulations to unravel the regulation mechanism of peptides as noncompetitive inhibitor of xanthine oxidase. Sci. Rep. 2024, 14, 174. [Google Scholar] [CrossRef] [PubMed]
- Korlepara, D.B.; Vasavi, C.S.; Srivastava, R.; Pal, P.K.; Raza, S.H.; Kumar, V.; Pandit, S.; Nair, A.G.; Pandey, S.; Sharma, S.; et al. PLAS-20k: Extended Dataset of Protein-Ligand Affinities from MD Simulations for Machine Learning Applications. Sci. Data 2024, 11, 180. [Google Scholar] [CrossRef] [PubMed]
- Khan, H.; Waqas, M.; Khurshid, B.; Ullah, N.; Khalid, A.; Abdalla, A.N.; Alamri, M.A.; Wadood, A. Investigating the role of Sterol C24-Methyl transferase mutation on drug resistance in leishmaniasis and identifying potential inhibitors. J. Biomol. Struct. Dyn. 2023, 1–14. [Google Scholar] [CrossRef] [PubMed]


| Models | Accuracy | Sensitivity | F1 Score | MCC |
|---|---|---|---|---|
| KNN | 98 | 0.99 | 0.95 | 0.94 |
| SVM | 96 | 0.93 | 0.92 | 0.90 |
| RF | 99 | 0.94 | 0.96 | 0.96 |
| Zinc ID | Interacting Residues | Interaction Type | Distance (Å) | Energy (kcal/mol) | S Score (kcal/mol) |
|---|---|---|---|---|---|
| ZINC05524764 | GLU 62 | H-bond | 3.30 | −2.0 | −7.91 |
| ASP 92 | H-bond | 3.13 | −1.8 | ||
| ASP 12 | H-bond | 3.02 | −2.1 | ||
| HIS 95 | H-bond | 2.96 | −2.8 | ||
| GLY 60 | H-bond | 3.23 | −3.5 | ||
| GLU 62 | Ionic | 3.72 | −1.1 | ||
| ZINC05828661 | ASP 12 | H-bond | 3.01 | −2.6 | −6.85 |
| LYS 16 | H-bond | 3.15 | −1.7 | ||
| Ala 59 | H-bond | 3.25 | −0.6 | ||
| ASP 12 | H-bond | 3.30 | −0.5 | ||
| ARG 68 | H-bond | 3.20 | −2.6 | ||
| ARG 68 | H-bond | 3.23 | −1.5 | ||
| ZINC05725307 | ASP 12 | H-bond | 2.88 | −1.6 | −6.70 |
| ARG 102 | H-bond | 2.88 | −5.1 | ||
| LYS 16 | H-bond | 3.33 | −0.9 | ||
| LYS 16 | Ionic | 2.78 | −6.2 | ||
| ALA 59 | Arene-H | 4.12 | −0.6 | ||
| ARG 68 | Arene-cation | 4.83 | −0.8 | ||
| ZINC17004657 | GLN 61 | Arene-H | 3.88 | −1.1 | −5.68 |
| ASP 12 | H-bond | 2.98 | −1.6 | ||
| ASP 12 | H-bond | 3.05 | −1.2 | ||
| LYS 16 | H-bond | 3.30 | −1.0 | ||
| ZINC18169629 | GLN 61 | H-bond | 3.09 | −0.6 | −6.19 |
| HIS 95 | H-bond | 2.91 | −6.2 | ||
| GLY 60 | H-bond | 3.26 | −1.0 | ||
| LYS 16 | H-bond | 3.13 | −3.0 | ||
| ALA 59 | Arene-H | 4.03 | −1.2 | ||
| GLY 60 | Arene-H | 4.39 | −0.6 | ||
| THR 58 | Arene-H | 4.02 | −0.8 | ||
| ZINC22760692 | GLU 63 | H-bond | 3.20 | −1.1 | −6.51 |
| HIS 95 | H-bond | 3.24 | −0.8 | ||
| ARG 68 | H-bond | 3.12 | −0.5 | ||
| GLY 10 | H-bond | 3.10 | −0.5 | ||
| LYS 16 | H-bond | 3.16 | −0.8 | ||
| MET 72 | Arene-H | 4.17 | −0.6 | ||
| Control | GLU 62 | H-bond | 3.29 | −1.4 | −5.39 |
| GLU 62 | H-bond | 3.30 | −0.7 | ||
| ASP 12 | H-bond | 2.64 | −3.1 | ||
| HIS 95 | H-bond | 2.77 | −3.0 | ||
| ARG 68 | Arene-cation | 4.72 | −0.7 |
| Compound ID | M-Weight | HB-Donor | HB-Acceptor | logP |
|---|---|---|---|---|
| ZINC05524764 | 254.25 | 3 | 5 | −1.41 |
| ZINC05828661 | 289.75 | 2 | 4 | 0.13 |
| ZINC05725307 | 259.24 | 3 | 4 | 0.41 |
| Compound ID | 2D Structure | Toxicity |
|---|---|---|
| ZINC05828661 | 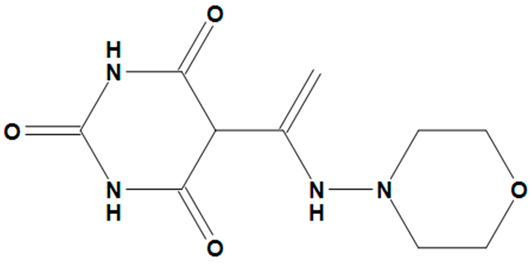 | No |
| ZINC05524764 | 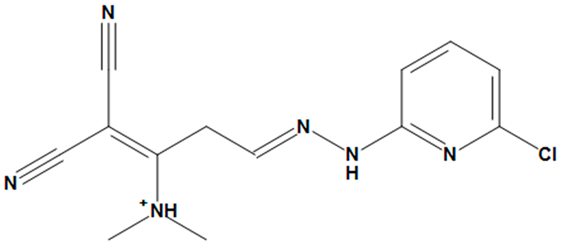 | No |
| ZINC05725307 | 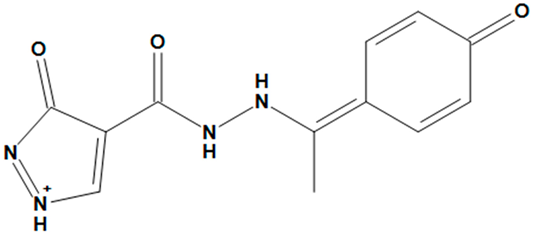 | No |
| Complex | vdW | EEL | ESURF | EGB | ΔG TOTAL |
|---|---|---|---|---|---|
| ZINC05524764-KRASG12D | −48.7803 | −9.8255 | −5.8669 | 25.3835 | −39.0880 |
| ZINC05828661-KRASG12D | −42.7893 | −5.4652 | −4.8129 | 17.8249 | −35.2418 |
| Control-KRASG12D | −26.6921 | −29.9760 | −4.5080 | 30.4723 | −30.7021 |
Disclaimer/Publisher’s Note: The statements, opinions and data contained in all publications are solely those of the individual author(s) and contributor(s) and not of MDPI and/or the editor(s). MDPI and/or the editor(s) disclaim responsibility for any injury to people or property resulting from any ideas, methods, instructions or products referred to in the content. |
© 2024 by the authors. Licensee MDPI, Basel, Switzerland. This article is an open access article distributed under the terms and conditions of the Creative Commons Attribution (CC BY) license (https://creativecommons.org/licenses/by/4.0/).
Share and Cite
Ajmal, A.; Danial, M.; Zulfat, M.; Numan, M.; Zakir, S.; Hayat, C.; Alabbosh, K.F.; Zaki, M.E.A.; Ali, A.; Wei, D. In Silico Prediction of New Inhibitors for Kirsten Rat Sarcoma G12D Cancer Drug Target Using Machine Learning-Based Virtual Screening, Molecular Docking, and Molecular Dynamic Simulation Approaches. Pharmaceuticals 2024, 17, 551. https://doi.org/10.3390/ph17050551
Ajmal A, Danial M, Zulfat M, Numan M, Zakir S, Hayat C, Alabbosh KF, Zaki MEA, Ali A, Wei D. In Silico Prediction of New Inhibitors for Kirsten Rat Sarcoma G12D Cancer Drug Target Using Machine Learning-Based Virtual Screening, Molecular Docking, and Molecular Dynamic Simulation Approaches. Pharmaceuticals. 2024; 17(5):551. https://doi.org/10.3390/ph17050551
Chicago/Turabian StyleAjmal, Amar, Muhammad Danial, Maryam Zulfat, Muhammad Numan, Sidra Zakir, Chandni Hayat, Khulood Fahad Alabbosh, Magdi E. A. Zaki, Arif Ali, and Dongqing Wei. 2024. "In Silico Prediction of New Inhibitors for Kirsten Rat Sarcoma G12D Cancer Drug Target Using Machine Learning-Based Virtual Screening, Molecular Docking, and Molecular Dynamic Simulation Approaches" Pharmaceuticals 17, no. 5: 551. https://doi.org/10.3390/ph17050551