
Peak Resembling N-acetylaspartate (NAA) on Magnetic Resonance Spectroscopy of Brain Metastases
 , , and
Abstract
:1. Introduction
2. Materials and Methods
3. Results
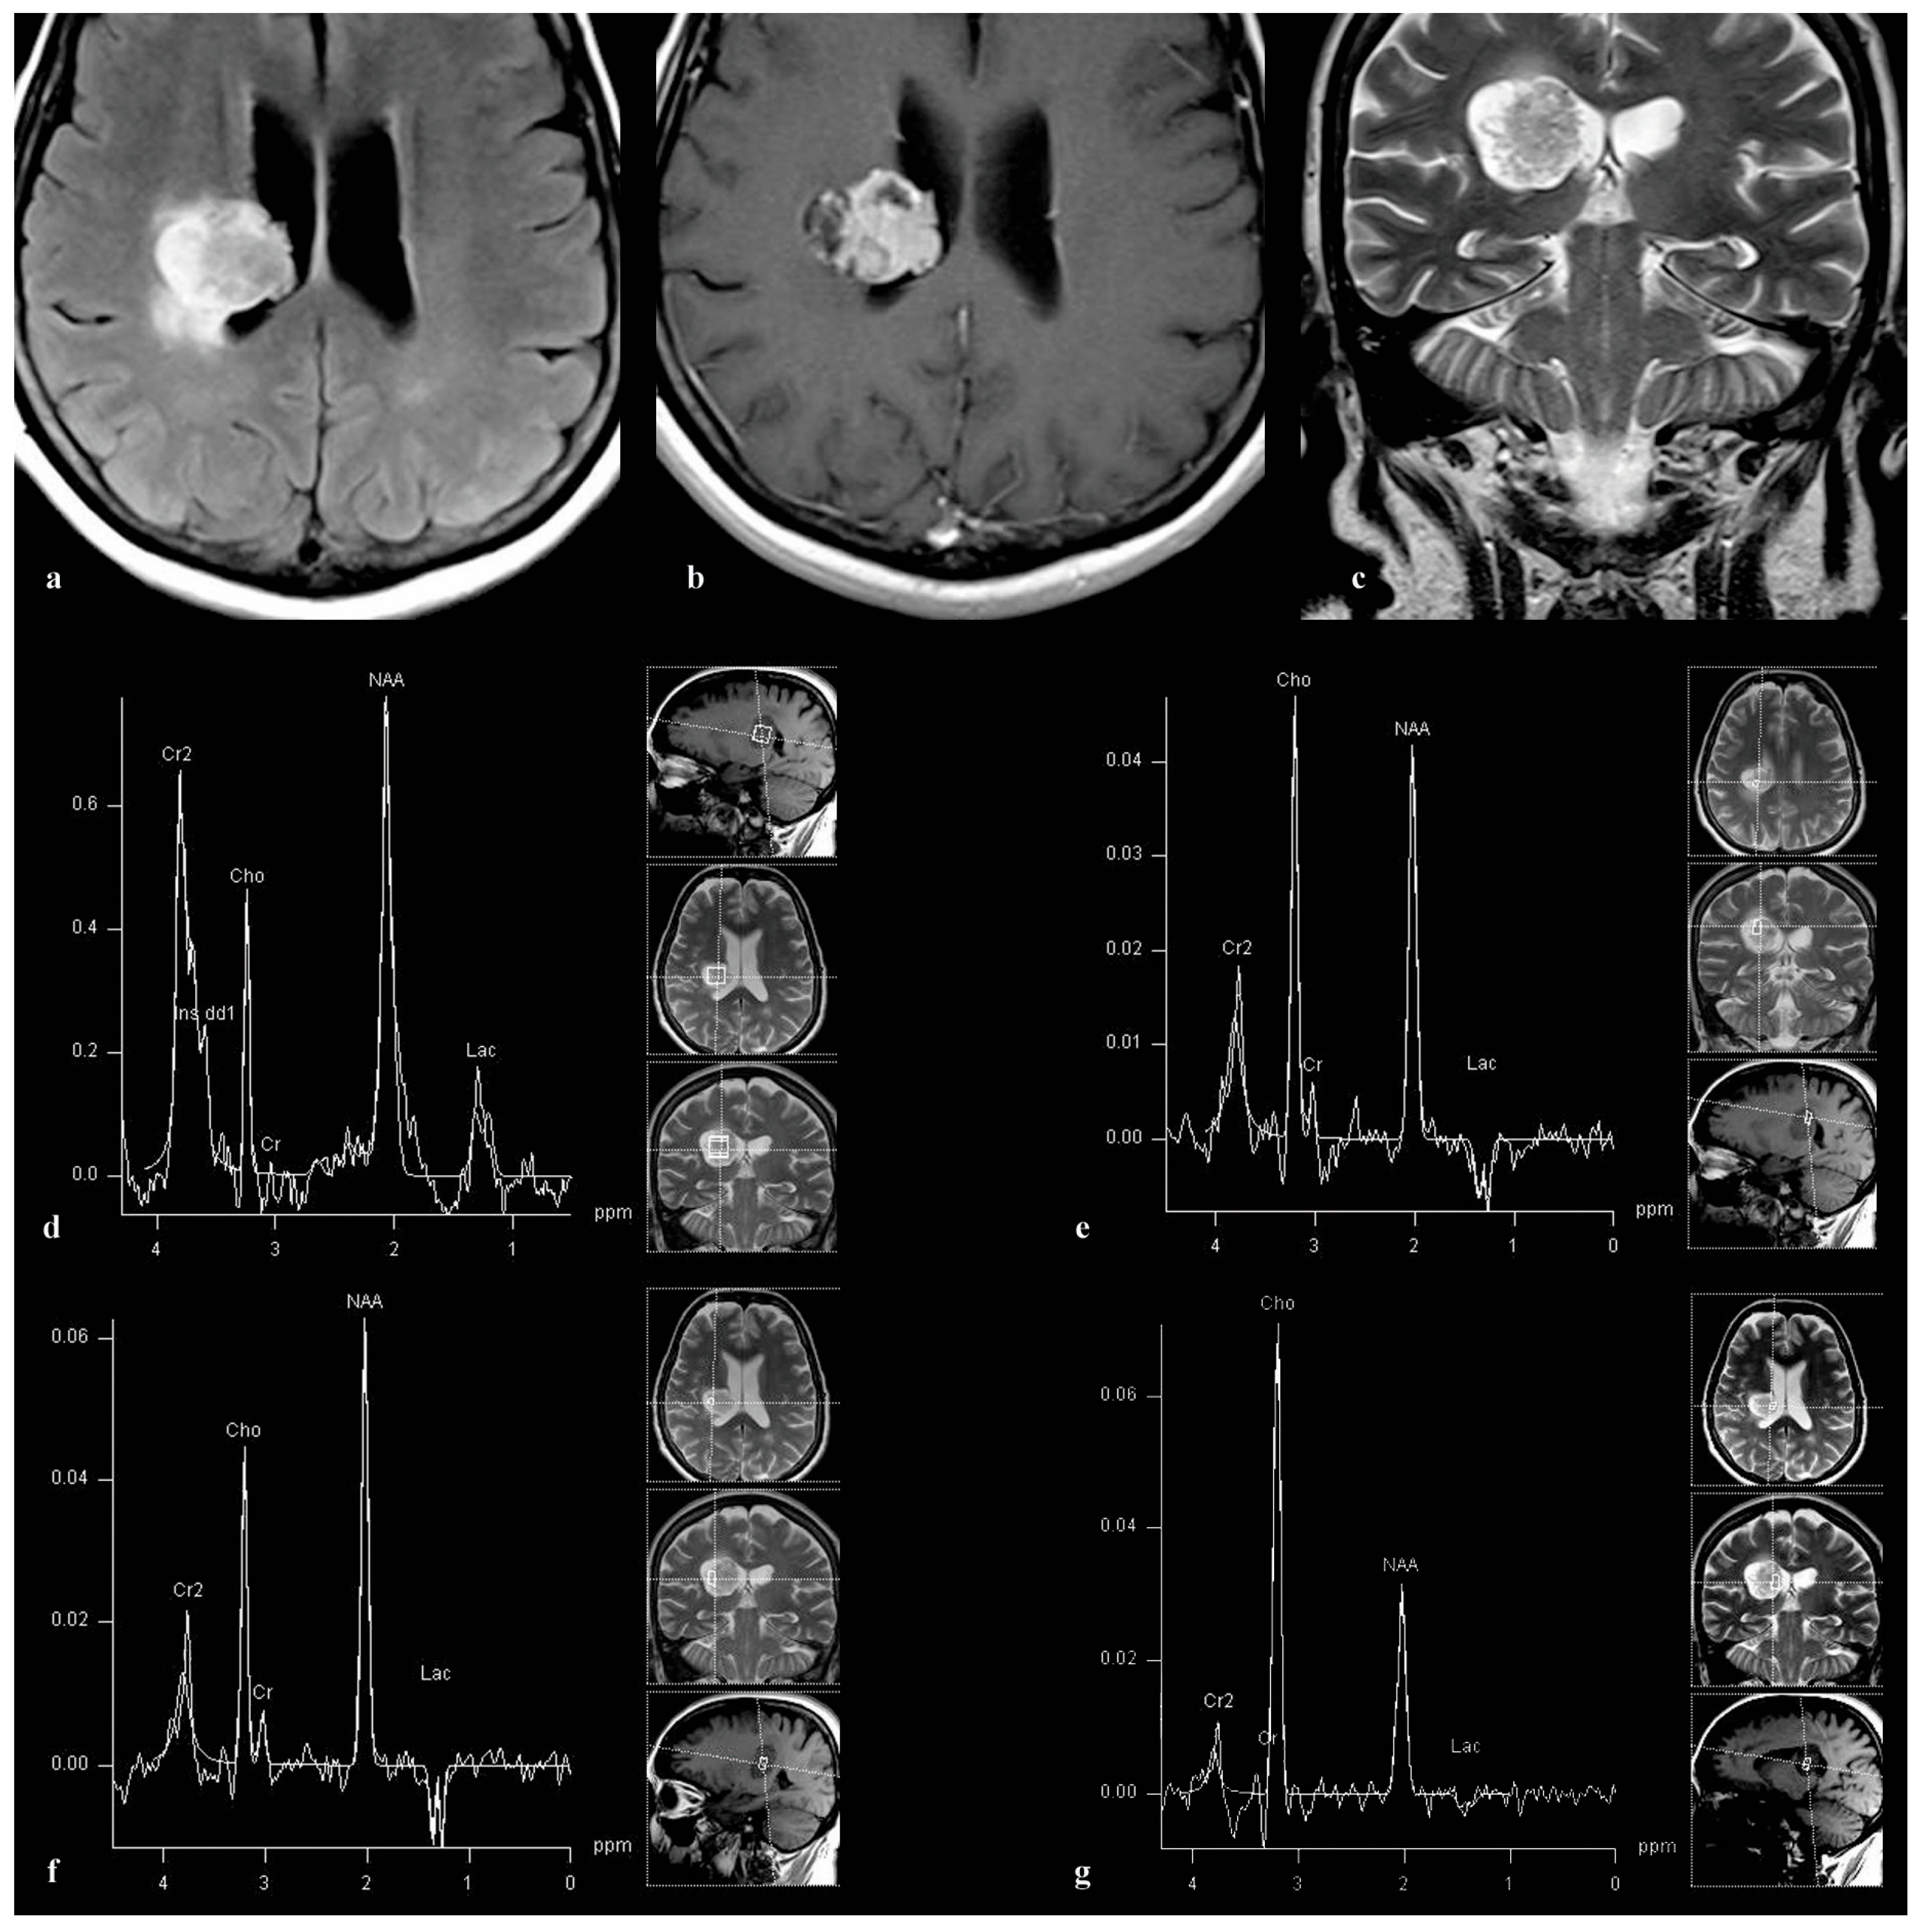
3.1. Patient 1
3.2. Patient 2
3.3. Patient 3
3.4. Patient 4
3.5. Patient 5
4. Discussion
5. Conclusions
Author Contributions
Funding
Institutional Review Board Statement
Informed Consent Statement
Data Availability Statement
Conflicts of Interest
References
- Usinskiene, J.; Ulyte, A.; Bjornerud, A.; Venius, J.; Katsaros, V.K.; Rynkeviciene, R.; Letautiene, S.; Norkus, D.; Suziedelis, K.; Rocka, S.; et al. Optimal differentiation of high- and low-grade glioma and metastasis: A meta-analysis of perfusion, diffusion, and spectroscopy metrics. Neuroradiology 2016, 58, 339–350. [Google Scholar] [CrossRef]
- Brown, R.; Colen, R.; Kessler, R. The Role of Advanced Imaging in Brain Metastases. Neurosurg. Clin. N. Am. 2019, 30, 17–24. [Google Scholar]
- Aslan, K.; Gunbey, H.P.; Tomak, L.; Incesu, L. Multiparametric MRI in differentiating solitary brain metastasis from high-grade glioma: Diagnostic value of the combined use of diffusion-weighted imaging, dynamic susceptibility contrast imaging, and magnetic resonance spectroscopy parameters. Neurol. Neurochir. Pol. 2019, 53, 227–237. [Google Scholar] [CrossRef]
- Ellingson, B.M.; Wen, P.Y.; Cloughesy, T.F. Modified Criteria for Radiographic Response Assessment in Glioblastoma Clinical Trials. Neurotherapeutics 2015, 12, 234–242. [Google Scholar] [CrossRef]
- Weybright, P.; Sundgren, P.C.; Maly, P.; Hassan, D.G.; Nan, B.; Rohrer, S. Differentiation between brain tumor recurrence and radiation injury using MR spectroscopy. Am. J. Roentgenol. 2005, 185, 1471–1476. [Google Scholar] [CrossRef]
- Glunde, K.; Bhujwalla, Z.M. Metabolic tumor imaging using magnetic resonance spectroscopy. Semin. Oncol. 2007, 34, 222–233. [Google Scholar] [CrossRef]
- Podo, F. Tumour phospholipid metabolism. NMR Biomed. 1999, 12, 413–439. [Google Scholar] [CrossRef]
- Aboagye, E.O.; Bhujwalla, Z.M. Malignant transformation alters membrane choline phospholipid metabolism of human mammary epithelial cells. Cancer Res. 1999, 59, 80–84. [Google Scholar]
- Moffett, J.R.; Ross, B.; Arun, P.; Madhavarao, C.N.; Namboodiri, A.M.N. N-acetylaspartate in the CNS: From neurodiagnostics to neurobiology. Prog. Neurobiol. 2007, 81, 89–131. [Google Scholar] [CrossRef]
- Ishimaru, H.; Morikawa, M.; Iwanaga, S.; Kaminogo, M.; Ochi, M.; Hayashi, K. Differentiation between high-grade glioma and metastatic brain tumor using single-voxel proton MR spectroscopy. Eur. Radiol. 2001, 11, 1784–1791. [Google Scholar] [CrossRef]
- Ishimaru, H.; Morikawa, M.; Iwanaga, S.; Ogiwara, T.; Kohmura, E. Detection of intratumoral creatine with proton magnetic resonance spectroscopy in metastatic brain tumors. Neurosurg. Rev. 2003, 26, 275–279. [Google Scholar]
- Delikatny, E.J.; Chawla, S.; Leung, D.J.; Poptani, H. MR-visible lipids and the tumor microenvironment. NMR Biomed. 2011, 24, 592–611. [Google Scholar] [CrossRef]
- Chernov, M.F.; Hayashi, M.; Izawa, M.; Ono, Y.; Hori, T. Proton magnetic resonance spectroscopy (MRS) of metastatic brain tumors: Variations of metabolic profile. Int. J. Clin. Oncol. 2006, 11, 375–384. [Google Scholar] [CrossRef]
- Gasparovic, C.; Song, T.; Devier, D.; Bockholt, H.J.; Caprihan, A.; Mullins, P.G.; Posse, S.; Jung, R.E.; Morrison, L.A. Use of tissue water as a concentration reference for proton spectroscopic imaging. Magn. Reson. Med. 2006, 55, 1219–1226. [Google Scholar] [CrossRef]
- Kinoshita, Y.; Yokota, A. Absolute concentrations of metabolites in human brain tumors using in vitro proton magnetic resonance spectroscopy. NMR Biomed. 1997, 10, 2–12. [Google Scholar] [CrossRef]
- Castillo, M.; Kwock, L.; Mukherji, S.K. Clinical applications of proton MR spectroscopy. AJNR Am. J. Neuroradiol. 1996, 17, 1–15. [Google Scholar]
- Delorme, S.; Weber, M.A. Applications of MRS in the evaluation of focal malignant brain lesions. Cancer Imaging 2006, 6, 95–99. [Google Scholar] [CrossRef]
- Andre, E.; Xu, M.; Yang, D.; Siow, J.K.; Yeo, T.T.; Lim, C.C.T. MR spectroscopy in sinus mucocele: N-acetyl mimics of brain N-acetylaspartate. AJNR Am. J. Neuroradiol. 2006, 27, 2210–2213. [Google Scholar]
- Hascalik, S.; Celik, O.; Sarac, K.; Alkan, A.; Mizrak, B. Clinical significance of N-acetyl-L-aspartate resonance in ovarian mucinous cystadenoma. Int. J. Gynecol. Cancer 2006, 16, 423–426. [Google Scholar] [CrossRef]
- Kolwijck, E.; Engelke, U.F.; van der Graaf, M.; Heerschap, A.; Blom, H.J.; Hadfoune, M.; Buurman, W.A.; Massuger, L.F.; Wevers, R.A. N-acetyl resonances in in vivo and in vitro NMR spectroscopy of cystic ovarian tumors. NMR Biomed. 2009, 22, 1093–1099. [Google Scholar] [CrossRef]
- Ma, F.H.; Qiang, J.W.; Cai, S.Q.; Zhao, S.H.; Zhang, G.F.; Rao, Y.M. MR Spectroscopy for Differentiating Benign from Malignant Solid Adnexal Tumors. AJR Am. J. Roentgenol. 2015, 204, W724–W730. [Google Scholar] [CrossRef]
- Bolan, P.J. Magnetic resonance spectroscopy of the breast: Current status. Magn. Reson. Imaging Clin. N. Am. 2013, 21, 625–639. [Google Scholar] [CrossRef]
- Selnaes, K.M.; Gribbestad, I.S.; Bertilsson, H.; Wright, A.; Angelsen, A.; Heerschap, A.; Tessem, M. Spatially matched in vivo and ex vivo MR metabolic profiles of prostate cancer—Investigation of a correlation with Gleason score. NMR Biomed. 2013, 26, 600–606. [Google Scholar] [CrossRef]
- Stanwell, P.; Russell, P.; Carter, J.; Pather, S.; Heintze, S.; Mountford, C. Evaluation of ovarian tumors by proton magnetic resonance spectroscopy at three Tesla. Investig. Radiol. 2008, 43, 745–751. [Google Scholar] [CrossRef]
- Opstad, K.S.; Griffiths, J.R.; Bell, B.A.; Howe, F.A. Apparent T(2) relaxation times of lipid and macromolecules: A study of high-grade tumor spectra. J. Magn. Reson. Imaging 2008, 27, 178–184. [Google Scholar] [CrossRef]
- Varho, T.; Komu, M.; Sonninen, P.; Holopainen, I.; Nyman, S.; Manner, T.; Sillanpää, M.; Aula, P.; Lundbom, N. A new metabolite contributing to N-acetyl signal in 1H MRS of the brain in Salla disease. Neurology 1999, 52, 1668–1672. [Google Scholar] [CrossRef]
- Liu, X.; Germin, B.I.; Zhong, J.; Ekholm, S.N. N-acetyl peak in MR spectra of intracranial metastatic mucinous adenocarcinomas. Magn. Reson. Imaging 2010, 28, 1390–1394. [Google Scholar] [CrossRef]
- Kim, J.; Choi, H. The mucin protein MUCL1 regulates melanogenesis and melanoma genes in a manner dependent on threonine content. Br. J. Dermatol. 2022, 186, 532–543. [Google Scholar] [CrossRef]
- Chakraborty, S.; Bonthu, N.; Swanson, B.J.; Batra, S.K. Role of mucins in the skin during benign and malignant conditions. Cancer Lett. 2011, 301, 127–141. [Google Scholar] [CrossRef]
- De Vellis, C.; Pietrobono, S.; Stecca, B. The Role of Glycosylation in Melanoma Progression. Cells 2021, 10, 2136. [Google Scholar] [CrossRef]
- Teoh, S.T.; Ogrodzinski, M.P.; Ross, C.; Hunter, K.W.; Lunt, S.Y. Sialic Acid Metabolism: A Key Player in Breast Cancer Metastasis Revealed by Metabolomics. Front. Oncol. 2018, 8, 174. [Google Scholar] [CrossRef] [PubMed]
- Sun, H.; Zhou, Y.; Jiang, H.; Xu, Y. Elucidation of Functional Roles of Sialic Acids in Cancer Migration. Front. Oncol. 2020, 10, 401. [Google Scholar] [CrossRef] [PubMed]
- Schneider, F.; Kemmner, W.; Haensch, W.; Franke, G.; Gretschel, S.; Karsten, U.; Schlag, P.M. Overexpression of sialyltransferase CMP-sialic acid: Galbeta1,3GalNAc-R alpha6-Sialyltransferase is related to poor patient survival in human colorectal carcinomas. Cancer Res. 2001, 61, 4605–4611. [Google Scholar] [PubMed]
- Varki, A.; Kannagi, R.; Toole, B.P. Glycosylation changes in cancer. In Essentials of Glycobiology, 2nd ed.; Varki, A., Cummings, R.D., Esko, J.D., Freeze, H.H., Stanley, P., Bertozzi, C.R., Hart, G.W., Etzler, M.E., Eds.; Cold Spring Harbor Laboratory Press: Cold Spring Harbor, NY, USA, 2009; Chapter 44; pp. 154–196. [Google Scholar]
- Pouwels, P.J.; Frahm, J. Differential distribution of NAA and NAAG in human brain as determined by quantitative localized proton MRS. NMR Biomed. 1997, 10, 73–78. [Google Scholar] [CrossRef]
- Baslow, M.H.; Guilfoyle, D.N. Using proton magnetic resonance imaging and spectroscopy to understand brain “activation”. Brain Lang. 2007, 102, 153–164. [Google Scholar] [CrossRef]
- Fong, M.Y.; McDunn, J.; Kakar, S.S. Identification of metabolites in the normal ovary and their transformation in primary and metastatic ovarian cancer. PLoS ONE 2011, 6, e19963. [Google Scholar] [CrossRef] [PubMed]
- Nguyen, T.; Kirsch, B.J.; Asaka, R.; Nabi, K.; Quinones, A.; Tan, J.; Antonio, M.J.; Camelo, F.; Li, T.; Nguyen, S.; et al. Uncovering the role of N-acetyl-aspartyl-glutamate as a glutamate reservoir in cancer. Cell Rep. 2019, 27, 491–501. [Google Scholar] [CrossRef]
- Asaka, R.; Le, A. Dual role of N-acetyl-aspartyl-glutamate metabolism in cancer monitor and therapy. Mol. Cell. Oncol. 2019, 6, e1627273. [Google Scholar] [CrossRef]


| Origin of Carcinomas | Numbers | Median Age | Female/Male |
|---|---|---|---|
| Lung | 18 | 60.5 (42–79) | 8/10 |
| Breast | 12 | 57 (43–71) | 12/0 |
| Colorectal | 9 | 60.5 (49–72) | 4/5 |
| Melanoma | 7 | 63 (49–77) | 2/5 |
| Prostate | 2 | 73 (72–74) | 0/2 |
| Kidney | 1 | 67 | 0/1 |
| Total cohort | 49 |
Disclaimer/Publisher’s Note: The statements, opinions and data contained in all publications are solely those of the individual author(s) and contributor(s) and not of MDPI and/or the editor(s). MDPI and/or the editor(s) disclaim responsibility for any injury to people or property resulting from any ideas, methods, instructions or products referred to in the content. |
© 2024 by the authors. Licensee MDPI, Basel, Switzerland. This article is an open access article distributed under the terms and conditions of the Creative Commons Attribution (CC BY) license (https://creativecommons.org/licenses/by/4.0/).
Share and Cite
Ostojic, J.; Kozic, D.; Panjkovic, M.; Georgievski-Brkic, B.; Dragicevic, D.; Lovrenski, A.; Boban, J. Peak Resembling N-acetylaspartate (NAA) on Magnetic Resonance Spectroscopy of Brain Metastases. Medicina 2024, 60, 662. https://doi.org/10.3390/medicina60040662
Ostojic J, Kozic D, Panjkovic M, Georgievski-Brkic B, Dragicevic D, Lovrenski A, Boban J. Peak Resembling N-acetylaspartate (NAA) on Magnetic Resonance Spectroscopy of Brain Metastases. Medicina. 2024; 60(4):662. https://doi.org/10.3390/medicina60040662
Chicago/Turabian StyleOstojic, Jelena, Dusko Kozic, Milana Panjkovic, Biljana Georgievski-Brkic, Dusan Dragicevic, Aleksandra Lovrenski, and Jasmina Boban. 2024. "Peak Resembling N-acetylaspartate (NAA) on Magnetic Resonance Spectroscopy of Brain Metastases" Medicina 60, no. 4: 662. https://doi.org/10.3390/medicina60040662