2.2. NMR Spectrum Analysis of Asc-Treated MCF7 Cells
A strong signal of Cit was visible in 1D NMR spectra at exactly 6 h after the onset of treatment. The Cit level increased between 6 h and 24 h. Other obvious metabolite variations involved increase of alanine (Ala, methyl signal at 1.47 ppm) and phosphoethanolamine (PE, methylene signal at 4.00 ppm). Between 24 h and 48 h, spectra of treated cells were completely upset, testifying the execution of apoptosis. At 48 h, most small metabolite signals had disappeared from spectra only leaving macromolecular and lipid signals, of which that of phosphatidylcholine (PtC) (
Figure 2A).
Analysis of the 3.50 × 4.20 ppm spectral domain of the Asc-treated group showed unusual signals at 4.12, 4.02, 3.83, 3.82, 3.76 and 3.66 ppm in 1D NMR spectra. Furthermore, 2D NMR spectra revealed strong correlations at 4.02 × 4.12 ppm, 3.76 × 4.12 ppm, 3.76 × 4.02 ppm, 3.66 × 3.76 ppm, and 3.83 × 3.66 ppm. A less intense correlation was observed at 3.66 × 4.02 ppm. The interrogation of the
BMRB (
www.bmrb.wisc.edu [
10]) and
HMDB (
www.hmdb.ca [
11]) spectral databases revealed that the unknown signals corresponded to gluconate (Gna) [
12] (
Figure 2B).
To get some more information on the transition to apoptosis, the culture medium was analyzed using the same NMR sequences. At 48 h, it revealed, in the Asc-treated group, decreased lactate (Lac) level, providing evidence of downregulation of glycolysis, together with pyruvate consumption from the medium and increased acetate (Ace) release by the cells, testifying mitochondrial deficiency (
Figure 2C).
Figure 2.
Global metabolic response of MCF7 breast cancer cells to Asc. (
A) Typical 1D
1H-NMR spectra of untreated (left) and Asc-treated (right) intact MCF7 breast cancer cells at 6 h, 24 h and 48 h. Several metabolite signals are shown. For abbreviations, see
Table 1. W, residual water signal; (
B) Gluconic acid (Gna) NMR signals. Left, typical 2D TOCSY spectrum selection in the 3.55–4.20 ppm × 3.55–4.20 ppm area, with the corresponding 1D NMR spectrum above, in the Asc-treated group; Right, 2D TOCSY spectrum of Gna pure standard (
www.bmrb.wisc.edu [
10]). Arrowheads, correlation signals characterizing Gna; (
C) Typical 1D
1H-NMR spectra of the culture medium of untreated (left) and Asc-treated (right) MCF7 breast cancer cells at 48 h. Several metabolite signals are shown. For abbreviations, see
Table 1. Pyr, pyruvate; DMSO, dimethylsulfoxide.
Table 1.
Identified and quantified metabolites. Metabolites were arranged into five subsets: –: Glycolysis/TCA cycle/lipid metabolism derivatives (Glc, Lac, Ace, Cit, PUF, MyI, and Gna), –: Glutamate (Glu) derivatives (Glu, Gln, Pro, Ala, NAA, Asn, Asp, and Arg), –: Methionine (Met) and transsulfuration derivatives (Met, Ply, Hcy, tCr, GSx, hTa, and Tau), –: Other amino acids (Gly, Lys, Phe, and Thr), –: and Phospholipid metabolism derivatives (PE, GPE, Cho, PC, CDPC, PtC, and GPC). In the description of chemical shifts, a single chemical shift indicates a 1D-based measurement, and a combination of chemical shifts a 2D-based measurement. ×, correlation between two chemical shifts; &, correlations used for quantification.
| Metabolite subset | Abbreviation | Metabolite | Chemical shifts (ppm) in 1D and 2D NMR spectra |
|---|
| Glycolysis/TCA cycle/lipid metabolism | Glc | β-glucose | 3.25 × 4.65 & 3.49 × 4.65 |
| | Lac | Lactate | 1.34 × 4.11 |
| | Ace | Acetate | 1.92 |
| | PUF | Polyunsaturated fatty acids | 2.79 × 5.33 |
| | Cit | Citrate | 2.55 × 2.75 |
| | MyI | Myoinositol | 3.54 × 3.48 & 3.61 × 3.48 |
| | Gna | Gluconate | 3.83 × 4.12 & 4.02 × 4.12 |
| Glutamate | Glu | Glutamate | 2.06 × 3.76 |
| | Gln | Glutamine | 2.12 × 2.46 |
| | Pro | Proline | 2.03 × 4.15 |
| | Ala | Alanine | 1.47 × 3.77 |
| | Asn | Asparagine | 2.88 × 3.99 & 2.95 × 3.99 |
| | Asp | Aspartate | 2.70 × 3.89 & 2.95 × 3.89 |
| | NAA | N-acetyl-aspartate | 2.50 × 4.40 & 2.70 × 4.40 |
| | Arg | Arginine | 1.68 × 3.23 & 1.92 × 3.23 |
| Methionine and transsulfuration | Met | Methionine | 2.14 × 2.63 & 2.20 × 2.63 |
| | Ply | Polyamines | 1.80 × 3.10 & 2.13 × 3.10 |
| | Hcy | Homocysteine | 2.17 × 2.72 |
| | tCr | Total creatine | 3.03 |
| | GSx | Total glutathione | 2.17 × 2.55 & 2.55 × 4.56 |
| | hTa | Hypotaurine | 2.63 × 3.35 |
| | Tau | Taurine | 3.27 × 3.43 |
| Other amino acids | Gly | Glycine | 3.56 |
| | Lys | Lysine | 1.90 × 3.77 |
| | Phe | Phenylalanine | 3.13 × 3.99 |
| | Thr | Threonine | 1.32 × 3.58 |
| Phospholipid metabolism | PE | Phosphoethanolamine | 3.22 × 3.99 |
| | GPE | Glycerophosphoethanolamine | 3.30 × 4.12 |
| | Cho | Choline | 3.55 × 4.07 |
| | PC | Phosphocholine | 3.62 × 4.18 |
| | CDPC | Cytidine diphosphate choline | 3.66 × 4.42 |
| | PtC | Phosphatidylcholine | 3.26 |
| | GPC | Glycerophosphocholine | 3.66 × 4.34 |
Figure 3.
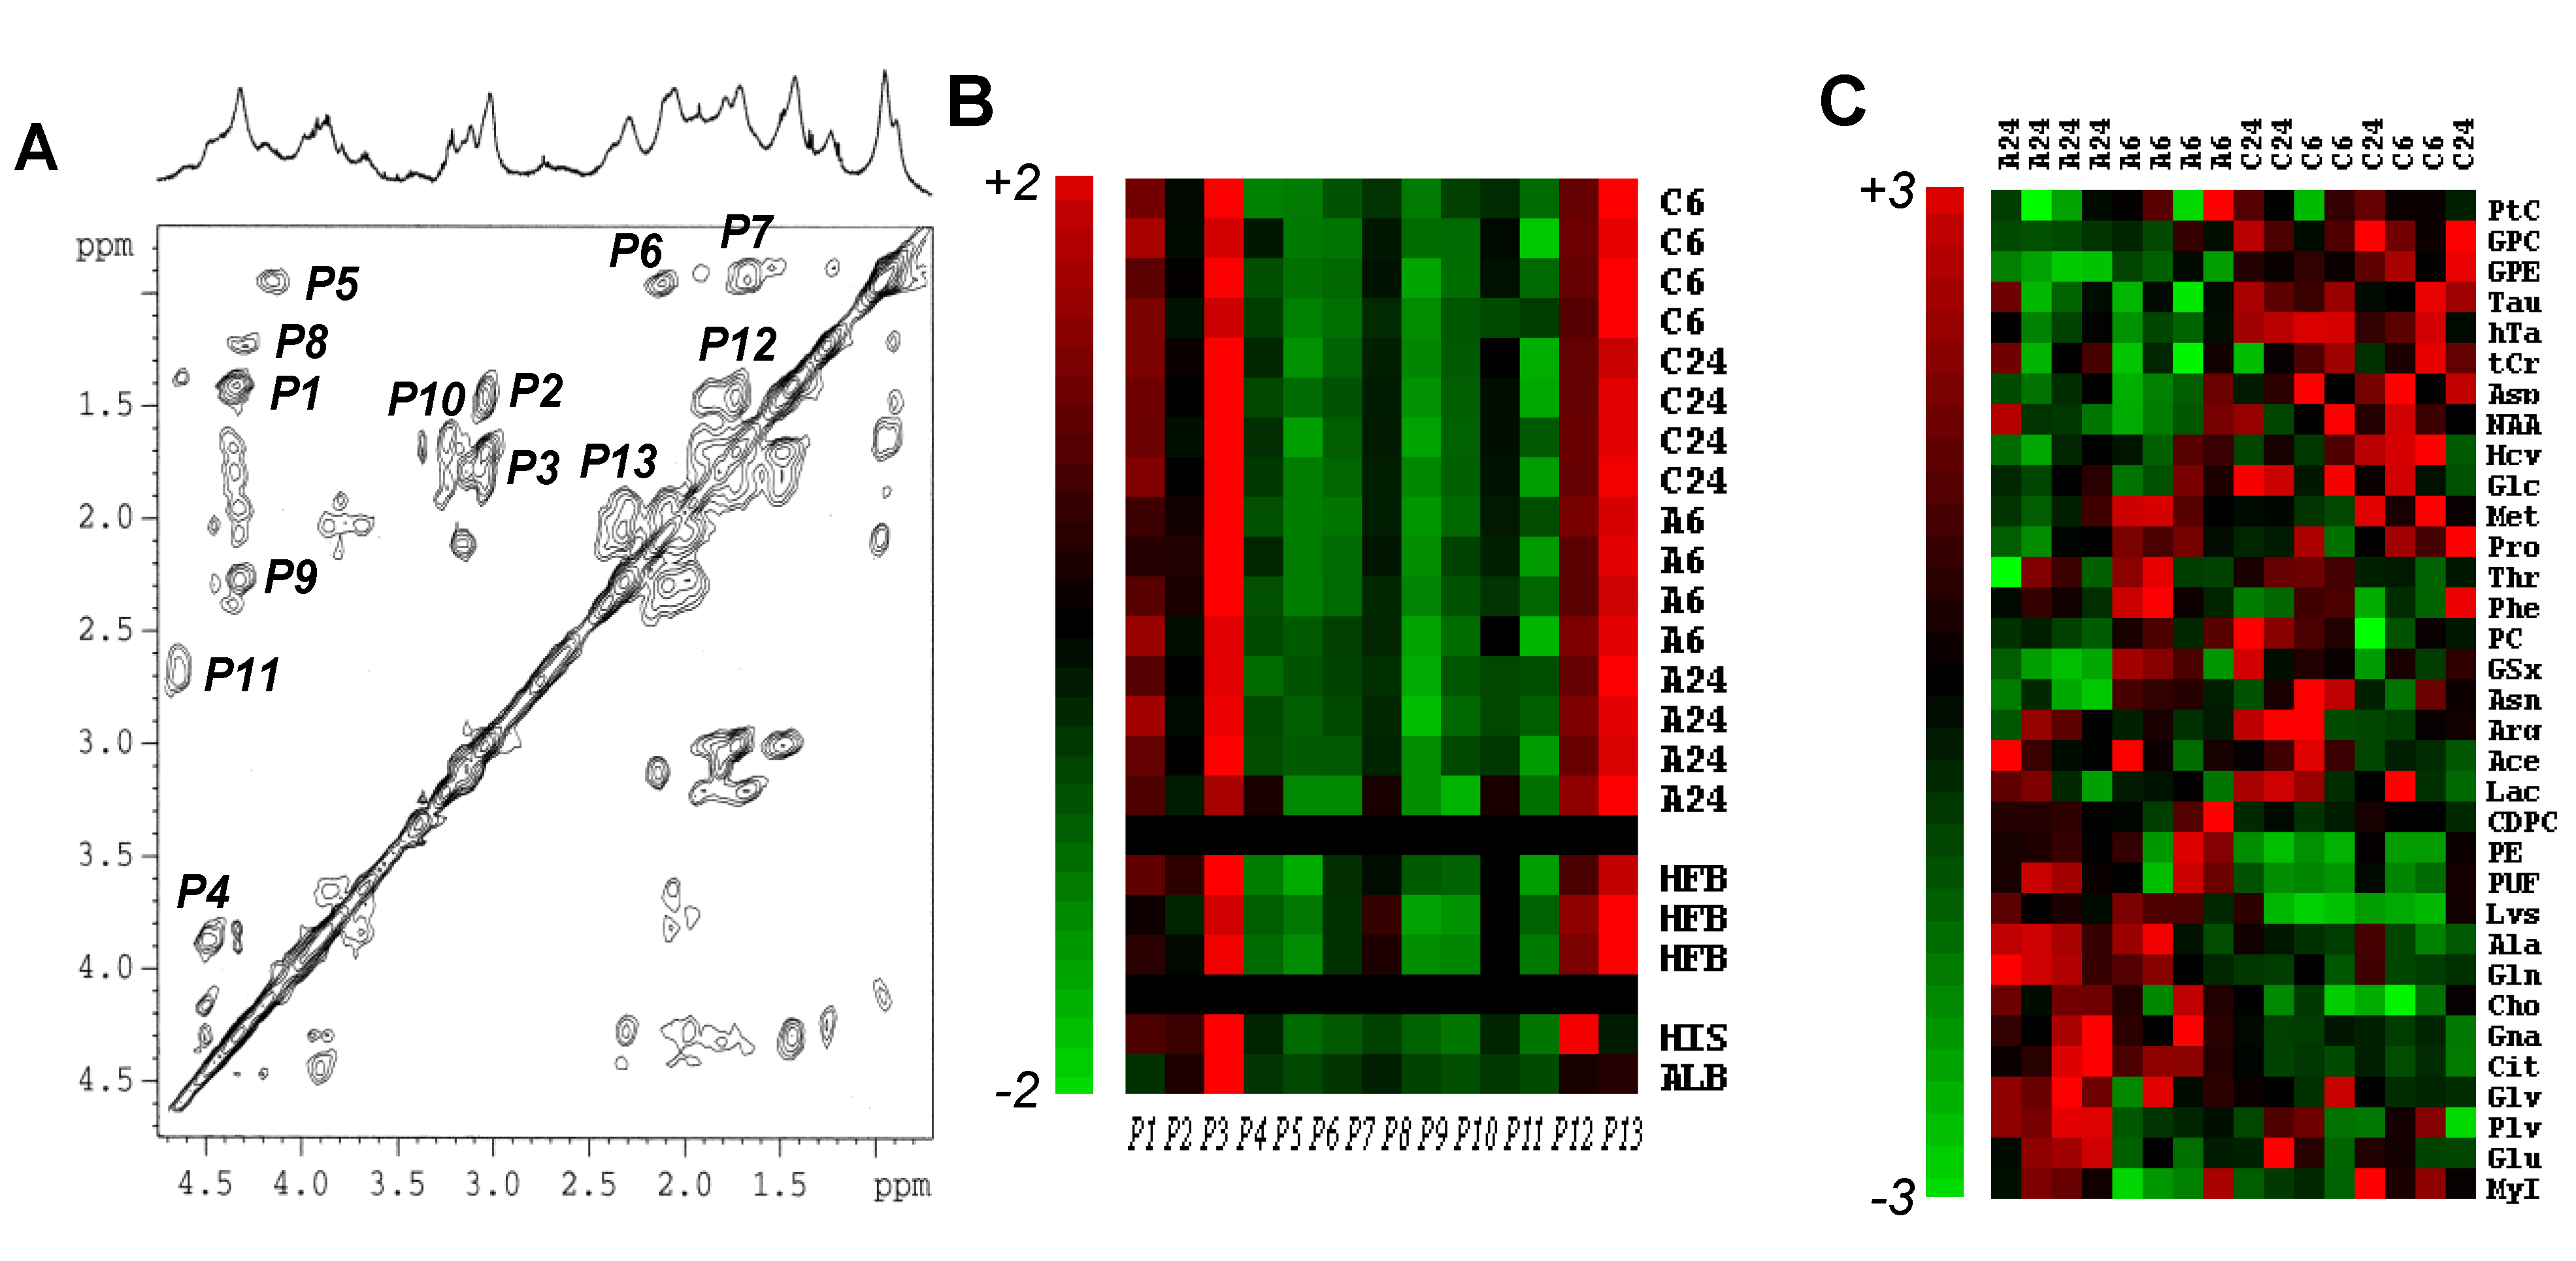
NMR-based proteomics and metabolomics of MCF7 breast cancer cell response to Asc. (
A) Typical 2D TOCSY spectrum of a protein extract of MCF7 cells, with its corresponding 1D NMR spectrum above. The attributed signals were numbered from
P1 to
P13, as follows:
P1, alanyl β–α;
P2, lysyl γ–ε;
P3, lysyl δ–ε;
P4, seryl β–α;
P5, leucyl δ–α;
P6, valyl γ–β and γ’–β;
P7, leucyl δ–β and δ–γ;
P8, threonyl γ–β and γ–α;
P9, glutamyl γ–α;
P10, arginyl β–δ and γ–δ;
P11, aspartyl β–α;
P12, lysyl γ–δ;
P13, glutamyl β–γ; (
B) Color display of CPV measurements from protein extracts. Signals
P1 to
P13 were measured in 2D NMR spectra MCF7 cell protein extracts in
n = 8 untreated (C6 and C24 hold for untreated control at 6 h and 24 h, respectively) and
n = 8 Asc-treated (A6 and A24 hold for Asc-treated at 6 h and 24 h, respectively) MCF7 cells. Each individual measurement set was autoscaled. For comparison are shown data from protein extracts of human fibroblasts (HFB,
n = 3), and commercially available calf thymus histone type IIa (HIS) and bovine serum albumin (ALB). Red, variations above mean up to mean + 2 × SD; Green, variations below mean down to mean − 2 × SD; (
C) Hierarchical clustering of metabolic data. Hierarchical clustering of the whole set of individuals (
n = 8 untreated
vs. n = 8 Asc-treated MCF7 cell pellets) and metabolites (
n = 33) showing clear separation between groups, and quite well-defined metabolite variations. A6 and A24, Asc-treated MCF7 cell independent samples at 6 h and 24 h; C6 and C24, untreated MCF7 cell independent samples at 6 h and 24 h. For metabolite abbreviations, see
Table 1. Red, metabolite variations above average up to +3 × SD; Green, metabolite variations below average down to −3 × SD.
Figure 3.
NMR-based proteomics and metabolomics of MCF7 breast cancer cell response to Asc. (
A) Typical 2D TOCSY spectrum of a protein extract of MCF7 cells, with its corresponding 1D NMR spectrum above. The attributed signals were numbered from
P1 to
P13, as follows:
P1, alanyl β–α;
P2, lysyl γ–ε;
P3, lysyl δ–ε;
P4, seryl β–α;
P5, leucyl δ–α;
P6, valyl γ–β and γ’–β;
P7, leucyl δ–β and δ–γ;
P8, threonyl γ–β and γ–α;
P9, glutamyl γ–α;
P10, arginyl β–δ and γ–δ;
P11, aspartyl β–α;
P12, lysyl γ–δ;
P13, glutamyl β–γ; (
B) Color display of CPV measurements from protein extracts. Signals
P1 to
P13 were measured in 2D NMR spectra MCF7 cell protein extracts in
n = 8 untreated (C6 and C24 hold for untreated control at 6 h and 24 h, respectively) and
n = 8 Asc-treated (A6 and A24 hold for Asc-treated at 6 h and 24 h, respectively) MCF7 cells. Each individual measurement set was autoscaled. For comparison are shown data from protein extracts of human fibroblasts (HFB,
n = 3), and commercially available calf thymus histone type IIa (HIS) and bovine serum albumin (ALB). Red, variations above mean up to mean + 2 × SD; Green, variations below mean down to mean − 2 × SD; (
C) Hierarchical clustering of metabolic data. Hierarchical clustering of the whole set of individuals (
n = 8 untreated
vs. n = 8 Asc-treated MCF7 cell pellets) and metabolites (
n = 33) showing clear separation between groups, and quite well-defined metabolite variations. A6 and A24, Asc-treated MCF7 cell independent samples at 6 h and 24 h; C6 and C24, untreated MCF7 cell independent samples at 6 h and 24 h. For metabolite abbreviations, see
Table 1. Red, metabolite variations above average up to +3 × SD; Green, metabolite variations below average down to −3 × SD.
![Marinedrugs 11 03846 g003]()
2.3. Metabolomics of Asc-Treated MCF7 Cells
As a preliminary step of the metabolomics method, which requires protein NMR signal identification, 13 2D NMR signals of proteins were assigned in
1H-NMR spectra of protein extracts of MCF7 breast cancer cells, untreated or exposed to Asc (
Figure 3A). They were quantified using their cross-peak volume (CPV), and autoscaled. Only a small, not statistically significant, difference (6% of average protein signal) was found between 2D NMR spectroscopy protein signals of the untreated and Asc-treated groups. For comparison, the same calculations were performed on 2D NMR spectra of human fibroblast protein extracts (
n = 3) and commercially-available histones and albumin. Treatment with Asc did not altered protein content, which established the full applicability of the used metabolomics method [
6]. Also, the protein composition of human fibroblasts varied lowly in comparison with that of MCF7 breast cancer cells. Only pure protein standards differed in amino-acid composition (
Figure 3B).
Identified and quantified metabolites were gathered into five metabolite subsets (
Table 1): glycolysis/TCA cycle/lipid metabolism derivatives (Glc, Lac, Ace, PUF, Cit, MyI, Gna), Glu derivatives (Glu, Gln, Pro, Ala, Asn, Asp, NAA, Arg), Met and transsulfuration derivatives (Met, Ply Hcy, tCr, GSx, hTa, Tau), other amino acids (Gly, Lys, Phe, Thr), and phospholipid metabolism derivatives (PE, GPE, Cho, PC, CDPC, PtC, GPC).
As an unsupervised multivariate statistical description of metabolite alterations induced by Asc, we used hierarchical clustering of the whole set of data (
Figure 3C). The analysis discriminated the response to Asc. Metabolites accumulating in response to Asc were Cit, Gna, and phospholipid derivatives (Cho, CDPC, PE), while decreasing metabolites were other phospholipid derivatives (GPE, GPC, PtC) and transulfuration pathway derivatives (Hcy, hTa, Tau).
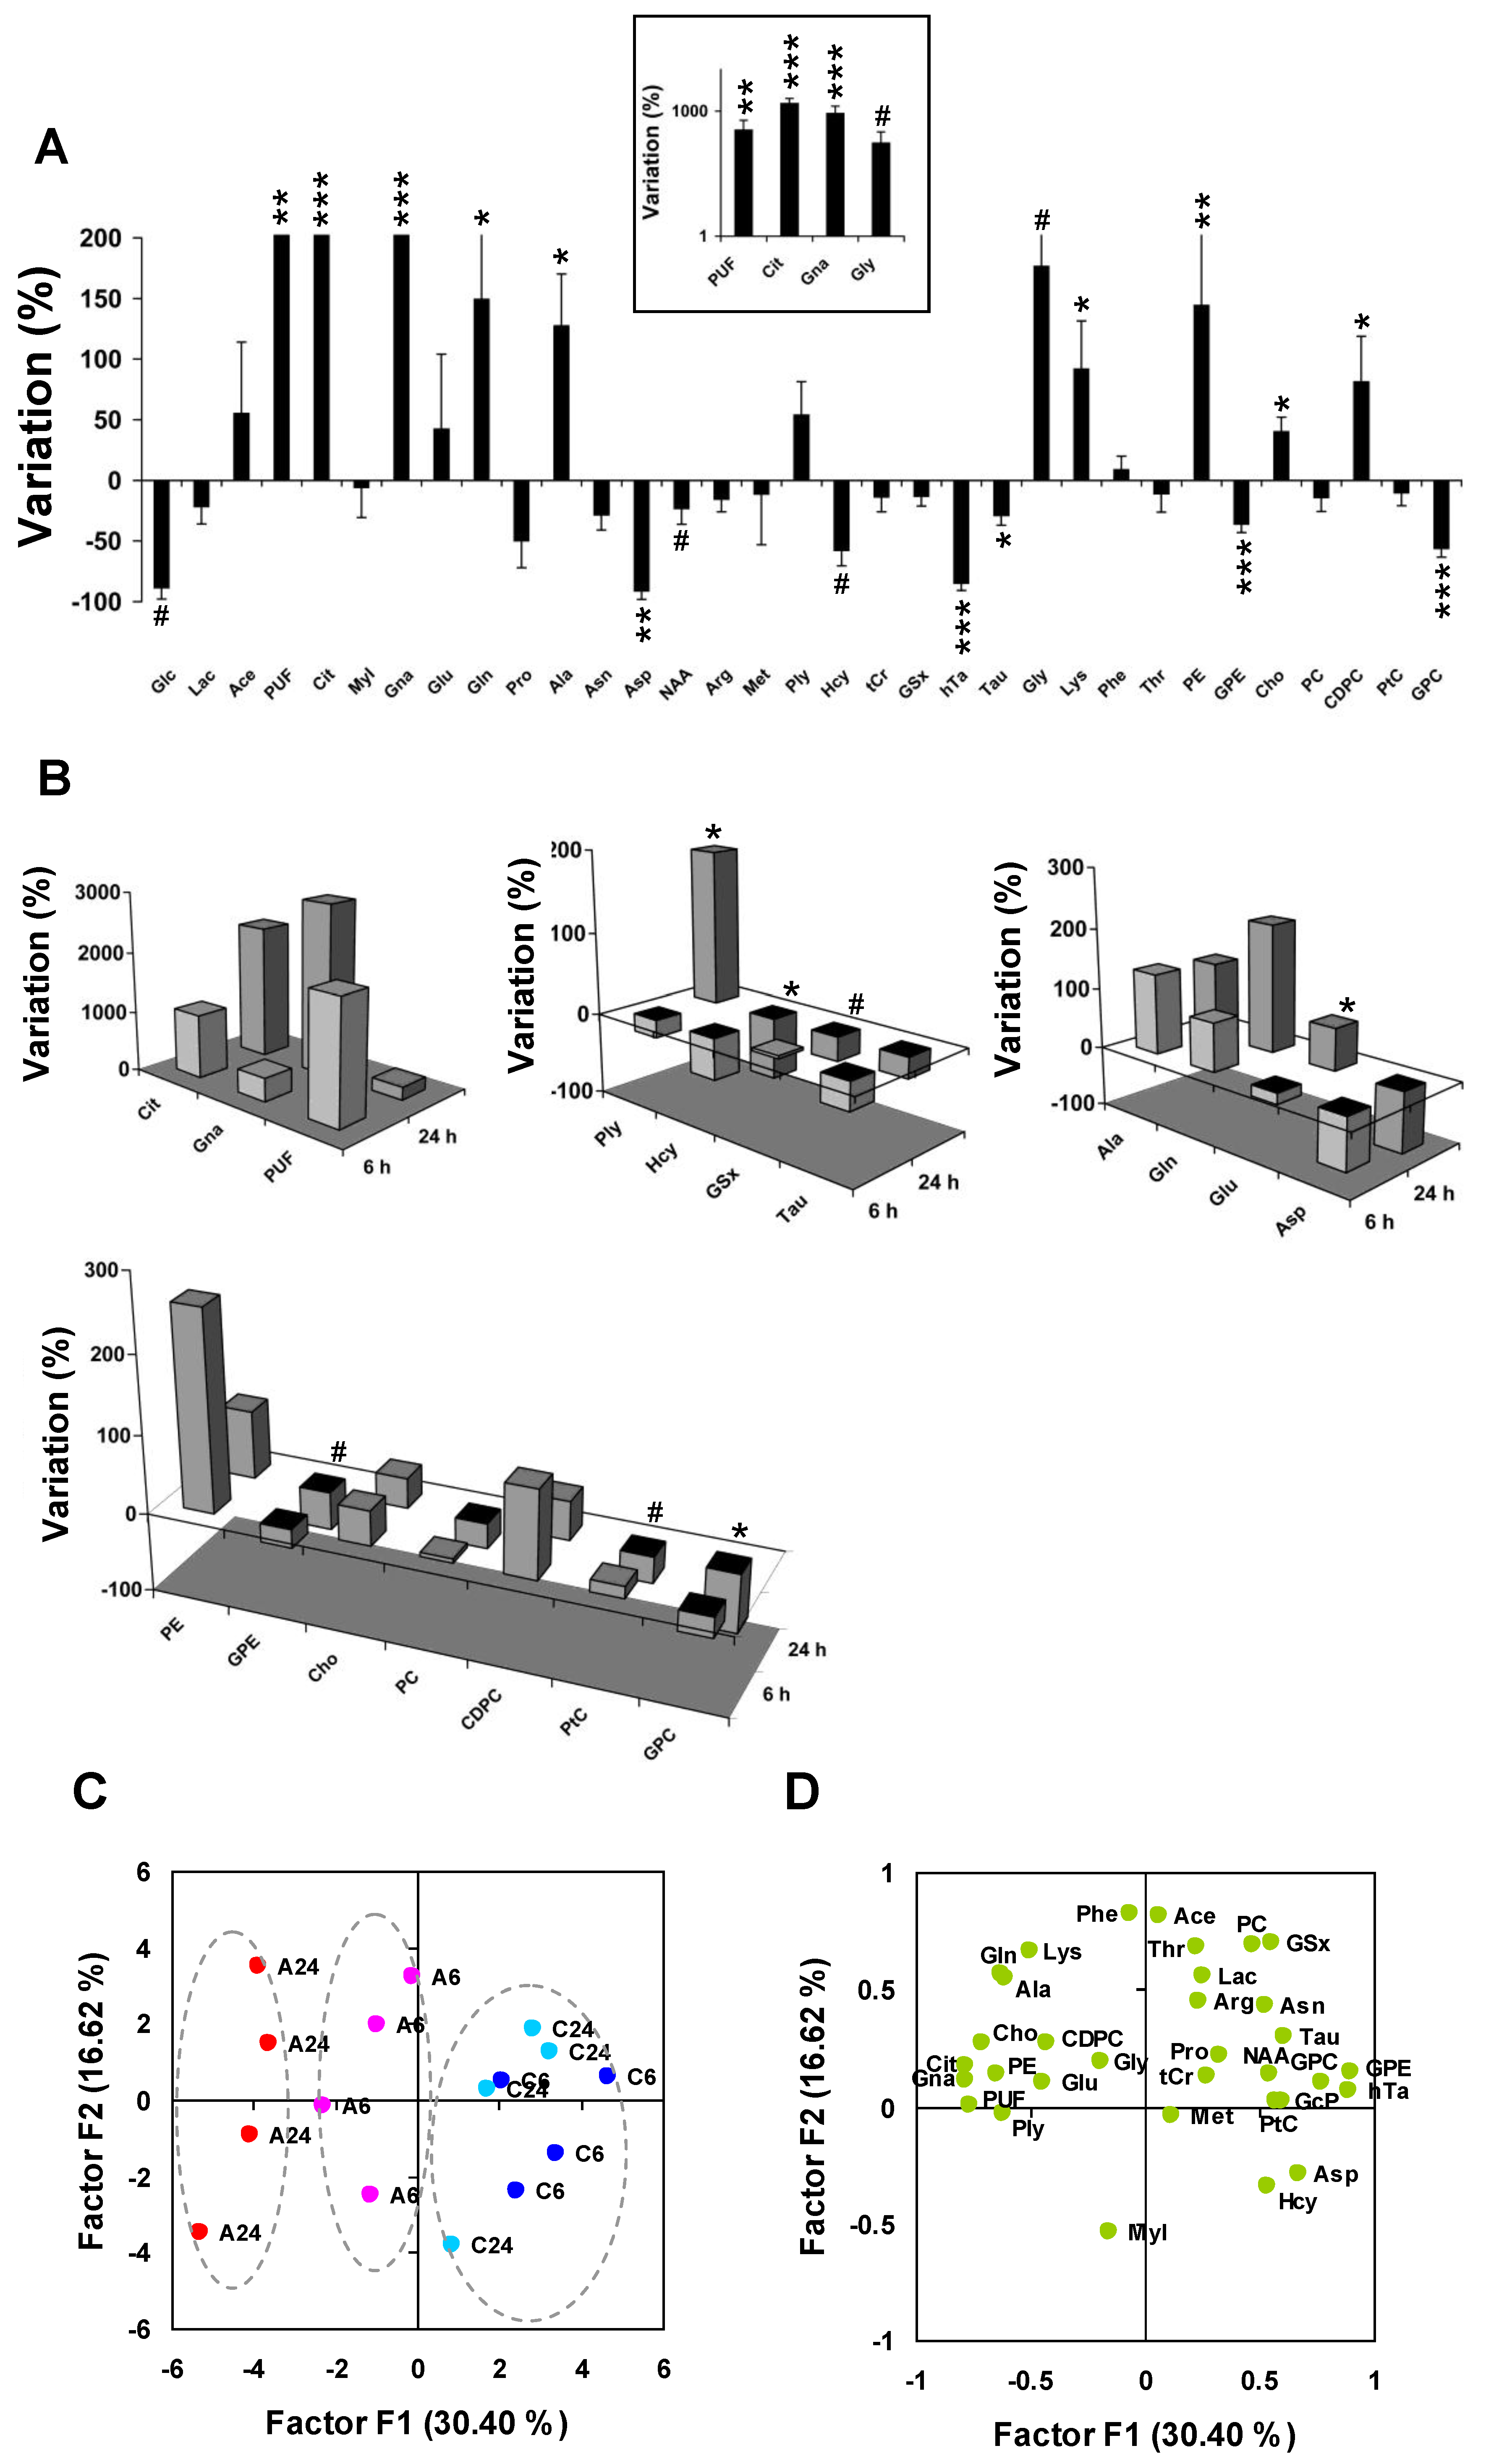
Then, we calculated average metabolite variations in response to Asc. The largest three changes corresponded to the accumulation of PUF (×4.6,
P < 0.01,
n = 8 untreated
vs. n = 8 Asc-treated cell pellets), Cit (×16.8,
P < 0.001), and Gna (×10.2,
P < 0.001) (
Figure 4A). Glycolysis alterations were observed with decrease of Glc (−75% ± 22%,
P < 0.05, one-tailed test), and moderate decrease of Lac (−21% ± 14%). Significant alterations occurred in the Glu derivative group with increase of Gln (+150% ± 56%,
P < 0.05) and Ala (+128% ± 42%,
P < 0.05), and severe decrease of Asp (−92% ± 7%,
P < 0.01). The Met derivative subset was strongly altered with decrease of Hcy (−58% ± 12%,
P < 0.05, one-tailed test), hTa (−85% ± 6%,
P < 0.001), and Tau (−29% ± 8%,
P < 0.05), and moderate decrease of GSx (−13% ± 8%). The phospholipid metabolism subset was strongly modified with increase of PE (+145% ± 59%,
P < 0.01), Cho (+41% ± 11%,
P < 0.01) and CDPC (+82% ± 37%,
P < 0.05), decrease of GPE (−36% ± 6%,
P < 0.001) and GPC (−57% ± 7%,
P < 0.001), and mild variation of PtC (−11% ± 10%).
Despite the limited number of samples at 6 h and 24 h, we sought for time-varying response to Asc. Cit and Gna increased between 6 and 24 h, and PUF decreased, but these variations did not reach statistical significance (
Figure 4B). However, significant variations were observed for other metabolites between 6 and 24 h: Ply (+211%,
P < 0.05,
n = 4 at 6 h
vs. n = 4 at 24 h, in the Asc-treated group), Met (−132%,
P < 0.05, one-tailed test), Glu (+87%,
P < 0.05), GSx (−32%,
P < 0.05, one-tailed test), Hcy (−25%,
P < 0.01), Pro (−87%,
P < 0.01), Asn (−22%,
P < 0.05), GPE (−25%,
P < 0.05, one-tailed test), PtC (−48%,
P < 0.05, one-tailed test), and GPC (−49%,
P < 0.05).
Figure 4.
Differential metabolite profiling and principal component analysis. (
A) Differential quantitative metabolite profiling of the early response to Asc (
n = 8 Asc-treated
vs. n = 8 untreated MCF7 cell pellets). Inset: log scale for the four metabolites with the largest variations. Abbreviations, see
Table 1.
* P < 0.05;
** P < 0.01;
*** P < 0.001 (two-tailed Mann-Withney test);
# P < 0.05 (one-tailed test); (
B) Comparison between 6 h and 24 h shown as three-dimensional histogram plots using average variations between
n = 4 Asc-treated and
n = 4 untreated at 6 h and 24 h, respectively. From left to right, and top to bottom: Metabolites from the glycolysis/TCA cycle/lipid metabolism derivative subset, Met and transsulfuration derivatives, Glu derivatives, and phospholipid metabolism derivatives. At 6 h, most biochemical processes associated to oxidative stress and cellular defense were initiated.
* P < 0.05;
# P < 0.05 (one-tailed test); (
C,
D) Principal component analysis of metabolic data; (
C) The individual plot shows that the main axis (F1) separates samples responding to Asc (left; 24 h, red; 6 h, purple), from control samples (right, 24 h, light blue; 6 h, dark blue); (
D) The loading plot shows correlation of metabolites with the main axes. C6 and C24, untreated at 6 h and 24 h; A6 and A24, Asc-treated at 6 h and 24 h. For metabolite abbreviations, see
Table 1.
![Marinedrugs 11 03846 g004]()
Principal component analysis was used to condense information carried by data. The first axis (F1), accounting for 30% of total information and separating Asc from control samples, opposed the set of Gna, Cit, and PUF to the set of GPE, hTa, and GPC, all candidate biomarkers of the response to Asc (
Figure 4C,D). High levels of Gna, Cit and PUF and low levels of GPE, hTa and GPC characterized Asc-treated cells, even more after 24 h than 6 h treatment. There was a trend for an opposing variation between Glu and Asp along the F1 axis. The second axis (F2) accounted for 17% of total information, and was explained by opposed variations of MyI and Hcy on one side, and Ace, PC and GSx on other side.
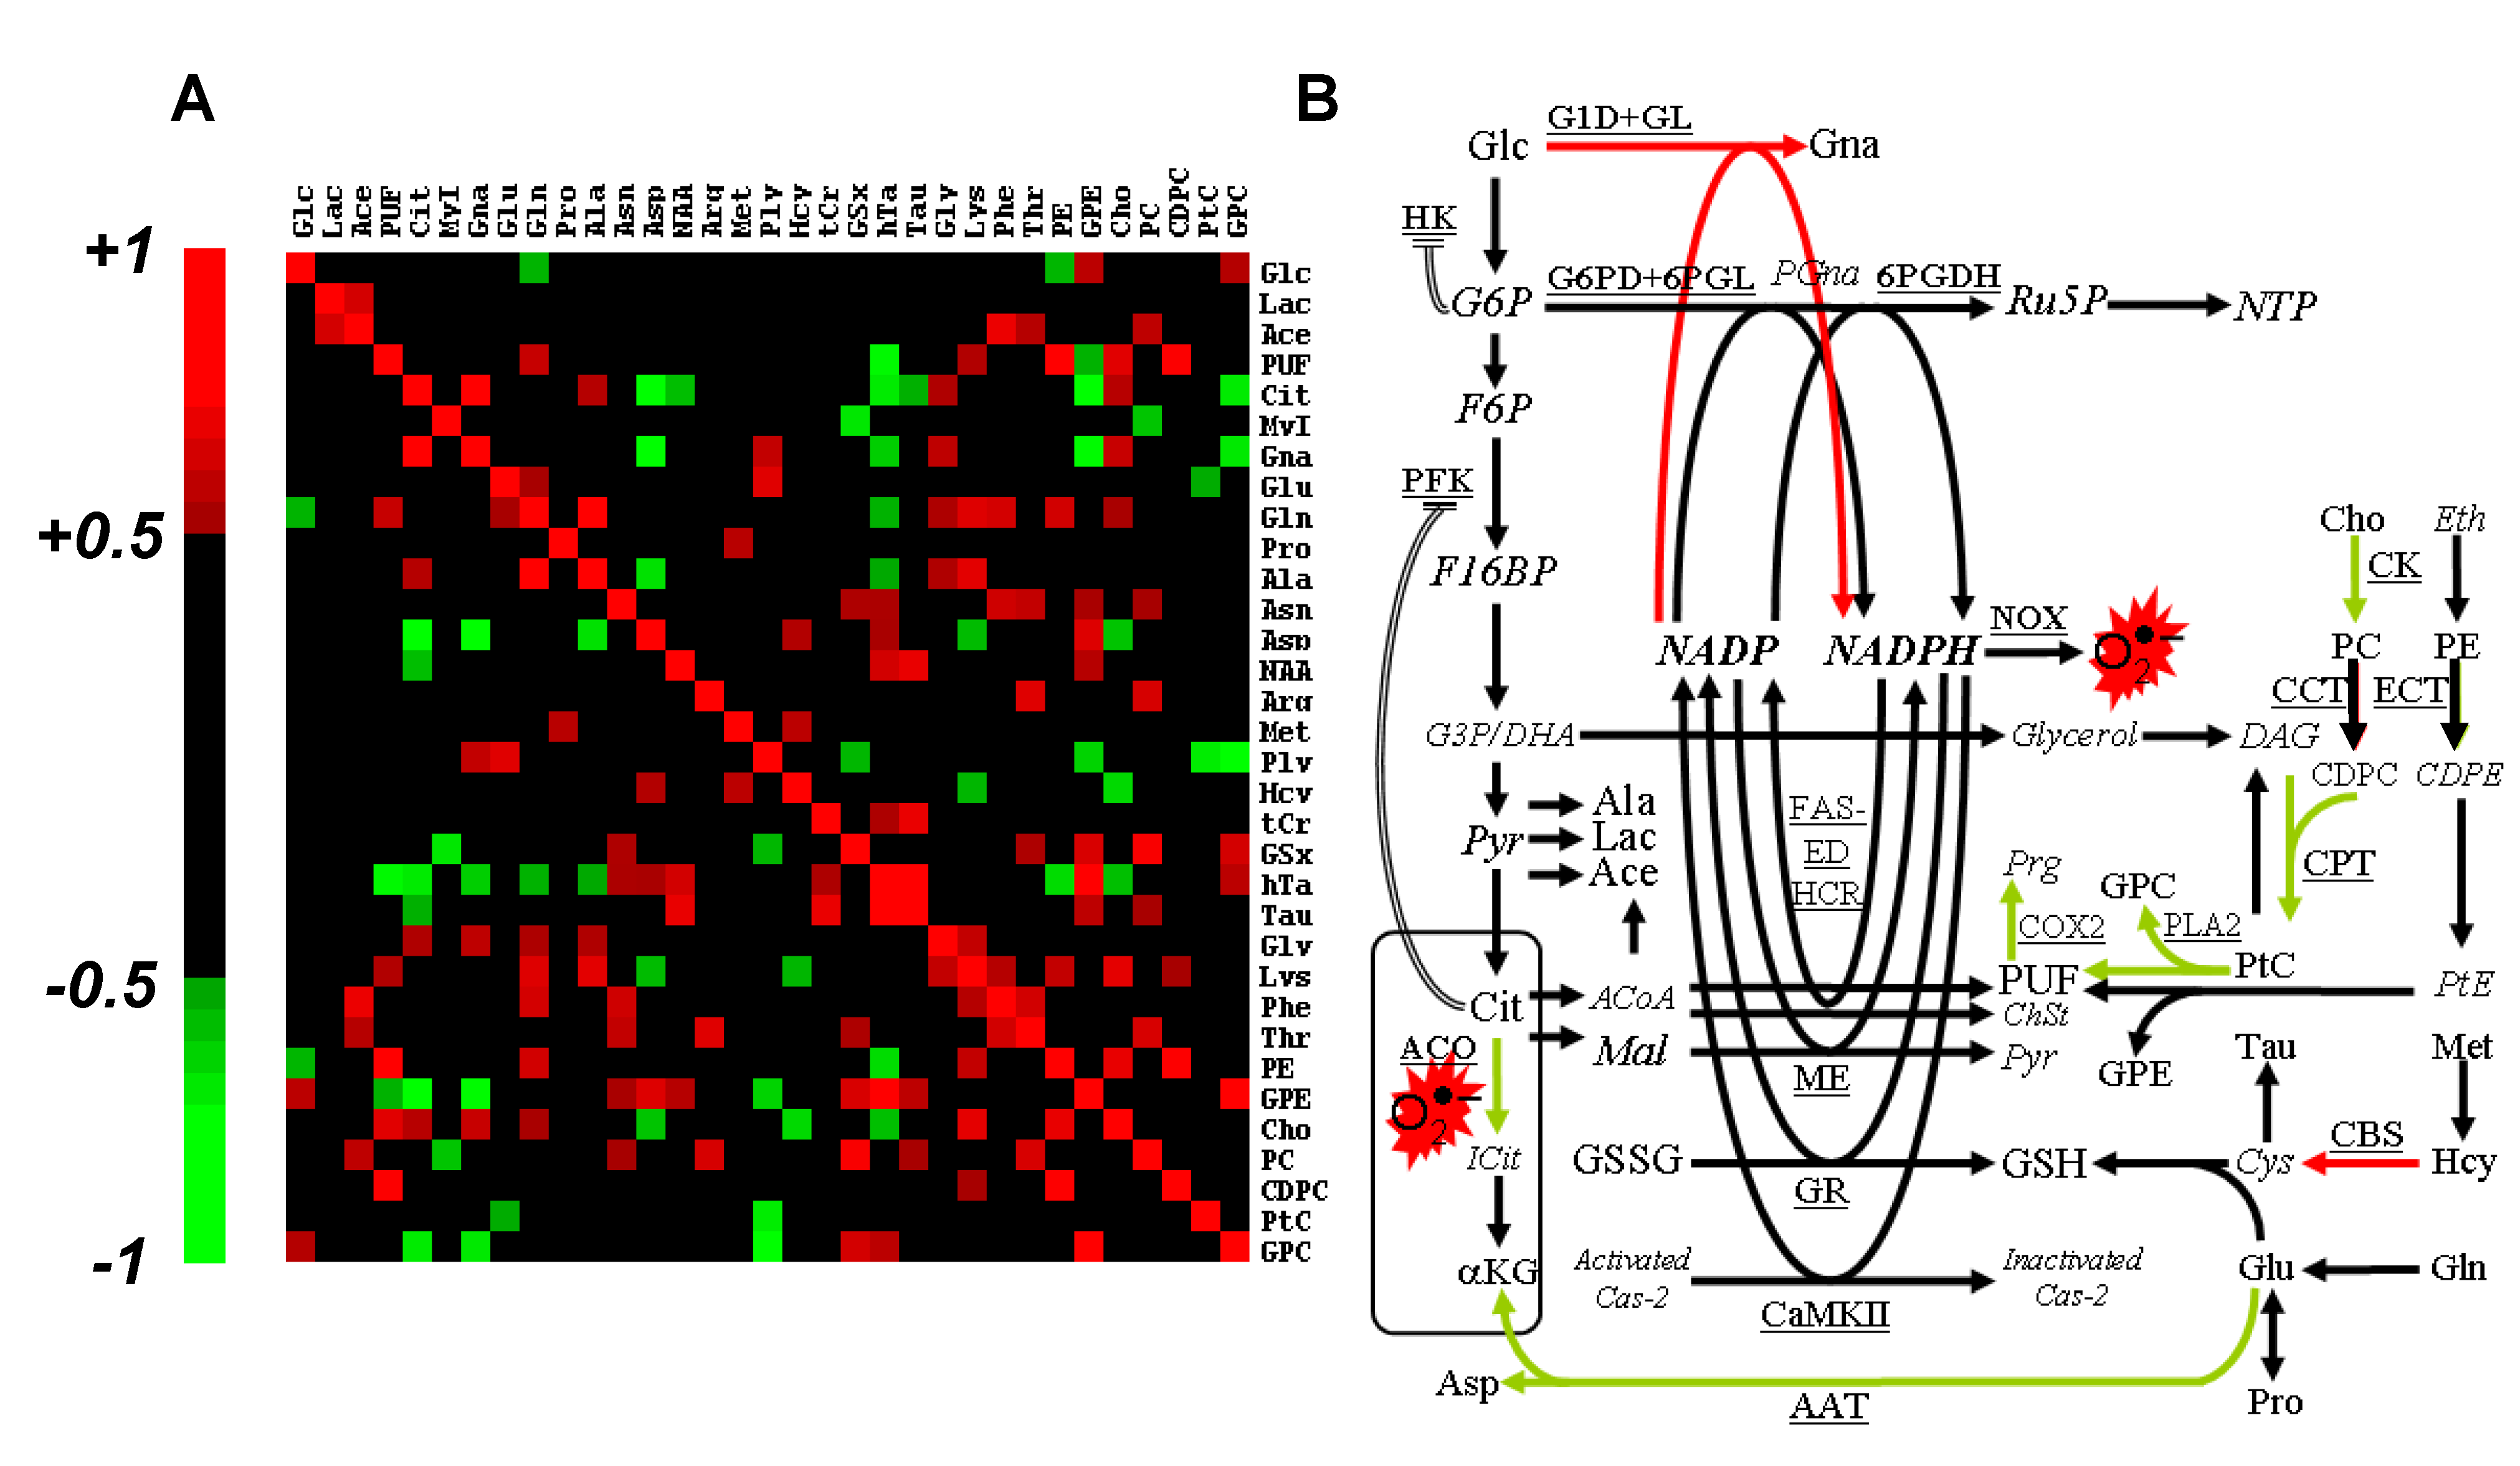
The rank correlation matrix was calculated to highlight short- and long-range co-variations between metabolites of slow turn-over or blocked at rate-limiting enzymes (
Figure 5A). Correlations that implicated Gna, Cit and PUF—the three biomarkers of oxidative stress—revealed long-range metabolic relationships. Unsurprisingly, Gna strongly correlated with Cit (
r = +0.88,
P < 0.01). Actually, Cit is an allosteric inhibitor of phosphofructokinase (PFK), a well-known regulatory process used by the cell to enhance NADPH production. Gna, the witness of a novel source for NAD(P)H production, correlated negatively with transsulfuration derivatives of which GSx, the main cellular NADPH consumer. GPC and GPE correlated negatively with Cit and Gna, and positively with metabolites with an antioxidant role (hTa, GSx).
Taken together, metabolite variations testified severe alteration of glycolysis, TCA cycle, Glu and phospholipid metabolism, and redox-sensitive transsulfuration. Changes in Hcy and GSx were suggestive of the enrolment of transsulfuration in glutathione biosynthesis, and upregulation of cystathionine-β-synthase (CBS) in Asc-treated cells. Opposing variations in Glu and Asp may suggest downregulation of aspartate aminotransferase (AAT). PUF accumulation may be related to downregulation of cyclooxygenase-2 (COX-2), which is a component of anti-inflammatory response. Phospholipase A2 (PLA2) activity has been shown to correlate with GPC and GPE release [
13], and the decrease of GPC and GPE, in this study, could be the consequence of anti-inflammatory response which downregulates COX-2 and PLA2 [
14].
Figure 5.
Steady-state concentration-based data processing and interpretation. (
A) Spearman’s rank total correlation coefficient between metabolites. Statistical significance (
P < 0.05) is obtained for |r| > 0.50, and only these coefficients are color-coded; (
B) Interpretative scheme of the response to Asc.
Italicized, non-detected metabolites; red arrows, activated pathways; green arrows, inhibited pathways; double lines, allosteric regulation. G6P, glucose-6-phosphate; PGna, 6-phospho-gluconate; Ru5P, ribulose-5-phosphate; NTP, nucleosides tri-phosphate; F6P, fructose-6-phosphate; F16BP, fructose-1,6-bisphosphate; G3P, glyceraldehyde-3-phosphate; DHA, dihydroxyacetone; Pyr, pyruvate; DAG, diacylglycerol; Eth, ethanolamine; CDPE, cytidine diphosphate ethanolamine; PtE, phosphatidylethanolamine; Prg, prostaglandin; ICit, iso-citrate; αKG, α-keto-glutarate; ACoA, acetyl-CoA; Mal, malate; ChSt, cholesterol; Cys, cystein; Cas-2, caspase-2;
G1D, NAD(P)H-dependent glucose-1-dehydrogenase;
GL, gluconolactonase;
G6PD, glucose-6-phosphate dehydrogenase;
6PGDH, 6-phosphogluconate-dehydrogenase;
NOX, NADPH oxidase;
FAS-
ED, fatty acid synthase, fatty acid elongase and desaturase;
HCR, 3-hydroxy-3-methylglutaryl-CoA reductase;
CCT, CTP: phosphocholine cytidylyltransferase;
ECT, CTP: phosphoethanolamine cytidylyltransferase;
COX2, cyclo-oxygenase-2;
ME, malic enzyme;
GR, glutathione reductase;
GS, glutathione synthase;
CBS, cystathionine-β-synthase;
CaMKII, NADPH-dependent calcium/calmodulin-dependent protein kinase II;
AAT, aspartate aminotransferase. Other abbreviations, see
Table 1.
![Marinedrugs 11 03846 g005]()
Cho and CDPC accumulation suggests inhibition of choline-kinase and inhibition of CDP-choline:1,2-diacylglycerol cholinephosphotransferase (CPT). Accumulation of Cit indicates blockade of mitochondrial/cytosolic aconitase in response to Asc, most likely through ROS oxidation of [4Fe-4S]
2+ center [
15]. This mechanism would explain Cit diffusion out of mitochondria, and accumulation into the cytosol. Cytosolic Cit is a well-known allosteric inhibitor of PFK [
16], thus downregulating glycolysis, and upregulating NADPH-producing pathways. Alternatively, Cit may become a source of NADPH through conversion into malate and activity of malic enzyme.
Gna accumulation could result from either glucose-6-phosphate dehydrogenase (G6PD) rate-limitation or hexokinase (HK) blockade. Among glucose-6-phosphate-regulated hexokinases, HK-II is mostly bound to the mitochondrial membrane, and its inhibition detaches it from the mitochondrial membrane, yielding loss of mitochondrial potential and apoptosis [
17]. Gna was reported to be increased in fibroblast lines transfected with cancer-causing genes [
18]. However, it is the first time that Gna is reported to be implicated in human tumor cell response to a pro-oxidant agent.
A summary of the response to severe oxidative stress as derived from the present metabolomics study is given in
Figure 5B. It is centered on the balance between NADPH production and consumption, and depicts the metabolic counterpart of ROS production and scavenging. Although the molecular chemistry of ROS deserves extensive work, little is known about central metabolism alterations associated to severe oxidative stress. It was recently shown that ROS production could be evaluated through the activity of the pentose phosphate pathway [
19]. However, to the best of our knowledge, little or no research has reported the metabolic counterpart of ROS production and scavenging.


