Anthraquinone Derivatives from a Marine-Derived Fungus Sporendonema casei HDN16-802

 , and
, and
Abstract
:
1. Introduction
2. Results and Discussion
3. Materials and Methods
3.1. General Experimental Procedures
3.2. Fungal Material
3.3. Fermentation and Extraction
3.4. Isolation
3.5. Assay of Cytotoxic Activity
3.6. Assay of Antimicrobial Activity
3.7. Assay of Anticoagulant Activity
3.8. Assay of Antitubercular Activity
4. Conclusions
Supplementary Materials
Author Contributions
Funding
Conflicts of Interest
References
- Zhou, Y.X.; Xia, W.; Yue, W.; Peng, C.; Rahman, K.; Zhang, H.; Evid, J. Rhein: A Review of Pharmacological Activities. Based Complement. Alternat. Med. 2015, 1–10. [Google Scholar] [CrossRef] [PubMed]
- Abu, N.; Ali, N.; Ho, W.; Yeap, S.; Aziz, M.Y.; Alitheen, N. Damnacanthal: A Promising Compound as a Medicinal Anthraquinone. Anticancer Agents Med. Chem. 2014, 14, 750–755. [Google Scholar] [CrossRef] [PubMed]
- Zheng, C.J.; Shao, C.L.; Guo, Z.Y.; Chen, J.F.; Deng, D.S.; Yang, K.L.; Chen, Y.Y.; Fu, X.M.; She, Z.G.; Lin, Y.C.; Wang, C.Y. Bioactive hydroanthraquinones and anthraquinone dimers from a soft coral-derived Alternaria sp. fungus. J. Nat. Prod. 2012, 75, 189–197. [Google Scholar] [CrossRef] [PubMed]
- Kanamaru, S.; Honma, M.; Murakami, T.; Tsushima, T.; Kudo, S.; Tanaka, K.; Nihei, K.; Nehira, T.; Hashimoto, M. Absolute stereochemistry of altersolanol A and alterporriols. Chirality. 2012, 24, 137–146. [Google Scholar] [CrossRef] [PubMed]
- Suemitsu, R.; Kitagawa, N.; Horie, S.; Kazawa, K.; Harada, T. Isolation and Identification of Altersolanol B (7-Methoxy-2-methyl-(2R, 3S)-1, 2, 3, 4-tetrahydro-2, 3, 5-trihydroxyanthraquinone) from the Mycelium of Alternaría porri (Ellis) Ciferri. Agric. Biol. Chem. 2014, 42, 1801–1802. [Google Scholar] [CrossRef]
- Kasai, M.; Shirahata, K.; Ishii, S.; Mineura, K.; Marumo, H.; Tanaka, H.; OMURA, S. Structure of Nanaomycin E, A New Naaomycin. J. Antibiot. 1979, 5, 442–445. [Google Scholar] [CrossRef]
- Okabe, T.; Nomoto, K.; Tanaka, N. Lactoquinomycin B, A Novel Antibiotic. J Antibiot. 1986, 1, 1–5. [Google Scholar] [CrossRef]
- Becker, A.M.; Rickards, R.W.; Schmalzl, K.J.; Yick, H.C. Metabolites of Dactylaria Lutea, the Structures of Dactylariol and the Antiprotozoal Antibiotic Dactylarin. J. Antibiot. 1978, 4, 324–329. [Google Scholar] [CrossRef]
- Noda, T.; Take, T.; Watanabe, T.; Abe, J. The Structure of Bostrycin. Tetrahedron 1970, 26, 1339–1346. [Google Scholar] [CrossRef]
- Debbab, A.; Aly, A.H.; Edrada-Ebel, R.A.; Wray, V.; Müller, W.E.G.; Totzke, F.; Zirrgiebel, U.; Schächtele, C.; Kubbutat, M.H.G.; Lin, W.H.; et al. Bioactive Metabolites from the Endophytic Fungus Stemphylium globuliferum Isolated from Mentha pulegium. J. Nat. Prod. 2009, 72, 626–631. [Google Scholar] [CrossRef]
- Ge, H.M.; Song, Y.C.; Shan, C.Y.; Ye, Y.H.; Tan, R.X. New and cytotoxic anthraquinones from Pleospora sp. IFB-E006, an endophytic fungus in Imperata cylindrical. Planta. Med. 2005, 71, 1063–1065. [Google Scholar] [CrossRef]
- Alvi, K.A.; Rabenstein, J. Auxarthrol A and auxarthrol B: two new tetrahydoanthraquinones from Auxarthron umbrinum. J. Ind. Microbiol. Biotechnol. 2004, 31, 11–15. [Google Scholar] [CrossRef]
- Aly, A.H.; Edrada-Ebel, R.; Wray, V.; Müller, W.E.; Kozytska, S.; Hentschel, U.; Proksch, P.; Ebel, R. Bioactive metabolites from the endophytic fungus Ampelomyces sp. isolated from the medicinal plant Urospermum picroides. Phytochemistry 2008, 69, 1716–1725. [Google Scholar] [CrossRef] [PubMed]
- Uzor, P.F.; Ebrahim, W.; Osadebe, P.O.; Nwodo, J.N.; Okoye, F.B.; Muller, W.E.; Lin, W.; Liu, Z.; Proksch, P. Metabolites from Combretum dolichopetalum and its associated endophytic fungus Nigrospora oryzae-Evidence for a metabolic partnership. Fitoterapia 2015, 105, 147–150. [Google Scholar] [CrossRef]
- Klaiklay, S.; Rukachaisirikul, V.; Phongpaichit, S.; Pakawatchai, C.; Saithong, S.; Buatong, J.; Preedanon, S.; Sakayaroj, J. Anthraquinone derivatives from the mangrove-derived fungus Phomopsis sp. PSU-MA214. Phytochem. Lett. 2012, 5, 738–742. [Google Scholar] [CrossRef]
- Isaka, M.; Chinthanom, P.; Rachtawee, P.; Srichomthong, K.; Srikitikulchai, P.; Kongsaeree, P.; Prabpai, S. Cytotoxic hydroanthraquinones from the mangrove-derived fungus Paradictyoarthrinium diffractum BCC 8704. J. Antibiot (Tokyo) 2015, 68, 334–338. [Google Scholar] [CrossRef] [PubMed]
- Chen, B.; Shen, Q.; Zhu, X.; Lin, Y.C. The Anthraquinone Derivatives from the Fungus Alternaria sp. XZSBG-1 from the Saline Lake in Bange, Tibet, China. Molecules 2014, 19, 16529–16542. [Google Scholar] [CrossRef] [Green Version]
- Kelly, T.R.; Montury, M. A Regiochemically-controlled Synthesis of Altersolanol B. Tetrahedron. Lett. 1978, 45, 4309–4310. [Google Scholar] [CrossRef]
- Locatelli, M. Anthraquinones: Analytical Techniques as a Novel Tool to Investigate on the Triggering of Biological Targets. Curr. Drug. Targets. 2011, 12, 366–380. [Google Scholar] [CrossRef]
- Liu, P.; Wang, P.M.; Xu, J.Z. Assignment of NMR Data of Alterporriol I. Chem. Nat. Comp. 2017, 53, 653–657. [Google Scholar]
- Pretsch, A.; Proksch, P.; Debbab, A. New Anthraquinone Derivatives. U.S. Patent 0 129 927 Al, 24 May 2012. [Google Scholar]
- Bai, H.; Kong, W.W.; Shao, C.L.; Li, Y.; Liu, Y.Z.; Liu, M.; Guan, F.F.; Wang, C.Y. Zebrafish Embryo Toxicity Microscale Model for Ichthyotoxicity Evaluation of Marine Natural Products. Mar. Biotechnol. (NY) 2016, 18, 264–270. [Google Scholar] [CrossRef] [PubMed]
- Mosmann, T. Rapid Colorimetric Assay for Cellular Growth and Survival: Application to Proliferation and Cytotoxicity Assays. J. Immunol. Meth. 1983, 65, 55–63. [Google Scholar] [CrossRef]
- Skehan, P.; Storeng, R.; Scudiero, D.; Monks, A.; Mahon, J.M.; Vistica, D.; Warren, J.T.; Bokesch, H.; Kenney, S.; Boyd, M.R. New Colorimetric Cytotoxicity Assay for Anticancer-Drug Screening. J. Natl. Cancer. Inst. 1990, 82, 1107–1112. [Google Scholar] [CrossRef]
- Yu, G.H.; Wu, G.W.; Sun, Z.C.; Zhang, X.M.; Che, Q.; Gu, Q.Q.; Zhu, T.J.; Li, D.H.; Zhang, G.J. Cytotoxic Tetrahydroxanthone Dimers from the Mangrove-Associated Fungus Aspergillus versicolor HDN1009. Mar. Drugs 2018, 16, 335. [Google Scholar] [CrossRef] [PubMed]
- Du, L.; Zhu, T.J.; Liu, H.B.; Fang, Y.C.; Zhu, W.M.; Gu, Q.Q. Cytotoxic polyketides from a marine-derived fungus, Aspergillus glaucus. J. Nat. Prod. 2008, 71, 1837–1842. [Google Scholar] [CrossRef] [PubMed]
- Xu, Z.; Liu, R.N.; Guan, H.S. Dual-target inhibitor screening against thrombin and factor Xa simultaneously by mass spectrometry. Anal. Chim. Acta 2017, 1–10. [Google Scholar] [CrossRef] [PubMed]
- Tang, J.; Wang, B.X.; Wu, T.; Wan, J.T.; Tu, Z.C.; Njire, M.; Wan, B.J.; Franzblauc, S.G.; Zhang, T.Y.; Lu, X.Y.; et al. Design, Synthesis, and Biological Evaluation of Pyrazolo [1,5-a] pyridine-3-carboxamides as Novel Antitubercular Agents. ACS Med. Chem. Lett. 2015, 6, 814–818. [Google Scholar] [CrossRef]


| No. | 1 a | 2 a | 2 b | 3 a | 4 a | 5 a |
|---|---|---|---|---|---|---|
| 1 | 1.86, m | 1.92, d (14.6); 1.83, d (14.6) | 1.92, d (14.6); 1.83, d (14.6) | 1.82, d (14.2); 1.75, d (14.2) | 2.24, d (14.8); 1.74, d (14.8) | 2.35, dd (15.5); 2.31, dd (15.5) |
| 3 | 3.61, dd (5.7, 3.1) | 3.57, d (3.0) | 3.57, m | 3.46, t (3.0) | 3.61, d (3.6) | 3.46, d (3.7) |
| 4 | 4.22, dd (4.5, 3.1) | 4.43, d (3.0) | 4.43, t (3.5) | 4.39, dd (3.0, 9.7) | 4.69, d (3.6) | 4.57, d (3.7) |
| 6 | 6.79, d (2.4) | 6.35, d (2.5) | 6.35, d (2.5) | 6.34, d (2.4) | 6.82, d (2.5) | 6.42, d (2.4) |
| 8 | 6.83, d (2.4) | 6.64, d (2.5) | 6.64, m | 6.67, d (2.4) | 6.96, d (2.5) | 6.67, dd (2.4, 1.2) |
| 9 | 4.73, s | 4.73, d (9.5) | 4.52, d (8.7) | 4.83, d (1.2) | ||
| 1a | 3.36, (6.0, 1.5) | |||||
| 4a | 2.87, d (9.7) | |||||
| 11 | 3.87, s | 3.80, s | 3.80, s | 3.81, s | 3.88, s | 3.82, s |
| 12 | 1.14, s | 1.20, s | 1.20, s | 1.19, s | 1.27, s | 1.21, s |
| OH-2 | 4.28, s | 5.69, s | 5.69, s | 5.44, s | 6.24, s | |
| OH-3 | 4.43, d (5.7) | 5.50, d (5.3) | 4.81, d (3.0) | 4.91, s | ||
| OH-4 | 5.01, d (4.5) | 4.52, d (3.5) | 4.57, d (3.0) | 4.96, s | ||
| OH-4a | 6.46, m | 5.56, s | 5.57, s | |||
| OH-5 | 12.44, s | 11.97, s | 11.97, s | 12.37, s | 11.15, s | 12.19, s |
| OH-1a | 5.29, s | 5.29, s | 4.91, s | 6.97, s | ||
| OH-9 | 5.30, d (9.5) | 5.46, d (8.7) |
| No. | 1 | 2 | 3 | 4 | 5 |
|---|---|---|---|---|---|
| 1 | 34.2, CH2 | 34.3, CH2 | 38.7, CH2 | 30.7, CH2 | 42.4, CH2 |
| 2 | 72.3, C | 73.5, C | 73.2, C | 73.6, C | 70.3, C |
| 3 | 73.7, CH | 76.9, CH | 75.2, CH | 75.7, CH | 72.9, CH |
| 4 | 71.3, CH | 64.6, CH | 66.1, CH | 63.5, CH | 65.2, CH |
| 5 | 166.1, C | 164.8, C | 163.8, C | 163.6, C | 164.9, C |
| 6 | 106.1, CH | 99.7, CH | 99.5, CH | 107.2, CH | 100.1, CH |
| 7 | 166.3, C | 166.4, C | 166.3, C | 165.7, C | 166.8, C |
| 8 | 105.0, CH | 106.2, CH | 105.8, CH | 106.4, CH | 106.6, CH |
| 9 | 197.3, C | 70.0, CH | 73.9, CH | 190.6, C | 68.6, CH |
| 10 | 200.1, C | 202.4, C | 206.0, C | 194.4, C | 196.6, C |
| 1a | 48.0, CH | 79.3, C | 78.5, C | 80.5, C | 64.8, C |
| 4a | 78.2, C | 78.1, C | 53.3, CH | 72.1, C | 63.3, C |
| 9a | 137.6, C | 148.4, C | 149.0, C | 134.5, C | 145.9, C |
| 10a | 110.1, C | 108.6, C | 110.8, C | 110.0, C | 107.1, C |
| 11 | 56.7, CH3 | 56.1, CH3 | 56.1, CH3 | 56.7, CH3 | 56.2, CH3 |
| 12 | 23.1, CH3 | 27.6, CH3 | 27.8, CH3 | 27.6, CH3 | 26.1, CH3 |
| Comp. | IC50 (μM) | ||||||||||
|---|---|---|---|---|---|---|---|---|---|---|---|
| HL-60 | Hela | HCT-116 | MGC-803 | HO8910 | MDA-MB-231 | SH-SY5Y | PC-3 | BEL-7402 | K562 | L-02 | |
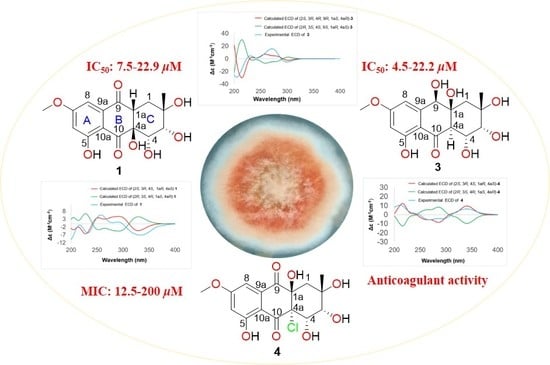
| 1 | 7.5 | >50.0 | 14.5 | 21.8 | >50.0 | 19.1 | 22.9 | 21.9 | 16.6 | >50.0 | >50.0 |
| 3 | 4.5 | 10.7 | 7.8 | 17.7 | 18.7 | 10.1 | 17.2 | 20.0 | 21.3 | 16.5 | 22.2 |
| Dox a | 0.1 | 0.6 | 0.2 | 0.2 | 0.4 | 0.2 | 0.1 | 1.0 | 0.4 | 0.3 | 0.4 |
| Comp. | MIC (μM) | ||||||
|---|---|---|---|---|---|---|---|
| Mycobacterium Phlei | Proteus Species | Bacillus subtilis | Candida albicans | Vibrio Parahemolyticus | Escherichia coli | Pseudomonas aeruginosa | |
| 1 | 25.0 | 50.0 | 100 | >200 | 50.0 | 100 | 50.0 |
| 2 | >200 | >200 | >200 | >200 | >200 | >200 | >200 |
| 3 | 200 | 200 | 200 | >200 | >200 | >200 | 200 |
| 4 | 50.0 | 25.0 | 25.0 | 200 | 100 | >200 | 100 |
| 5 | >200 | >200 | >200 | >200 | >200 | >200 | >200 |
| 6 | 25.0 | 50.0 | 25.0 | >200 | 25.0 | >200 | 25.0 |
| 7 | 25.0 | 100 | 25.0 | >200 | 25.0 | >200 | 12.5 |
| Positive Control | 3.12 a | 1.56 a | 0.781 a | 1.56 b | 0.781 a | 0.391 a | 1.56 a |
| Comp. | 1 | 2 | 3 | 4 | 5 | 6 | 7 | Argatroban b |
|---|---|---|---|---|---|---|---|---|
| Inhibition ratio a | 12.5 | 19.9 | 14.4 | 47.8 | 27.3 | 51.5 | 19.3 | 65.0 |
| Comp. | 1 | 2 | 3 | 4 | 5 | 6 | 7 | Rifampin b |
|---|---|---|---|---|---|---|---|---|
| MIC a | >20.0 | >20.0 | >20.0 | >20.0 | >20.0 | >20.0 | 20.0 | 1.0 |
© 2019 by the authors. Licensee MDPI, Basel, Switzerland. This article is an open access article distributed under the terms and conditions of the Creative Commons Attribution (CC BY) license (http://creativecommons.org/licenses/by/4.0/).
Share and Cite
Ge, X.; Sun, C.; Feng, Y.; Wang, L.; Peng, J.; Che, Q.; Gu, Q.; Zhu, T.; Li, D.; Zhang, G. Anthraquinone Derivatives from a Marine-Derived Fungus Sporendonema casei HDN16-802. Mar. Drugs 2019, 17, 334. https://doi.org/10.3390/md17060334
Ge X, Sun C, Feng Y, Wang L, Peng J, Che Q, Gu Q, Zhu T, Li D, Zhang G. Anthraquinone Derivatives from a Marine-Derived Fungus Sporendonema casei HDN16-802. Marine Drugs. 2019; 17(6):334. https://doi.org/10.3390/md17060334
Chicago/Turabian StyleGe, Xueping, Chunxiao Sun, Yanyan Feng, Lingzhi Wang, Jixing Peng, Qian Che, Qianqun Gu, Tianjiao Zhu, Dehai Li, and Guojian Zhang. 2019. "Anthraquinone Derivatives from a Marine-Derived Fungus Sporendonema casei HDN16-802" Marine Drugs 17, no. 6: 334. https://doi.org/10.3390/md17060334