Identifying Regional Key Eco-Space to Maintain Ecological Security Using GIS


Abstract
:1. Introduction
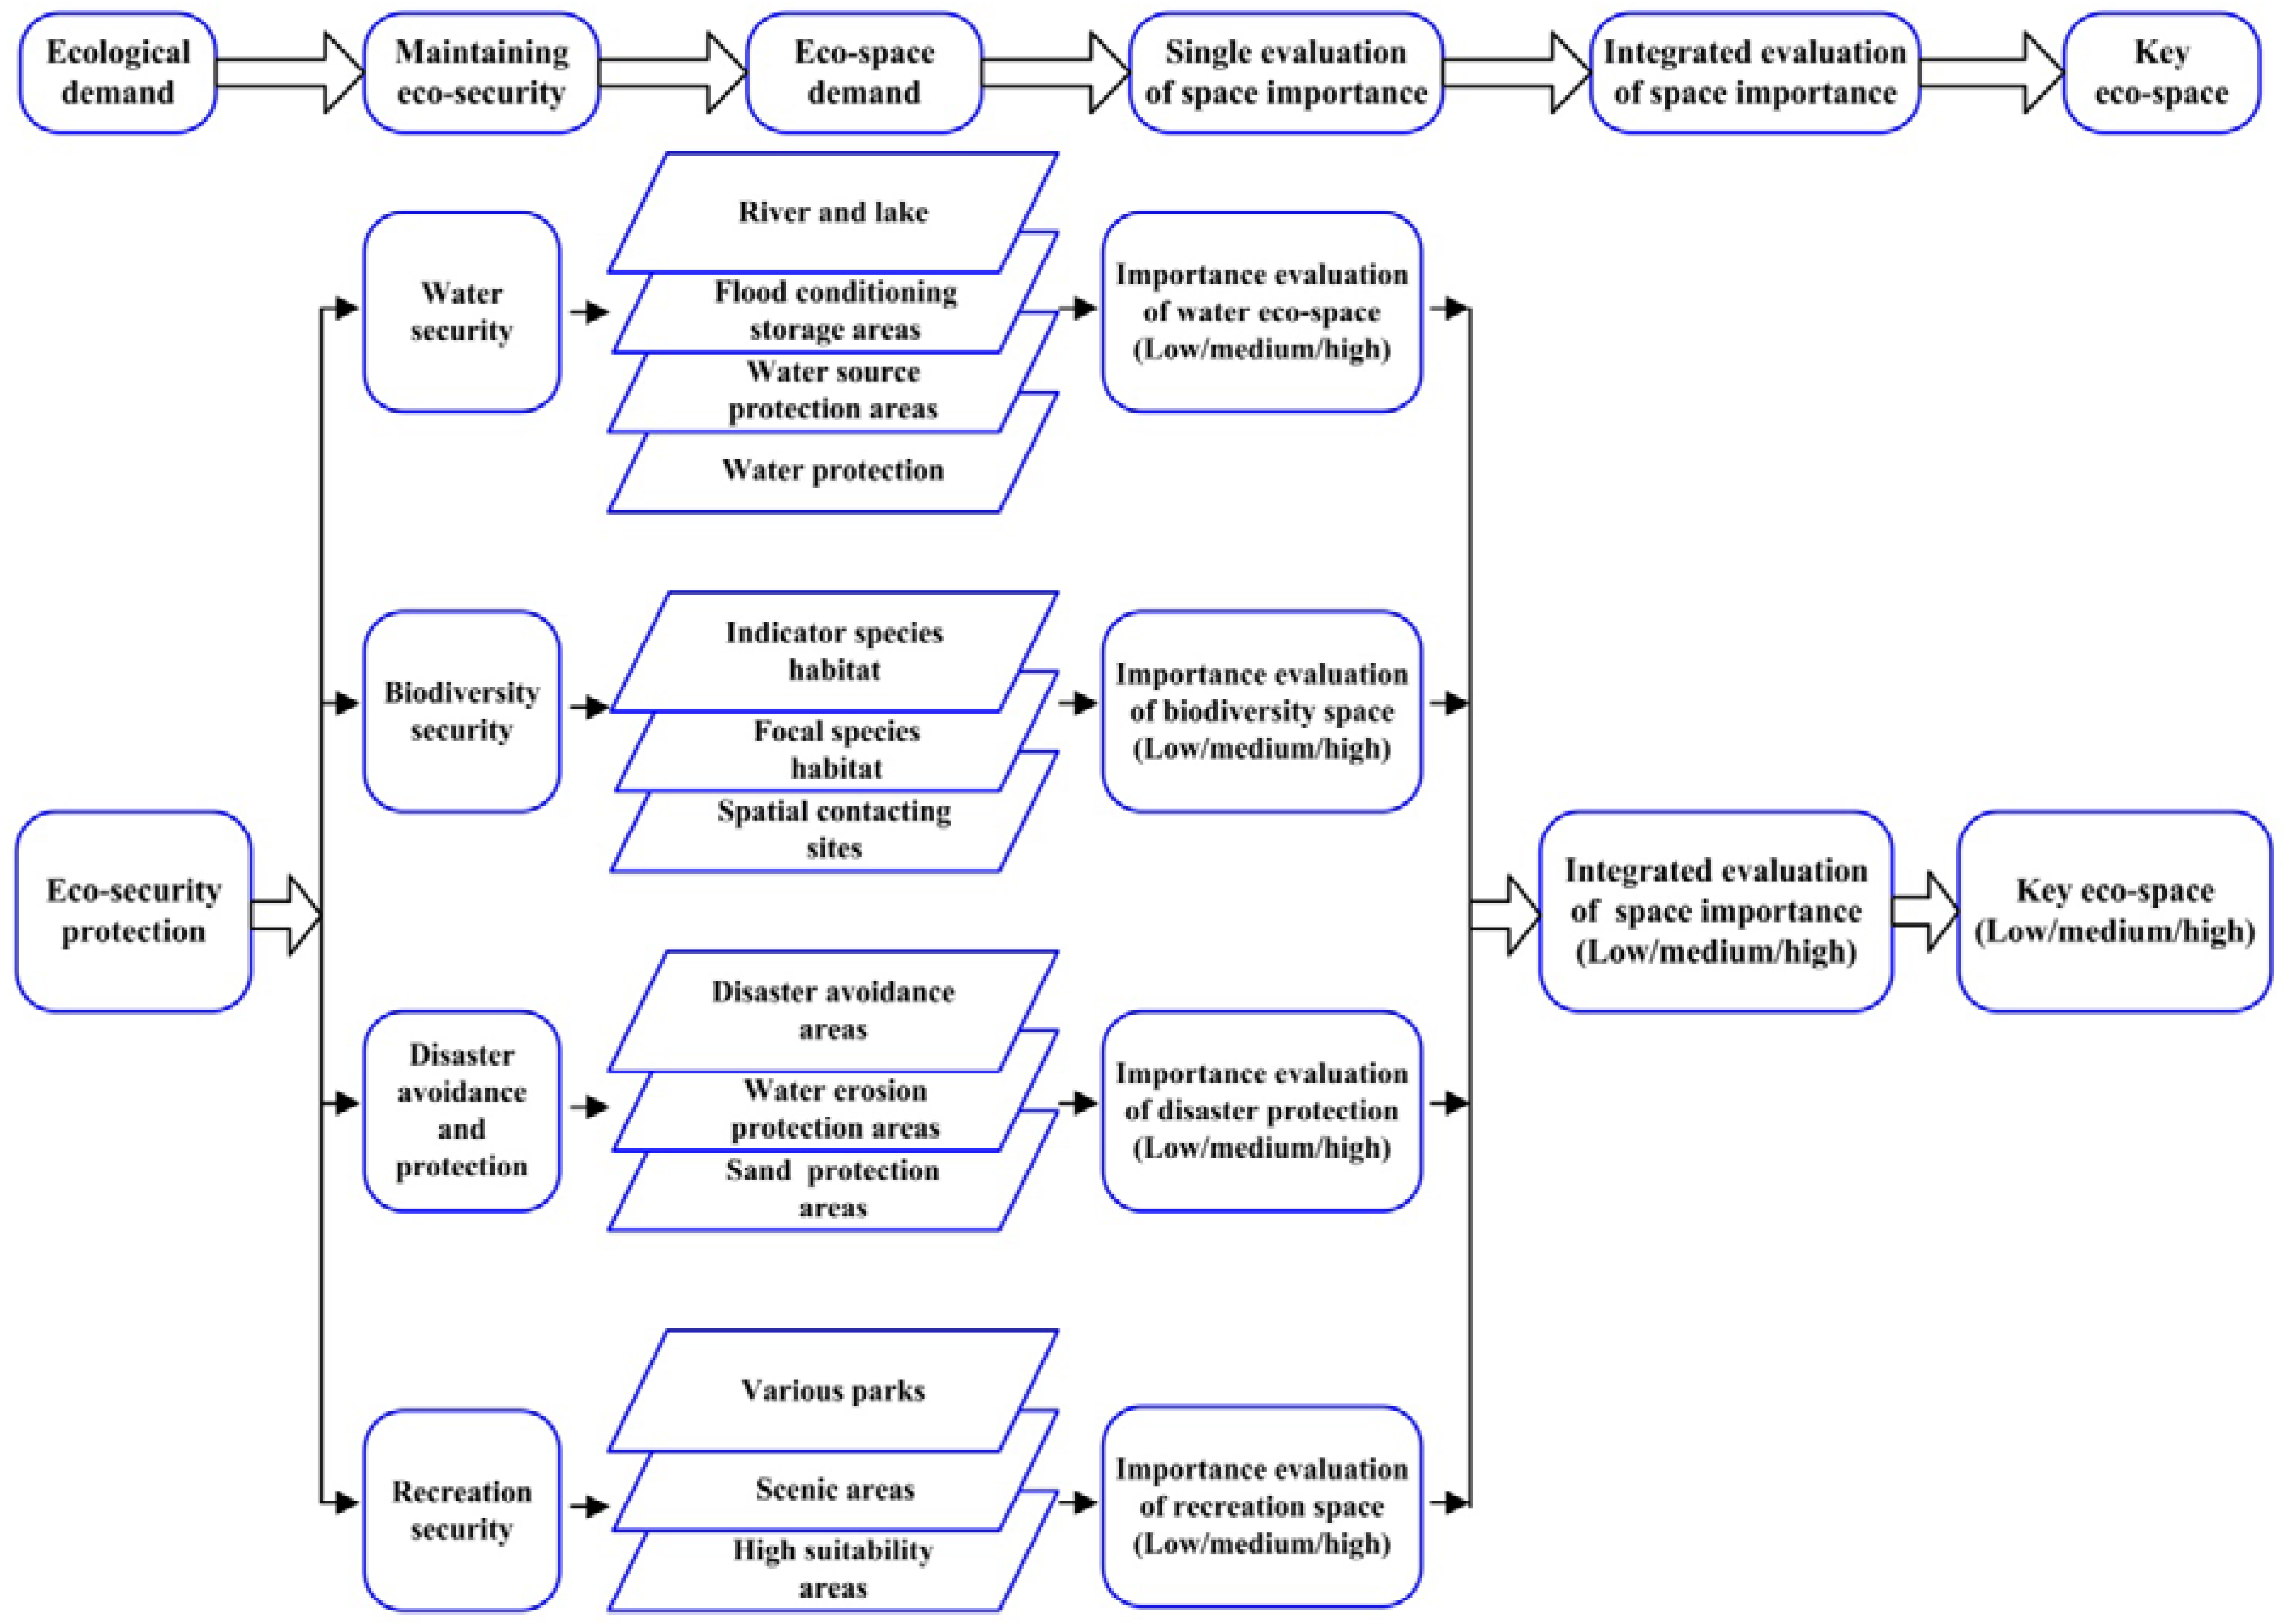
2. Identifying Framework

3. Materials and Methods
3.1. Study Area

3.2. Data
3.3. Methods
3.3.1. The Framework for the Importance Evaluation of Eco-Space

| Object Layer | Item Layer | Index Layer |
|---|---|---|
| Integrated index of ecological space importance | Importance of maintaining water security | Distance index to a river or lake (s1) |
| Type index of flood conditioning storage areas (s2) | ||
| Importance index for water conservation (s3) | ||
| Type index of water source protection areas (s4) | ||
| Importance of biodiversity conservation | Sensitivity index of habitats (s5) | |
| Importance of disaster avoidance and protection | Sensitivity index of geological hazards (s6) | |
| Importance index of soil conservation(s7) | ||
| Importance index of land desertification protection(s8) | ||
| Importance of natural recreation | Suitability index of natural recreation(s9) |
| Topographic Form | Ecosystem Class | Importance |
|---|---|---|
| Mountain | Forest or Wetland/ Steppe or Meadow / Desert | High / Relatively high / Medium |
| Hill | Forest or Wetland/ Steppe or Meadow / Desert | Relatively high / Medium / Relatively low |
| Plain | Forest or Wetland/ Steppe or Meadow / Desert | Medium / Relatively low / Low |
| Eco-space Type | Degree of Sensitivity to Soil Erosion and Land Desertification | Importance for Soil Conservation and Land Desertification Protection |
|---|---|---|
| Forest ecosystem
Steppe ecosystem Meadow ecosystem Desert ecosystem | Extremely sensitive | High |
| Highly sensitive | Relatively high | |
| Moderately sensitive | Medium | |
| Mildly sensitive | Relatively low | |
| Not sensitive | Low |
3.3.2. Criteria for the Indexes of Eco-Space Importance Evaluation
| Index | Extremely Important | Moderately Important | Generally Important | Not Important |
|---|---|---|---|---|
| Distance index to a river or lake (s1) | <50 m | 50~100 m | 100~150 m | >150 m |
| Type index of flood conditioning storage areas (s2) | Wetland areas | Core areas of detention basins | Non-core areas of detention basins | Other areas |
| Importance index for water conservation (s3) | High | Relatively high | Medium | Relatively low/ Low |
| Type index of water source protection areas (s4) | First-grade protection zones of water resources | Second-grade protection zones of water resources | Quasi-watershed protection zone | None |
| Sensitivity index of habitats (s5) | Extremely sensitive | Highly sensitive | Moderately sensitive | Mildly sensitive/
Not sensitive |
| Sensitivity index of geological hazards (s6) | First-grade protection zones of water resources | Second-grade protection zones of water resources | Quasi-watershed protection zone | None |
| Importance index for soil conservation (s7) | Extremely sensitive | Highly sensitive | Moderately sensitive | Mildly sensitive/
Insensitive |
| Importance index for land desertification protection (s8) | Extremely sensitive | Highly sensitive | Moderately sensitive | Mildly sensitive/
Not sensitive |
| Suitability index of natural recreation (s9) | High | Relatively high | Medium | Relatively low/ Low |
| Assigned score | 4 | 3 | 2 | 1 |
3.3.3. Integrated Evaluation of Eco-Space Importance
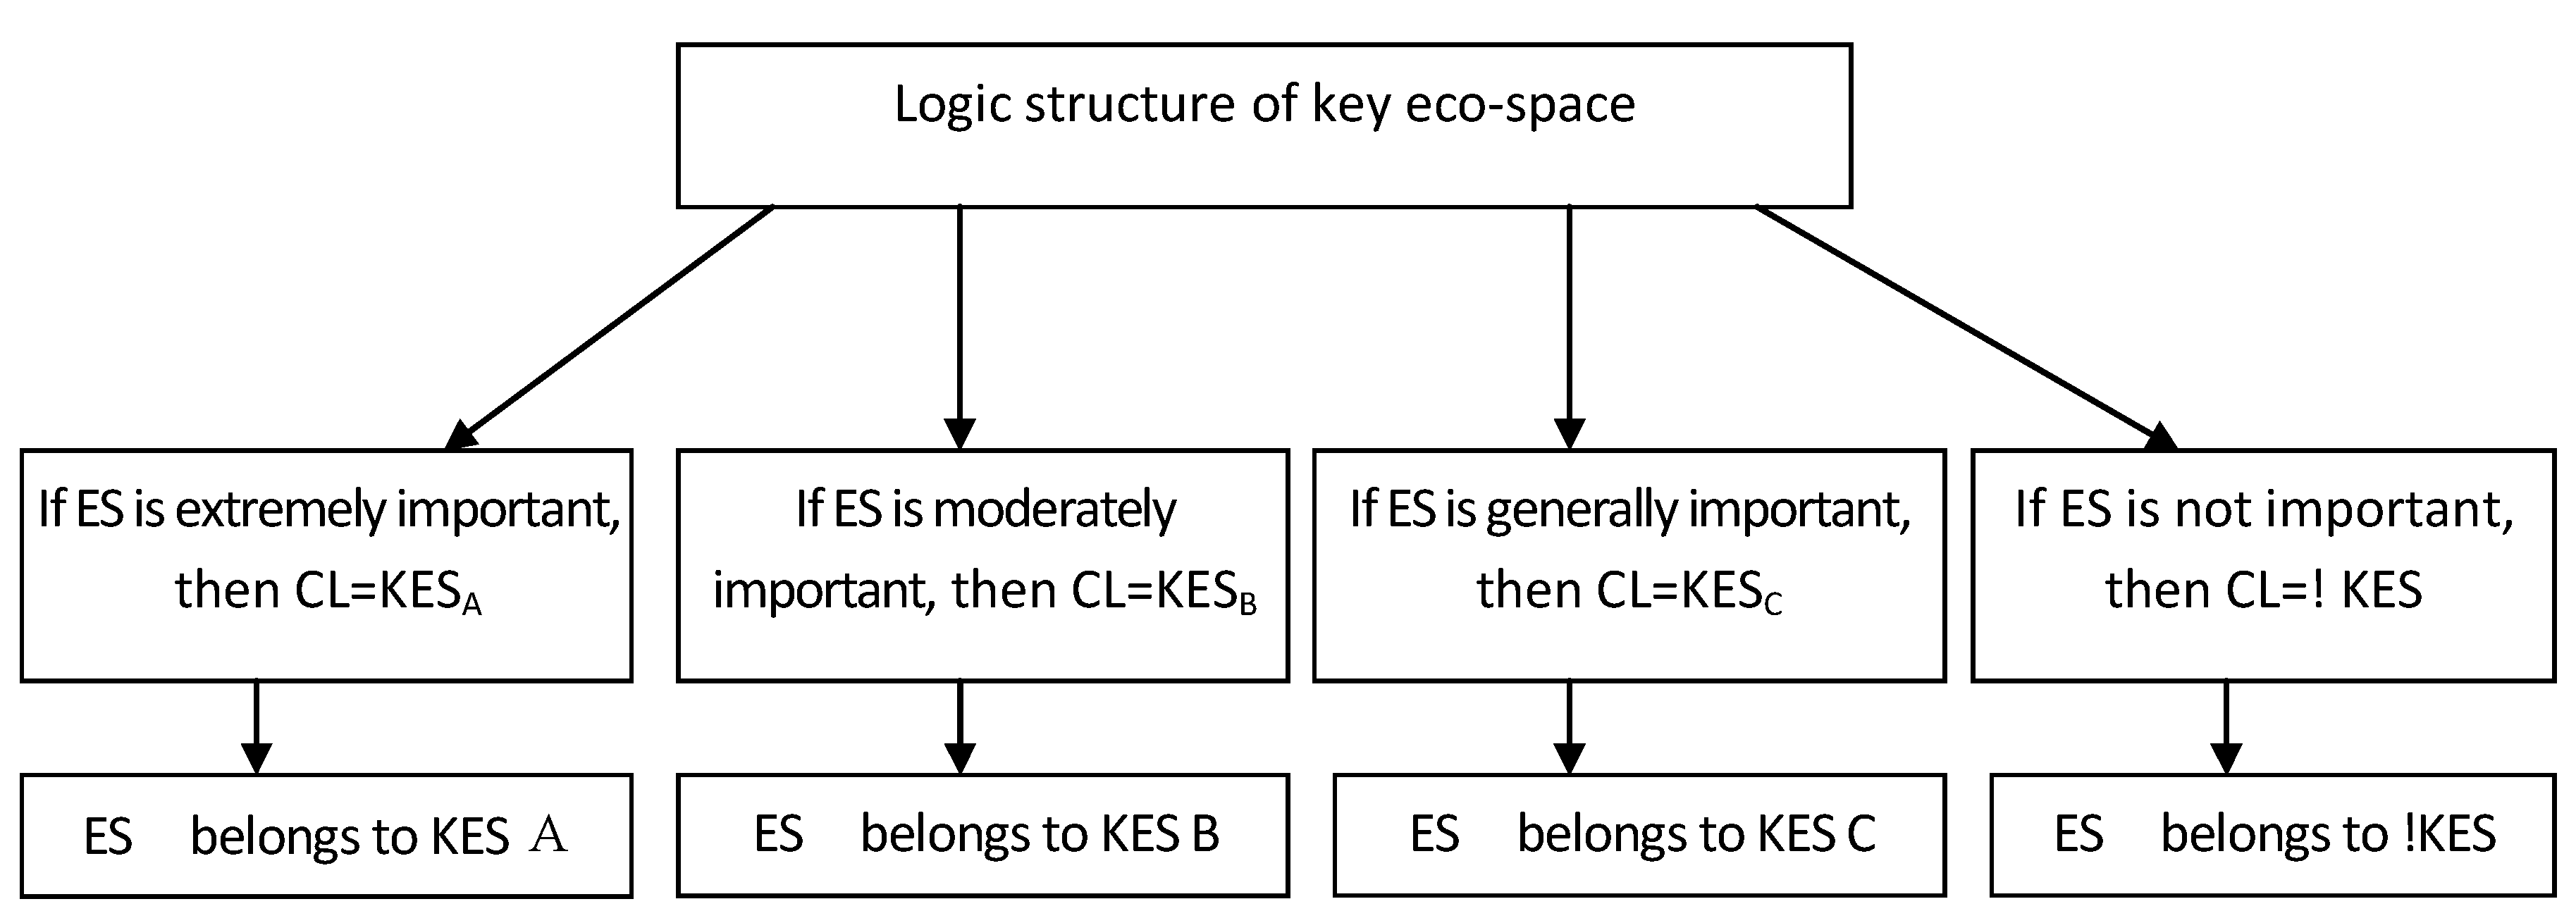
3.3.4. Identification of Key Eco-Space

4. Results and Discussion
| Evaluation Factors | Importance Ranking | Areas (hm2) | Percentage of Total Area (%) | Cumulative Percentage of Total Area (%) |
|---|---|---|---|---|
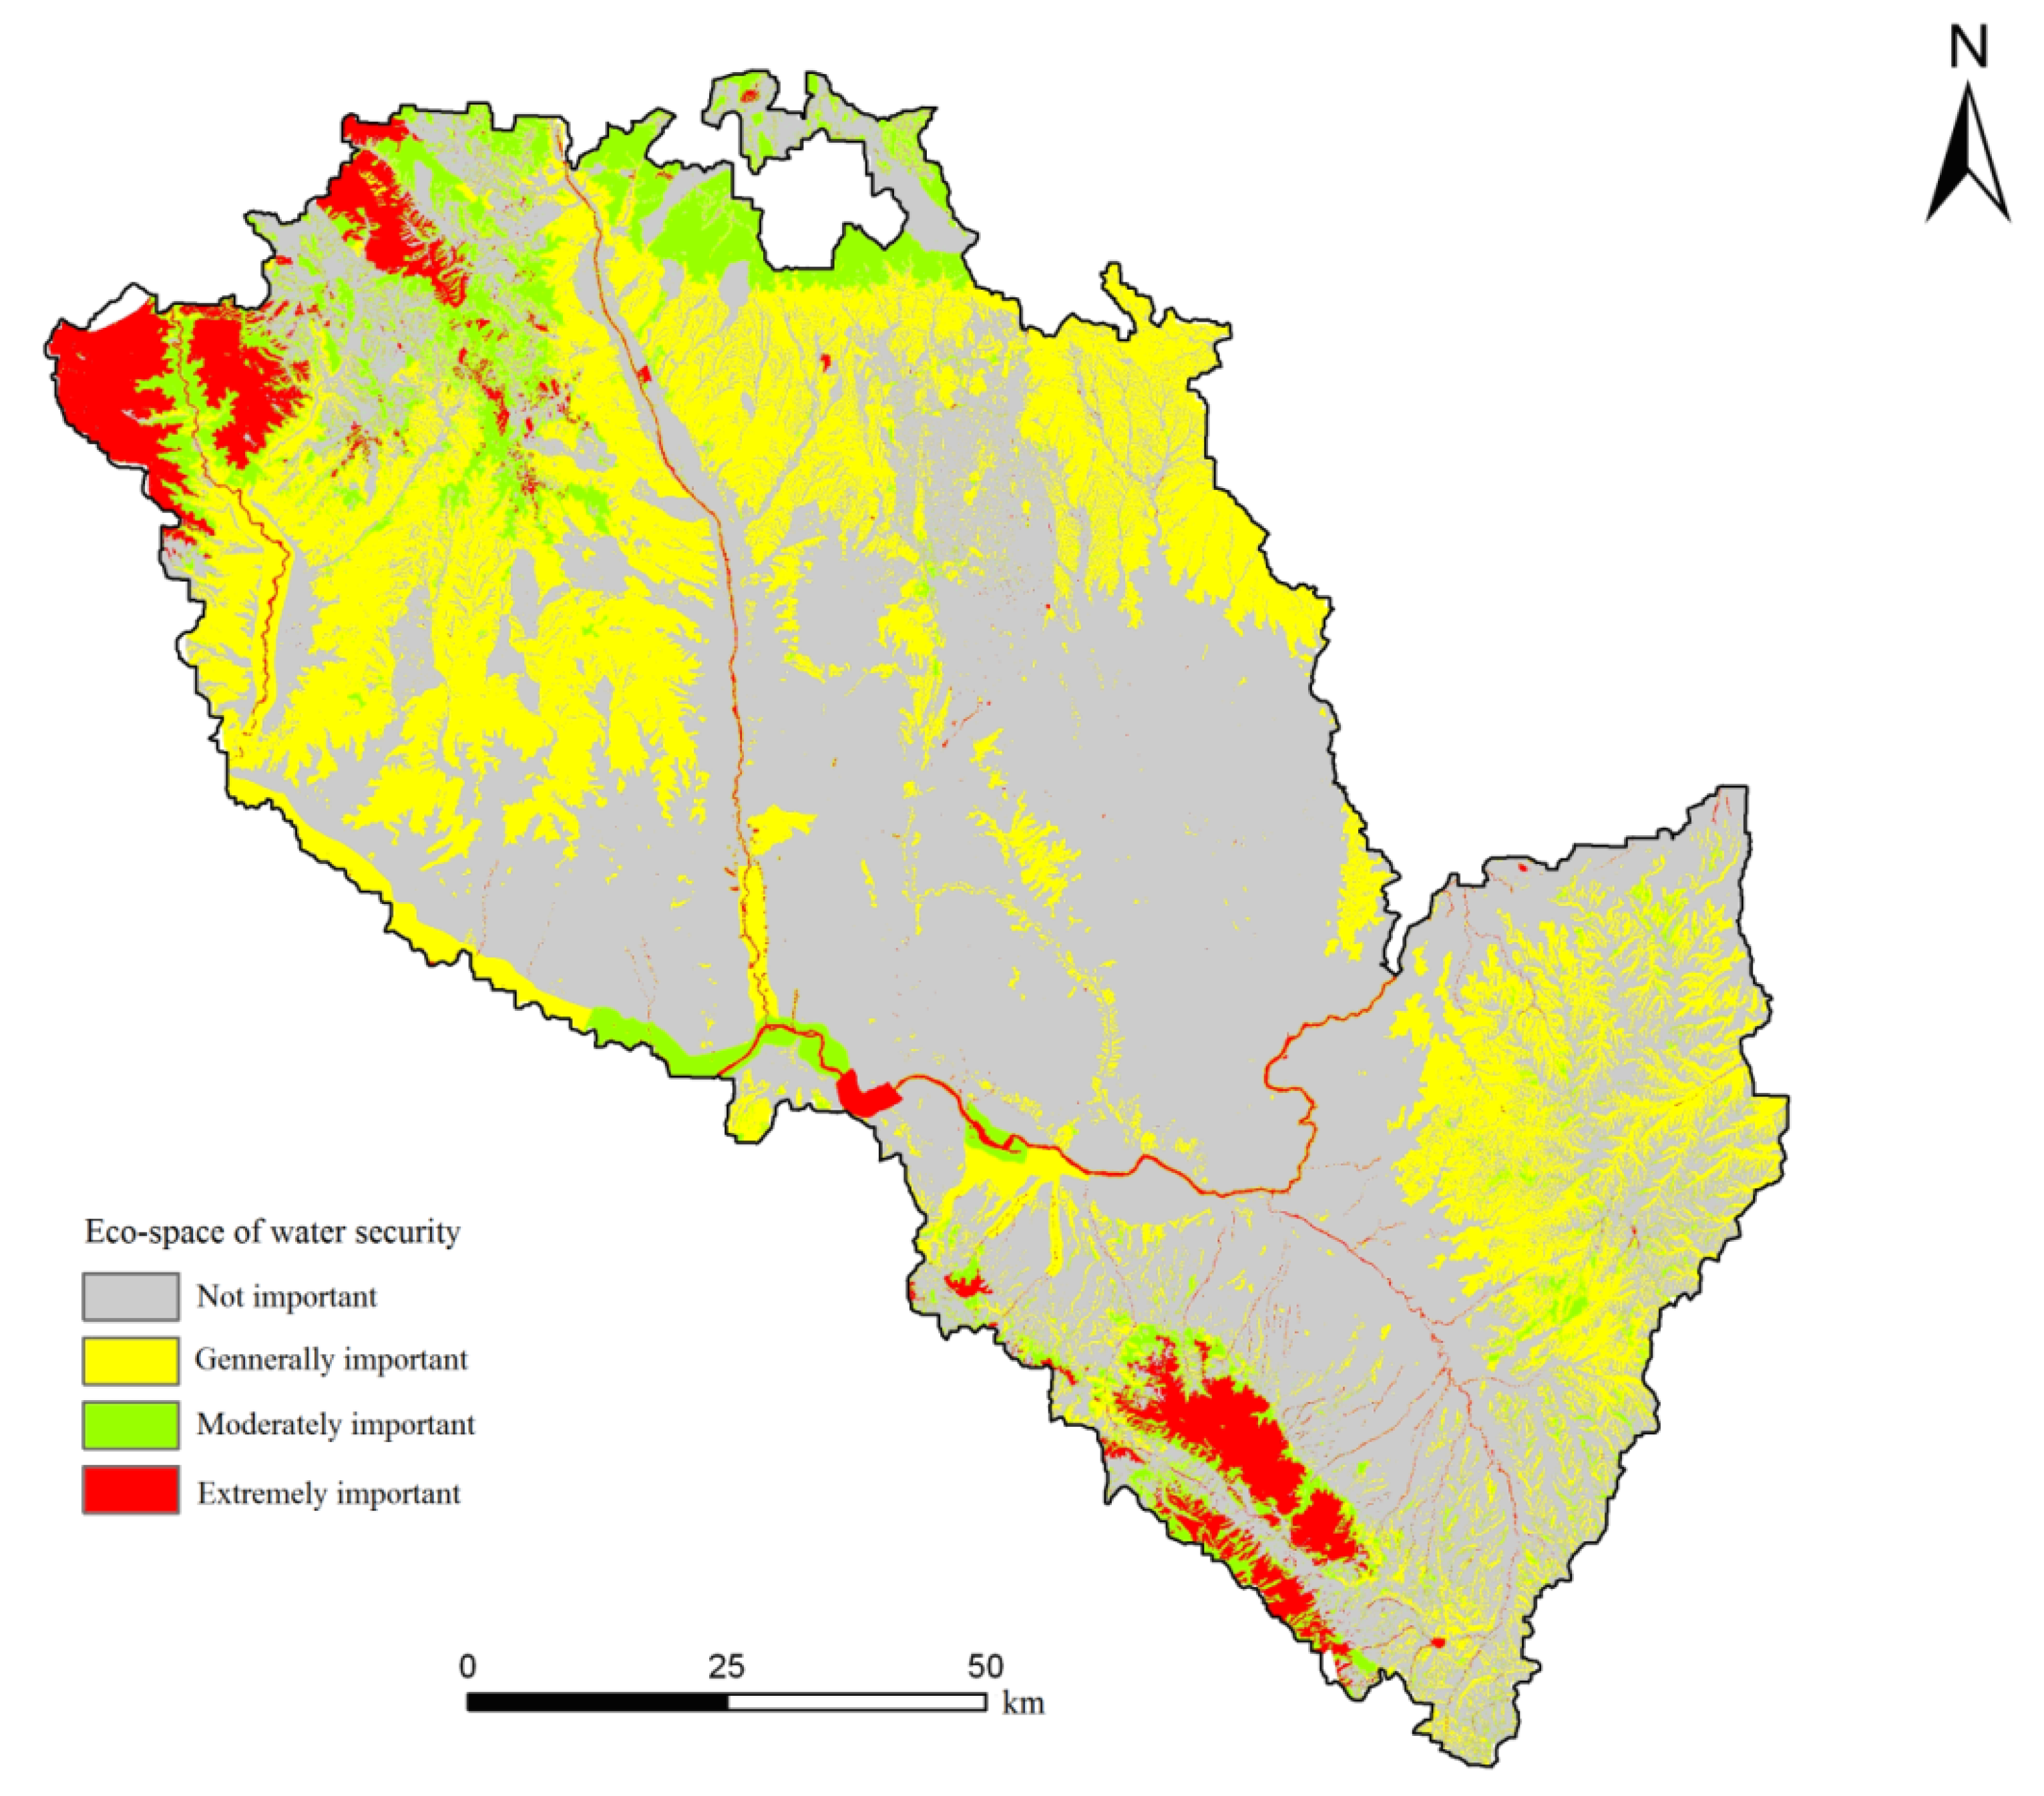
| Water security | Extremely important | 6,764.375 | 5.22 | 5.22 |
| Moderately important | 11,156.1 | 8.61 | 13.83 | |
| Generally important | 34,970.05 | 26.99 | 40.82 | |
| Not important | 76,693.825 | 59.18 | 100 | |
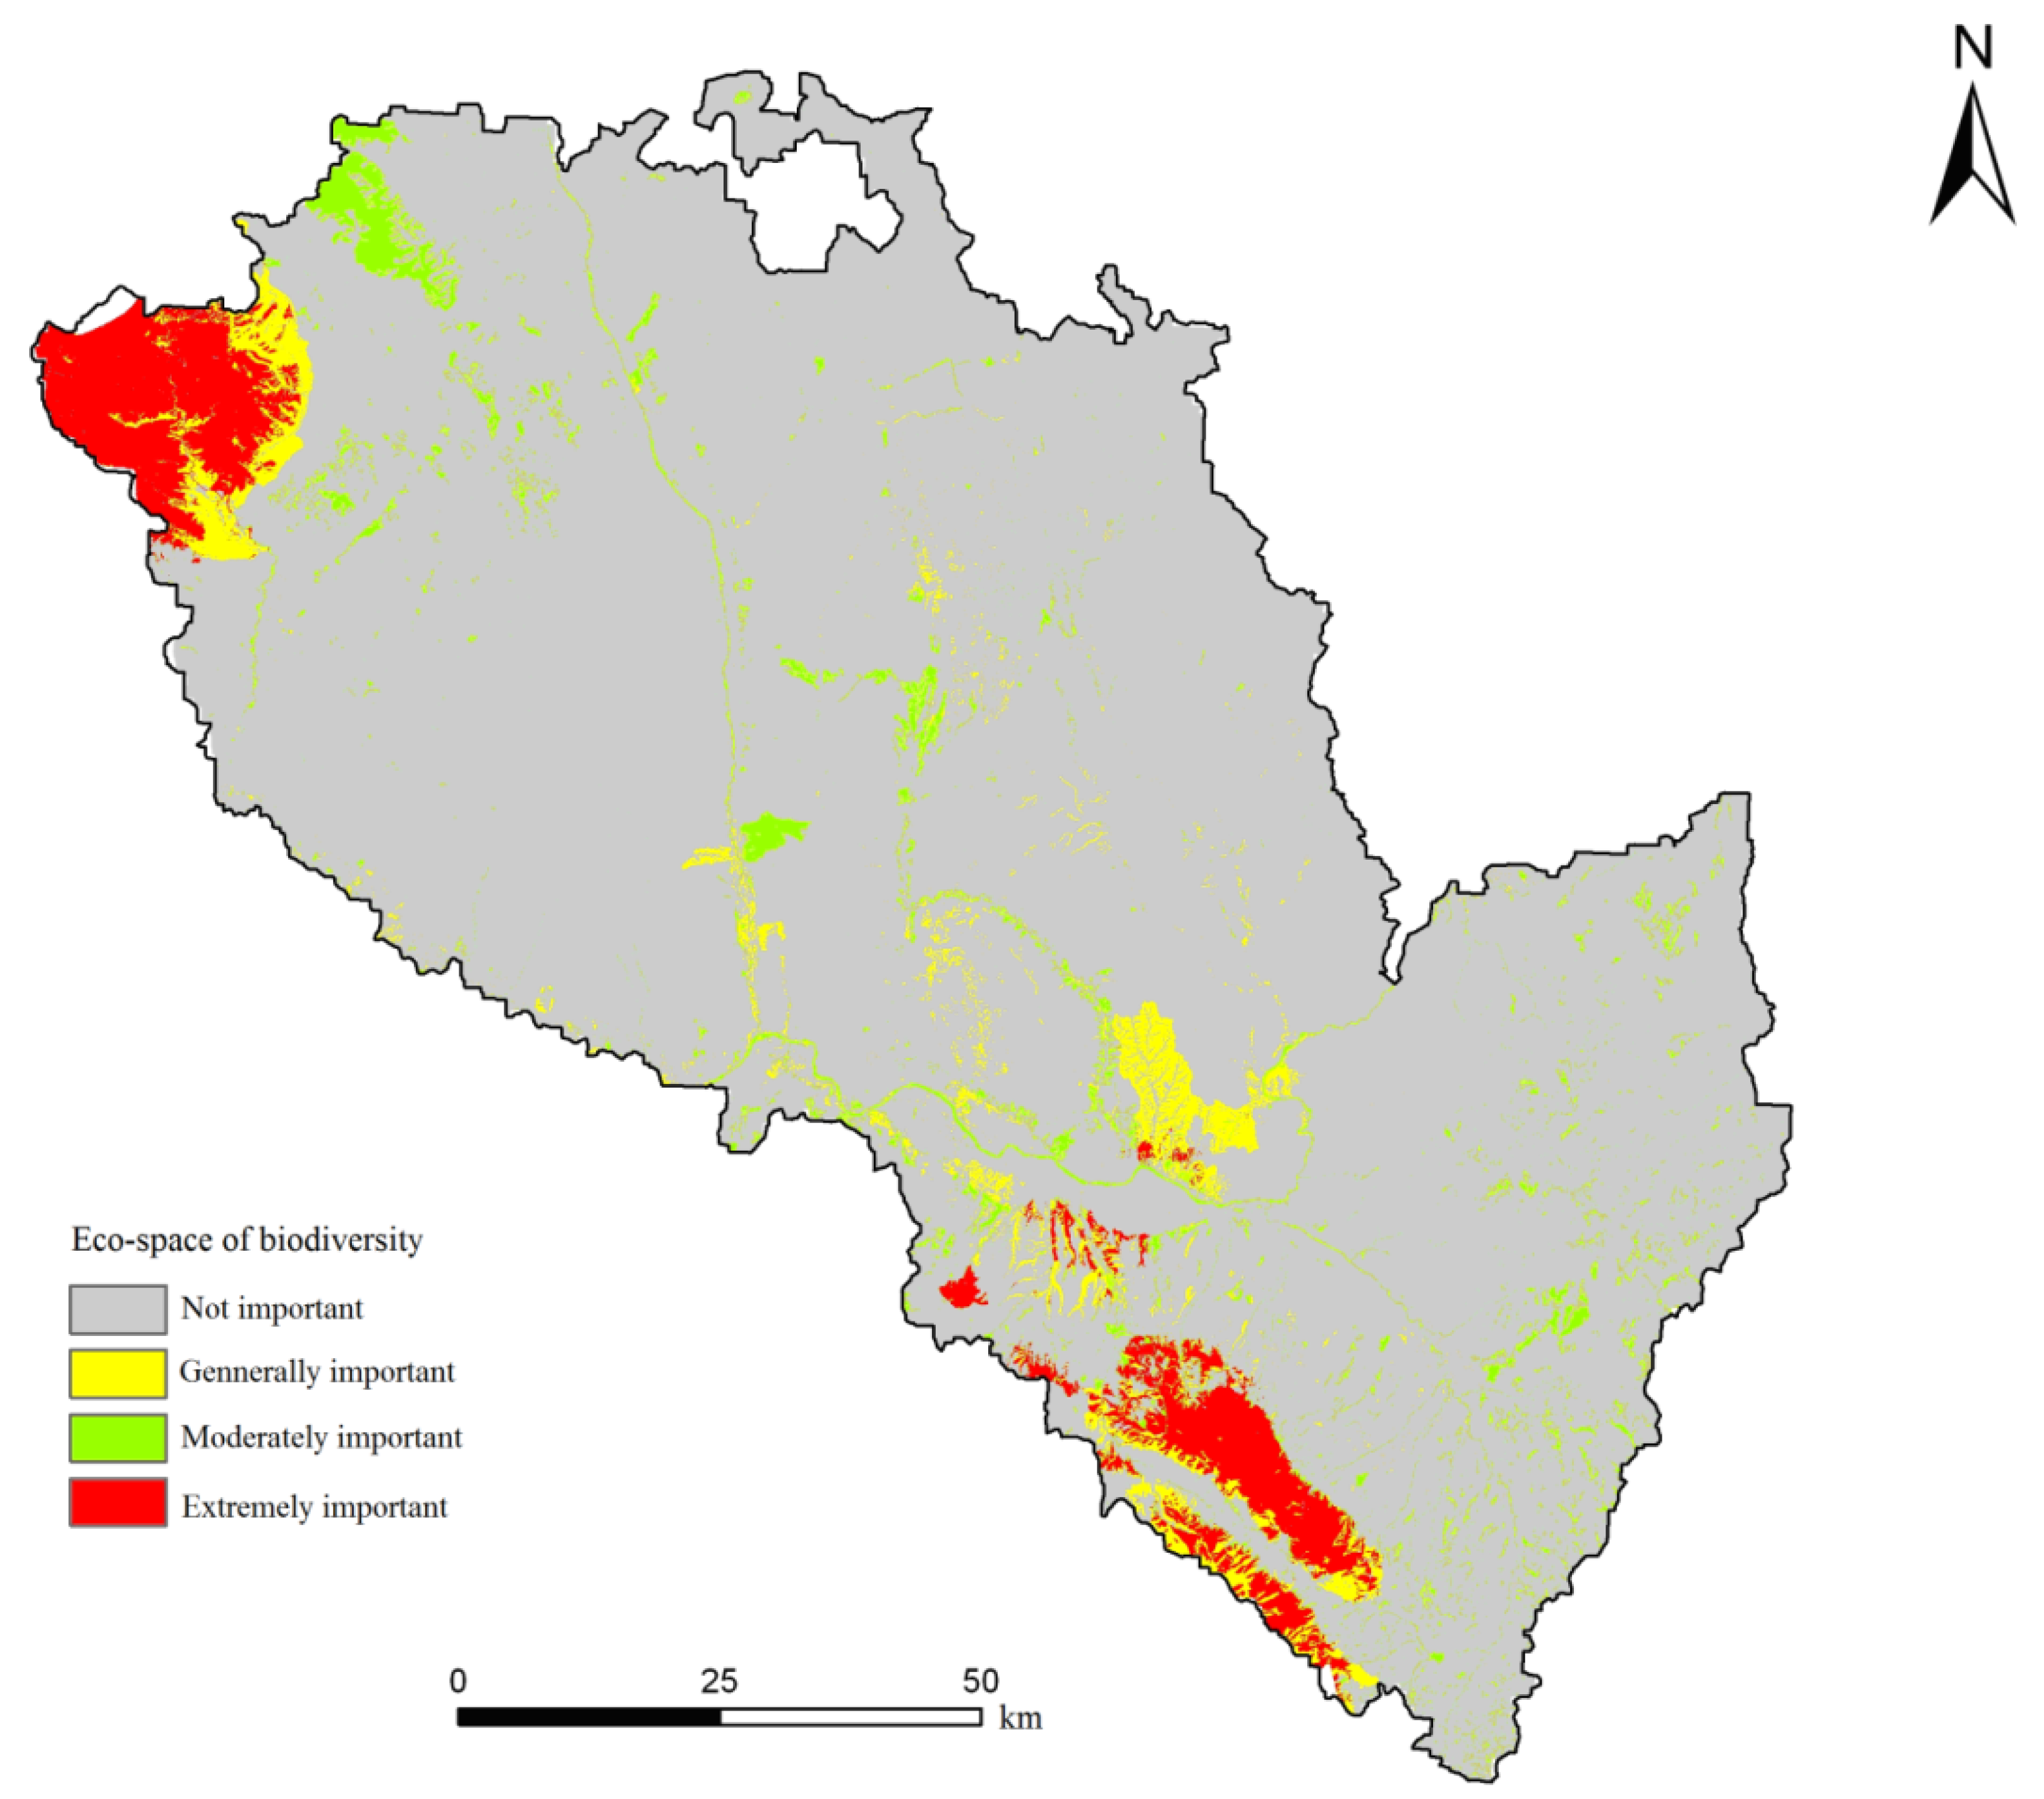
| Biodiversity conservation | Extremely important | 5,810.65 | 4.48 | 4.48 |
| Moderately important | 5,222.725 | 4.03 | 8.51 | |
| Generally important | 4,441.3 | 3.43 | 11.94 | |
| Not important | 114,109.675 | 88.06 | 100 | |
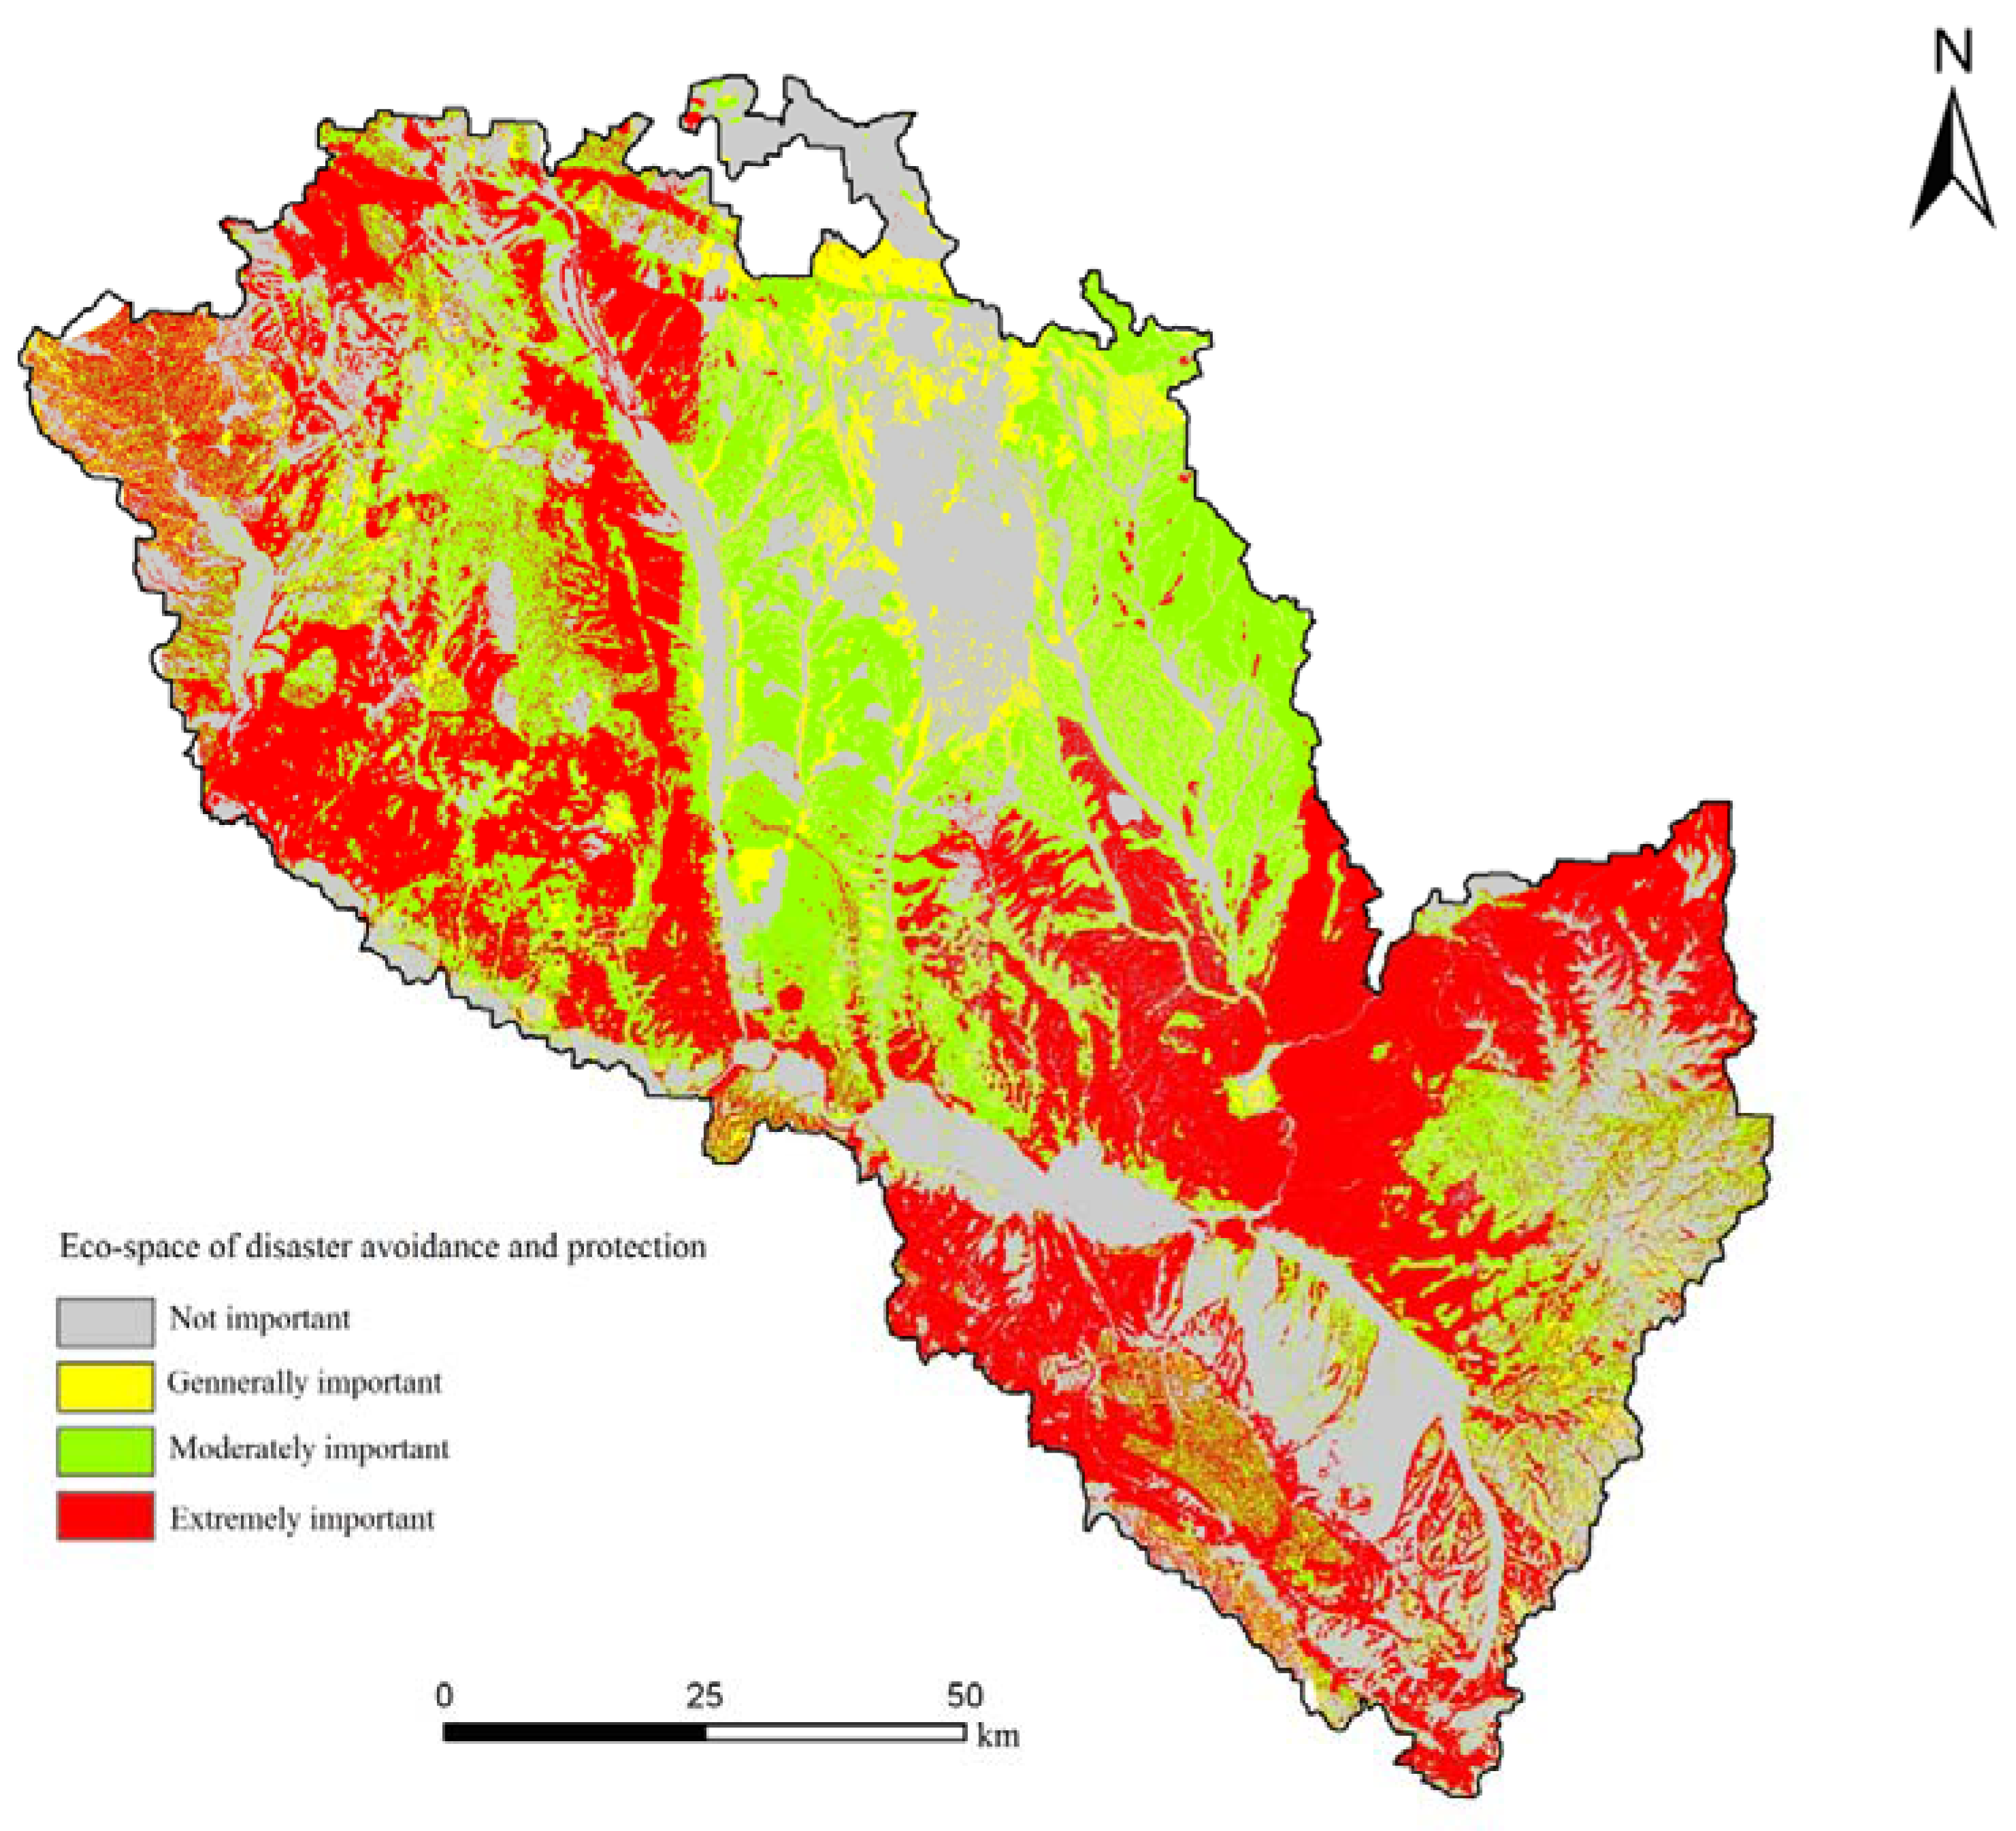
| Disaster avoidance and protection | Extremely important | 46,461.4 | 35.85 | 35.85 |
| Moderately important | 37,533.375 | 28.96 | 64.81 | |
| Generally important | 6,194.7 | 4.79 | 69.60 | |
| Not important | 39,394.875 | 30.40 | 100 | |
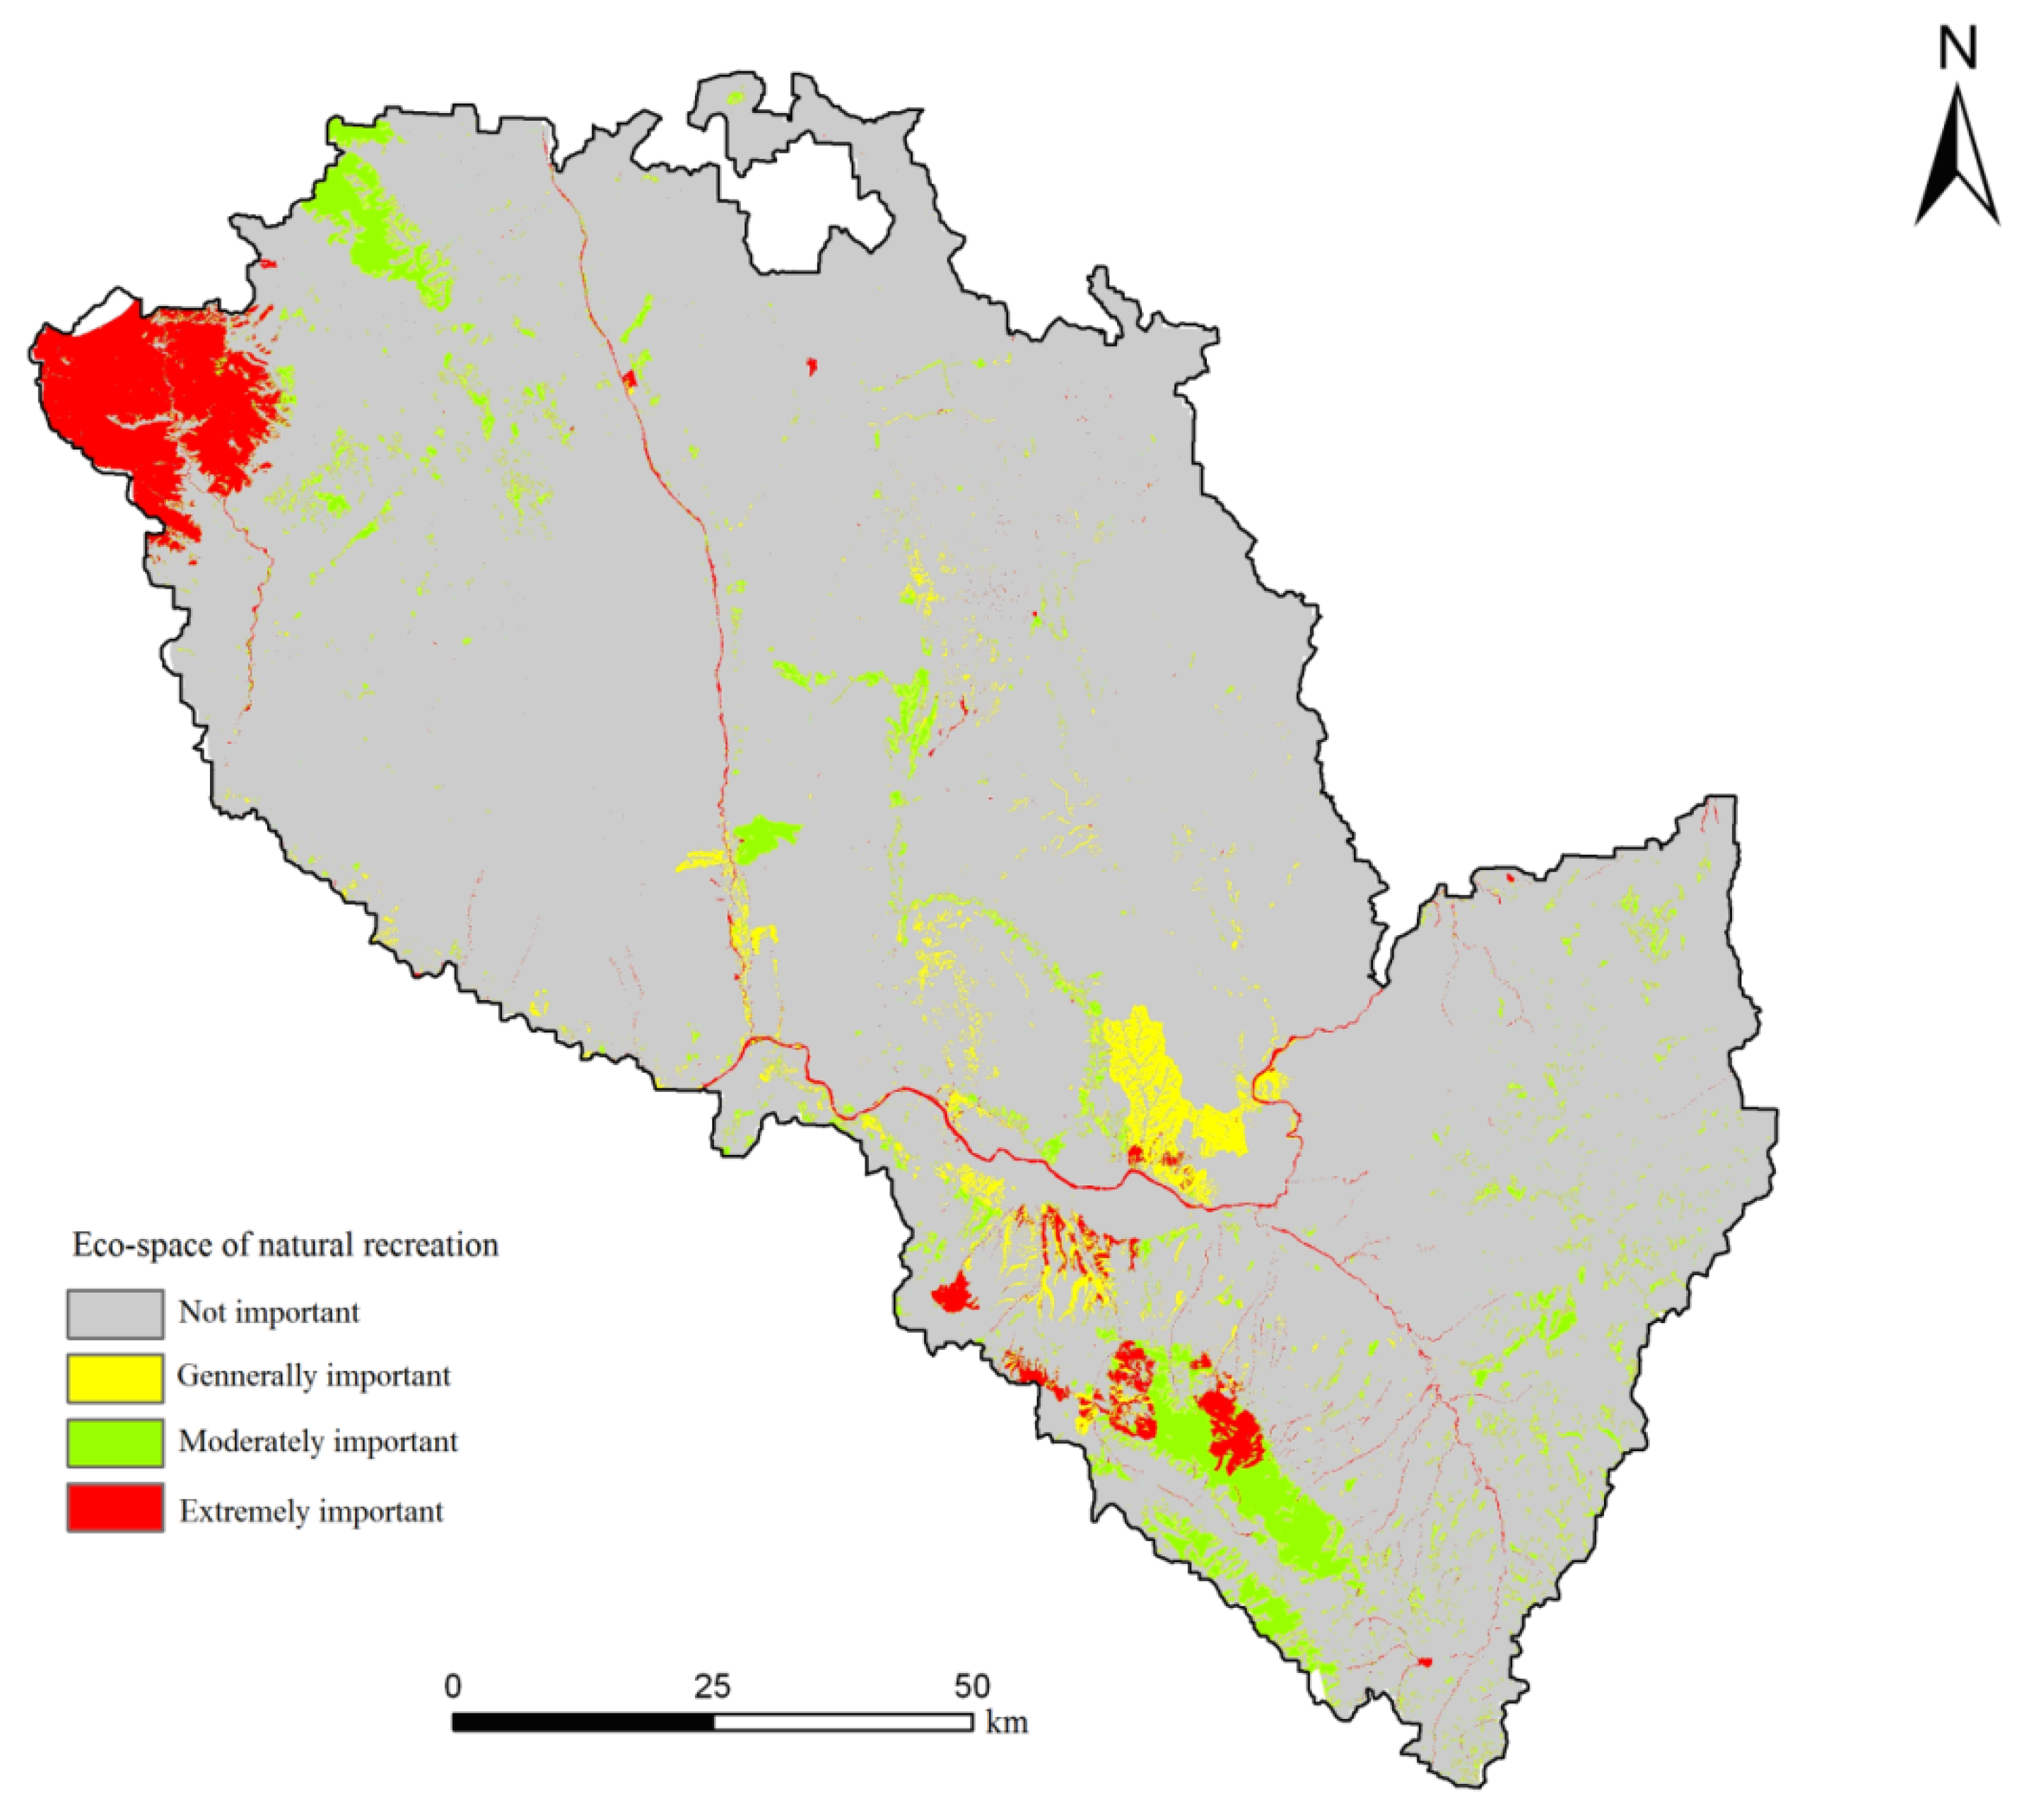
| Natural recreation | Extremely important | 4,688.425 | 3.62 | 3.62 |
| Moderately important | 6,289.425 | 4.85 | 8.47 | |
| Generally important | 2,435.725 | 1.88 | 10.35 | |
| Not important | 116,170.775 | 89.65 | 100 |


| Type of Key Eco-space | Areas (hm2) | Percentage of Total Area (%) | Cumulative Percentage of Total Area (%) |
|---|---|---|---|
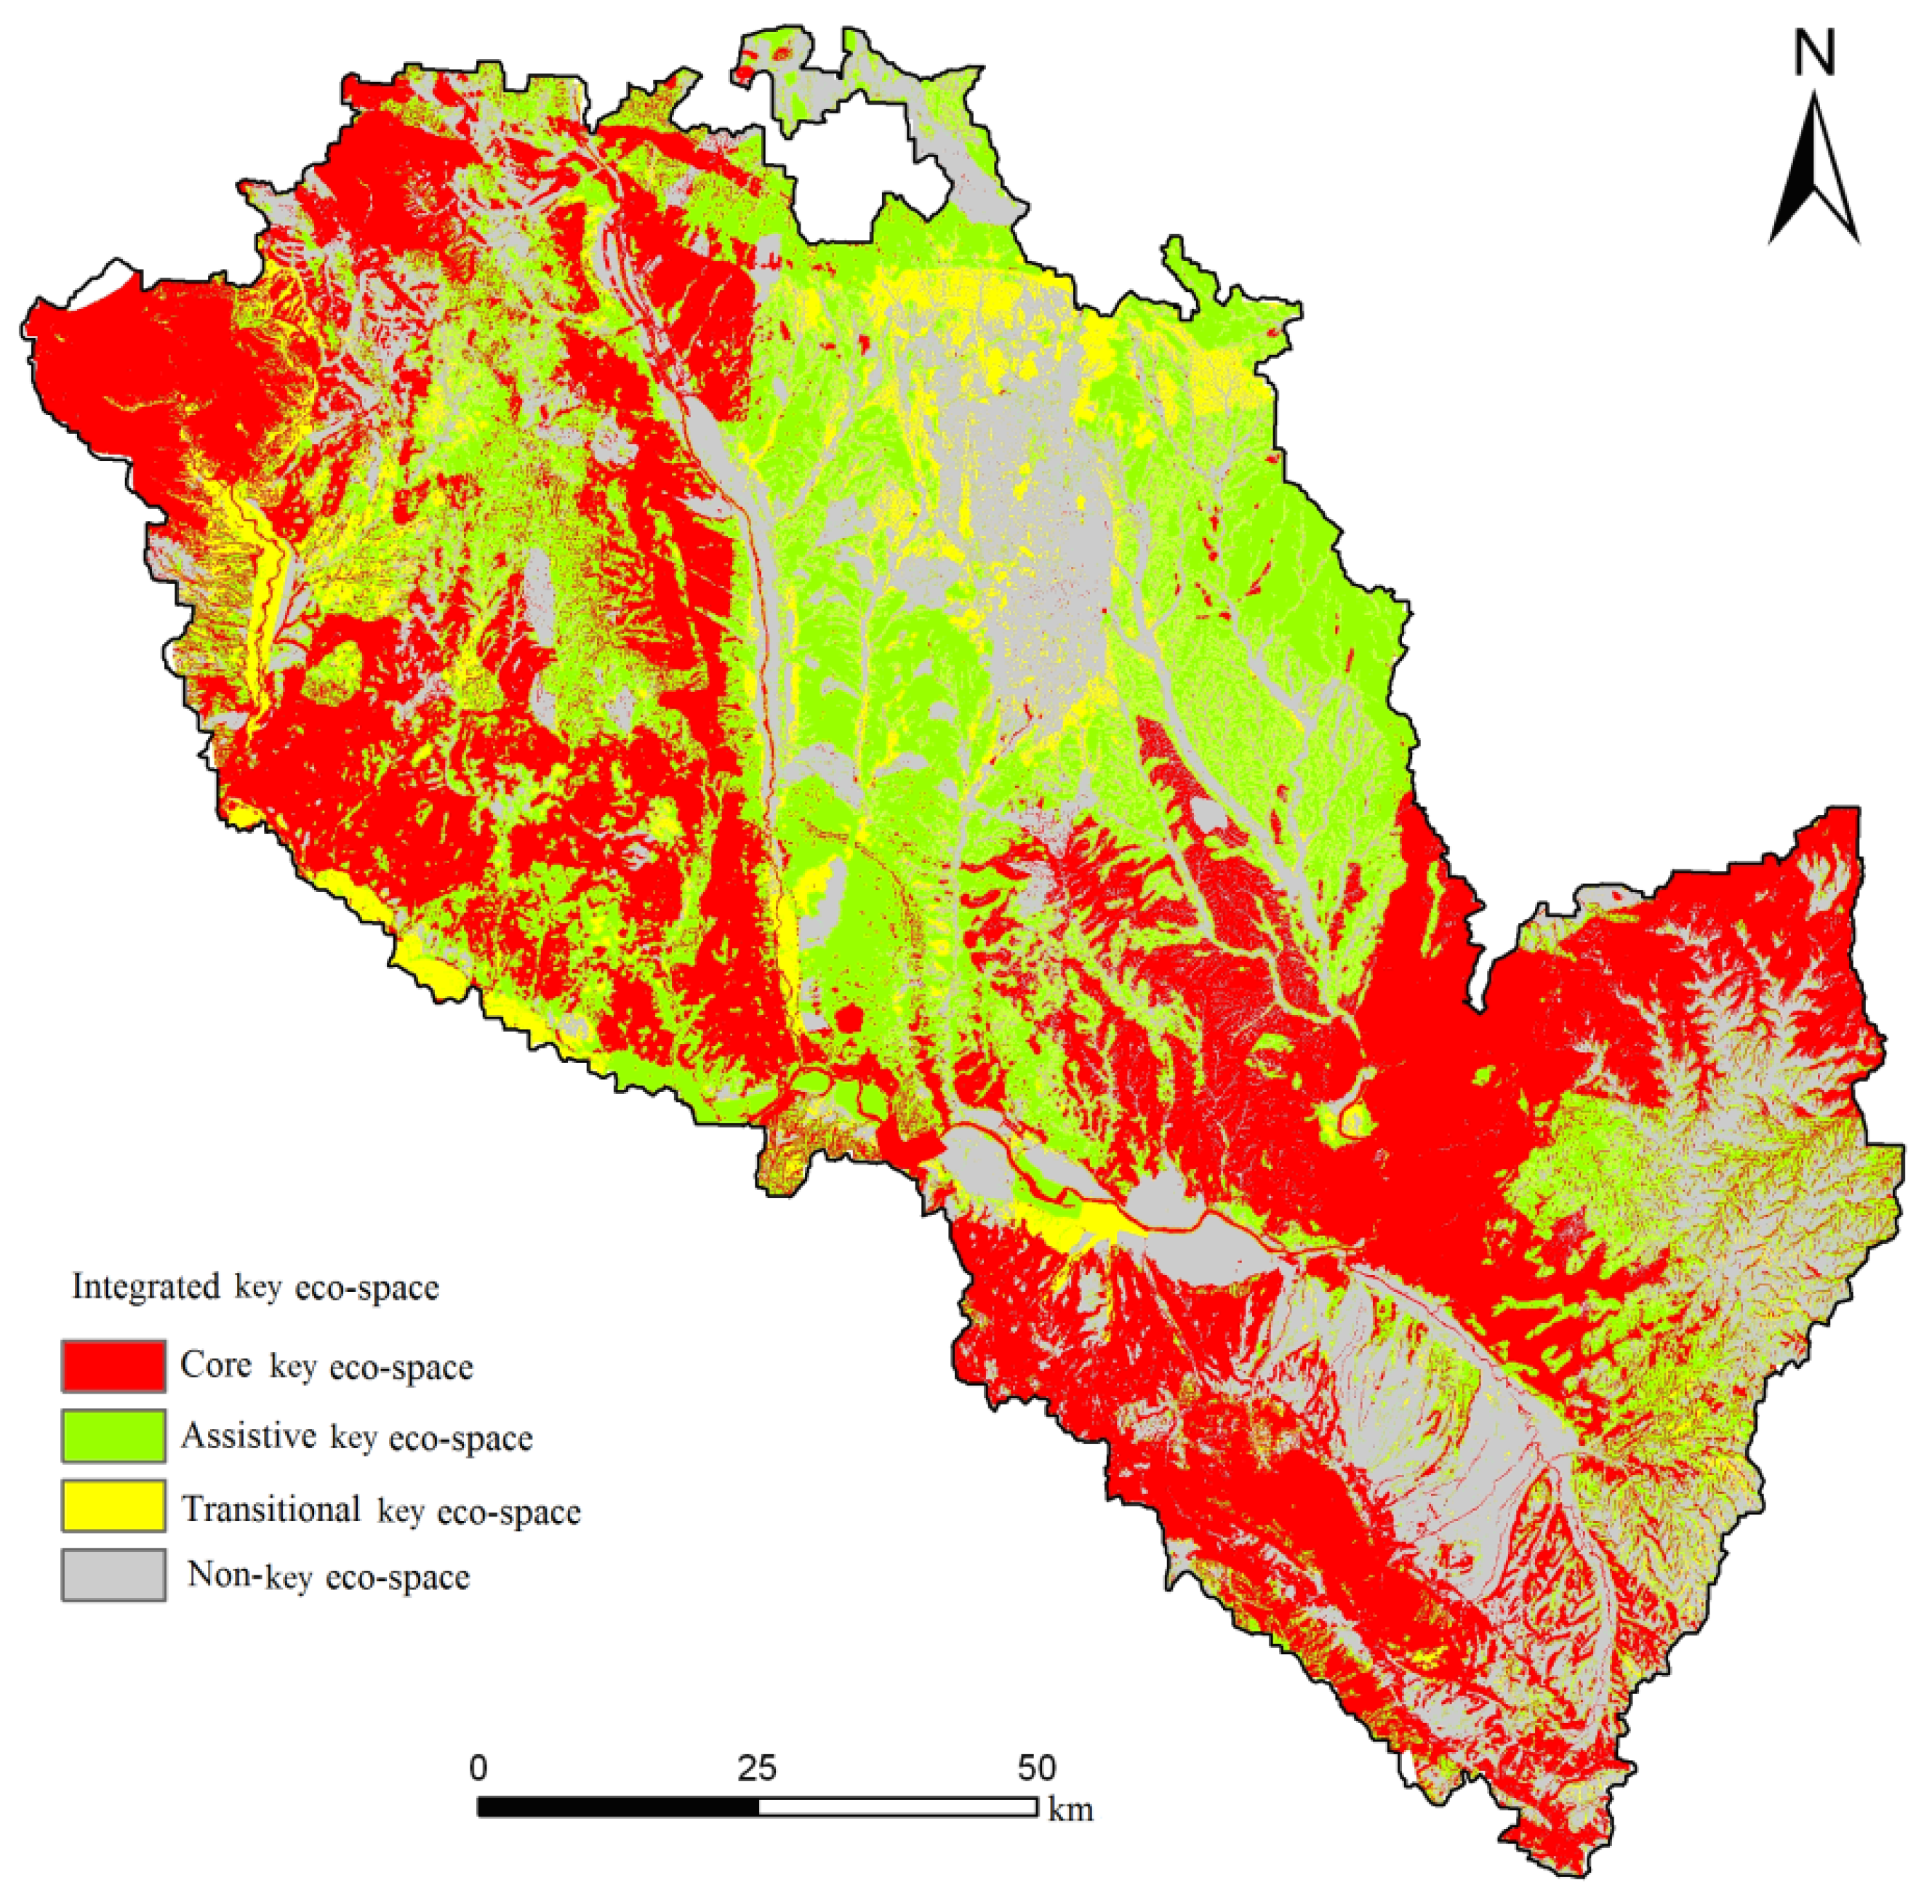
| Core key eco-space
(Baseline security level) | 50,908.7 | 39.29 | 39.29 |
| Assistive key eco-space
(Medium security level) | 39,004.95 | 30.10 | 69.39 |
| Transitional key eco-space
(Ideal security level) | 6,896.425 | 5.32 | 74.71 |
| Non-key eco-space | 32,774.275 | 25.29 | 100 |
5. Conclusions
Acknowledgments
Author Contributions
Conflicts of Interest
References
- Li, X.B. Core of global environmental change research: Frontier in land use and coverage change. Acta Geogr. Sin. 1996, 51, 553–558. [Google Scholar]
- Vitousek, P.M.; Mooney, H.A.; Lubchenco, J.; Melillo, J.M. Human domination of Earth’s ecosystems. Science 1997, 277, 494–499. [Google Scholar] [CrossRef]
- Eloy, L.; Meral, P.; Ludewigs, T.; Pinheiro, G.T.; Singer, B. Payments for ecosystem services in Amazonia. The challenge of land use heterogeneity in agricultural frontiers near Cruzeiro do Sul (Acre, Brazil). J. Environ. Plan. Manag. 2012, 55, 685–703. [Google Scholar] [CrossRef]
- Xie, H.L.; Kung, C.C.; Zhang, Y.T.; Li, X.B. Simulation of regionally ecological land based on a cellular automation model: A case study of Beijing, China. Int. J. Environ. Res. Public Health 2012, 9, 2986–3001. [Google Scholar] [CrossRef]
- Xie, H.L.; Zou, J.L.; Peng, X.L. Spatial-temporal difference analysis of cultivated land use intensity based on emergy in Poyang Lake Eco-economic Zone. Acta Geogr. Sin. 2012, 67, 889–902. [Google Scholar]
- Vimal, R.; Pluvinet, P.; Sacca, C.; Mazagol, P.O.; Etlicher, B.; Thompson, J.D. Exploring spatial patterns of vulnerability for diverse biodiversity descriptors in regional conservation planning. J. Environ. Manage. 2012, 95, 9–16. [Google Scholar] [CrossRef]
- Xue, D.; Zhang, X. Study on ecological space of urban agglomeration. Chinese Geogr. Sci. 2002, 12, 321–328. [Google Scholar]
- Rouget, M.; Cowling, R.M.; Pressey, R.L.; Richardson, D.M. Identifying spatial components of ecological and evolutionary processes for regional conservation planning in the Cape Floristic Region, South Africa. Divers. Distrib. 2003, 9, 191–210. [Google Scholar] [CrossRef]
- Brouwer, R.; van Ek, R. Integrated ecological, economic and social impact assessment of alternative flood control policies in the Netherlands. Ecol. Econ. 2004, 50, 1–21. [Google Scholar] [CrossRef]
- Moilanen, A.; Arponen, A. Administrative regions in conservation: Balancing local priorities with regional to global preferences in spatial planning. Biol. Conserv. 2011, 144, 1719–1725. [Google Scholar] [CrossRef]
- Orsi, F.; Church, R.L.; Geneletti, D. Restoring forest landscapes for biodiversity conservation and rural livelihoods: A spatial optimisation model. Environ. Modell. Softw. 2011, 26, 1622–1638. [Google Scholar] [CrossRef]
- Byomkesh, T.; Nakagoshi, N.; Dewan, A.M. Urbanization and green space dynamics in Greater Dhaka, Bangladesh. Landsc. Ecol. Eng. 2012, 8, 45–58. [Google Scholar] [CrossRef]
- Zhang, Y.; Wang, Q.; Li, B.J. Study on forecasting ecological land demand with carbon-oxygen balance method. China Land Sci. 2007, 27, 23–28. [Google Scholar]
- Wiersma, Y.F.; Nudds, T.D. Efficiency and effectiveness in representative reserve design in Canada: The contribution of existing protected areas. Biol. Conserv. 2009, 142, 1639–1646. [Google Scholar] [CrossRef]
- Smith, R.J.; Di Minin, E.; Linke, S.; Segan, D.B.; Possingham, H.P. An approach for ensuring minimum protected area size in systematic conservation planning. Biol. Conserv. 2010, 143, 2525–2531. [Google Scholar] [CrossRef]
- Nhancale, B.A.; Smith, R.J. The influence of planning unit characteristics on the efficiency and spatial pattern of systematic conservation planning assessments. Biodivers. Conserv. 2011, 20, 1821–1835. [Google Scholar] [CrossRef]
- Vos, C.C.; van der Hoek, D.C.J.; Vonk, M. Spatial planning of a climate adaptation zone for wetland ecosystems. Landsc. Ecol. 2010, 25, 1465–1477. [Google Scholar] [CrossRef]
- Zagas, T.D.; Raptis, D.I.; Zagas, D.T. Identifying and mapping the protective forests of southeast Mt. Olympus as a tool for sustainable ecological and silvicultural planning, in a multi-purpose forest management framework. Ecol. Eng. 2011, 37, 286–293. [Google Scholar] [CrossRef]
- Yu, K.J.; Qiao, Q.; Li, D.H. Ecological land use in three towns of eastern Beijing: A case study based on landscape security pattern analysis. Chinese J. Appl. Ecol. 2009, 20, 1932–1939. [Google Scholar]
- Wang, C.J.; Tang, X.H. A GIS-based study on the function of water conservation. Res. Soil Water Conserv. 2008, 15, 215–217. [Google Scholar]
© 2014 by the authors; licensee MDPI, Basel, Switzerland. This article is an open access article distributed under the terms and conditions of the Creative Commons Attribution license (http://creativecommons.org/licenses/by/3.0/).
Share and Cite
Xie, H.; Yao, G.; Wang, P. Identifying Regional Key Eco-Space to Maintain Ecological Security Using GIS. Int. J. Environ. Res. Public Health 2014, 11, 2550-2568. https://doi.org/10.3390/ijerph110302550
Xie H, Yao G, Wang P. Identifying Regional Key Eco-Space to Maintain Ecological Security Using GIS. International Journal of Environmental Research and Public Health. 2014; 11(3):2550-2568. https://doi.org/10.3390/ijerph110302550
Chicago/Turabian StyleXie, Hualin, Guanrong Yao, and Peng Wang. 2014. "Identifying Regional Key Eco-Space to Maintain Ecological Security Using GIS" International Journal of Environmental Research and Public Health 11, no. 3: 2550-2568. https://doi.org/10.3390/ijerph110302550