
Role of Metabolic Genes in Blood Aluminum Concentrations of Jamaican Children with and without Autism Spectrum Disorder

 ,
,
Abstract
:1. Introduction
2. Materials and Methods
2.1. General Description
2.2. Assessment of Aluminum Exposures
2.3. Genetic Analysis
2.4. Statistical Analysis
3. Results
4. Discussion
4.1. Blood Aluminum Concentrations in Jamaican Children
4.2. Blood Aluminum Concentrations and ASD
4.3. Role of GST Genes in Blood Aluminum Concentrations of Jamaican Children with and without ASD
5. Limitations
6. Conclusions
Acknowledgments
Author Contributions
Conflicts of Interest
References
- Exley, C. A biogeochemical cycle for aluminium? J. Inorg. Biochem. 2003, 97, 1–7. [Google Scholar] [CrossRef]
- Agency for Toxic Substances and Disease Registry (ATSDR). Toxicological Profile for Aluminum; ATSDR: Atlanta, GA, USA, 2008.
- Krewski, D.; Yokel, R.A.; Nieboer, E.; Borchelt, D.; Cohen, J.; Harry, J.; Kacew, S.; Lindsay, J.; Mahfouz, A.M.; Rondeau, V. Human health risk assessment for aluminium, aluminium oxide, and aluminium hydroxide. J. Toxicol. Environ. Health B Crit. Rev. 2007, 10 (Suppl. 1), 1–269. [Google Scholar] [CrossRef] [PubMed]
- Bruins, M.R.; Kapil, S.; Oehme, F.W. Microbial resistance to metals in the environment. Ecotoxicol. Environ. Saf. 2000, 45, 198–207. [Google Scholar] [CrossRef] [PubMed]
- Rosseland, B.O.; Eldhuset, T.D.; Staurnes, M. Environmental effects of aluminium. Environ. Geochem. Health 1990, 12, 17–27. [Google Scholar] [CrossRef] [PubMed]
- Lemire, J.; Mailloux, R.; Auger, C.; Whalen, D.; Appanna, V.D. Pseudomonas fluorescens orchestrates a fine metabolic-balancing act to counter aluminium toxicity. Environ. Microbiol. 2010, 12, 1384–1390. [Google Scholar] [PubMed]
- Delhaize, E.; Ma, J.F.; Ryan, P.R. Transcriptional regulation of aluminium tolerance genes. Trends Plant Sci. 2012, 17, 341–348. [Google Scholar] [CrossRef] [PubMed]
- Katyal, R.; Desigan, B.; Sodhi, C.P.; Ojha, S. Oral aluminum administration and oxidative injury. Biol. Trace Elem. Res. 1997, 57, 125–130. [Google Scholar] [CrossRef] [PubMed]
- Sparling, D.W.; Lowe, T.P. Environmental hazards of aluminum to plants, invertebrates, fish, and wildlife. Rev. Environ. Contam. Toxicol. 1996, 145, 1–127. [Google Scholar]
- Yokel, R.A. The toxicology of aluminum in the brain: A review. Neurotoxicology 2000, 21, 813–828. [Google Scholar] [PubMed]
- Shaw, C.A.; Seneff, S.; Kette, S.D.; Tomljenovic, L.; Oller, J.W., Jr.; Davidson, R.M. Aluminum-induced entropy in biological systems: Implications for neurological disease. J. Toxicol. 2014, 2014, 491316. [Google Scholar] [CrossRef] [PubMed]
- Ai-Ashmawy, M.A. Prevalence and public health significance of aluminum residues in milk and some dairy products. J. Food Sci. 2011, 76, T73–T76. [Google Scholar] [CrossRef] [PubMed]
- Weidenhamer, J.D.; Kobunski, P.A.; Kuepouo, G.; Corbin, R.W.; Gottesfeld, P. Lead exposure from aluminum cookware in Cameroon. Sci. Total Environ. 2014, 496, 339–347. [Google Scholar] [CrossRef] [PubMed]
- Agency for Toxic Substances and Disease Registry (ATSDR). Public Health Statement for Aluminum; ATSDR: Atlanta, GA, USA, 2008.
- Zatta, P.; Lain, E.; Cagnolini, C. Effects of aluminum on activity of krebs cycle enzymes and glutamate dehydrogenase in rat brain homogenate. Eur. J. Biochem. 2000, 267, 3049–3055. [Google Scholar] [CrossRef] [PubMed]
- Wu, Z.; Du, Y.; Xue, H.; Wu, Y.; Zhou, B. Aluminum induces neurodegeneration and its toxicity arises from increased iron accumulation and reactive oxygen species (ROS) production. Neurobiol. Aging 2012, 33, 199.e1–199.e12. [Google Scholar] [CrossRef] [PubMed]
- Prakash, D.; Gopinath, K.; Sudhandiran, G. Fisetin enhances behavioral performances and attenuates reactive gliosis and inflammation during aluminum chloride-induced neurotoxicity. Neuromol. Med. 2013, 15, 192–208. [Google Scholar] [CrossRef] [PubMed]
- Aremu, D.A.; Meshitsuka, S. Some aspects of astroglial functions and aluminum implications for neurodegeneration. Brain Res. Rev. 2006, 52, 193–200. [Google Scholar] [CrossRef] [PubMed]
- Schousboe, A. Role of astrocytes in the maintenance and modulation of glutamatergic and GABAergic neurotransmission. Neurochem. Res. 2003, 28, 347–352. [Google Scholar] [CrossRef] [PubMed]
- Campbell, A.; Hamai, D.; Bondy, S.C. Differential toxicity of aluminum salts in human cell lines of neural origin: Implications for neurodegeneration. Neurotoxicology 2001, 22, 63–71. [Google Scholar] [CrossRef]
- Abu Shmais, G.A.; Al-Ayadhi, L.Y.; Al-Dbass, A.M.; El-Ansary, A.K. Mechanism of nitrogen metabolism-related parameters and enzyme activities in the pathophysiology of autism. J. Neurodev. Disord. 2012, 4, 4. [Google Scholar] [CrossRef] [PubMed]
- Harada, M.; Taki, M.M.; Nose, A.; Kubo, H.; Mori, K.; Nishitani, H.; Matsuda, T. Non-invasive evaluation of the GABAergic/glutamatergic system in autistic patients observed by MEGA-editing proton MR spectroscopy using a clinical 3 tesla instrument. J. Autism Dev. Disord. 2011, 41, 447–454. [Google Scholar] [CrossRef] [PubMed]
- El-Ansary, A.; Al-Ayadhi, L. GABAergic/glutamatergic imbalance relative to excessive neuroinflammation in autism spectrum disorders. J. Neuroinflamm. 2014, 11, 189. [Google Scholar] [CrossRef] [PubMed]
- El-Ansary, A. Data of multiple regressions analysis between selected biomarkers related to glutamate excitotoxicity and oxidative stress in Saudi autistic patients. Data Brief 2016, 7, 111–116. [Google Scholar] [CrossRef] [PubMed]
- Rengel, Z. Aluminium cycling in the soil-plant-animal-human continuum. Biometals 2004, 17, 669–689. [Google Scholar] [CrossRef] [PubMed]
- Martin, R.B. The chemistry of aluminum as related to biology and medicine. Clin. Chem. 1986, 32, 1797–1806. [Google Scholar] [PubMed]
- Crichton, R.R.; Wilmet, S.; Legssyer, R.; Ward, R.J. Molecular and cellular mechanisms of iron homeostasis and toxicity in mammalian cells. J. Inorg. Biochem. 2002, 91, 9–18. [Google Scholar] [CrossRef]
- Oguz, E.O.; Enli, Y.; Sahin, B.; Gonen, C.; Turgut, G. Aluminium sulphate exposure increases oxidative stress and suppresses brain development in Ross broiler chicks. Med. Sci. Monit. 2012, 18, BR103–BR108. [Google Scholar] [CrossRef] [PubMed]
- Yuan, C.Y.; Lee, Y.J.; Hsu, G.S. Aluminum overload increases oxidative stress in four functional brain areas of neonatal rats. J. Biomed. Sci. 2012, 19, 51. [Google Scholar] [CrossRef]
- Sumathi, T.; Shobana, C.; Kumari, B.R.; Nandhini, D.N. Protective role of Cynodon dactylon in ameliorating the aluminium-induced neurotoxicity in rat brain regions. Biol. Trace Elem. Res. 2011, 144, 843–853. [Google Scholar]
- Hayes, J.D.; Pulford, D.J. The glutathione S-transferase supergene family: Regulation of GST and the contribution of the isoenzymes to cancer chemoprotection and drug resistance. Crit. Rev. Biochem. Mol. Biol. 1995, 30, 445–600. [Google Scholar] [PubMed]
- Salinas, A.E.; Wong, M.G. Glutathione S-transferases—A review. Curr. Med. Chem. 1999, 6, 279–309. [Google Scholar] [PubMed]
- Higgins, L.G.; Hayes, J.D. Mechanisms of induction of cytosolic and microsomal glutathione transferase (GST) genes by xenobiotics and pro-inflammatory agents. Drug Metab. Rev. 2011, 43, 92–137. [Google Scholar] [CrossRef] [PubMed]
- Josephy, P.D. Genetic variations in human glutathione transferase enzymes: Significance for pharmacology and toxicology. Hum. Genom. Proteom. 2010, 2010, 876940. [Google Scholar] [CrossRef] [PubMed]
- Seidegard, J.; Ekstrom, G. The role of human glutathione transferases and epoxide hydrolases in the metabolism of xenobiotics. Environ. Health Perspect. 1997, 105 (Suppl. 4), 791–799. [Google Scholar] [CrossRef] [PubMed]
- Nebert, D.W.; Vasiliou, V. Analysis of the glutathione S-transferase (GST) gene family. Hum. Genom. 2004, 1, 460–464. [Google Scholar] [CrossRef]
- Rossignol, D.A.; Genuis, S.J.; Frye, R.E. Environmental toxicants and autism spectrum disorders: A systematic review. Transl. Psychiatry 2014, 4, e360. [Google Scholar] [CrossRef] [PubMed]
- Gundacker, C.; Komarnicki, G.; Jagiello, P.; Gencikova, A.; Dahmen, N.; Wittmann, K.J.; Gencik, M. Glutathione-S-transferase polymorphism, metallothionein expression, and mercury levels among students in Austria. Sci. Total Environ. 2007, 385, 37–47. [Google Scholar] [CrossRef] [PubMed]
- Klautau-Guimarães, M.D.N.; DAscenção, R.; Caldart, F.A.; Grisolia, C.K.; de Souza, J.R.; Barbosa, A.C.; Cordeiro, C.M.T.; Ferrari, I. Analysis of genetic susceptibility to mercury contamination evaluated through molecular biomarkers in at-risk Amazon Amerindian populations. Genet. Mol. Biol. 2005, 28, 827–832. [Google Scholar] [CrossRef]
- Khanna, P.; Nehru, B. Antioxidant enzymatic system in neuronal and glial cells enriched fractions of rat brain after aluminum exposure. Cell. Mol. Neurobiol. 2007, 27, 959–969. [Google Scholar] [CrossRef] [PubMed]
- Halatek, T.; Trzcinka-Ochocka, M.; Matczak, W.; Gruchala, J. Serum Clara cell protein as an indicator of pulmonary impairment in occupational exposure at aluminum foundry. Int. J. Occup. Med. Environ. Health 2006, 19, 211–223. [Google Scholar] [CrossRef] [PubMed]
- Rahbar, M.H.; Samms-Vaughan, M.; Ma, J.; Bressler, J.; Loveland, K.A.; Ardjomand-Hessabi, M.; Dickerson, A.S.; Grove, M.L.; Shakespeare-Pellington, S.; Beecher, C.; et al. Role of Metabolic Genes in Blood Arsenic Concentrations of Jamaican Children with and without Autism Spectrum Disorder. Int. J. Environ. Res. Public Health 2014, 11, 7874–7895. [Google Scholar] [CrossRef] [PubMed]
- Rahbar, M.H.; Samms-Vaughan, M.; Ma, J.; Bressler, J.; Loveland, K.A.; Hessabi, M.; Dickerson, A.S.; Grove, M.L.; Shakespeare-Pellington, S.; Beecher, C.; et al. Interaction between GSTT1 and GSTP1 allele variants as a risk modulating-factor for autism spectrum disorders. Res. Autism Spectr. Disord. 2015, 12, 1–9. [Google Scholar] [CrossRef] [PubMed]
- Rahbar, M.H.; Samms-Vaughan, M.; Ma, J.; Bressler, J.; Dickerson, A.S.; Hessabi, M.; Loveland, K.A.; Grove, M.L.; Shakespeare-Pellington, S.; Beecher, C.; et al. Synergic effect of GSTP1 and blood manganese concentrations in Autism Spectrum Disorder. Res. Autism Spectr. Disord. 2015, 18, 73–82. [Google Scholar] [CrossRef] [PubMed]
- Mohamed, F.B.; Zaky, E.A.; El-Sayed, A.B.; Elhossieny, R.M.; Zahra, S.S.; Salah, E.W.; Youssef, W.Y.; Khaled, R.A.; Youssef, A.M. Assessment of Hair Aluminum, Lead, and Mercury in a Sample of Autistic Egyptian Children: Environmental Risk Factors of Heavy Metals in Autism. Behav. Neurol. 2015, 2015, 545674. [Google Scholar] [CrossRef] [PubMed]
- Yasuda, H.; Tsutsui, T. Assessment of infantile mineral imbalances in autism spectrum disorders (ASDs). Int. J. Environ. Res. Public Health 2013, 10, 6027–6043. [Google Scholar] [CrossRef] [PubMed]
- Blaurock-Busch, E.; Amin, O.R.; Dessoki, H.H.; Rabah, T. Toxic Metals and Essential Elements in Hair and Severity of Symptoms among Children with Autism. Maedica (Buchar) 2012, 7, 38–48. [Google Scholar] [PubMed]
- Blaurock-Busch, E.; Amin, O.R.; Rabah, T. Heavy metals and trace elements in hair and urine of a sample of arab children with autistic spectrum disorder. Maedica (Buchar) 2011, 6, 247–257. [Google Scholar] [PubMed]
- Fido, A.; Al-Saad, S. Toxic trace elements in the hair of children with autism. Autism 2005, 9, 290–298. [Google Scholar] [CrossRef] [PubMed]
- Al-Ayadhi, L.Y. Heavy metals and trace elements in hair samples of autistic children in central Saudi Arabia. Neurosciences (Riyadh) 2005, 10, 213–218. [Google Scholar] [PubMed]
- Albizzati, A.; More, L.; Di, C.D.; Saccani, M.; Lenti, C. Normal concentrations of heavy metals in autistic spectrum disorders. Minerva Pediatr. 2012, 64, 27–31. [Google Scholar]
- Lalor, G.C. Geochemical mapping in Jamaica. Environ. Geochem. Health 1996, 18, 89–97. [Google Scholar]
- Rahbar, M.H.; Samms-Vaughan, M.; Ardjomand-Hessabi, M.; Loveland, K.A.; Dickerson, A.S.; Chen, Z.; Bressler, J.; Shakespeare-Pellington, S.; Grove, M.L.; Bloom, K.; et al. The role of drinking water sources, consumption of vegetables and seafood in relation to blood arsenic concentrations of Jamaican children with and without Autism Spectrum Disorders. Sci. Total Environ. 2012, 433, 362–370. [Google Scholar] [CrossRef] [PubMed]
- Rahbar, M.H.; Samms-Vaughan, M.; Loveland, K.A.; Ardjomand-Hessabi, M.; Chen, Z.; Bressler, J.; Shakespeare-Pellington, S.; Grove, M.L.; Bloom, K.; Pearson, D.A.; et al. Seafood Consumption and Blood Mercury Concentrations in Jamaican Children With and Without Autism Spectrum Disorders. Neurotox. Res. 2013, 23, 22–38. [Google Scholar] [CrossRef] [PubMed]
- American Psychiatric Association. Diagnostic and Statistical Manual of Mental Disorders, 4th ed.; Text Revision (DSM-IV-TR); American Psychiatric Publishing, Inc.: Washington, DC, USA, 2000. [Google Scholar]
- Schopler, E.; Reichler, R.J.; DeVellis, R.F.; Daly, K. Toward objective classification of childhood autism: Childhood Autism Rating Scale (CARS). J. Autism Dev. Disord. 1980, 10, 91–103. [Google Scholar] [CrossRef] [PubMed]
- Lord, C.; Risi, S.; Lambrecht, L.; Cook, E.H., Jr.; Leventhal, B.L.; DiLavore, P.C.; Pickles, A.; Rutter, M. The autism diagnostic observation schedule-generic: A standard measure of social and communication deficits associated with the spectrum of autism. J. Autism Dev. Disord. 2000, 30, 205–223. [Google Scholar] [CrossRef] [PubMed]
- Rutter, M.; Le, C.A.; Lord, C. Autism Diagnostic Interview-Revised (ADI-R); Western Psychological Services: Los Angeles, CA, USA, 2003. [Google Scholar]
- Rutter, M.; Bailey, A.; Lord, C. The Social Communication Questionnaire; Western Psychological Services: Los Angeles, CA, USA, 2003. [Google Scholar]
- Mulligan, A.; Richardson, T.; Anney, R.J.; Gill, M. The Social Communication Questionnaire in a sample of the general population of school-going children. Ir. J. Med. Sci. 2009, 178, 193–199. [Google Scholar] [CrossRef] [PubMed]
- Analytical Research Laboratories. Aluminum Toxicity; Analytical Research Laboratories, Inc.: Oklahoma City, OK, USA, 1989. [Google Scholar]
- Wilhelm, M.; Passlick, J.; Busch, T.; Szydlik, M.; Ohnesorge, F.K. Scalp hair as an indicator of aluminium exposure: Comparison to bone and plasma. Hum. Toxicol. 1989, 8, 5–9. [Google Scholar] [CrossRef] [PubMed]
- Pineau, A.; Guillard, O.; Huguet, F.; Speich, M.; Gelot, S.; Boiteau, H.L. An evaluation of the biological significance of aluminium in plasma and hair of patients on long-term hemodialysis. Eur. J. Pharmacol. 1993, 228, 263–268. [Google Scholar] [CrossRef]
- Naylor, G.J.; Sheperd, B.; Treliving, L.; McHarg, A.; Smith, A.; Ward, N.; Harper, M. Tissue aluminum concentrations stability over time, relationship to age, and dietary intake. Biol. Psychiatry 1990, 27, 884–890. [Google Scholar] [CrossRef]
- Giddings, M.M.; Magara, Y.; Ohanian, E. Aluminium in Drinking-Water, Background Document for Development of WHO Guidelines for Drinking-Water Quality; World Health Organization: Geneva, Switzerland, 2010. [Google Scholar]
- Zeager, M.; Woolf, A.D.; Goldman, R.H. Wide variation in reference values for aluminum levels in children. Pediatrics 2012, 129, e142–e147. [Google Scholar] [CrossRef] [PubMed]
- Dols, M.; Chartier, J.; Lem, P. Compatibility of the PUREGENE DNA Purification Kit with the Oragene Self-Collection Kit; DNA Genotek Inc.: Kanata, ON, Canada, 2014; pp. 3–6. [Google Scholar]
- Li, R.; Boerwinkle, E.; Olshan, A.F.; Chambless, L.E.; Pankow, J.S.; Tyroler, H.A.; Bray, M.; Pittman, G.S.; Bell, D.A.; Heiss, G. Glutathione S-transferase genotype as a susceptibility factor in smoking-related coronary heart disease. Atherosclerosis 2000, 149, 451–462. [Google Scholar] [CrossRef]
- Kleinbaum, D.G.; Klein, M. Logistic Regression: A Self-Learning Text, 3rd ed.; Springer: New York, NY, USA, 2010. [Google Scholar]
- SAS Institute Inc. SAS® 9.4; SAS Institute Inc.: Cary, NC, USA, 2013. [Google Scholar]
- House, R.A. Factors affecting plasma aluminum concentrations in nonexposed workers. J. Occup. Med. 1992, 34, 1013–1017. [Google Scholar] [PubMed]
- Liao, Y.H.; Yu, H.S.; Ho, C.K.; Wu, M.T.; Yang, C.Y.; Chen, J.R.; Chang, C.C. Biological monitoring of exposures to aluminium, gallium, indium, arsenic, and antimony in optoelectronic industry workers. J. Occup. Environ. Med. 2004, 46, 931–936. [Google Scholar] [CrossRef] [PubMed]
- Al-Saleh, I.; Shinwari, N. Aluminum in Saudi children. Biometals 1996, 9, 385–392. [Google Scholar] [CrossRef] [PubMed]
- Nicolescu, R.; Petcu, C.; Cordeanu, A.; Fabritius, K.; Schlumpf, M.; Krebs, R.; Kramer, U.; Winneke, G. Environmental exposure to lead, but not other neurotoxic metals, relates to core elements of ADHD in Romanian children: Performance and questionnaire data. Environ. Res. 2010, 110, 476–483. [Google Scholar] [CrossRef] [PubMed]
- Hewitt, C.D.; Day, J.P. Aluminium and copper concentrations in hair and serum are unrelated in renal patients. Acta Pharmacol. Toxicol. (Copenh) 1986, 59 (Suppl. 7), 442–445. [Google Scholar] [CrossRef] [PubMed]


| Variables | Categories | ASD Case (n = 116) N (%) | TD Control (n = 116) N (%) | p-Value * |
|---|---|---|---|---|
| Child’s sex | Male | 99 (85.3) | 99 (85.3) | 1.00 |
| Child’s age (months) | Age < 48 | 22 (19.0) | 19 (16.4) | 0.29 |
| 48 ≤ age < 72 | 51 (44.0) | 52 (44.8) | ||
| Age ≥ 72 | 43 (37.0) | 45 (38.8) | ||
| Child’s race | Afro-Caribbean | 108 (93.1) | 115 (99.1) | 0.19 |
| Maternal age a (at child’s birth) | <35 years | 87 (75.0) | 100 (99.1) | <0.01 |
| ≥35 years | 29 (25.0) | 11 (9.0) | ||
| Paternal age b (at child’s birth) | <35 years | 57 (50.9) | 78 (72.9) | <0.01 |
| ≥35 years | 55 (49.1) | 29 (27.1) | ||
| Maternal race | Afro-Caribbean | 109 (94.0) | 115 (99.1) | 0.25 |
| Paternal race c | Afro-Caribbean | 109 (94.0) | 113 (98.3) | 0.82 |
| Maternal education d (at child’s birth) | Up to high school † | 59 (50.9) | 87 (77.0) | <0.01 |
| Beyond high school †† | 57 (49.1) | 26 (23.0) | ||
| Paternal education e (at child’s birth) | Up to high school † | 61 (54.0) | 98 (88.3) | <0.01 |
| Beyond high school †† | 52 (46.0) | 13 (11.7) | ||
| Socioeconomic status (SES) | Car ownership | 77 (66.4) | 41 (35.3) | <0.01 |
| GSTP1 h | Ile/Ile | 30 (28.3) | 26 (24.5) | 0.71 |
| Ile/Val | 55 (51.9) | 55 (51.9) | ||
| Val/Val | 21 (19.8) | 25 (23.6) | ||
| GSTM1 h | DD f | 28 (26.4) | 27 (25.5) | 0.87 |
| I/I or I/D g | 78 (73.6) | 79 (74.5) | ||
| GSTT1 h | DD f | 31 (29.2) | 22 (20.8) | 0.16 |
| I/I or I/D g | 75 (70.8) | 84 (79.2) | ||
| Blood aluminum concentration (µg/L) Arithmetic mean (SD) | 30.9 (29.8) | 36.9 (40.0) | 0.71 ** | |
| Exposure Variables | Category | ASD Case N (%) | TD Control N (%) | Matched OR (MOR) | 95% CI for MOR | p-Value d | |
|---|---|---|---|---|---|---|---|
| Source of drinking water a | Piped water | 110 (94.8) | 111 (96.5) | 0.67 | (0.19, 2.36) | 0.53 | |
| Source of water for cooking b | Piped water | 110 (94.8) | 111 (96.5) | 0.67 | (0.19, 2.36) | 0.53 | |
| Fruits and vegetables consumption c | Root vegetables | Yam, sweet potato, or dasheen | 82 (78.7) | 95 (82.6) | 0.48 | (0.25, 0.93) | 0.03 |
| Carrot or pumpkin | 101 (87.1) | 113 (98.3) | 0.14 | (0.03, 0.63) | 0.01 | ||
| Leafy vegetables | Lettuce | 53 (45.7) | 73 (63.5) | 0.53 | (0.33, 0.88) | 0.01 | |
| Callaloo, broccoli, or pakchoi | 84 (72.4) | 108 (93.9) | 0.22 | (0.10, 0.50) | <0.01 | ||
| Cabbage | 77 (66.4) | 108 (93.9) | 0.18 | (0.08, 0.40) | <0.01 | ||
| Fruits | Tomatoes | 72 (62.1) | 96 (83.5) | 0.29 | (0.14, 0.58) | <0.01 | |
| Ackee | 68 (58.6) | 107 (93.0) | 0.05 | (0.01, 0.20) | <0.01 | ||
| Avocado | 31 (26.7) | 77 (67.0) | 0.18 | (0.09, 0.35) | <0.01 | ||
| Green banana | 82 (70.7) | 103 (89.6) | 0.28 | (0.14, 0.55) | <0.01 | ||
| Fried plantains | 77 (66.4) | 104 (90.4) | 0.19 | (0.07, 0.48) | <0.01 | ||
| Seafood consumption | Ate salt water fish | 90 (77.6) | 104 (89.7) | 0.39 | (0.18, 0.85) | 0.02 | |
| Ate fresh water fish (Pond fish, Tilapia) | 50 (43.1) | 65 (56.0) | 0.56 | (0.32, 0.98) | 0.04 | ||
| Ate sardine, mackerel (Canned fish) | 87 (75.0) | 107 (92.2) | 0.26 | (0.11, 0.60) | <0.01 | ||
| Ate tuna (Canned fish) | 40 (34.5) | 50 (43.1) | 0.67 | (0.38, 1.17) | 0.16 | ||
| Ate salted fish (Pickled mackerel) | 82 (70.7) | 106 (91.4) | 0.20 | (0.08, 0.48) | <0.01 | ||
| Ate shellfish (Lobsters, Crabs) | 8 (6.9) | 16 (13.8) | 0.43 | (0.17, 1.12) | 0.08 | ||
| Ate shrimp | 24 (20.7) | 33 (28.40) | 0.64 | (0.34, 1.20) | 0.16 | ||
| Variables | Category | Yes | No | p-Value ** | |||
|---|---|---|---|---|---|---|---|
| Mean Al * (μg/L) | N | Mean Al * (μg/L) | N | ||||
| Genes a | GSTT1 (I *) b | 22.91 | 157 | 23.02 | 55 | 0.98 | |
| GSTM1 (I *) b | 25.99 | 159 | 22.03 | 53 | 0.31 | ||
| GSTP1 (Ile/Ile) c | 22.39 | 56 | 24.76 | 156 | 0.54 | ||
| GSTP1 (Val/Val) c | 18.43 | 46 | 24.45 | 166 | 0.10 | ||
| GSTP1 (Ile/Val) c | 24.25 | 110 | 21.71 | 102 | 0.43 | ||
| ASD status | Autism Spectrum Disorder | 21.49 | 116 | 20.95 | 116 | 0.78 | |
| Child’s age (months) | Age > 48 | 22.12 | 191 | 17.49 | 41 | 0.62 | |
| Child’s sex | Male | 21.19 | 198 | 21.39 | 34 | 0.96 | |
| Socioeconomic status | Own a car | 22.35 | 118 | 20.11 | 114 | 0.44 | |
| Maternal age d (at child’s birth) | ≥35 years | 22.76 | 40 | 20.93 | 187 | 0.65 | |
| Parental education levels e (at child’s birth) | At least one of the parents had education beyond high school | 23.39 | 108 | 18.36 | 113 | 0.06 | |
| Source of drinking water f | Piped water | 20.93 | 221 | 26.93 | 10 | 0.43 | |
| Fruits and vegetables consumption g | Root vegetables | Yam, sweet potato, or dasheen | 22.37 | 177 | 17.83 | 54 | 0.16 |
| Carrot or pumpkin | 21.14 | 214 | 22.23 | 17 | 0.85 | ||
| Leafy vegetables | Lettuce | 21.43 | 126 | 20.98 | 105 | 0.86 | |
| Callaloo, broccoli, or pak choi | 21.24 | 192 | 21.15 | 39 | 0.98 | ||
| Cabbage | 20.92 | 185 | 22.53 | 46 | 0.65 | ||
| Fruits | Tomatoes | 22.06 | 168 | 19.14 | 63 | 0.38 | |
| Ackee | 21.92 | 175 | 19.23 | 56 | 0.48 | ||
| Avocado | 24.12 | 108 | 18.97 | 123 | 0.10 | ||
| Green banana | 22.10 | 181 | 18.30 | 50 | 0.22 | ||
| Fried plantains | 21.71 | 185 | 19.36 | 46 | 0.55 | ||
| Seafood consumption | High seafood consumption (more than 6 meals per week) | 23.20 | 82 | 20.21 | 150 | 0.35 | |
| Ate salt water fish | 22.04 | 194 | 17.46 | 38 | 0.20 | ||
| Ate fresh water fish (pond fish, tilapia) | 20.40 | 115 | 22.05 | 117 | 0.58 | ||
| Ate sardine, mackerel (canned fish) | 21.83 | 194 | 18.37 | 38 | 0.34 | ||
| Ate tuna (canned fish) | 24.63 | 90 | 19.31 | 142 | 0.09 | ||
| Ate salted fish (pickled mackerel) | 21.43 | 188 | 20.34 | 44 | 0.77 | ||
| Ate shellfish (lobsters, crabs) | 16.97 | 24 | 21.77 | 208 | 0.27 | ||
| Ate shrimp | 20.69 | 57 | 21.39 | 175 | 0.83 | ||
| Models | Gene | (Column A) Genotypes Compared | Referent Genotypes | Group | Unadjusted (μg/L) ** | Adjusted (μg/L) c | ||||
|---|---|---|---|---|---|---|---|---|---|---|
| Geometric Mean Al of Children with Genotypes in Column A * | Geometric Mean Al of Children with Referent Genotypes * | p d | Geometric Mean Al of Children with Genotypes in Column A * | Geometric Mean Al of Children with Referent Genotypes * | p d | |||||
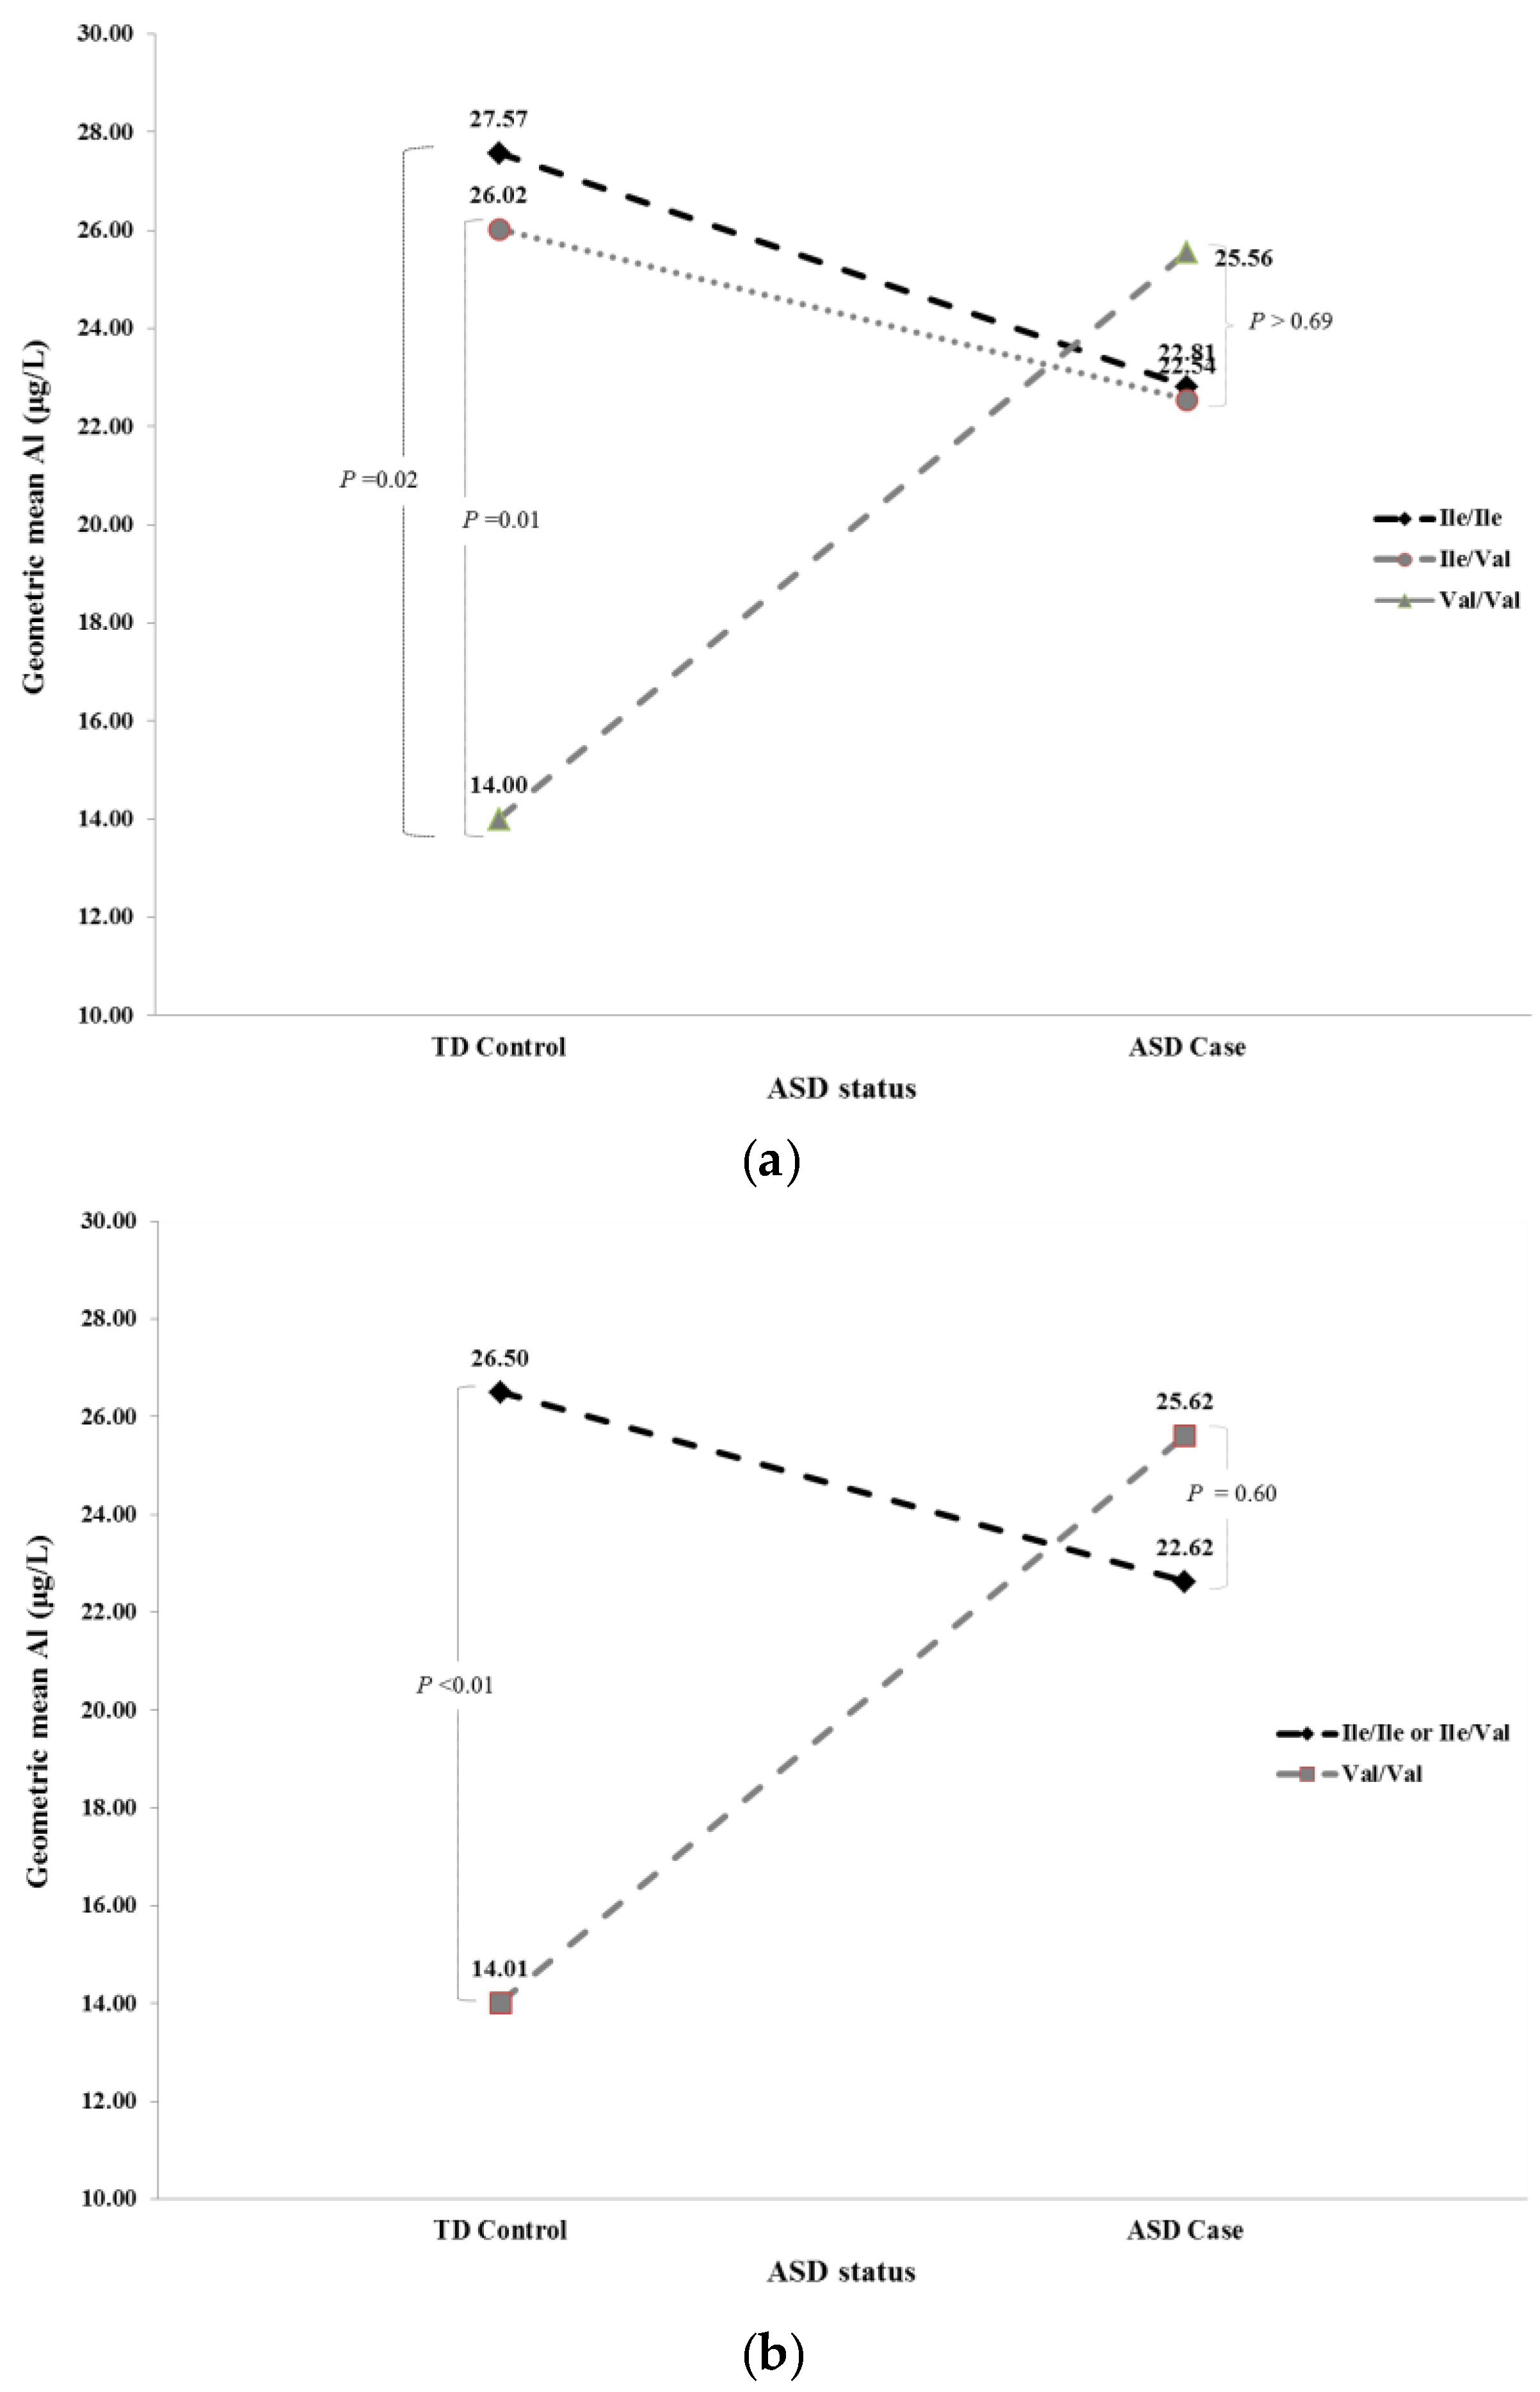
| Full a | GSTP1 | Ile/Ile | Ile/Val | TD Control | 27.57 | 26.02 | 0.81 | 24.19 | 23.39 | 0.89 |
| GSTP1 | Ile/Ile | Ile/Val | ASD Case | 22.81 | 22.54 | 0.96 | 21.71 | 23.16 | 0.77 | |
| GSTP1 | Ile/Ile | Val/Val | TD Control | 27.57 | 14.00 | 0.02 | 24.19 | 14.60 | 0.07 | |
| GSTP1 | Ile/Ile | Val/Val | ASD Case | 22.81 | 25.56 | 0.69 | 21.71 | 24.39 | 0.68 | |
| GSTP1 | Ile/Val | Val/Val | TD Control | 26.02 | 14.00 | 0.01 | 23.39 | 14.60 | 0.05 | |
| GSTP1 | Ile/Val | Val/Val | ASD Case | 22.54 | 25.56 | 0.62 | 23.16 | 24.39 | 0.84 | |
| Recessive b | GSTP1REC | Ile/Ile or Ile/Val | Val/Val | TD Control | 26.50 | 14.01 | <0.01 | 23.75 | 14.57 | 0.03 |
| GSTP1REC | Ile/Ile or Ile/Val | Val/Val | ASD Case | 22.62 | 25.62 | 0.60 | 22.62 | 24.38 | 0.76 | |
| Models | (Column A) Group Compared | Referent Group | GSTP1 Genotypes | Unadjusted Interactive Model (μg/L) ** | Adjusted Interactive Model (μg/L) c | ||||
|---|---|---|---|---|---|---|---|---|---|
| Geometric Mean Al of Children with Group Compared in Column A * | Geometric Mean Al of Children with Referent Group * | p d | Geometric Mean Al of Children with Group Compared in Column A * | Geometric Mean Al of Children with Referent Group * | p d | ||||
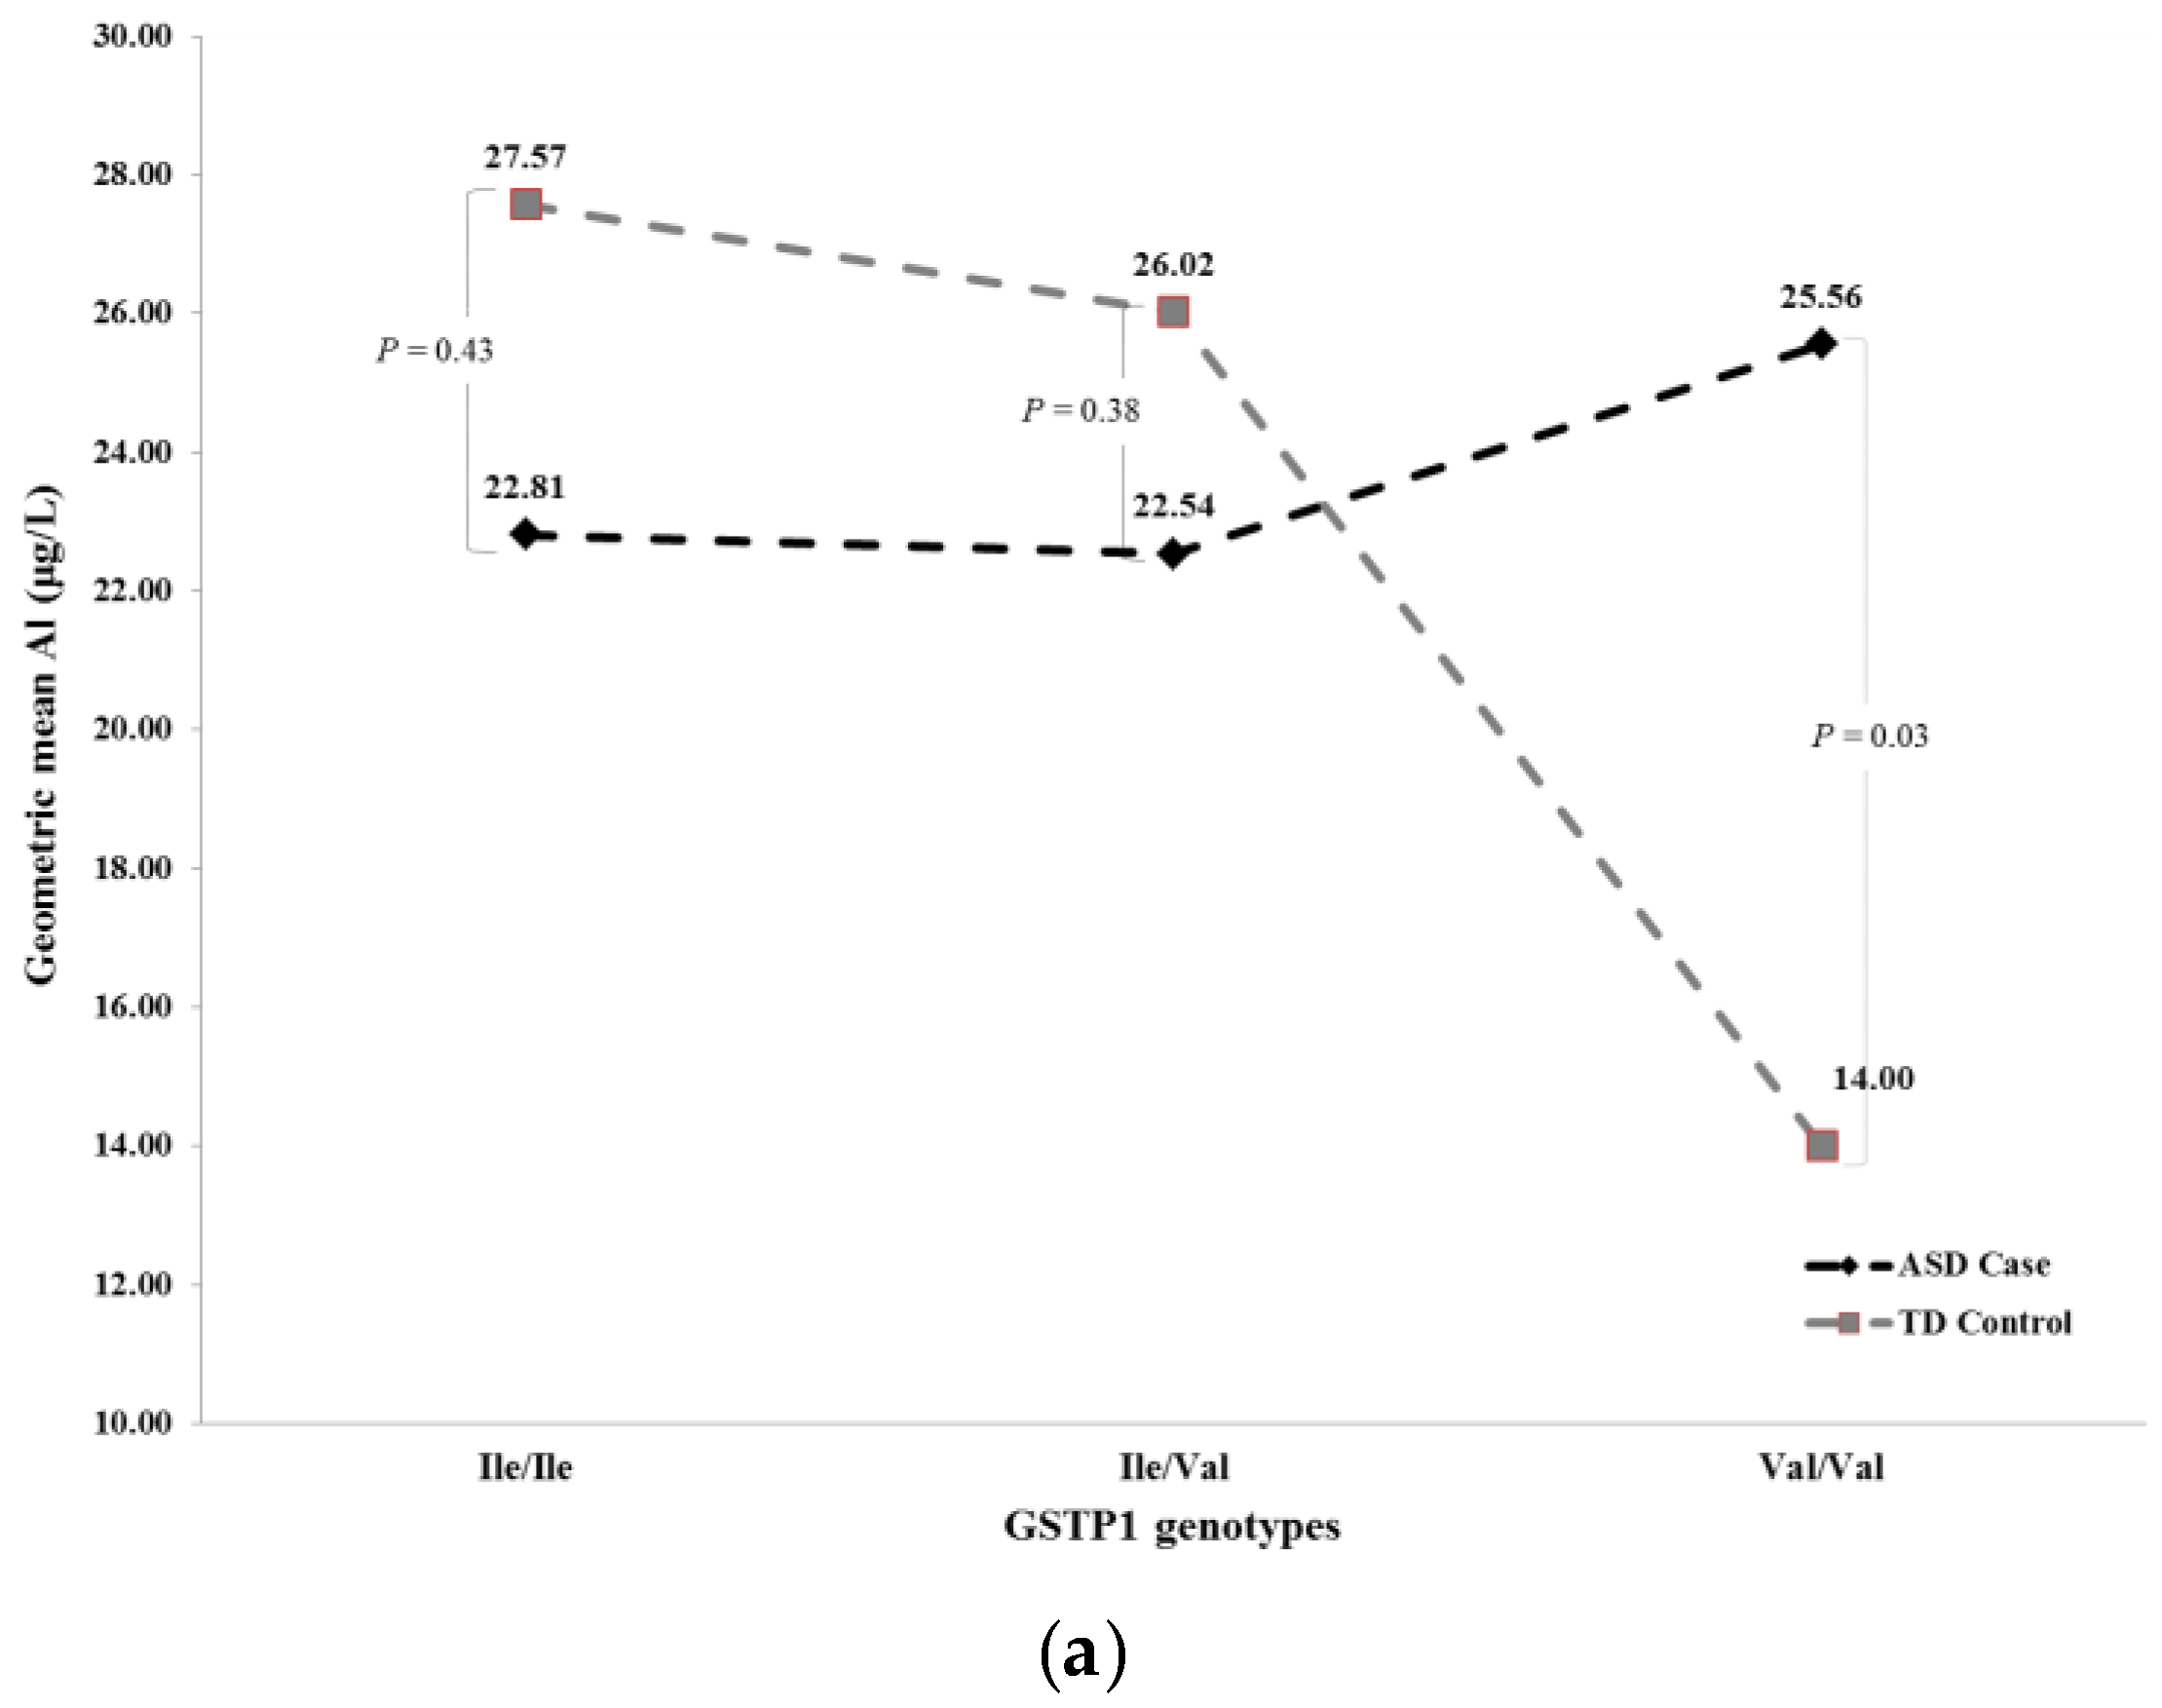
| Full a | ASD Case | TD Control | Ile/Ile | 22.81 | 27.57 | 0.43 | 21.71 | 24.19 | 0.66 |
| ASD Case | TD Control | Ile/Val | 22.54 | 26.02 | 0.38 | 23.16 | 23.39 | 0.96 | |
| ASD Case | TD Control | Val/Val | 25.56 | 14.00 | 0.03 | 24.39 | 14.60 | 0.07 | |
| Recessive b | ASD Case | TD Control | Val/Val | 25.62 | 14.01 | 0.03 | 24.38 | 14.57 | 0.07 |
| ASD Case | TD Control | Ile/Ile or Ile/Val | 22.62 | 26.50 | 0.18 | 22.62 | 23.75 | 0.73 | |
© 2016 by the authors; licensee MDPI, Basel, Switzerland. This article is an open access article distributed under the terms and conditions of the Creative Commons Attribution (CC-BY) license (http://creativecommons.org/licenses/by/4.0/).
Share and Cite
Rahbar, M.H.; Samms-Vaughan, M.; Pitcher, M.R.; Bressler, J.; Hessabi, M.; Loveland, K.A.; Christian, M.A.; Grove, M.L.; Shakespeare-Pellington, S.; Beecher, C.; et al. Role of Metabolic Genes in Blood Aluminum Concentrations of Jamaican Children with and without Autism Spectrum Disorder. Int. J. Environ. Res. Public Health 2016, 13, 1095. https://doi.org/10.3390/ijerph13111095
Rahbar MH, Samms-Vaughan M, Pitcher MR, Bressler J, Hessabi M, Loveland KA, Christian MA, Grove ML, Shakespeare-Pellington S, Beecher C, et al. Role of Metabolic Genes in Blood Aluminum Concentrations of Jamaican Children with and without Autism Spectrum Disorder. International Journal of Environmental Research and Public Health. 2016; 13(11):1095. https://doi.org/10.3390/ijerph13111095
Chicago/Turabian StyleRahbar, Mohammad H., Maureen Samms-Vaughan, Meagan R. Pitcher, Jan Bressler, Manouchehr Hessabi, Katherine A. Loveland, MacKinsey A. Christian, Megan L. Grove, Sydonnie Shakespeare-Pellington, Compton Beecher, and et al. 2016. "Role of Metabolic Genes in Blood Aluminum Concentrations of Jamaican Children with and without Autism Spectrum Disorder" International Journal of Environmental Research and Public Health 13, no. 11: 1095. https://doi.org/10.3390/ijerph13111095