On the Rising Complexity of Bank Regulatory Capital Requirements: From Global Guidelines to their United States (US) Implementation


Abstract
:1. Introduction1
2. Capital Adequacy Standards: Basel Guidelines and Their US Implementation
2.1. Basel Capital Adequacy Guidelines
2.2. US Bank Capital Requirements
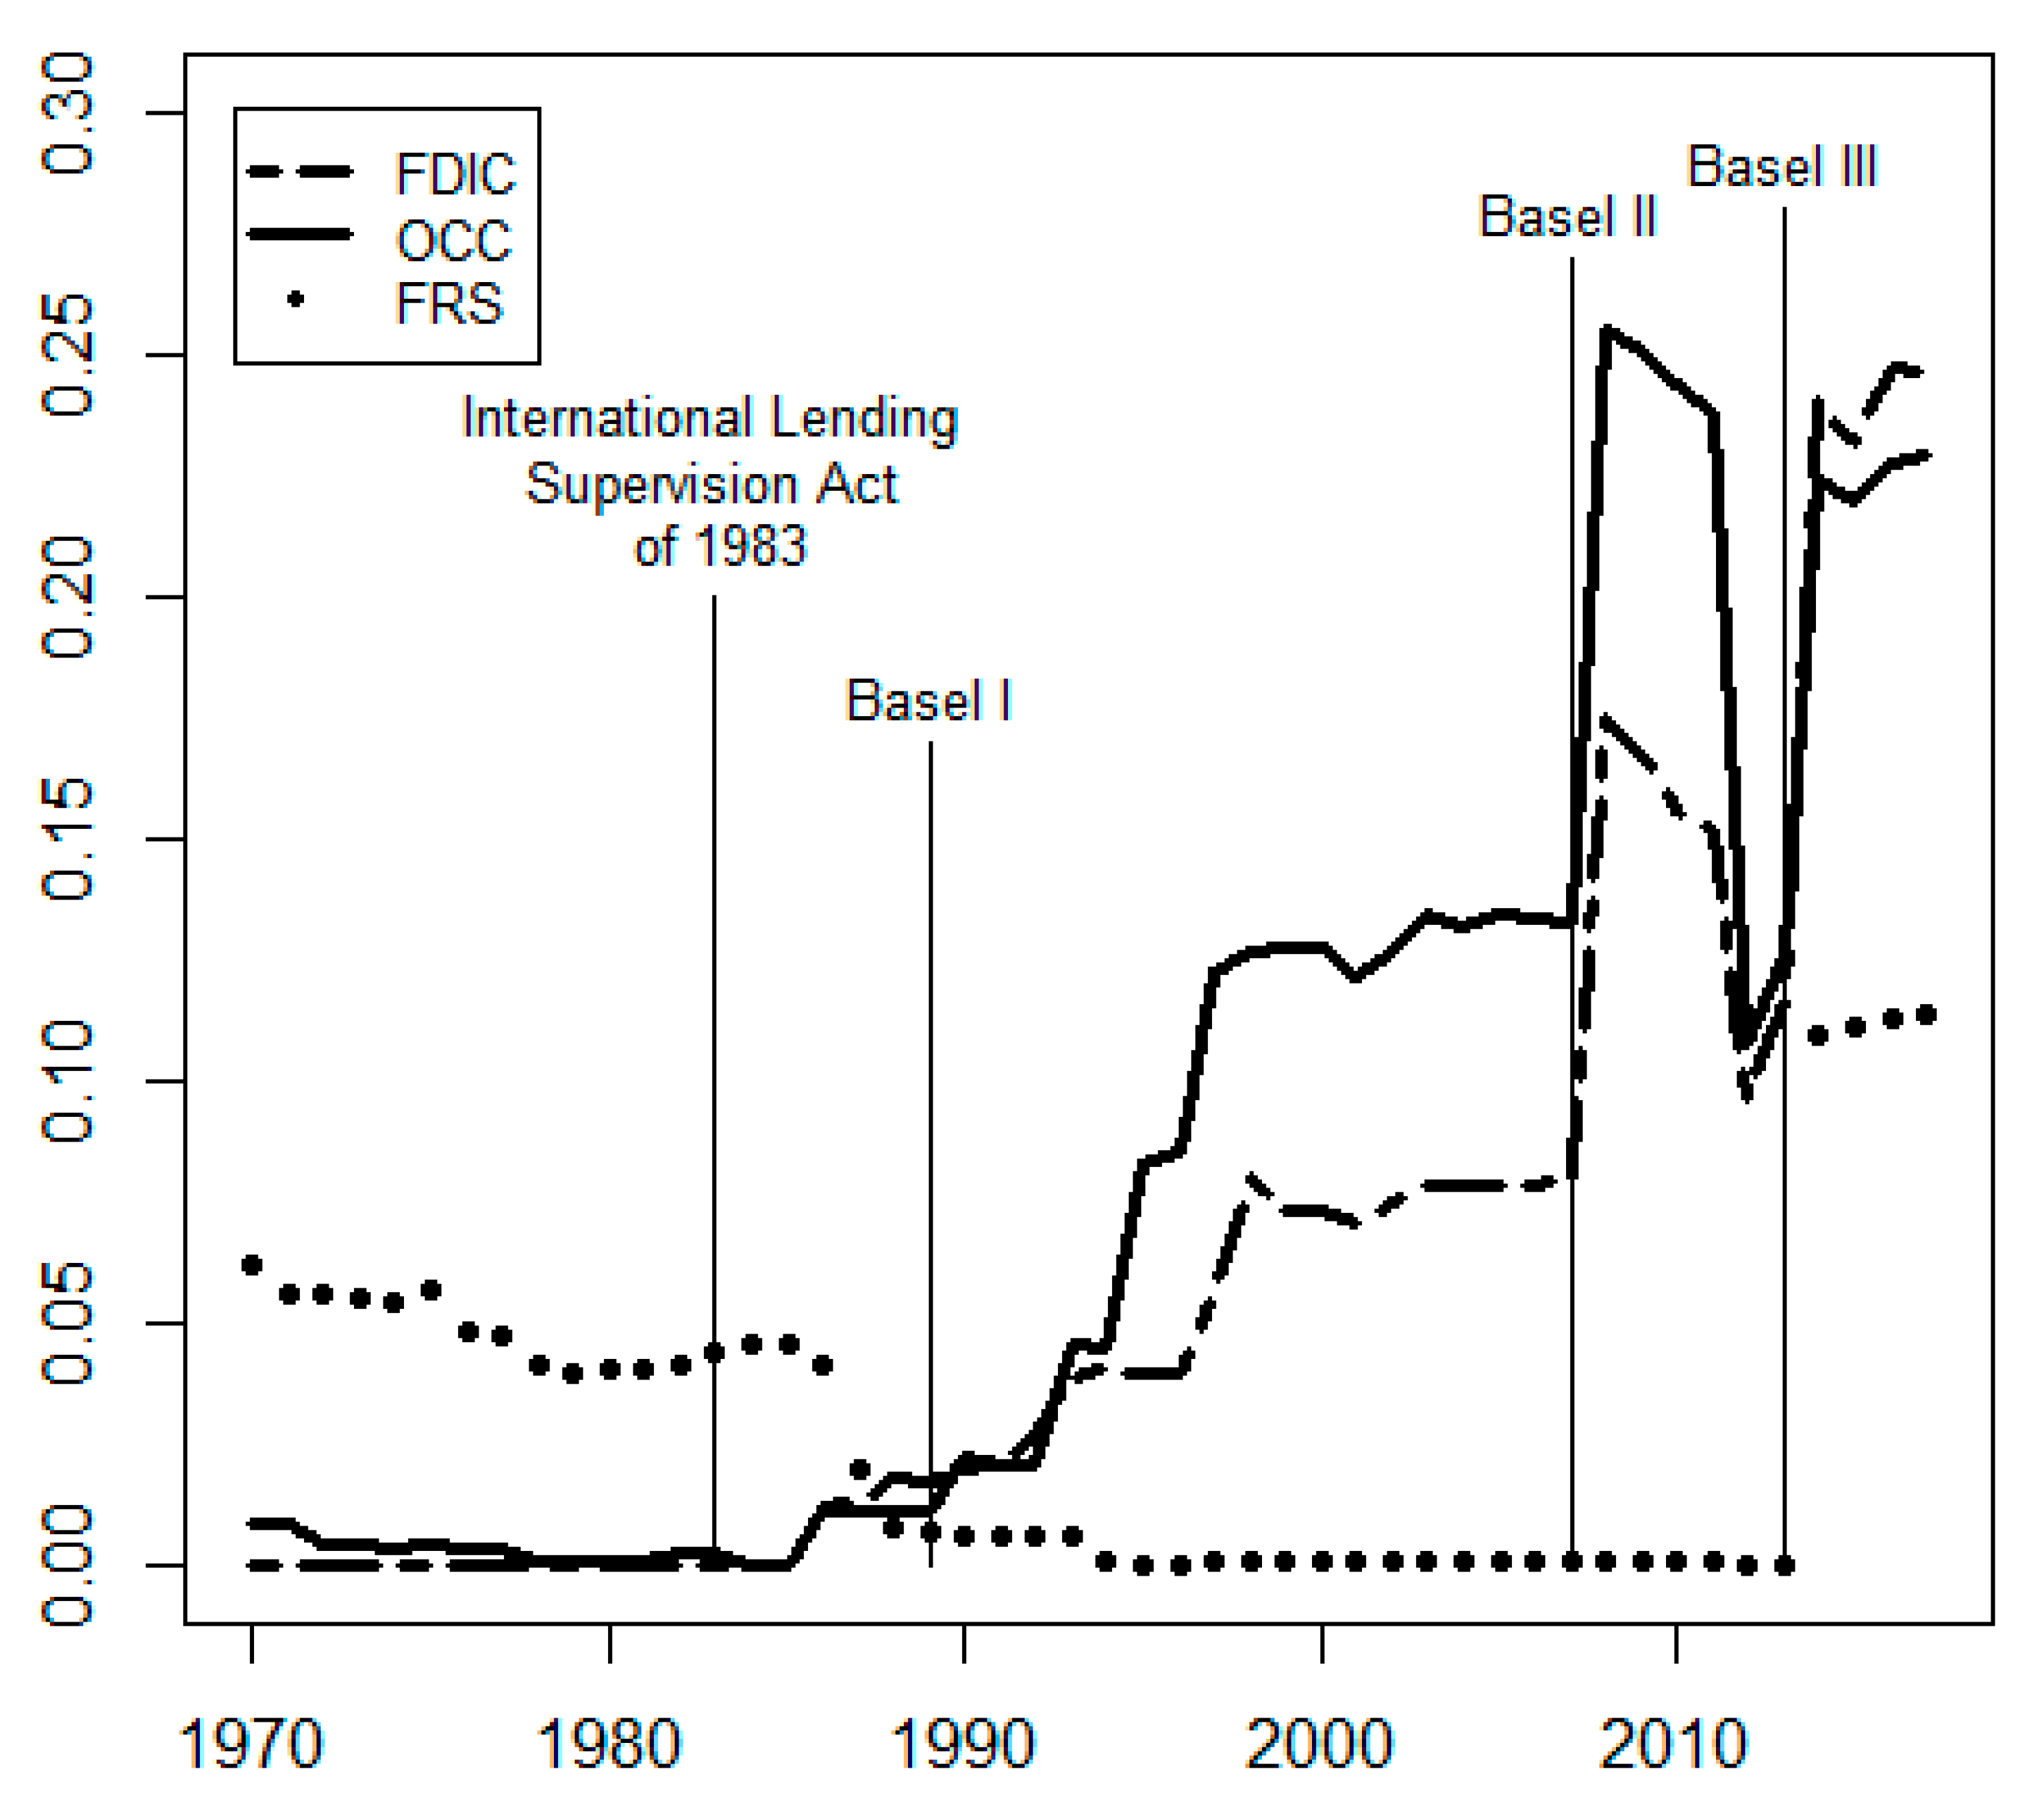
2.3. How US Bank Capital Regulation Has Grown Increasingly Complex Since 1970
3. Beyond US Basel Capital Regulations
3.1. US Prompt Corrective Action Requirements
3.2. US Capital Planning and Stress Tests
4. Not All Capital Ratios Are Equally Informative: Actual Capital Ratios Compared to Required Minimum Capital Ratios
5. Concluding Comments
Author Contributions
Funding
Conflicts of Interest
Appendix A. Data Tables

| 2000 | 2001 | 2002 | 2003 | 2004 | 2005 | 2006 | 2007 | 2008 | 2009 | 2010 | 2011 | 2012 | 2013 | 2014 | 2015 | 2016 | 2017Q3 | |
|---|---|---|---|---|---|---|---|---|---|---|---|---|---|---|---|---|---|---|
| Minimum requirement | 4.00 | 4.00 | 4.00 | 4.00 | 4.00 | 4.00 | 4.00 | 4.00 | 4.00 | 4.00 | 4.00 | 4.00 | 4.00 | 4.50 | 5.50 | 6.00 | 6.00 | 6.00 |
| JPMorgan | 4.50 | 4.29 | 4.24 | 4.50 | 4.70 | 4.50 | 4.70 | 4.40 | 6.90 | 7.10 | 8.10 | 8.30 | 8.60 | 7.40 | 6.10 | 7.70 | 8.20 | 8.30 |
| Bank of America | 3.50 | 4.30 | 4.22 | 3.85 | 4.20 | 4.25 | 4.64 | 2.87 | 5.15 | 6.40 | 7.24 | 8.40 | 8.89 | 7.94 | 7.60 | 6.90 | 7.60 | 8.00 |
| Citigroup | 4.38 | 4.42 | 4.47 | 4.91 | 4.74 | 4.79 | 4.59 | 3.12 | 7.92 | 7.67 | 8.91 | 9.55 | 10.06 | 9.20 | 7.60 | 9.49 | 9.84 | 9.30 |
| Wells Fargo | 3.29 | 2.99 | 3.60 | 4.42 | 4.41 | 4.26 | 4.95 | 3.59 | 3.84 | 5.25 | 7.16 | 7.33 | 7.75 | 7.83 | 6.95 | 7.03 | 6.82 | 7.95 |
| U.S. Bancorp | 3.20 | 3.70 | 4.00 | 5.20 | 4.60 | 4.20 | 4.80 | 4.30 | 6.60 | 5.60 | 6.50 | 6.80 | 6.80 | 6.70 | 5.80 | 5.10 | 5.00 | 5.10 |
| BNY Mellon | 4.60 | 4.11 | 3.58 | 3.44 | 4.31 | 4.38 | 4.19 | 5.32 | 9.30 | 8.10 | 9.40 | 11.00 | 11.10 | 11.70 | 6.70 | 6.30 | 6.60 | 8.60 |
| PNC | 4.60 | 3.80 | 4.80 | 5.50 | 5.00 | 4.30 | 6.40 | 2.80 | 5.70 | 7.40 | 8.10 | 8.60 | 7.60 | 7.90 | 7.10 | 6.00 | 6.00 | 5.60 |
| State Street | 10.50 | 9.60 | 13.10 | 10.00 | 9.30 | 7.70 | 9.70 | 7.20 | 16.30 | 13.70 | 16.50 | 14.80 | 15.10 | 12.80 | 9.20 | 9.90 | 8.70 | 8.50 |
| BB&T | 5.70 | 5.80 | 5.20 | 5.33 | 5.20 | 5.30 | 5.00 | 5.10 | 8.30 | 7.50 | 7.80 | 8.50 | 6.50 | 7.30 | 6.90 | 5.80 | 6.00 | 5.80 |
| SunTrust | 3.09 | 4.02 | 3.47 | 3.85 | 3.16 | 3.01 | 3.72 | 2.93 | 6.87 | 8.96 | 9.67 | 6.90 | 7.13 | 6.31 | 5.30 | 4.80 | 4.28 | 4.74 |
| Fifth Third | 9.02 | 8.36 | 7.70 | 6.94 | 6.31 | 4.38 | 4.39 | 4.50 | 6.59 | 9.31 | 9.94 | 7.91 | 6.65 | 5.86 | 5.33 | 4.93 | 5.50 | 5.72 |
| Regions | 5.14 | 5.66 | 4.98 | 5.72 | 5.04 | 4.60 | 4.00 | 3.29 | 6.38 | 7.54 | 8.40 | 9.28 | 8.00 | 7.10 | 7.04 | 5.70 | 5.90 | 6.10 |
| Northern Trust | 5.79 | 6.88 | 7.13 | 7.10 | 7.00 | 5.70 | 5.80 | 5.70 | 9.10 | 9.40 | 9.60 | 8.50 | 8.80 | 8.90 | 7.70 | 6.50 | 7.70 | 8.60 |
| M&T | 3.49 | 3.37 | 4.02 | 3.30 | 3.31 | 3.56 | 3.74 | 2.84 | 4.83 | 4.59 | 5.47 | 5.67 | 6.22 | 7.50 | 6.97 | 6.68 | 5.92 | 6.25 |
| KeyCorp | 3.72 | 3.43 | 3.74 | 4.35 | 3.22 | 3.59 | 4.24 | 3.44 | 6.92 | 8.75 | 11.16 | 8.99 | 8.15 | 7.46 | 6.40 | 5.36 | 4.89 | 5.11 |
| Comerica | 3.52 | 3.98 | 4.08 | 4.72 | 4.77 | 4.46 | 4.02 | 3.51 | 6.66 | 8.46 | 6.13 | 6.37 | 6.14 | 6.14 | 5.00 | 4.54 | 3.89 | 5.51 |
| Huntington | 3.19 | 3.24 | 4.69 | 4.53 | 5.08 | 5.13 | 4.93 | 3.51 | 6.72 | 8.03 | 7.55 | 8.11 | 8.01 | 7.78 | 6.00 | 4.53 | 4.90 | 5.30 |
| Zions | 4.53 | 4.25 | 5.26 | 5.42 | 5.35 | 3.52 | 3.98 | 3.57 | 6.22 | 6.53 | 10.78 | 12.13 | 9.38 | 8.27 | 8.97 | 8.08 | 7.49 | 7.33 |
| Average ratio | 4.76 | 4.79 | 5.13 | 5.17 | 4.98 | 4.54 | 4.88 | 4.00 | 7.24 | 7.79 | 8.80 | 8.73 | 8.38 | 8.01 | 6.81 | 6.41 | 6.40 | 6.77 |
| Standard deviation | 2.02 | 1.82 | 2.30 | 1.59 | 1.45 | 1.03 | 1.39 | 1.19 | 2.65 | 2.01 | 2.48 | 2.17 | 2.15 | 1.78 | 1.16 | 1.58 | 1.61 | 1.52 |
| Number of banks with capital shortfall | 0 | 0 | 0 | 0 | 0 | 0 | 0 | 0 | 0 | 0 | 0 | 0 | 0 | 0 | 0 | 0 | 0 | 0 |
| Number of banks reporting excess capital | 18 | 18 | 18 | 18 | 18 | 18 | 18 | 18 | 18 | 18 | 18 | 18 | 18 | 18 | 18 | 18 | 18 | 18 |
| 2000 | 2001 | 2002 | 2003 | 2004 | 2005 | 2006 | 2007 | 2008 | 2009 | 2010 | 2011 | 2012 | 2013 | 2014 | 2015 | 2016 | 2017Q3 | |
|---|---|---|---|---|---|---|---|---|---|---|---|---|---|---|---|---|---|---|
| Minimum requirement | 8.00 | 8.00 | 8.00 | 8.00 | 8.00 | 8.00 | 8.00 | 8.00 | 8.00 | 8.00 | 8.00 | 8.00 | 8.00 | 8.00 | 8.00 | 8.00 | 8.00 | 8.00 |
| JPMorgan | 4.00 | 3.88 | 3.95 | 3.80 | 4.20 | 4.00 | 4.30 | 4.60 | 6.80 | 6.80 | 7.50 | 7.40 | 7.30 | 6.30 | 5.10 | 8.00 | 8.40 | 8.40 |
| Bank of America | 3.04 | 4.67 | 4.43 | 3.87 | 3.73 | 3.08 | 3.88 | 3.02 | 5.00 | 6.66 | 7.77 | 8.75 | 8.31 | 7.44 | 6.60 | 7.70 | 8.30 | 8.50 |
| Citigroup | 3.23 | 2.92 | 3.25 | 4.04 | 3.85 | 4.02 | 3.65 | 2.70 | 7.70 | 7.25 | 8.59 | 8.99 | 9.26 | 8.68 | 6.53 | 10.54 | 11.08 | 10.54 |
| Wells Fargo | 2.43 | 2.45 | 3.31 | 4.21 | 4.07 | 3.64 | 4.50 | 2.68 | 3.83 | 5.26 | 7.01 | 6.76 | 6.63 | 7.43 | 7.53 | 7.45 | 8.08 | 9.28 |
| U.S. Bancorp | 2.60 | 3.70 | 4.40 | 5.60 | 5.10 | 4.50 | 4.60 | 4.20 | 6.30 | 4.90 | 5.30 | 5.30 | 5.10 | 5.20 | 5.60 | 5.10 | 5.20 | 5.20 |
| BNY Mellon | 4.92 | 3.57 | 3.96 | 3.49 | 4.21 | 4.48 | 4.49 | 5.25 | 9.10 | 8.00 | 8.30 | 9.00 | 8.40 | 9.00 | 4.50 | 4.50 | 5.00 | 7.60 |
| PNC | 4.57 | 3.80 | 4.50 | 5.80 | 5.00 | 4.10 | 5.50 | 2.30 | 5.20 | 7.00 | 7.60 | 7.80 | 6.70 | 7.80 | 7.90 | 6.70 | 6.30 | 5.70 |
| State Street | 7.60 | 6.50 | 10.00 | 7.80 | 6.70 | 6.00 | 7.90 | 4.70 | 13.60 | 11.10 | 14.00 | 12.50 | 12.60 | 11.70 | 8.60 | 9.40 | 8.00 | 7.60 |
| BB&T | 4.20 | 5.30 | 5.40 | 4.43 | 6.50 | 6.40 | 6.30 | 6.20 | 9.40 | 7.80 | 7.50 | 7.70 | 5.40 | 6.30 | 6.90 | 6.30 | 6.10 | 5.90 |
| SunTrust | 2.85 | 4.18 | 3.62 | 3.75 | 2.36 | 2.57 | 3.11 | 2.30 | 6.04 | 8.43 | 8.54 | 5.67 | 5.48 | 4.81 | 4.51 | 4.54 | 4.26 | 4.69 |
| Fifth Third | 6.76 | 6.42 | 5.51 | 5.38 | 4.31 | 2.45 | 3.07 | 2.16 | 6.78 | 9.48 | 10.14 | 8.09 | 6.42 | 6.08 | 6.33 | 6.13 | 7.02 | 7.16 |
| Regions | 3.40 | 5.23 | 5.84 | 6.46 | 5.51 | 4.76 | 3.54 | 3.25 | 6.64 | 7.78 | 8.35 | 8.99 | 7.38 | 6.70 | 7.26 | 5.90 | 6.10 | 6.20 |
| Northern Trust | 4.85 | 6.25 | 6.13 | 6.00 | 5.30 | 4.30 | 3.90 | 3.90 | 7.40 | 7.80 | 7.60 | 6.20 | 6.30 | 7.80 | 7.00 | 6.20 | 7.10 | 8.40 |
| M&T | 3.19 | 2.72 | 3.20 | 3.20 | 2.91 | 2.85 | 3.78 | 3.18 | 4.83 | 4.30 | 5.08 | 5.26 | 5.39 | 7.07 | 7.21 | 6.92 | 6.09 | 6.87 |
| KeyCorp | 3.48 | 3.41 | 4.11 | 4.57 | 3.47 | 3.47 | 4.43 | 3.38 | 6.82 | 8.95 | 11.12 | 8.51 | 7.13 | 6.33 | 5.89 | 4.97 | 4.85 | 5.09 |
| Comerica | 3.58 | 3.70 | 3.76 | 4.71 | 4.75 | 3.75 | 3.63 | 3.20 | 6.72 | 8.93 | 6.54 | 6.25 | 2.10 | 5.05 | 4.54 | 4.69 | 5.27 | 5.65 |
| Huntington | 2.46 | 2.29 | 3.60 | 3.95 | 4.48 | 4.42 | 4.79 | 2.85 | 5.91 | 6.41 | 6.46 | 6.77 | 6.51 | 6.57 | 5.56 | 4.64 | 5.05 | 5.39 |
| Zions | 2.83 | 4.20 | 4.94 | 5.52 | 6.05 | 4.23 | 4.29 | 3.68 | 6.32 | 5.28 | 9.15 | 10.06 | 2.96 | 6.67 | 8.27 | 8.12 | 7.24 | 6.99 |
| Average ratio | 3.89 | 4.18 | 4.66 | 4.81 | 4.58 | 4.06 | 4.43 | 3.53 | 6.91 | 7.34 | 8.14 | 7.78 | 6.63 | 7.05 | 6.44 | 6.54 | 6.64 | 6.95 |
| Standard deviation | 1.43 | 1.31 | 1.61 | 1.21 | 1.16 | 1.03 | 1.18 | 1.10 | 2.16 | 1.74 | 2.09 | 1.84 | 2.31 | 1.63 | 1.28 | 1.74 | 1.70 | 1.62 |
| Number of banks with capital shortfall | 0 | 0 | 0 | 0 | 0 | 0 | 0 | 0 | 0 | 0 | 0 | 0 | 0 | 0 | 0 | 0 | 0 | 0 |
| Number of banks reporting excess capital | 18 | 18 | 18 | 18 | 18 | 18 | 18 | 18 | 18 | 18 | 18 | 18 | 18 | 18 | 18 | 18 | 18 | 18 |
| 2000 | 2001 | 2002 | 2003 | 2004 | 2005 | 2006 | 2007 | 2008 | 2009 | 2010 | 2011 | 2012 | 2013 | 2014 | 2015 | 2016 | 2017Q3 | |
|---|---|---|---|---|---|---|---|---|---|---|---|---|---|---|---|---|---|---|
| JPMorgan | 62 | 66 | 60 | 66 | 68 | 71 | 69 | 67 | 57 | 59 | 55 | 54 | 54 | 58 | 63 | 62 | 59 | 58 |
| Bank of America | 84 | 81 | 79 | 78 | 71 | 70 | 72 | 71 | 73 | 69 | 64 | 60 | 55 | 62 | 60 | 65 | 54 | 62 |
| Citigroup | 72 | 66 | 63 | 59 | 57 | 59 | 56 | 57 | 51 | 59 | 51 | 52 | 52 | 58 | 70 | 66 | 63 | 61 |
| Wells Fargo | 81 | 85 | 81 | 79 | 81 | 80 | 85 | 84 | 84 | 82 | 78 | 77 | 76 | 75 | 74 | 72 | 69 | 66 |
| U.S. Bancorp | 97 | 95 | 90 | 84 | 87 | 88 | 89 | 89 | 87 | 84 | 80 | 80 | 81 | 82 | 79 | 81 | 80 | 79 |
| BNY Mellon | – | 36 | 34 | 30 | 78 | 78 | 75 | 61 | 49 | 50 | 41 | 31 | 31 | 30 | 44 | 41 | 44 | 43 |
| PNC | 89 | 85 | 87 | 84 | 81 | 83 | 84 | 83 | 86 | 86 | 82 | 85 | 85 | 85 | 82 | 82 | 82 | 82 |
| State Street | 36 | 40 | 32 | 39 | 42 | 48 | 44 | 45 | 40 | 43 | 37 | 33 | 32 | 33 | 39 | 41 | 41 | 46 |
| BB&T | 71 | 72 | 72 | 73 | 73 | 74 | 75 | 75 | 72 | 71 | 75 | 69 | 74 | 75 | 77 | 79 | 80 | 80 |
| SunTrust | 93 | 96 | 92 | 91 | 86 | 88 | 89 | 92 | 86 | 80 | 77 | 75 | 78 | 85 | 85 | 86 | 86 | 85 |
| Fifth Third | 80 | 84 | 81 | 82 | 88 | 93 | 102 | 104 | 94 | 89 | 90 | 90 | 90 | 89 | 85 | 86 | 84 | 83 |
| Regions | 75 | 74 | 75 | 76 | 77 | 81 | 81 | 82 | 79 | 73 | 72 | 72 | 76 | 83 | 83 | 84 | 82 | 82 |
| Northern Trust | 70 | 65 | 69 | 67 | 67 | 64 | 65 | 66 | 62 | 59 | 61 | 57 | 60 | 57 | 57 | 63 | 55 | -- |
| M&T | 84 | 85 | 84 | 88 | 86 | 86 | 87 | 86 | 56 | 61 | 57 | 92 | 92 | 86 | 80 | 77 | 82 | -- |
| KeyCorp | 96 | 103 | 101 | 100 | 106 | 109 | 110 | 111 | 102 | 92 | 85 | 87 | 89 | 90 | 91 | 95 | 89 | 86 |
| Comerica | 85 | 116 | 113 | 113 | 117 | 121 | 122 | 120 | 108 | 104 | 111 | 104 | 102 | 99 | 99 | 97 | 93 | 94 |
| Huntington | 94 | 98 | 99 | 92 | 91 | 90 | 88 | 84 | 86 | 84 | 81 | 84 | 85 | 84 | 82 | 82 | 78 | 77 |
| Zions | 73 | 79 | 80 | 84 | 87 | 88 | 92 | 90 | 94 | 100 | 84 | 81 | 79 | 81 | 80 | 78 | 79 | 78 |
| Average ratio | 78.94 | 79.22 | 77.33 | 76.94 | 80.17 | 81.72 | 82.50 | 81.50 | 75.89 | 74.72 | 71.17 | 71.28 | 71.72 | 72.89 | 73.89 | 74.28 | 72.22 | 72.63 |
| Standard deviation | 15.02 | 20.24 | 20.86 | 19.94 | 16.86 | 17.01 | 18.52 | 18.92 | 19.51 | 17.11 | 18.45 | 19.94 | 20.13 | 19.29 | 15.75 | 15.67 | 15.72 | 14.85 |
| Number of banks with risk-weigthed assests more than total assets | 0 | 2 | 2 | 1 | 2 | 2 | 3 | 3 | 2 | 1 | 1 | 1 | 1 | 0 | 0 | 0 | 0 | 0 |
| Number of banks with risk-weigthed assests less than total assets | 17 | 16 | 16 | 16 | 16 | 16 | 15 | 15 | 16 | 16 | 17 | 17 | 17 | 18 | 18 | 18 | 18 | 16 |
| 2000 | 2001 | 2002 | 2003 | 2004 | 2005 | 2006 | 2007 | 2008 | 2009 | 2010 | 2011 | 2012 | 2013 | 2014 | 2015 | 2016 | 2017Q3 | |
|---|---|---|---|---|---|---|---|---|---|---|---|---|---|---|---|---|---|---|
| Minimum requirement | 4.00 | 4.00 | 4.00 | 4.00 | 4.00 | 4.00 | 4.00 | 4.00 | 4.00 | 4.00 | 4.00 | 4.00 | 4.00 | 4.00 | 4.00 | 4.00 | 4.00 | 4.00 |
| JPMorgan | 1.40 | 1.17 | 1.06 | 1.60 | 2.20 | 2.30 | 2.20 | 2.00 | 2.90 | 2.90 | 3.00 | 2.80 | 3.10 | 3.10 | 3.60 | 4.50 | 4.40 | 4.40 |
| Bank of America | 2.12 | 2.56 | 2.29 | 1.73 | 1.89 | 1.91 | 2.36 | 1.04 | 2.44 | 2.91 | 3.21 | 3.53 | 3.37 | 3.86 | 5.60 | 4.60 | 4.90 | 5.00 |
| Citigroup | 1.97 | 1.64 | 1.49 | 1.56 | 1.20 | 1.35 | 1.16 | 0.03 | 2.08 | 2.89 | 2.60 | 3.19 | 3.48 | 4.20 | 5.03 | 6.18 | 6.09 | 5.64 |
| Wells Fargo | 2.49 | 2.25 | 2.58 | 2.93 | 3.08 | 2.99 | 3.89 | 2.83 | 10.52 | 3.87 | 5.19 | 5.03 | 5.47 | 5.60 | 5.45 | 5.37 | 4.95 | 5.27 |
| U.S. Bancorp | 3.70 | 3.70 | 3.70 | 4.00 | 3.90 | 3.60 | 4.20 | 3.90 | 5.80 | 4.50 | 5.10 | 5.10 | 5.20 | 5.60 | 5.30 | 5.30 | 5.00 | 5.10 |
| BNY Mellon | 3.49 | 2.70 | 2.48 | 1.82 | 2.41 | 2.60 | 2.67 | 2.53 | 2.90 | 2.50 | 1.80 | 1.20 | 1.30 | 1.40 | 1.60 | 2.00 | 2.60 | 2.80 |
| PNC | 4.03 | 2.80 | 4.10 | 4.20 | 3.60 | 3.20 | 5.30 | 2.20 | 13.50 | 6.10 | 6.20 | 7.10 | 6.40 | 7.10 | 6.80 | 6.10 | 5.80 | 5.90 |
| State Street | 1.40 | 1.40 | 1.60 | 1.60 | 1.50 | 1.60 | 1.80 | 1.30 | 3.80 | 4.50 | 4.20 | 3.30 | 3.10 | 2.90 | 2.40 | 2.90 | 2.50 | 3.40 |
| BB&T | 3.30 | 3.20 | 2.90 | 3.15 | 3.10 | 3.20 | 3.20 | 3.20 | 5.90 | 4.50 | 5.10 | 5.00 | 4.20 | 5.30 | 5.90 | 5.80 | 6.00 | 5.90 |
| SunTrust | 2.98 | 3.94 | 3.30 | 3.37 | 2.64 | 2.65 | 3.23 | 2.90 | 6.45 | 6.90 | 6.94 | 4.75 | 4.91 | 5.58 | 5.64 | 5.67 | 5.22 | 5.50 |
| Fifth Third | 6.77 | 6.53 | 5.73 | 5.11 | 4.89 | 4.08 | 4.44 | 3.72 | 6.27 | 8.43 | 8.79 | 7.10 | 6.05 | 5.64 | 5.66 | 5.54 | 5.90 | 5.97 |
| Regions | 2.90 | 3.41 | 2.92 | 3.49 | 3.47 | 3.42 | 4.30 | 2.66 | 4.47 | 4.90 | 5.30 | 5.91 | 5.65 | 6.10 | 6.86 | 6.40 | 6.10 | 6.20 |
| Northern Trust | 2.91 | 3.93 | 3.76 | 3.60 | 3.60 | 3.10 | 2.70 | 2.80 | 4.50 | 4.80 | 4.80 | 3.30 | 4.20 | 3.90 | 3.80 | 3.50 | 4.00 | 4.00 |
| M&T | 2.66 | 2.55 | 3.05 | 2.98 | 2.73 | 2.94 | 3.20 | 2.59 | 4.35 | 4.43 | 5.33 | 5.28 | 6.07 | 6.78 | 6.17 | 6.89 | 5.99 | 6.35 |
| KeyCorp | 3.71 | 3.65 | 4.16 | 4.55 | 3.96 | 4.53 | 4.98 | 4.39 | 7.05 | 7.72 | 9.02 | 7.79 | 7.41 | 7.11 | 7.26 | 6.71 | 5.90 | 5.83 |
| Comerica | 4.90 | 5.36 | 5.30 | 6.13 | 6.37 | 5.99 | 5.76 | 5.26 | 7.77 | 9.25 | 7.26 | 6.92 | 6.52 | 6.82 | 6.44 | 6.22 | 6.18 | 6.87 |
| Huntington | 2.93 | 3.41 | 4.89 | 3.98 | 4.42 | 4.34 | 4.00 | 2.77 | 5.82 | 6.09 | 5.41 | 6.28 | 6.47 | 6.67 | 5.74 | 4.79 | 4.70 | 4.96 |
| Zions | 2.38 | 2.56 | 3.56 | 4.06 | 4.31 | 4.16 | 3.86 | 3.37 | 5.99 | 6.38 | 8.56 | 9.40 | 6.96 | 6.48 | 7.82 | 7.26 | 7.09 | 6.58 |
| Average ratio | 3.11 | 3.15 | 3.27 | 3.33 | 3.29 | 3.22 | 3.51 | 2.75 | 5.70 | 5.20 | 5.43 | 5.17 | 4.99 | 5.23 | 5.39 | 5.32 | 5.18 | 5.32 |
| Standard deviation | 1.28 | 1.32 | 1.28 | 1.31 | 1.28 | 1.14 | 1.24 | 1.22 | 2.86 | 1.98 | 2.09 | 2.06 | 1.65 | 1.65 | 1.63 | 1.40 | 1.22 | 1.09 |
| Number of banks with capital shortfall | 0 | 0 | 0 | 0 | 0 | 0 | 0 | 0 | 0 | 0 | 0 | 0 | 0 | 0 | 0 | 0 | 0 | 0 |
| Number of banks reporting excess capital | 18 | 18 | 18 | 18 | 18 | 18 | 18 | 18 | 18 | 18 | 18 | 18 | 18 | 18 | 18 | 18 | 18 | 18 |
| 2000 | 2001 | 2002 | 2003 | 2004 | 2005 | 2006 | 2007 | 2008 | 2009 | 2010 | 2011 | 2012 | 2013 | 2014 | 2015 | 2016 | 2017Q3 | |
|---|---|---|---|---|---|---|---|---|---|---|---|---|---|---|---|---|---|---|
| Minimum requirement | 4.00 | 4.00 | 4.00 | 4.00 | 4.00 | 4.00 | 4.00 | 4.00 | 4.00 | 4.00 | 4.00 | 4.00 | 4.00 | 4.00 | 4.00 | 4.00 | 4.00 | 4.00 |
| JPMorgan | −0.43 | −0.35 | 0.22 | 0.59 | 1.09 | 0.82 | 0.87 | 0.76 | −0.17 | 1.27 | 1.59 | 1.62 | 2.26 | 2.35 | 2.46 | 3.23 | 3.23 | 3.52 |
| Bank of America | 1.47 | 1.96 | 1.83 | 1.03 | 0.79 | 0.24 | 0.14 | −0.65 | −1.17 | 0.51 | 1.86 | 2.52 | 2.63 | 3.10 | 3.38 | 3.69 | 3.69 | 3.74 |
| Citigroup | 1.52 | 0.98 | 0.70 | 0.53 | 0.51 | 0.68 | −0.21 | −1.28 | −2.44 | 2.49 | 2.89 | 3.90 | 4.46 | 5.05 | 5.47 | 6.06 | 6.06 | 6.50 |
| Wells Fargo | 2.01 | 1.59 | 1.71 | 2.11 | 2.25 | 2.12 | 3.15 | 1.93 | −1.67 | 1.44 | 2.72 | 3.40 | 4.04 | 4.13 | 4.08 | 4.21 | 4.21 | 4.08 |
| U.S. Bancorp | 2.18 | 1.52 | 1.71 | 2.12 | 2.45 | 2.29 | 1.17 | 0.74 | −0.81 | 1.10 | 1.22 | 2.00 | 2.54 | 2.72 | 2.67 | 2.84 | 2.84 | 2.84 |
| BNY Mellon | 1.78 | 1.36 | – | 0.91 | 1.56 | 1.68 | 1.14 | −0.19 | −2.37 | −0.25 | −0.15 | −0.57 | −0.29 | −0.19 | −0.18 | −0.07 | −0.07 | −0.24 |
| PNC | 1.75 | 1.13 | 2.59 | 2.30 | 1.68 | 1.05 | 3.34 | 0.61 | −1.26 | −0.47 | 3.43 | 4.53 | 4.34 | 4.77 | 4.88 | 5.40 | 5.40 | 5.10 |
| State Street | 0.71 | 0.67 | 0.93 | 0.55 | 0.53 | 0.75 | 1.15 | −0.51 | −1.03 | 1.36 | 2.30 | 1.17 | 1.54 | 0.89 | 0.38 | 0.70 | 0.70 | 0.38 |
| BB&T | 3.07 | 3.53 | 3.04 | 2.84 | 2.78 | 2.39 | 1.54 | 1.47 | 0.75 | 1.97 | 2.59 | 2.48 | 2.50 | 3.23 | 3.96 | 3.69 | 3.60 | 3.67 |
| SunTrust | 3.23 | 3.26 | 2.53 | 2.82 | 1.68 | 1.56 | 1.75 | 1.99 | 1.08 | 1.77 | 2.24 | 3.33 | 3.79 | 3.75 | 3.78 | 4.27 | 4.26 | 3.94 |
| Fifth Third | 5.42 | – | 5.42 | 4.44 | 4.34 | 2.86 | 3.78 | 2.03 | 0.31 | 2.64 | 3.30 | 5.04 | 5.10 | 4.69 | 4.71 | 5.60 | 4.65 | 4.70 |
| Regions | 2.91 | 2.77 | 2.64 | 3.08 | 2.86 | 2.64 | 2.53 | 1.88 | 1.23 | 2.03 | 1.86 | 2.42 | 4.62 | 5.09 | 5.61 | 5.07 | 5.07 | 4.86 |
| Northern Trust | 2.14 | 2.39 | 3.02 | 2.83 | 2.79 | 1.80 | 1.64 | 1.93 | 1.42 | 3.16 | 3.65 | 2.49 | 3.11 | 3.12 | 2.83 | 2.66 | 3.04 | 2.94 |
| M&T | 1.41 | 1.54 | 2.23 | 1.51 | 1.41 | 1.49 | 1.79 | 0.95 | 0.55 | 1.09 | 2.16 | 2.34 | 3.17 | 4.37 | 4.10 | 4.65 | 3.90 | 5.00 |
| KeyCorp | 2.12 | 2.33 | 2.73 | 2.94 | 2.35 | 2.68 | 3.01 | 2.58 | 1.95 | 3.56 | 4.19 | 5.88 | 6.02 | 5.70 | 5.80 | 5.93 | 5.27 | 4.84 |
| Comerica | – | 4.81 | 4.85 | 5.29 | 5.43 | 5.20 | 4.65 | 3.99 | 3.23 | 3.99 | 6.53 | 6.28 | 5.76 | 6.06 | 5.85 | 5.69 | 5.88 | 6.35 |
| Huntington | – | 2.12 | 3.62 | 2.80 | 3.18 | 3.19 | 2.87 | 0.81 | −0.20 | 1.74 | 3.42 | 4.20 | 4.69 | 4.77 | 4.13 | 3.78 | 3.00 | 3.30 |
| Zions | 1.34 | 1.98 | 2.06 | 2.53 | 2.80 | 1.37 | 1.98 | 1.70 | 1.85 | 2.12 | 2.99 | 2.77 | 3.09 | 4.02 | 5.48 | 5.63 | 5.49 | 5.57 |
| Average ratio | 2.04 | 1.98 | 2.46 | 2.29 | 2.25 | 1.93 | 2.02 | 1.15 | 0.07 | 1.75 | 2.71 | 3.10 | 3.52 | 3.76 | 3.86 | 4.06 | 3.90 | 3.95 |
| Standard deviation | 1.27 | 1.19 | 1.34 | 1.31 | 1.28 | 1.17 | 1.27 | 1.29 | 1.58 | 1.18 | 1.39 | 1.69 | 1.56 | 1.61 | 1.73 | 1.73 | 1.66 | 1.76 |
| Number of banks with capital shortfall | 1 | 1 | 0 | 0 | 0 | 0 | 1 | 4 | 9 | 2 | 1 | 1 | 1 | 1 | 1 | 1 | 1 | 1 |
| Number of banks reporting excess capital | 15 | 16 | 17 | 18 | 18 | 18 | 17 | 14 | 9 | 16 | 17 | 17 | 17 | 17 | 17 | 17 | 17 | 17 |
| 2000 | 2001 | 2002 | 2003 | 2004 | 2005 | 2006 | 2007 | 2008 | 2009 | 2010 | 2011 | 2012 | 2013 | 2014 | 2015 | 2016 | 2017Q3 | |
|---|---|---|---|---|---|---|---|---|---|---|---|---|---|---|---|---|---|---|
| JPMorgan | 2.15 | 1.79 | 1.16 | 1.66 | 1.32 | 1.29 | 1.44 | 1.19 | 0.87 | 1.04 | 0.99 | 0.71 | 0.86 | 1.1 | 1.1 | 1.09 | 1.35 | 1.43 |
| Bank of America | 1.56 | 2.03 | 2.08 | 2.46 | 1.9 | 1.82 | 1.8 | 1.29 | 0.51 | 0.67 | 0.64 | 0.28 | 0.57 | 0.75 | 0.84 | 0.75 | 0.92 | 1.06 |
| Citigroup | 3.98 | 3.26 | 2.12 | 2.58 | 2.31 | 2.17 | 2.3 | 1.3 | 0.52 | 0.62 | 0.84 | 0.43 | 0.64 | 0.8 | 0.82 | 0.75 | 0.8 | 0.92 |
| Wells Fargo | 3.64 | 2.71 | 2.63 | 2.92 | 2.8 | 2.61 | 2.64 | 2.11 | 1.84 | 1.35 | 1.39 | 1.13 | 1.24 | 1.55 | 1.72 | 1.62 | 1.58 | 1.51 |
| U.S. Bancorp | 2.92 | 2.48 | 2.21 | 2.98 | 2.98 | 2.7 | 3.16 | 2.74 | 2.39 | 1.76 | 1.88 | 1.65 | 1.74 | 2.03 | 2.08 | 1.79 | 2.09 | 2.07 |
| BNY Mellon | 6.77 | 4.71 | 2.6 | 3.05 | 2.8 | 2.49 | 2.46 | 1.9 | 1.29 | 1.17 | 1.16 | 0.72 | 0.85 | 1.11 | 1.26 | 1.2 | 1.41 | 1.47 |
| PNC | 3.34 | 2.73 | 1.74 | 2.28 | 2.18 | 2.12 | 2.01 | 1.51 | 1.24 | 1.11 | 1.08 | 0.94 | 0.87 | 1.08 | 1.18 | 1.07 | 1.36 | 1.51 |
| State Street | 6.16 | 4.4 | 2.65 | 3.03 | 2.66 | 2.91 | 3.09 | 2.78 | 1.56 | 1.49 | 1.31 | 1.04 | 1.06 | 1.6 | 1.67 | 1.44 | 1.65 | 1.84 |
| BB&T | 3.12 | 2.68 | 2.36 | 2.11 | 2.13 | 2.05 | 2.03 | 1.31 | 1.19 | 1.08 | 1.11 | 1.01 | 1.07 | 1.31 | 1.29 | 1.13 | 1.42 | 1.39 |
| SunTrust | 2.27 | 2.16 | 1.83 | 2.07 | 1.67 | 1.56 | 1.73 | 1.24 | 0.61 | 0.58 | 0.81 | 0.48 | 0.75 | 0.95 | 1.01 | 0.88 | 1.2 | 1.26 |
| Fifth Third | 5.69 | 4.68 | 3.97 | 3.93 | 2.96 | 2.22 | 2.27 | 1.46 | 0.61 | 0.78 | 1.12 | 0.91 | 1.01 | 1.33 | 1.17 | 1.04 | 1.36 | 1.32 |
| Regions | 1.74 | 1.71 | 1.77 | 1.85 | 1.54 | 1.47 | 1.32 | 0.83 | 0.41 | 0.44 | 0.66 | 0.41 | 0.67 | 0.89 | 0.89 | 0.74 | 1.11 | 1.14 |
| Northern Trust | 7.74 | 5.03 | 2.69 | 3.33 | 3.23 | 3.14 | 3.37 | 3.75 | 2.38 | 2.01 | 1.97 | 1.34 | 1.59 | 1.86 | 1.95 | 1.99 | 2.2 | 2.17 |
| M&T | 2.35 | 2.33 | 2.28 | 2.07 | 2.17 | 2.08 | 2.15 | 1.38 | 1.02 | 1.13 | 1.37 | 1.14 | 1.35 | 1.46 | 1.5 | 1.29 | 1.6 | 1.61 |
| KeyCorp | 1.54 | 1.79 | 1.68 | 1.56 | 1.75 | 1.94 | 1.76 | 1.97 | 1.18 | 0.57 | 0.61 | 0.93 | 0.76 | 0.78 | 1.19 | 1.05 | 1.3 | 1.38 |
| Comerica | 2.48 | 2.11 | 1.53 | 1.92 | 2.04 | 1.82 | 1.79 | 1.28 | 0.59 | 0.89 | 1.29 | 0.74 | 0.82 | 1.21 | 1.13 | 0.97 | 1.53 | 1.65 |
| Huntington | 1.72 | 1.79 | 1.89 | 2.26 | 2.26 | 2.08 | 1.86 | 0.91 | 0.52 | 0.72 | 1.28 | 0.94 | 1 | 1.41 | 1.44 | 1.42 | 1.56 | 1.57 |
| Zions | 3.06 | 2.13 | 1.5 | 2.17 | 2.19 | 1.88 | 1.85 | 0.99 | 0.57 | 0.46 | 0.96 | 0.65 | 0.8 | 1.01 | 0.91 | 0.84 | 1.26 | 1.31 |
| Average ratio | 3.46 | 2.81 | 2.15 | 2.46 | 2.27 | 2.13 | 2.17 | 1.66 | 1.07 | 0.99 | 1.14 | 0.86 | 0.98 | 1.24 | 1.29 | 1.17 | 1.43 | 1.48 |
| Standard deviation | 1.89 | 1.12 | 0.63 | 0.63 | 0.54 | 0.49 | 0.58 | 0.76 | 0.63 | 0.45 | 0.38 | 0.35 | 0.32 | 0.37 | 0.37 | 0.36 | 0.35 | 0.32 |
| Number of banks market capital less than book value | 0 | 0 | 0 | 0 | 0 | 0 | 0 | 3 | 9 | 9 | 7 | 12 | 10 | 5 | 4 | 6 | 2 | 1 |
| Number of banks market capital more than book value | 18 | 18 | 18 | 18 | 18 | 18 | 18 | 15 | 9 | 9 | 11 | 6 | 7 | 13 | 14 | 12 | 16 | 17 |
References and Notes
- Acharya, Viral, Robert Engle, and Diane Pierret. 2014. Testing Macroprudential Stress Tests: The Risk of Regulatory Risk Weights. Journal of Monetary Economics 65: 36–53. [Google Scholar] [CrossRef]
- Balla, Eliana, Laurel C. Mazur, Edward Simpson Prescott, and John R. Walter, 2017. Comparison of Small Bank Failures and FDIC Losses in the 1986–92 and 2007–13 Banking Crises. Working Paper no. 17–19, Federal Reserve Bank of Cleveland, Cleveland, OH, USA.
- Barth, James R., and Stephen Miller. 2018. Benefits and Costs of a Higher Bank “Leverage Ratio”. Journal of Financial Stability 38: 37–52. [Google Scholar] [CrossRef]
- Barth, James R., Gerard Caprio Jr., and Ross Levine. 2012. Guardians of Finance: Making Regulators Work for Us. Cambridge: MIT Press. [Google Scholar]
- Basel Committee on Banking Supervision (BCBS). 1988. International Convergence of Capital Measurement and Capital Standards. Basel: Bank for International Settlements, Available online: http://www.bis.org/publ/bcbs04a.htm (accessed on 30 October 2018).
- Basel Committee on Banking Supervision (BCBS). 1996. Amendment to the Capital Accord to Incorporate Market Risks. Basel: Bank for International Settlements, Available online: http://www.bis.org/publ/bcbs24.htm (accessed on 30 October 2018).
- Basel Committee on Banking Supervision (BCBS). 2004. Amendment to the Capital Accord to Incorporate Market Risks. Basel: Bank for International Settlements, Available online: http://www.bis.org/publ/bcbs107.htm (accessed on 30 October 2018).
- Basel Committee on Banking Supervision (BCBS). 2009. Revisions to the Basel II Market Risk Framework—Final Version. Basel: Bank for International Settlements, Available online: http://www.bis.org/publ/bcbs158.htm (accessed on 30 October 2018).
- Basel Committee on Banking Supervision (BCBS). 2011. Basel III: A Global Regulatory Framework for More Resilient Banks and Banking Systems—Revised Version June 2011. Basel: Bank for International Settlements, Available online: http://www.bis.org/publ/bcbs189.htm (accessed on 30 October 2018).
- Basel Committee on Banking Supervision (BCBS). 2014a. The G-SIB Assessment Methodology—Score Calculation. Basel: Bank for International Settlements, Available online: http://www.bis.org/bcbs/publ/d296.htm (accessed on 30 October 2018).
- Basel Committee on Banking Supervision (BCBS). 2014b. Implementation of Basel Standards: A Report to G20 Leaders on Implementation of the Basel III Regulatory Reforms. Basel: Bank for International Settlements, Available online: http://www.bis.org/bcbs/publ/d299.htm (accessed on 30 October 2018).
- Basel Committee on Banking Supervision (BCBS). 2017. Basel III: Finalising Post-Crisis Reforms. Basel: Bank for International Settlements, Available online: https://www.bis.org/bcbs/publ/d424.htm (accessed on 30 October 2018).
- Begenau, Juliane, and Tim Landvoigt. 2017. Financial Regulation in a Quantitative Model of the Modern Banking System. Available online: http://dx.doi.org/10.2139/ssrn.2748206 (accessed on 30 October 2018).
- Board of Governors of the Federal Reserve System. 2012. Comprehensive Capital Analysis and Review 2012: Methodology and Results for Stress Scenario Projections; Washington: Federal Reserve System, p. 5.
- Board of Governors of the Federal Reserve System. 2015. Comprehensive Capital Analysis and Review 2015: Assessment Framework and Results; Washington: Federal Reserve System.
- Brealey, Richard A. 2006. Basel II: The Route Ahead or Col-de-sac? Journal of Applied Corporate Finance 4: 34–43. [Google Scholar] [CrossRef]
- Chen, Brian, Samuel Hanson, and Jeremy Stein. 2017. “The Decline of Big-Bank Lending to Small Business: Dynamic Impacts on Local Credit and Labor Markets”. NBER Working Paper 23843. Available online: http://www.nber.org/papers/w23843 (accessed on 30 October 2018).
- Cole, Rebel, and Lawrence J. White. 2017. When Time is Not on Our Side: The Costs of Regulatory Forbearance in the Closure of Insolvent Banks. Journal of Banking and Finance 80: 235–49. [Google Scholar] [CrossRef]
- Demirguc-Kunt, Asli, Enrica Detragiache, and Ouarda Merrouche. 2013. Bank Capital: Lessons from the Financial Crisis. Journal of Money, Credit and Banking 45: 1147–64. [Google Scholar] [CrossRef]
- Egan, Mark, Ali Hortacsu, and Gregor Matvos. 2017. Deposit Competition and Financial Fragility: Evidence from the U.S. Banking Sector. American Economic Review 107: 169–216. [Google Scholar] [CrossRef]
- Elliott, Douglas J. 2010. A Primer on Bank Capital. Washington: Brookings Institution. [Google Scholar]
- Erel, Isil, Taylor Nadauld, and René M. Stulz. 2014. Why Did Holdings of Highly Rated Securitization Tranches Differ So Much across Banks? Review of Financial Studies 27: 404–53. [Google Scholar] [CrossRef]
- Estrella, Arturo, Sangkyun Park, and Stavros Peristiani. 2000. Capital ratios as predictors of bank failure. Federal Reserve Bank of New York Economic Policy Review 6: 33–52. [Google Scholar]
- Federal Deposit Insurance Corporation. 2014. Regulatory Capital Interim Final Rule; Washington: Federal Deposit Insurance Corporation.
- Federal Register. 1989. Capital; Risk-Based Capital Guidelines. January 27, vol. 54, p. 4186, Washington, D.C: Office of the Federal Register.
- Federal Register. 1992. Prompt Corrective Action; Rules of Practice for Hearings. September 29, vol. 57, p. 44866, Washington, D.C: Office of the Federal Register.
- Federal Register. 1996. Risk-Based Capital Standards: Market Risk. September 6, vol. 61, p. 4186, Washington, D.C: Office of the Federal Register.
- Federal Register. 2001. Risk-Based Capital Guidelines; Capital Adequacy Guidelines; Capital Maintenance: Capital Treatment of Recourse, Direct Credit Substitutes and Residual Interests in Asset Securitization. November 29, vol. 66, p. 59614, Washington, D.C: Office of the Federal Register.
- Federal Register. 2007. Risk-Based Capital Standards: Advanced Capital Adequacy Framework—Basel II. December 7, vol. 72, p. 69288, Washington, D.C: Office of the Federal Register.
- Federal Register. 2012a. Annual Company-Run Stress Test Requirements for Banking Organizations with Total Consolidated Assets Over $10 Billion Other Than Covered Companies. October 12, vol. 77, p. 62396, Washington, D.C: Office of the Federal Register.
- Federal Register. 2012b. Annual Stress Test. October 15, vol. 77, p. 62417, Washington, D.C: Office of the Federal Register.
- Federal Register. 2012c. Annual Stress Test. October 9, vol. 77, p. 61238, Washington, D.C: Office of the Federal Register.
- Federal Register. 2012d. Risk-Based Capital Guidelines: Market Risk. August 30, vol. 77, p. 53060, Washington, D.C: Office of the Federal Register.
- Federal Register. 2012e. Supervisory and Company-Run Stress Test Requirements for Covered Companies. October 12, vol. 77, p. 62378, Washington, D.C: Office of the Federal Register.
- Federal Register. 2012f. Supervisory Guidance on Stress Testing for Banking Organizations with More Than $10 Billion in Total Consolidated Assets. May 17, vol. 77, p. 29458, Washington, D.C: Office of the Federal Register.
- Federal Register. 2013. Regulatory Capital Rules: Regulatory Capital Implementation of Basel III, Capital Adequacy, Transition Provisions, Prompt Corrective Action, Standardized Approach for Risk-weighted Assets, Market Discipline and Disclosure Requirements, Advanced Approaches Risk-Based Capital Rule, and Market Risk Capital Rule. October 11, vol. 78, p. 62018, Washington, D.C: Office of the Federal Register.
- Federal Register. 2015. Regulatory Capital Rules: Implementation of Risk-Based Capital Surcharges for Global Systemically Important Bank Holding Companies. August 14, vol. 80, p. 49081, Washington, D.C: Office of the Federal Register.
- Flannery, Mark. 2014. Maintaining Adequate Bank Capital. Journal of Money Credit and Banking 46: 157–80. [Google Scholar] [CrossRef]
- Haldane, Andrew G. 2011. “Capital Discipline”. BIS Central Bankers’ Speeches. Available online: http://www.bis.org/review/r110325a.pdf (accessed on 30 October 2018).
- Haldane, Andrew G. 2012. “The Dog and the Frisbee”. BIS Central Bankers’ Speeches. Available online: https://www.bis.org/review/r120905a.pdf (accessed on 30 October 2018).
- Herring, Richard. 2016. Less Really Can be More: Why Simplicity & Comparability Should be Regulatory Objectives. Atlantic Econonomic Journal 4: 33–50. [Google Scholar]
- Herring, Richard. 2018. The Evolving Complexity of Capital Regulation. Journal of Financial Services Research 53: 183–205. [Google Scholar] [CrossRef]
- Hogan, Thomas. 2015. Capital and Risk in Commercial Banking: A Comparison of Capital and Risk-based Capital Ratios. Quarterly Review of Economics and Finance 57: 32–45. [Google Scholar] [CrossRef]
- Hogan, Thomas, and Neil Meredith. 2016. Risk and Risk-based Capital of U.S. Bank Holding Companies. Journal of Regulatory Economics 49: 86–112. [Google Scholar] [CrossRef]
- International Monetary Fund. 2009. Global Financial Stability Report, Chapter 3. Available online: http://www.imf.org/external/pubs/ft/gfsr/2009/01/pdf/chap3.pdf (accessed on 30 October 2018).
- Jones, David. 2000. Emerging Problems with the Basel Capital Accord: Regulatory Capital Arbitrage and Related Issues. Journal of Banking and Finance 24: 35–58. [Google Scholar] [CrossRef]
- Kapstein, Ethan. 1991. Supervising International Banks: Origins and Implications of the Basle Accord. Essays in International Finance, No. 185. Princeton: International Finance Section, Princeton University. [Google Scholar]
- Kapstein, Ethan. 1994. Governing the Global Economy. Cambridge: Harvard University Press. [Google Scholar]
- Karmakar, Sudipto. 2016. Macroprudential Regulation and Macroeconomic Activity. Journal of Financial Stability 25: 166–78. [Google Scholar] [CrossRef]
- Killian, Thomas W. 2016. Total Loss Absorbing Capacity (TLAC). New York: Sandler O’Neill and Partners. [Google Scholar]
- McLaughlin, Patrick A., and Oliver Sherouse. 2018. RegData US 3.1 Annual (dataset). QuantGov. Mercatus Center at George Mason University, Arlington, VA. Available online: https://quantgov.org/regdata/ (accessed on 30 October 2018).
- Merton, Robert. 1995. Financial Innovation and the Management and Regulation of Financial Institutions. Journal of Banking and Finance 19: 461–81. [Google Scholar] [CrossRef]
- Miller, Stephen Matteo. 2018. The Recourse Rule, Regulatory Arbitrage and the Crisis. Journal of Regulatory Economics 54: 195–217. [Google Scholar] [CrossRef]
- Mora, Ricardo, and Iliana Reggio. 2017. Alternative diff-in-diffs Estimators with Several Pretreatment Periods. Econometric Reviews. [Google Scholar] [CrossRef]
- Office of the Inspector General. 2015. The Board Identified Areas of Improvement for Its Supervisory Stress Testing Model Validation Activities, and Opportunities Exist for Further Enhancement. Available online: https://oig.federalreserve.gov/reports/board-supervisory-stress-testing-model-validation-oct2015.pdf (accessed on 30 October 2018).
- White, Eugene. 2013. To Establish a More Effective Supervision of Banking. In The Origins, History, and Future of the Federal Reserve: A Return to Jekyll Island. Edited by Michael D. Bordo and William Roberds. Cambridge: Cambridge University Press, pp. 7–54. [Google Scholar]
| 1 | The authors are extremely grateful for helpful comments provided by three referees, and would also like to thank Hester Peirce, Tracy Miller, Jerry Ellig and Thomas Stratmann for valuable feedback. Also, Yanfei Sun provided excellent assistance in helping the authors collect information and prepare all the tables for the paper. |
| 2 | See “Basel Committee Membership” page, Bank for International Settlements, last updated 30 December 2016, http://www.bis.org/bcbs/membership.htm. |
| 3 | See “Policy Development and Implementation Review”, Bank for International Settlements, as of the 30 December 2016 update, https://www.bis.org/bcbs/review_process.htm. |
| 4 | For the International Lending and Supervision Act of 1983, see Title IX of Public Law No. 98–181, 97 Stat. 1278. |
| 5 | By 2014, all 27 BCBS member countries had implemented or were in the process on implementing Basel II (meaning at least one subsection had been implemented), while another 94 non-BCBS jurisdictions had done the same (see BCBS 2014b). |
| 6 | On 7 December 2017, the BCBS released “Basel III: Finalising post-crisis reforms”, available from https://www.bis.org/bcbs/publ/d424.htm (BCBS 2017), which the industry has already begun referring to as “Basel IV”. While the 2011 Basel III guidelines focused on perceived problems with the numerator in regulatory capital ratios, the 2017 “Basel IV” guildelines focus on perceived problems with the denominator in regulatory capital ratios by proposing new risk-weights. However, US regulators have not finalized regulations based on these guidelines so we omit them from the discussion here. |
| 7 | Under the supervisory review process, the second pillar of the Basel Capital Accord, supervisors may determine capital adequacy should be even higher based upon a bank’s operating environment. |
| 8 | |
| 9 | The table also reflects the effect of the implementation of the Dodd-Frank Act on capital requirements. |
| 10 | See Comptroller of the Currency, Federal Register 2013. To see how the new regulations increase complexity, Herring (2018) estimates that capital requirement have five distinct numerators and denominators, which generate 39 distinct capital requirements for US GSIBs; that estimate assumes all capital ratios were implemented in full, and the number would increase if the phase-in periods were used instead. |
| 11 | See Section 171 of the “Dodd-Frank Wall Street Reform and Consumer Protection Act,” Public Law No. 111–203, 124 Stat. 1376. |
| 12 | The FSB and BCBS provide the list of GSIBs, using the assessment methodology published by BCBS. See Financial Stability Board, “2015 update of list of global systemically important banks (GSIBs)”, 3 November 2015. See also Board of Governors of the Federal Reserve System, Federal Register 2015. |
| 13 | |
| 14 | By contrast, the Federal Reserve, Federal Deposit Insurance Corporation, and Office of the Comptroller of the Currency finalized a joint rulemaking known as the “Recourse Rule” on 29 November 2001. See Office of the Comptroller of the Currency, Board of Governors of the Federal Reserve System, Federal Deposit Insurance Corporation, and Office of Thrift Supervision, Federal Register 2001. The Recourse Rule set capital requirements for private label asset- and mortgage-backed securities and other positions in securitization transactions (except for credit-enhancing interest-only strips) according to their relative risk using credit ratings from rating agencies to measure the level of risk. As Erel et al. (2014, p. 411) note, after this change “a bank that made subprime loans was better off holding them on its books as securities backed by these loans than holding the loans directly”. As they point out, the regulatory capital charge became a function of the securities’ credit ratings rather than their asset class. Miller (2018) shows that the largest banking organizations with subsidiaries that commented on the regulation during the notice and comment period began increasing their holdings of the highly-rated, private label securitization tranches once the rule went into effect, and that those that held more after 2008 on average experienced greater subsequent rises in default risk and stock price volatility. |
| 15 | Under US generally accepted accounting principles (GAAP), banks are allowed to report their derivatives on a net basis. Under international financial reporting standards (IFRS), European banks are generally required to report their derivatives on a gross basis. This leads to a substantial decrease in the size of the balance sheet for large US banks as compared to large European banks. |
| 16 | The OCC regulates banks with a national charter. The Federal Reserve regulates bank and financial holding companies, as well as banks with state charters that are Federal Reserve member banks. The FDIC regulates banks with state charters that are not Federal Reserve member banks. |
| 17 | We exclude “Part 226—Truth In Lending” from the measure for FRS regulatory restrictions, given that that part generates by far the largest fraction of regulatory restrictions for the FRS, but does not concern the other regulators. If we include that part, the fraction falls to about 8 percent by the end of the sample. |
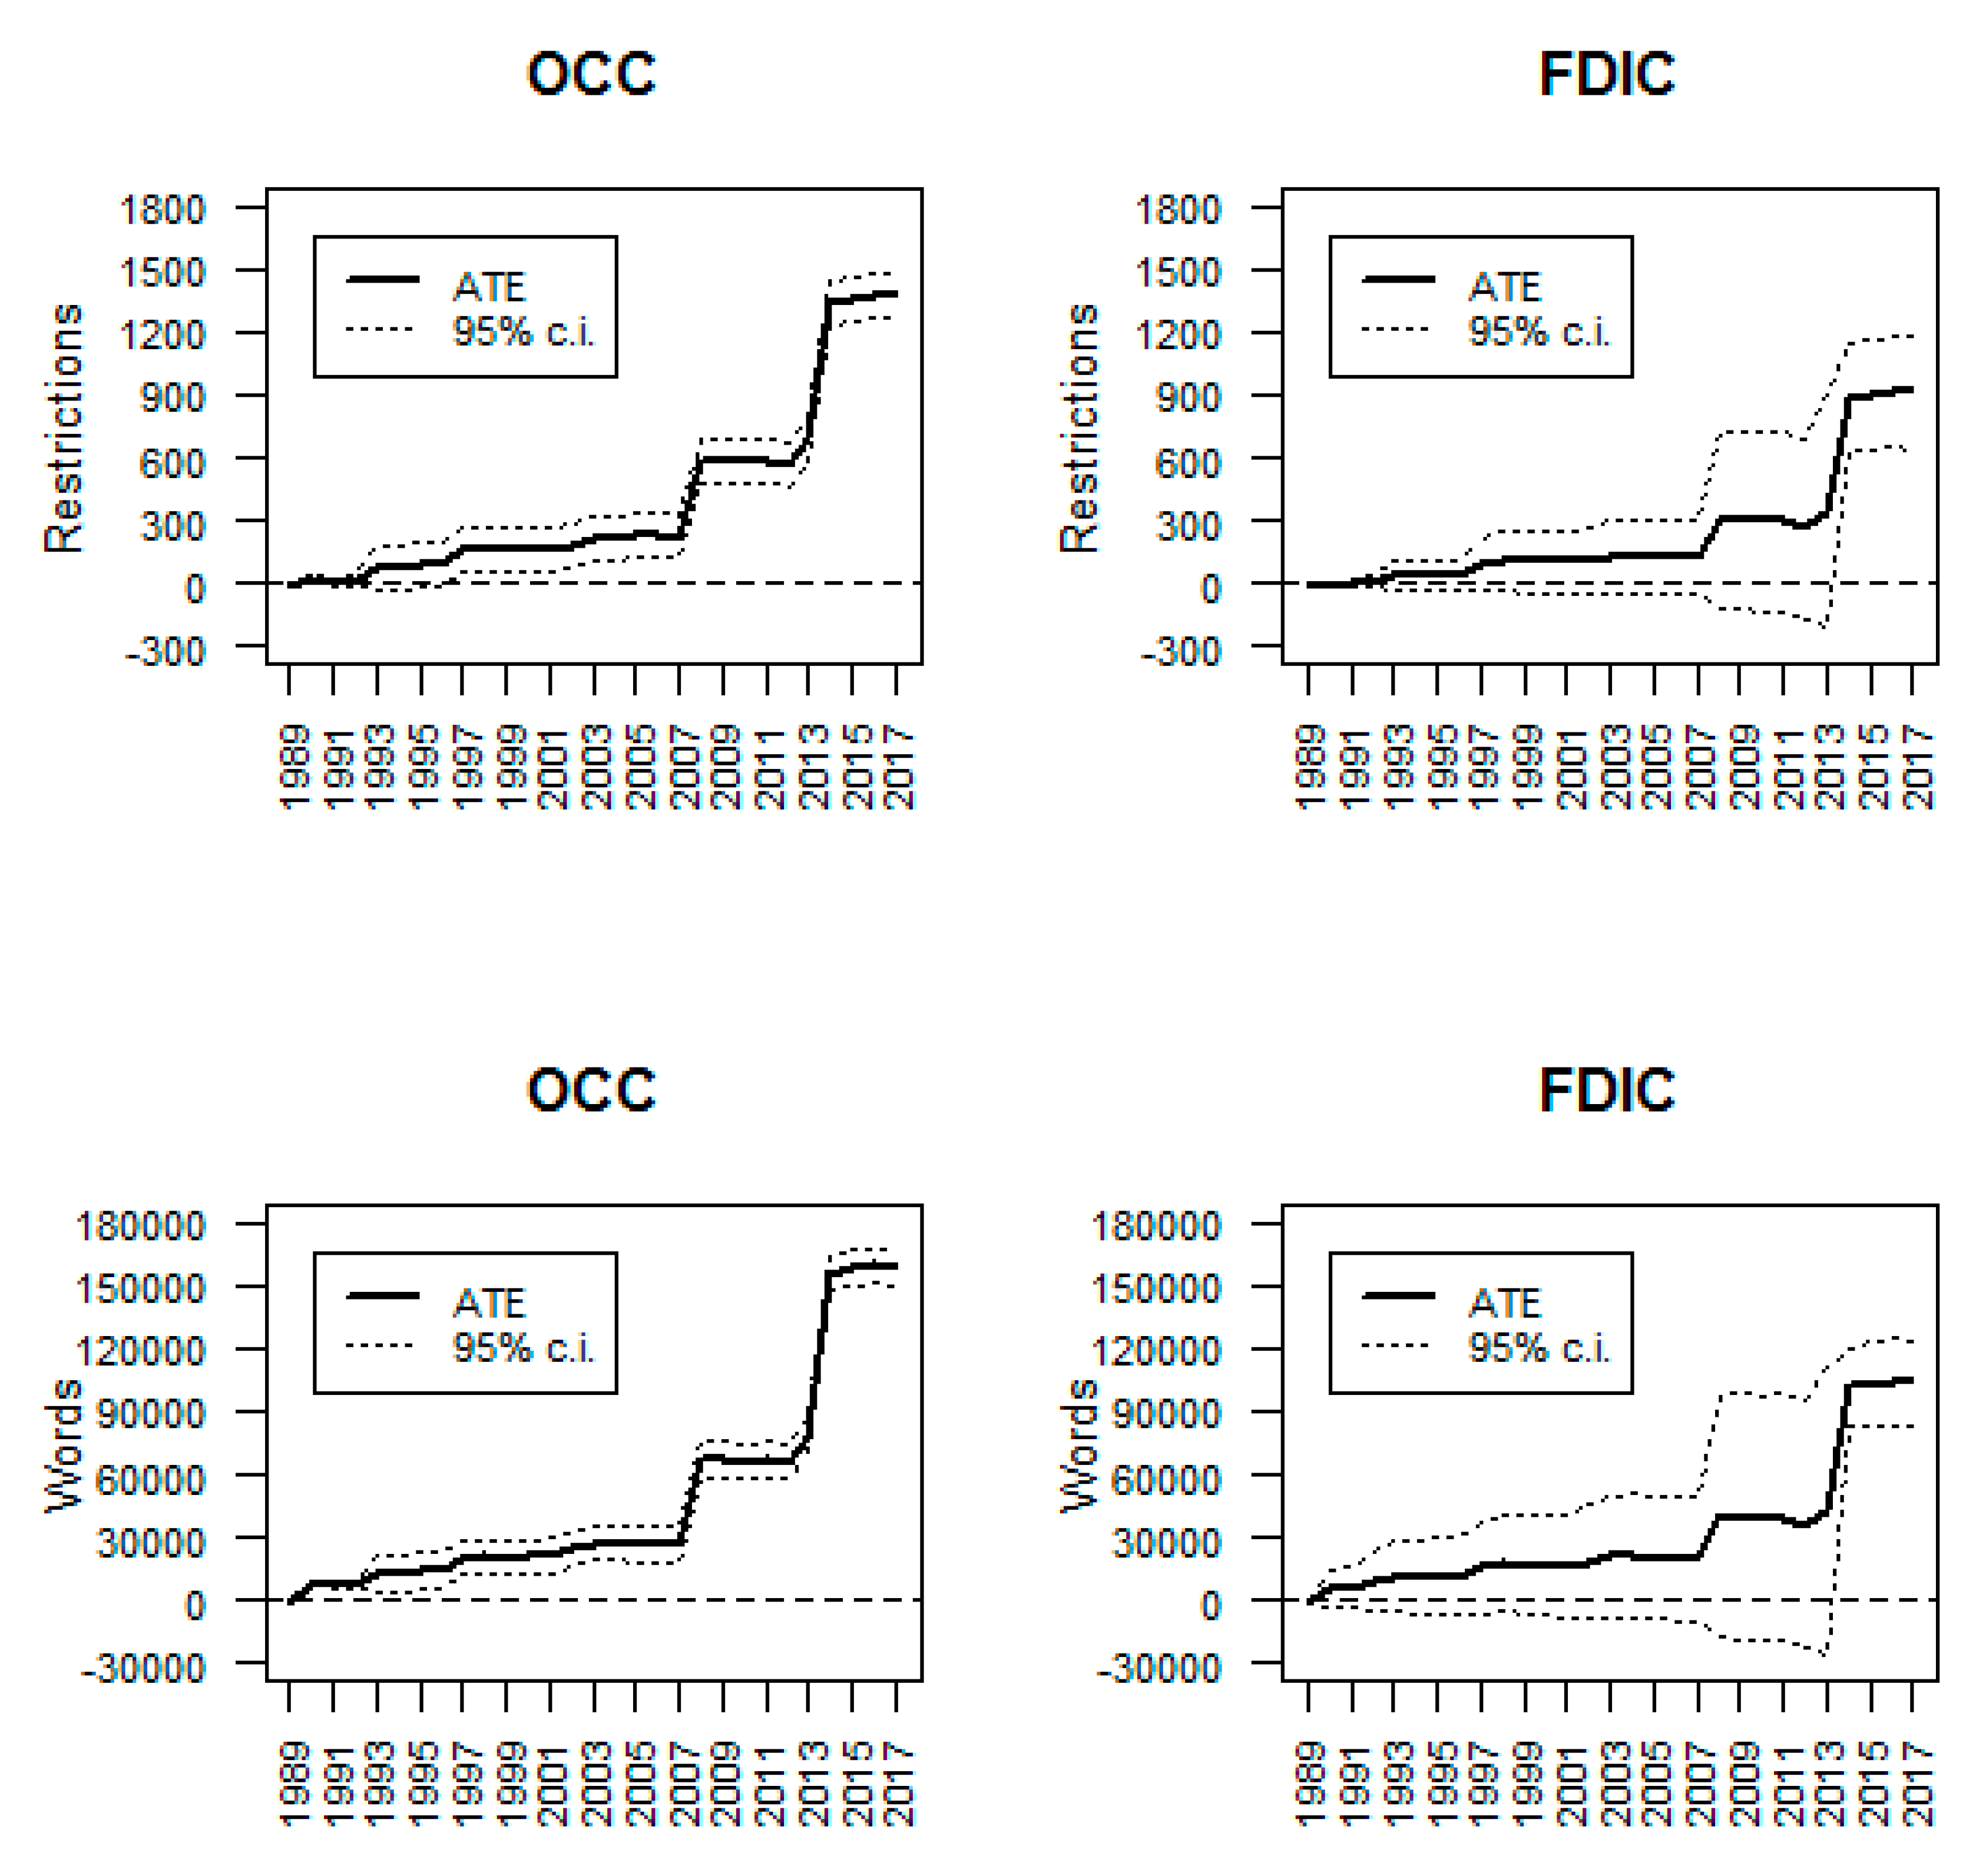
| 18 | The specification used to estimate the average treatment effects is, , where is the coefficient estimate of interest. We estimate the model with standard errors clustered by CFR part. The sample used to estimate the models for the OCC have 1285 observations and 91 parts, and the R-Squared for the model applied to restrictions (word counts) equals 0.29 (0.45). The sample used to estimate the models for the FDIC have 1513 observations and 59 parts, and the R-Squared for the model applied to restrictions (word counts) equals 0.12 (0.21). While Mora and Reggio’s method does not include fixed effects, the trends in the time dummy-treatment variable interaction terms whether or not we include fixed effects are often visually indistinguishable. In addition, the median difference between pooled OLS and fixed effects estimates as a fraction of the fixed effects interaction term estimates for OCC restrictions or word counts equals 0.01 and for FDIC restrictions or word counts equals 0.10 and 0.03, respectively. |
| 19 | For OCC restrictions (word counts) the p-value for tests of the hypothesis of common pre-treatment dynamics equals 0.62 (0.21). For FDIC restrictions (word counts) the p-value for tests of the hypothesis of common pre-treatment dynamics equals 0.17 (0.47). Therefore, we report the parallel paths rather than parallel growth results. |
| 20 | For the Federal Deposit Insurance Corporation Improvement Act (FDICIA) of 1991, see Public Law 102–242, 105 Stat. 2236. See also Balla et al. (2017) and Cole and White (2017) for a discussion. |
| 21 | For the final rule for supervisory guidance on banking organizations with greater than $10 billion in total consolidated assets, see Federal Register 2012f. For the OCC’s annual stress test final rule, see Federal Register 2012c. For the FDIC’s annual stress test final rule, see Federal Register 2012b. For the Fed’s final rule for supervisory and company-run stress tests, see Federal Register 2012e. For the Fed’s final rule for company-run stress tests for banking organizations with greater than $10 billion in total consolidated assets, see Federal Register 2012a. |
| 22 | |
| 23 | See Federal Reserve System, Federal Register 2012e. |
| 24 | As of June 30, 2016, there were 112 IDIs (1.9 percent of all IDIs) with $10 billion or more in assets and they accounted for $13,540 billion in assets (81.9 percent of the assets of all IDIs) (see FDIC Quarterly Banking Profile, Second Quarter 2016). At the same time, there were 97 BHCs (2.3 percent of all BHCs) with $10 billion or more in assets and they accounted for $15,386 billion in assets (93 percent of the assets of all BHCs). |
| 25 | See Office of the Inspector General 2015, pp. 9, 11. |
| 26 | |
| 27 | It should be noted that BNY Mellon would not have had enough capital to meet this minimum ratio from 2007 to 2017Q3. However, BNY Mellon is a large custodial bank that provides investment management, investment services and wealth management that help institutions and individuals succeed in markets all over the world. Given its business model that is quite unique, this lack of capital posed no significant risk. Indeed, in February 2009, it was one of only three of the nation’s 19 largest banks that when stress-tested would be profitable in 2010 (see http://archive.fortune.com/2009/07/23/news/companies/tarp_banks_new_york_mellon.fortune/index.htm). In 2013, stress tests indicated it was the bank least affected by hypothetical extreme economic scenarios among banks tested (see https://www.americanbanker.com/news/fed-unveils-dodd-frank-stress-test-results). |
| 28 | A referee points out that the advantage of market based indicators is that they may incorporate risk increase faster and on a continuous basis respect to accounting based measures that can only be updated quarterly and with a significant time lapse. It is added, however, that market based ratios tend to also reflect all the noise and irrational recurrent market dynamics (plus they are available only for listed banks with a liquid market). |
| 29 | |
| 30 | In 2016 Douglas Elliott was the lead author of a 150-page study analyzing the impacts of the Basel reforms, building on a similar paper from several years earlier for the IMF. |
| 31 | |
| 32 | As a referee pointed out, the lack of any clear message may be better appreciated by comparing the evolution of a bank’s capital ratio with its ratings. Given the current length of this paper, this exercise is left for another time. |
| 33 | For a discussion of the appropriate level of the regulatory capital ratio that takes into account the risk of a systemic banking crisis, see for example Karmakar (2016), Begenau and Landvoigt (2017), Egan et al. (2017), Barth and Miller (2018) and references therein. It should also be noted that a referee indicated that in the supervisory risk assessment process a bank’s specific risk factors could and should be taken into account so that the capital requirement could be set and measured in terms of a simple indicator such as the leverage ratio. |


| Regulatory Capital Standards | Basel I a (%) | Basel II b (%) | Basel II.5 c (%) | Basel III d (%) | ||||||
|---|---|---|---|---|---|---|---|---|---|---|
| 1993–2010 | 2011 | 2012 | 2013 | 2014 | 2015 | 2016 | 2017 | 2018 | as of 1 January 2019 | |
| Minimum Tier 1 capital (CET1 plus additional Tier 1) | 4.0 | 4.0 | 4.0 | 4.5 | 5.5 | 6.0 | 6.0 | 6.0 | 6.0 | 6.0 |
| Minimum total capital (Tier 1 plus Tier 2 capital) | 8.0 | 8.0 | 8.0 | 8.0 | 8.0 | 8.0 | 8.0 | 8.0 | 8.0 | 8.0 |
| Common equity leverage ratio e (viewed as a backstop to risk-based ratios) | n/a | supervisory monitoring | test period and disclosure starts 1 January 2015 | 3.0 | 3.0 | |||||
| Minimum CET1 capital ratio | n/a | 2.0 | 2.0 | 3.5 | 4.0 | 4.5 | 4.5 | 4.5 | 4.5 | 4.5 |
| Phase-in of deductions from CET1 (including amounts exceeding the limit for deferred tax assets, mortgage servicing rights, and financials) | n/a | n/a | n/a | n/a | 20 | 40 | 60 | 80 | 100 | 100 |
| Capital conservation buffer | n/a | n/a | n/a | n/a | n/a | n/a | 0.625 | 1.25 | 1.875 | 2.50 |
| Countercyclical capital buffer (discretionary, 0.0% to 2.5%), to be filled with Tier 1 capital | n/a | n/a | n/a | n/a | n/a | n/a | 0.625 | 1.25 | 1.875 | 2.50 |
| Capital surcharge for global systemically important banks | n/a | n/a | n/a | n/a | n/a | n/a | 0.25 to 3.5 | 0.5 to 3.5 | 0.75 to 3.5 | 1 to 3.5 |
| Capital instruments that no longer qualify as noncommon equity Tier 1 capital or Tier 2 capital | n/a | n/a | n/a | 10% per year phase out over 10-year horizon beginning 1 January 2013 f | ||||||
| Tier 1 capital | At least 50 percent of a bank’s capital base to consist of a core element comprised of equity capital and published reserves from post-tax retained earnings minus goodwill |
| Tier 2 capital | Undisclosed reserves, asset revaluation reserves, general provisions/general loan-loss reserves, hybrid (debt/equity) capital instruments and subordinated debt, and limited to a maximum of 100 percent of the total of Tier 1 elements |
| Regulatory Capital Requirements | US minimum Capital Standards Based on Basel I a (%) | Basel II b (%) | Basel II.5 c (%) | Basel III d (%) | |||||||
|---|---|---|---|---|---|---|---|---|---|---|---|
| 1991–1992 | 1993–2010 | 2011 | 2012 | 2013 | 2014 | 2015 | 2016 | 2017 | 2018 | as of 1 January 2019 | |
| Minimum Tier 1 capital (CET1 + additional Tier 1) | 3.625 | 4.0 | 4.0 | 4.0 | 4.5 | 5.5 | 6.0 | 6.0 | 6.0 | 6.0 | 6.0 |
| Minimum total capital (Tier 1 + Tier 2 capital) | 7.25 | 8.0 | 8.0 | 8.0 | 8.0 | 8.0 | 8.0 | 8.0 | 8.0 | 8.0 | 8.0 |
| Tier 1 leverage ratio and supplementary leverage ratio e (viewed as a complement to risk-based ratios) f | 4 (3 for banks that are CAMELS 1-rated) | 4 | 4 | 4 | 3 (AA) | 3 (AA) | |||||
| 5 (GSIBs and 6 for their IDIs) | 5 (GSIBs and 6 for their IDIs) | ||||||||||
| 4 (NAA) | 4 (NAA) | ||||||||||
| Minimum CET1 capital ratio (introduced in 2009 in the United States) | n/a | n/a | n/a | n/a | 3.5 | 4.0 | 4.5 | 4.5 | 4.5 | 4.5 | 4.5 |
| Phase-in of deductions from CET1 (including amounts exceeding the limit for deferred tax assets, mortgage servicing rights, and financials) | n/a | n/a | n/a | n/a | n/a | 20.0 | 40.0 | 60.0 | 80.0 | 100.0 | 100.0 |
| Capital conservation buffer g | n/a | n/a | n/a | n/a | n/a | n/a | n/a | 0.625 | 1.25 | 1.875 | 2.5 |
| Countercyclical capital buffer for AA banks (discretionary, 0.0% to 2.5%) | n/a | n/a | n/a | n/a | n/a | n/a | n/a | 0.625 | 1.25 | 1.875 | 2.5 |
| Capital surcharge for GSIBs h | n/a | n/a | n/a | n/a | n/a | n/a | n/a | 0.25 to 4.5 | 0.50 to 4.5 | 0.75 to 4.5 | 1 to 4.5 |
| Capital instruments that no longer qualify as CET1 or Tier 1 capital i | n/a | n/a | n/a | n/a | n/a | 80 | 60 | 40 | 20 | 0 | 0 |
| Regulatory Capital Components | Basel I a | Basel II b | Basel II.5 c | Basel III d | |
|---|---|---|---|---|---|
| 1991–1992 | 1993–2010 | 2011 | 2012 | 2013 to as of 1 January 2019 | |
| Tier 1 capital (old) | Common equity + preferred stock + qualifying hybrids + minority interests − (goodwill + other intangibles, except for MSRs, PCCR, and DTAs) | n/a | |||
| Tier 2 capital (old) | Undisclosed reserves + assets revaluation reserves + general provisions/general loan loss reserves + preferred stock + qualifying hybrids + subordinated debt | n/a | |||
| Tier 3 capital (old) | n/a | n/a | Short-term subordinated debt, solely to support the market risks in the trading book e | n/a | |
| CET1, going-concern capital (new) | n/a | n/a | n/a | n/a | Common stock and retained earnings ± limited accumulated other comprehensive income items for opt-out banks (or accumulated other comprehensive income for non-opt-out and advanced-approaches banks) ± deductions and adjustments + qualifying CET1 minority interest − (goodwill + deferred tax assets + other intangibles) |
| Additional Tier 1 capital (AT1), going-concern capital (new) | n/a | n/a | n/a | n/a | Noncumulative perpetual preferred stock, including surplus + SBLF & TARP (bank issued) + qualifying Tier 1 minority interest − certain investments in financial institutions |
| Tier 2 capital, gone-concern capital (new) | n/a | n/a | n/a | n/a | Limited allowance for loan and lease losses + preferred stock and subordinated debt + qualifying Tier 2 minority interest − Tier 2 investments in financial institutions |
| Total capital (CET1 capital + AT1, or Tier 1 capital, + Tier 2 capital) | n/a | n/a | n/a | n/a | All of the above items with limits eliminated on subordinated debt and limited-life preferred stock in Tier 2 capital and no limit on Tier 2 capital |
| Capital conservation buffer (CCB) (new) | n/a | n/a | n/a | n/a | CET1 (CCB ratio must be in excess of CET1, Tier 1 and total capital ratios by at least 2.5% to avoid limits on capital distributions and certain discretionary bonus payments) |
| Countercyclical capital buffer (new) | n/a | n/a | n/a | n/a | CET1 |
| Capital surcharge for global systemically important banks (new) | n/a | n/a | n/a | n/a | CET1 |
| Leverage capital | Tier 1 (old) | Tier 1 (old) | Tier 1 (old) | Tier 1 (old) | CET1 + AT1 (new Tier 1) |
| Selected Items | Existing Basel I–Based Risk Weights a | US Basel III Final Rule Standardized Risk Weights b | ||
|---|---|---|---|---|
| Cash | 0% | 0% | ||
| Exposures to, and portions of exposures that are directly and unconditionally guaranteed by, the US government, its agencies, and the Federal Reserve | 0% | 0% | ||
| Exposures to foreign governments and their central banks | 0% for direct and unconditional claims on Organisation for Economic Co-operation and Development (OECD) governments 20% for conditional claims on OECD governments 100% for claims on non-OECD governments that entail some degree of transfer risk | Risk weight depends on the sovereign’s OECD | ||
| country risk classification (CRC) | ||||
| Risk weight | ||||
| Sovereign CRC | 0–1 | 0% | ||
| 2 | 20% | |||
| 3 | 50% | |||
| 4–6 | 100% | |||
| 7 | 150% | |||
| OECD member with no CRC | 0% | |||
| Non-OECD member with no CRC | 100% | |||
| Sovereign default | 150% | |||
| Exposures to US government-sponsored enterprises | 20% | 20% | ||
| Exposures to US public-sector entities, including US states and municipalities | 20% for general obligations | 20% for general obligations | ||
| 50% for revenue obligations | 50% for revenue obligations | |||
| Exposures to foreign public-sector entities | 20% for general obligations of states and political subdivisions of OECD countries 50% for revenue obligations of states and political subdivisions of OECD countries 100% for all obligations of states and political subdivisions of non-OECD countries | Risk weight depends on the home country’s CRC | ||
| Risk weight for general obligations | ||||
| Sovereign CRC | 0–1 | 20% | ||
| 2 | 50% | |||
| 3 | 100% | |||
| 4–7 | 150% | |||
| OECD member with no CRC | 20% | |||
| Non-OECD member with no CRC | 100% | |||
| Sovereign default | 150% | |||
| Risk weight for revenue obligations | ||||
| Sovereign CRC | 0–1 | 50% | ||
| 2–3 | 100% | |||
| 4–7 | 150% | |||
| OECD member with no CRC | 50% | |||
| Non-OECD member with no CRC | 100% | |||
| Sovereign default | 150% | |||
| Exposures to US depository institutions and credit unions | 20% | 20% | ||
| Exposures to foreign banks | 20% for all claims on banks in OECD countries 20% for short-term claims on banks in non-OECD countries 100% for long-term claims on banks in non-OECD countries | Risk weight depends on the home country’s CRC | ||
| Risk weight | ||||
| Sovereign CRC | 0–1 | 20% | ||
| 2 | 50% | |||
| 3 | 100% | |||
| 4–7 | 150% | |||
| OECD member with no CRC | 20% | |||
| Non-OECD member with no CRC | 100% | |||
| Sovereign default | 150% | |||
| Exposures to nonbank corporations | 100% | 100% | ||
| Exposures to residential mortgages | 50% for a first-lien residential mortgage exposure that is: secured by a property that is either owner-occupied or rented; made in accordance with prudent underwriting standards; not 90 days or more past due or carried in nonaccrual status; and not restructured or modified (unless restructured or modified solely pursuant to the US Treasury’s Home Affordable Mortgage Program) | Retains existing capital treatment: | ||
| 100% for all other residential mortgage exposures | 50% for a first-lien residential mortgage exposure that is: secured by a property that is either owner-occupied or rented; made in accordance with prudent underwriting standards; not 90 days or more past due or carried in nonaccrual status; and not restructured or modified (unless restructured or modified solely pursuant to the US Treasury’s Home Affordable Modification Program) | |||
| 100% for all other residential mortgage exposures | ||||
| Exposures to high-volatility commercial real estate loans | 100% | 150% (the definition of high-volatility commercial real estate only captures a specific subset of acquisition, development, and construction loans; not all commercial real estate loans) | ||
| Exposures to over-the-counter derivatives | Risk weight depends on counterparty category (e.g., bank, securities firm, or general corporation), subject to a 50% risk-weight ceiling | Removes the 50% risk-weight ceiling for over-the-counter derivatives | ||
| Exposures to securitizations | Ratings-based approach: risk weight depends on the external credit rating assigned to the securitization exposure | General 20% risk-weight floor for securitization exposures | ||
| Default risk weight for items not specifically assigned to a risk-weight category | 100% | 100% | ||
| Conversion factors that are used to measure the risk of off-balance-sheet items | 0–100% | 0–100% | ||
| PCA Threshold | Old PCA Categories (IDIs) a | New PCA Categories (IDIs) b | ||||||
|---|---|---|---|---|---|---|---|---|
| Tier 1 Leverage (%) | Tier 1 RBC (%) | Total RBC (%) | Tier 1 Leverage (%) | Tier 1 Capital (%) | Common Equity Tier 1 RBC (%) | Total RBC (%) | Supplementary Leverage Ratio (AA/IDIs only) | |
| Well capitalized | ≥5.0 | ≥6.0 | ≥10.0 | ≥5.0 | ≥8 | ≥6.5 | ≥10.0 | n/a |
| Adequately capitalized | ≥4.0 | ≥4.0 | ≥8.0 | ≥4.0 | ≥6 | ≥4.5 | ≥8.0 | ≥3 |
| Undercapitalized | <4.0 | <4.0 | <8.0 | <4.0 | <6 | <4.5 | <8.0 | <3 |
| Significantly undercapitalized | <3.0 | <3.0 | <6.0 | <3.0 | <4 | <3.0 | <6.0 | n/a |
| Critically undercapitalized | tangible equity/total assets ≤ 2% | n/a | ||||||
| Advanced-Approaches BHCs in CCAR 2015 | |||
|---|---|---|---|
| American Express Company (NYC, NY, USA) | Bank of America Corporation (CHARLOTTE, NC, USA) | Bank of New York Mellon Corporation (NYC, NY, USA) | Capital One Financial Corporation (NYC, NY, USA) |
| Citigroup Inc. (NYC, NY, USA) | Goldman Sachs Group Inc. (NYC, NY, USA) | HSBC North America Holdings Inc. (NYC, NY, USA) | JPMorgan Chase & Co. (NYC, NY, USA) |
| Morgan Stanley (NYC, NY, USA) | Northern Trust Corporation (CHICAGO, IL, USA) | PNC Financial Services Group Inc. (PITTSBURGH, PA USA) | State Street Corporation (BOSTON, MA, USA) |
| U.S. Bancorp (PORTLAND, OR, USA) | Wells Fargo & Co. (SAN FRANCISCO, CA, USA) | ||
| Other BHCs for CCAR 2015 | |||
| Ally Financial Inc. (DETROIT, MI, USA) | BB&T Corporation (WINSTON SALEM, NC, USA) | BBVA Compass Bancshares Inc. (BIRMINGHAM, AL, USA) | BMO Financial Corp. (WILMINGTON, DE, USA) |
| Citizens Financial Group Inc. (NEWHAVEN, MO, USA) | Comerica Incorporated (DALLAS, TX, USA) | Deutsche Bank Trust Corporation (NYC, NY, USA) | Discover Financial Services (RIVERWOODS, IL, USA) |
| Fifth Third Bancorp (CINCINNATI, OH, USA) | Huntington Bancshares Incorporated (COLUMBUS, OH, USA) | KeyCorp (ALBANY, NY, USA) | M&T Bank Corporation (BUFFALO, NY, USA) |
| MUFG Americas Holdings Corporation (NYC, NY, USA) | Regions Financial Corporation (BIRMINGHAM, AL, USA) | Santander Holdings USA Inc. (BOSTON, MA, USA) | SunTrust Banks Inc. (ATLANTA, GA, USA) |
| Zions Bancorporation (SALT LAKE CITY, UT, USA) | |||
| Minimum capital ratios in CCAR 2015 (%) | |||
| 2014:Q4 advanced-approaches BHCs | 2014:Q4 other BHCs | 2015–2016 all BHCs | |
| Tier 1 common ratio | 5 | 5 | 5 |
| Common equity Tier 1 ratio | 4 | not applicable | 4.5 |
| Tier 1 risk-based capital ratio | 5.5 | 4 | 6 |
| Total risk-based capital ratio | 8 | 8 | 8 |
| Tier 1 leverage ratio | 4 | 3 or 4 | 4 |
© 2018 by the authors. Licensee MDPI, Basel, Switzerland. This article is an open access article distributed under the terms and conditions of the Creative Commons Attribution (CC BY) license (http://creativecommons.org/licenses/by/4.0/).
Share and Cite
Barth, J.R.; Miller, S.M. On the Rising Complexity of Bank Regulatory Capital Requirements: From Global Guidelines to their United States (US) Implementation. J. Risk Financial Manag. 2018, 11, 77. https://doi.org/10.3390/jrfm11040077
Barth JR, Miller SM. On the Rising Complexity of Bank Regulatory Capital Requirements: From Global Guidelines to their United States (US) Implementation. Journal of Risk and Financial Management. 2018; 11(4):77. https://doi.org/10.3390/jrfm11040077
Chicago/Turabian StyleBarth, James R., and Stephen Matteo Miller. 2018. "On the Rising Complexity of Bank Regulatory Capital Requirements: From Global Guidelines to their United States (US) Implementation" Journal of Risk and Financial Management 11, no. 4: 77. https://doi.org/10.3390/jrfm11040077