Incorporating Credit Quality in Bank Efficiency Measurements: A Directional Distance Function Approach

Department of Management Sciences, COMSATS University Islamabad, 44000 Islamabad, Pakistan
*
Author to whom correspondence should be addressed.
J. Risk Financial Manag. 2018, 11(4), 78; https://doi.org/10.3390/jrfm11040078
Submission received: 20 August 2018
/
Revised: 28 October 2018
/
Accepted: 6 November 2018
/
Published: 9 November 2018
(This article belongs to the Special Issue Trends in Emerging Markets Finance, Institutions and Money)
Abstract
:The objective of the study was to measure the risk-adjusted efficiency of banks in 24 emerging economies for the period of 1999–2013. A two-stage network data envelopment analysis (DEA), with separate deposit mobilization and loan financing stages was used. Efficiency was measured using directional distance functions with DEA, featuring non-performing loans as undesirable outputs. The distributions of efficiency scores were different when credit quality was taken into account. The distribution of efficiency scores varied systematically with accumulation of non-performing loans across regions. The financial crisis of 2007–2008 impacted more adversely the regions that had higher proportions of non-performing loans in banks’ portfolios. The results of a follow-on non-parametric regression showed that smaller, better capitalized, and private banks were more efficient. The conditions conducive for high levels of technical efficiency by banks were found to be characterized by economic growth and low inflation.
1. Introduction
The financial system plays a vital role in the economic development of an economy. Financial intermediaries, particularly the banks, mobilize funds from a diverse set of savers to investors (Drigă and Dura 2014). Efficient intermediation contributes to growth (Saini and Sindhu 2014) and economic stability. On the other hand, crisis in the banking sector could lead to broader macroeconomic instability (Baily and Elliott 2009) and adversely impact growth (Moyo et al. 2014). Despite their crucial importance to the economy, banks are prone to agency problems that may induce some managers to take excessive risks (Acharya and Naqvi 2012), and potentially jeopardize bank solvency. According to one study, 73% of the 171 failed banks in the United States for the period of 1979–1987 engaged in aggressive risk-taking (Office of the Comptroller of the Currency 1988).
There is a voluminous body of literature on the efficiency of banks (Kumar and Gulati 2014). With a few exceptions, this literature did not take into account the excessive risk-taking, often manifested in the form of non-performing loans. Moreover, almost all previous studies employed a single-stage, black-box, conceptualization of banking operations (Färe and Grosskopf 2000).1 From a risk-modeling perspective, this is an inadequate representation of the actual banking operations, which have two stylized stages—a deposit mobilization stage and a loan financing stage—with excessive risk-taking relevant to the latter stage only. The technologies used for converting productive inputs into outputs may vary across different stages of bank operations; therefore, single-stage efficiency measurement approaches may lead to serious misspecification of the efficient technological frontier, and the resulting efficiency measurements may be misleading. To the best of our knowledge, there are only two studies that incorporated risk-taking or credit quality into efficiency measurements, following Chung et al. (1997), while using a sufficiently flexible representation of the banking operations (Akther et al. 2013; Fukuyama and Weber 2010). These studies, however, considered banks in single countries. There is a need for applying these more robust measurement approaches for investigating bank efficiency in a multi-country, emerging economy setting over time. This would allow the efficiency patterns to be compared across countries and regions and also make it possible to investigate the impacts on bank efficiency of macroeconomic shocks such as the 2007–2008 financial crisis.
The present study attempted to fill this gap. It used a two-stage network data envelopment analysis (DEA), with separate specification of technologies for the deposit mobilization and the loan financing stages using a directional distance function. In line with the stylized banking operations, the loan financing stage in the study was modeled with an undesirable output (non-performing loans) along with a good output. The risk-adjusted efficiency scores were found to be markedly different from scores obtained without accounting for bad loans, and these differences were more pronounced in the loan financing stage, thus underscoring the restrictive nature of the common technology assumption across banking operations that was extensively used in the extant literature. A second contribution of the study is that it investigated the determinant of bank efficiency using non-parametric regression that does not rely on ad hoc assumptions. Finally, the significant differences in measured efficiency scores across regions and countries served to highlight the importance of a studying bank efficiency in a cross-country setting in the emerging economies. The regional and cross-country comparisons are important as they help answer the question how global economic shocks, such as the Asian financial crisis of 1997 and the global financial crisis of 2007–2008, impacted bank efficiency in individual countries and regions.
2. Review of Literature
Abraham Charnes et al. (1978) invented the term data envelopment analysis and proposed an input-orientated DEA that measured efficiency in terms of radial contraction of input vectors necessary to reach the efficient frontier while assuming constant returns to scale. Banker, Charnes, and Cooper (1984) extended the DEA analysis to variable returns to scale (see (Emrouznejad and Yang 2017; Liu et al. 2013)).
Efficiency studies mostly model a single-stage decision-making process. However, many organizational operations, including banks, have multiple stages that offer possibilities for separate measurements of efficiency for each stage. The pioneering paper of A. Charnes et al. (1988) introduced the notion of network DEA structures for the measurement of efficiency in multi-stage operations.
The network DEA was used for measuring the efficiency of US banks across profitability and marketing stages (Seiford and Zhu 1999), Taiwanese banks for deposit mobilization and loan financing stages (Yang and Liu 2012), and Brazilian banks for cost efficiency and productive efficiency stages (Wanke and Barros 2014).
A separate strand of literature attempted to measure bank efficiency in the context of non-performing loans by employing single-stage directional distance functions (Chung et al. 1997), seeking to reduce inputs and undesirable outputs while increasing desirable outputs (Fukuyama and Weber 2008).
As mentioned earlier, credit risk arises in the second (loan financing) stage of banking operations. Given the considerable interest of the researchers in investigating efficiency measurements in the presence of non-performing loans, network DEA—with non-performing loans at the financing stage modeled as an undesirable output—is a natural direction for extending this literature. However, very few studies modeled bank efficiency in the presence of bad loans using the network DEA framework.
Wang et al. (2014) measured the efficiency of Chinese banks through hyperbolic Farrell-type efficiency measures proposed by Färe et al. (1989). The study divided the overall efficiency into two sub-processes, i.e., deposit producing and profit earning. Huang et al. (2014) examined the super efficiency of Chinese banks using a two-stage network model with bad outputs by extending the network slack-based measure model (NSBM) of Tone and Tsutsui (2009). The non-performing loans were modeled as a second-stage undesirable output.
Fukuyama and Weber (2010) proposed two-stage directional distance functions for measuring the efficiency of Japanese banks with non-performing loans as bad output in the second stage. Akther et al. (2013) estimated the efficiency of banks in Bangladesh through two-stage directional distance functions, which modeled bad loans as an undesirable output in the second stage. While these studies employed two-stage DEA and modeled undesirable outputs following Chung et al. (1997), they all focused on single countries. This is a serious limitation as it does not permit cross-country and regional comparisons of bank efficiency measurements, which, as noted above, could shed light on differential impacts on countries of common macroeconomic shocks such as global financial crises.
The selected countries were operated under different banking regulations and supervision. This was an important consideration investigated for cross-country comparison. Barth et al. (2013) conducted a survey to collect data and measures of bank regulatory and supervisory policies for the period of 1999–2011 in 180 countries. The authors collected the data based on several bank related questions. The study concluded that the supervision and regulation of banks differ in many dimensions across selected countries. Moreover, the study found divergence in bank regulatory regimes over the past decade despite the worst global financial crisis since the Great Depression.
Most DEA efficiency studies in the existing literature conducted a follow-on analysis to investigate the determinants of efficiency, using a Tobit model (Tobin 1958) that produced point estimates of contributions of different variables. This approach relies on ad hoc distributional assumptions. An alternative is non-parametric regression based on Kernel density estimation (Rosenblatt 1956), which does not suffer from ad hoc assumptions. For example, Illueca et al. (2009) examined the productivity of Spanish savings banks by employing kernel density estimations and non-parametric regression. However, the study did not consider non-performing loans within a multi-stage network DEA.
The present study makes the following contributions: (i) incorporation of credit risk in efficiency measurements of banks; (ii) use of a sufficiently flexible multi-stage network DEA framework, which better captures stylized banking operations where credit risk arises at the loan financing stage and manifests in the form of non-performing loans; (iii) extension of efficiency measurements to a multi-country setting making possible comparisons across countries; and application of non-parametric regression, avoiding ad hoc assumptions in estimating the impact of bank characteristics and other relevant variables on efficiency.
3. Methodology
3.1. Directional Distance Functions with Undesirable Outputs
Consider a technology T with inputs x ϵ , desirable outputs y ϵ , and undesirable outputs (such as bad loans) b ϵ . The directional distance function introduced by Chung et al. (1997), which seeks to directionally increase desirable outputs, while decreasing inputs and undesirable outputs, can be defined as follows:
where the nonzero vector g = () determines the directions in which the inputs, desirable outputs, and undesirable outputs are scaled. The reference technology set T = {(y, b): x can produce (y, b)} and is assumed to satisfy the assumptions of constant returns to scale, strong disposability of desirable outputs and inputs, and weak disposability of undesirable outputs.
Supposed there were k = 1, 2, … K decision-making units (DMUs). Then, according to Chung et al. (1997), the directional distance function can be obtained by solving the following DEA problem:
subject to
where is the efficient frontier formed as a linear combination of outputs of the other firms. Equation (2) states that the actual output () produced by the firm, plus the possible expansion (β), should be at most as large as the output represented by the efficient frontier. Likewise, Equation (3) requires that the input use (), minus the possible input contraction (β), should be at least as large as , the linear combination of inputs used by the other firms. The undesirable output, i.e., the bad loans are represented by , while is the possible reduction in the undesirable output. The weights are the intensity variables for expanding or shrinking the individual observed activities of DMUs to construct convex combinations of the observed inputs and outputs.
Given the network DEA, the efficiency scores were obtained separately for the deposit mobilization stage and the loan financing stages. The overall efficiency score for the bank was obtained by multiplying the two sores.
3.2. Non-Parametric Regression
Most previous studies that measured efficiency also attempted to model the determinants of efficiency in a second-stage follow-on regression, often employing the Tobit specification (McDonald 2009), which relies on ad hoc parametric assumptions. Ashraf et al. (2017) measured bank risk-taking behavior with three alternative proxies considered as dependent variables, while taking into account the non-performing loans as measures of risk in the efficiency measurement of banks. In contrast, the present study modeled the determinant of efficiency using non-parametric regression (Hayfield and Racine 2008), which does not rely on arbitrary assumptions. Moreover, it dealt differently with continuous and discrete variables.
where is the dependent variable, i.e., the efficiency score of the bank. Since regressors may be either continuous or discrete, the study defined = (), where refers to the vector of continuous regressors and refers to the vector of discrete regressors, t is the time in years, I is the bank in emerging economies, and N is the total sample observations (5685).
This non-parametric regression technique yields partial derivatives that are permitted to vary over the domain for the variable in question, in contrast with parametric multivariate linear regression techniques, in which the partial derivative is typically assumed to be constant over its domain (J. Racine 1997). The np package was used to estimate non-parametric regressions that suggested more robust interpretations (Hayfield and Racine 2008). The kernel bandwidths were selected via least-squares cross-validation and calculated as 3.45σ (J. S. Racine 2008). For hypothesis testing in non-parametric regression, the study employed the bootstrapping procedures for continuous variables proposed by J. Racine (1997) and Racine et al. (2006) for categorical variables.
4. Data
This study employed annual data of the banking sector from the BankScope database. The sample covered the study period of 1999–2013. The study analyzed the performance of 918 banks in 24 Emerging Economies from six regions of the world. The study included the following regions (number of banks): East Asia (213), Southeast Asia (164), South Asia (95), Latin America (244), Emerging Europe (126), and Africa and the Middle East (76). The combination of variables in both stages to measure the efficiency of banks is listed in Table 1.
In addition, the determinants of efficiency were investigated using the estimated efficiency scores from the DEA model as the dependent variable in a non-parametric regression, with the following bank characteristics, financial ratios, and macro variables as independent variables:
Size = log of total assets
Capital adequacy = ratio of total equity to total assets
Liquidity = ratio of total loans to total deposit
GDP_GR = growth rate of gross domestic product (GDP)
Inflation rate = annual inflation rate
Public bank dummy = 1 if the bank ownership is public; 0 otherwise.
Crisis 2007–2008 Dummy = 1 for the year 2007–2008; 0 otherwise.
East Asia dummy = 1 for banks from East Asia; 0 otherwise.
Southeast Asia dummy = 1 for banks from South East Asia; 0 otherwise.
South Asia dummy = 1 for banks from South Asia; 0 otherwise.
Latin America dummy = 1 for banks from Latin America; 0 otherwise.
Emerging Europe dummy = 1 for banks from Emerging Europe; 0 otherwise.
5. Results
The distributions of efficiency scores for each stage, as well as that of the overall score, are negatively skewed, as shown in Table 2, indicating clustering of individual banks’ scores at higher efficiency levels (see Figure 1).
The measured efficiency at the deposit mobilization stage was 93%, which indicates that, at this stage of operations, banks were highly efficient, possibly reflecting managerial performance metrics that reward deposit creation.
At the loan financing (second) stage, the efficiency level was 0.85 on average, and most measurements were clustered in the interval of 0.80–1.0. The banks were somewhat less efficient in the loan financing stage. This inefficiency was mainly caused by high non-performing loans because of adverse borrower selection. Our results were found to be consistent with the findings of Hamid et al. (2017); Zago and Dongili (2011).
A non-parametric Kolmogorov–Smirnov test was used to measure the equality of distributions of efficiency scores with and without the inclusion of undesirable outputs in modeling. A significant difference at the 1% level of significance was found. This implied that, once non-performing loans (NPLs) were taken into account, the technical efficiency of banks increased significantly, suggesting that an important aspect of banking production (i.e., credit quality) needs to be considered when evaluating banks’ performances. Several studies employed this test to investigate the equality of distributions (Banker et al. 2010; Johnes et al. 2014; Titko et al. 2014).
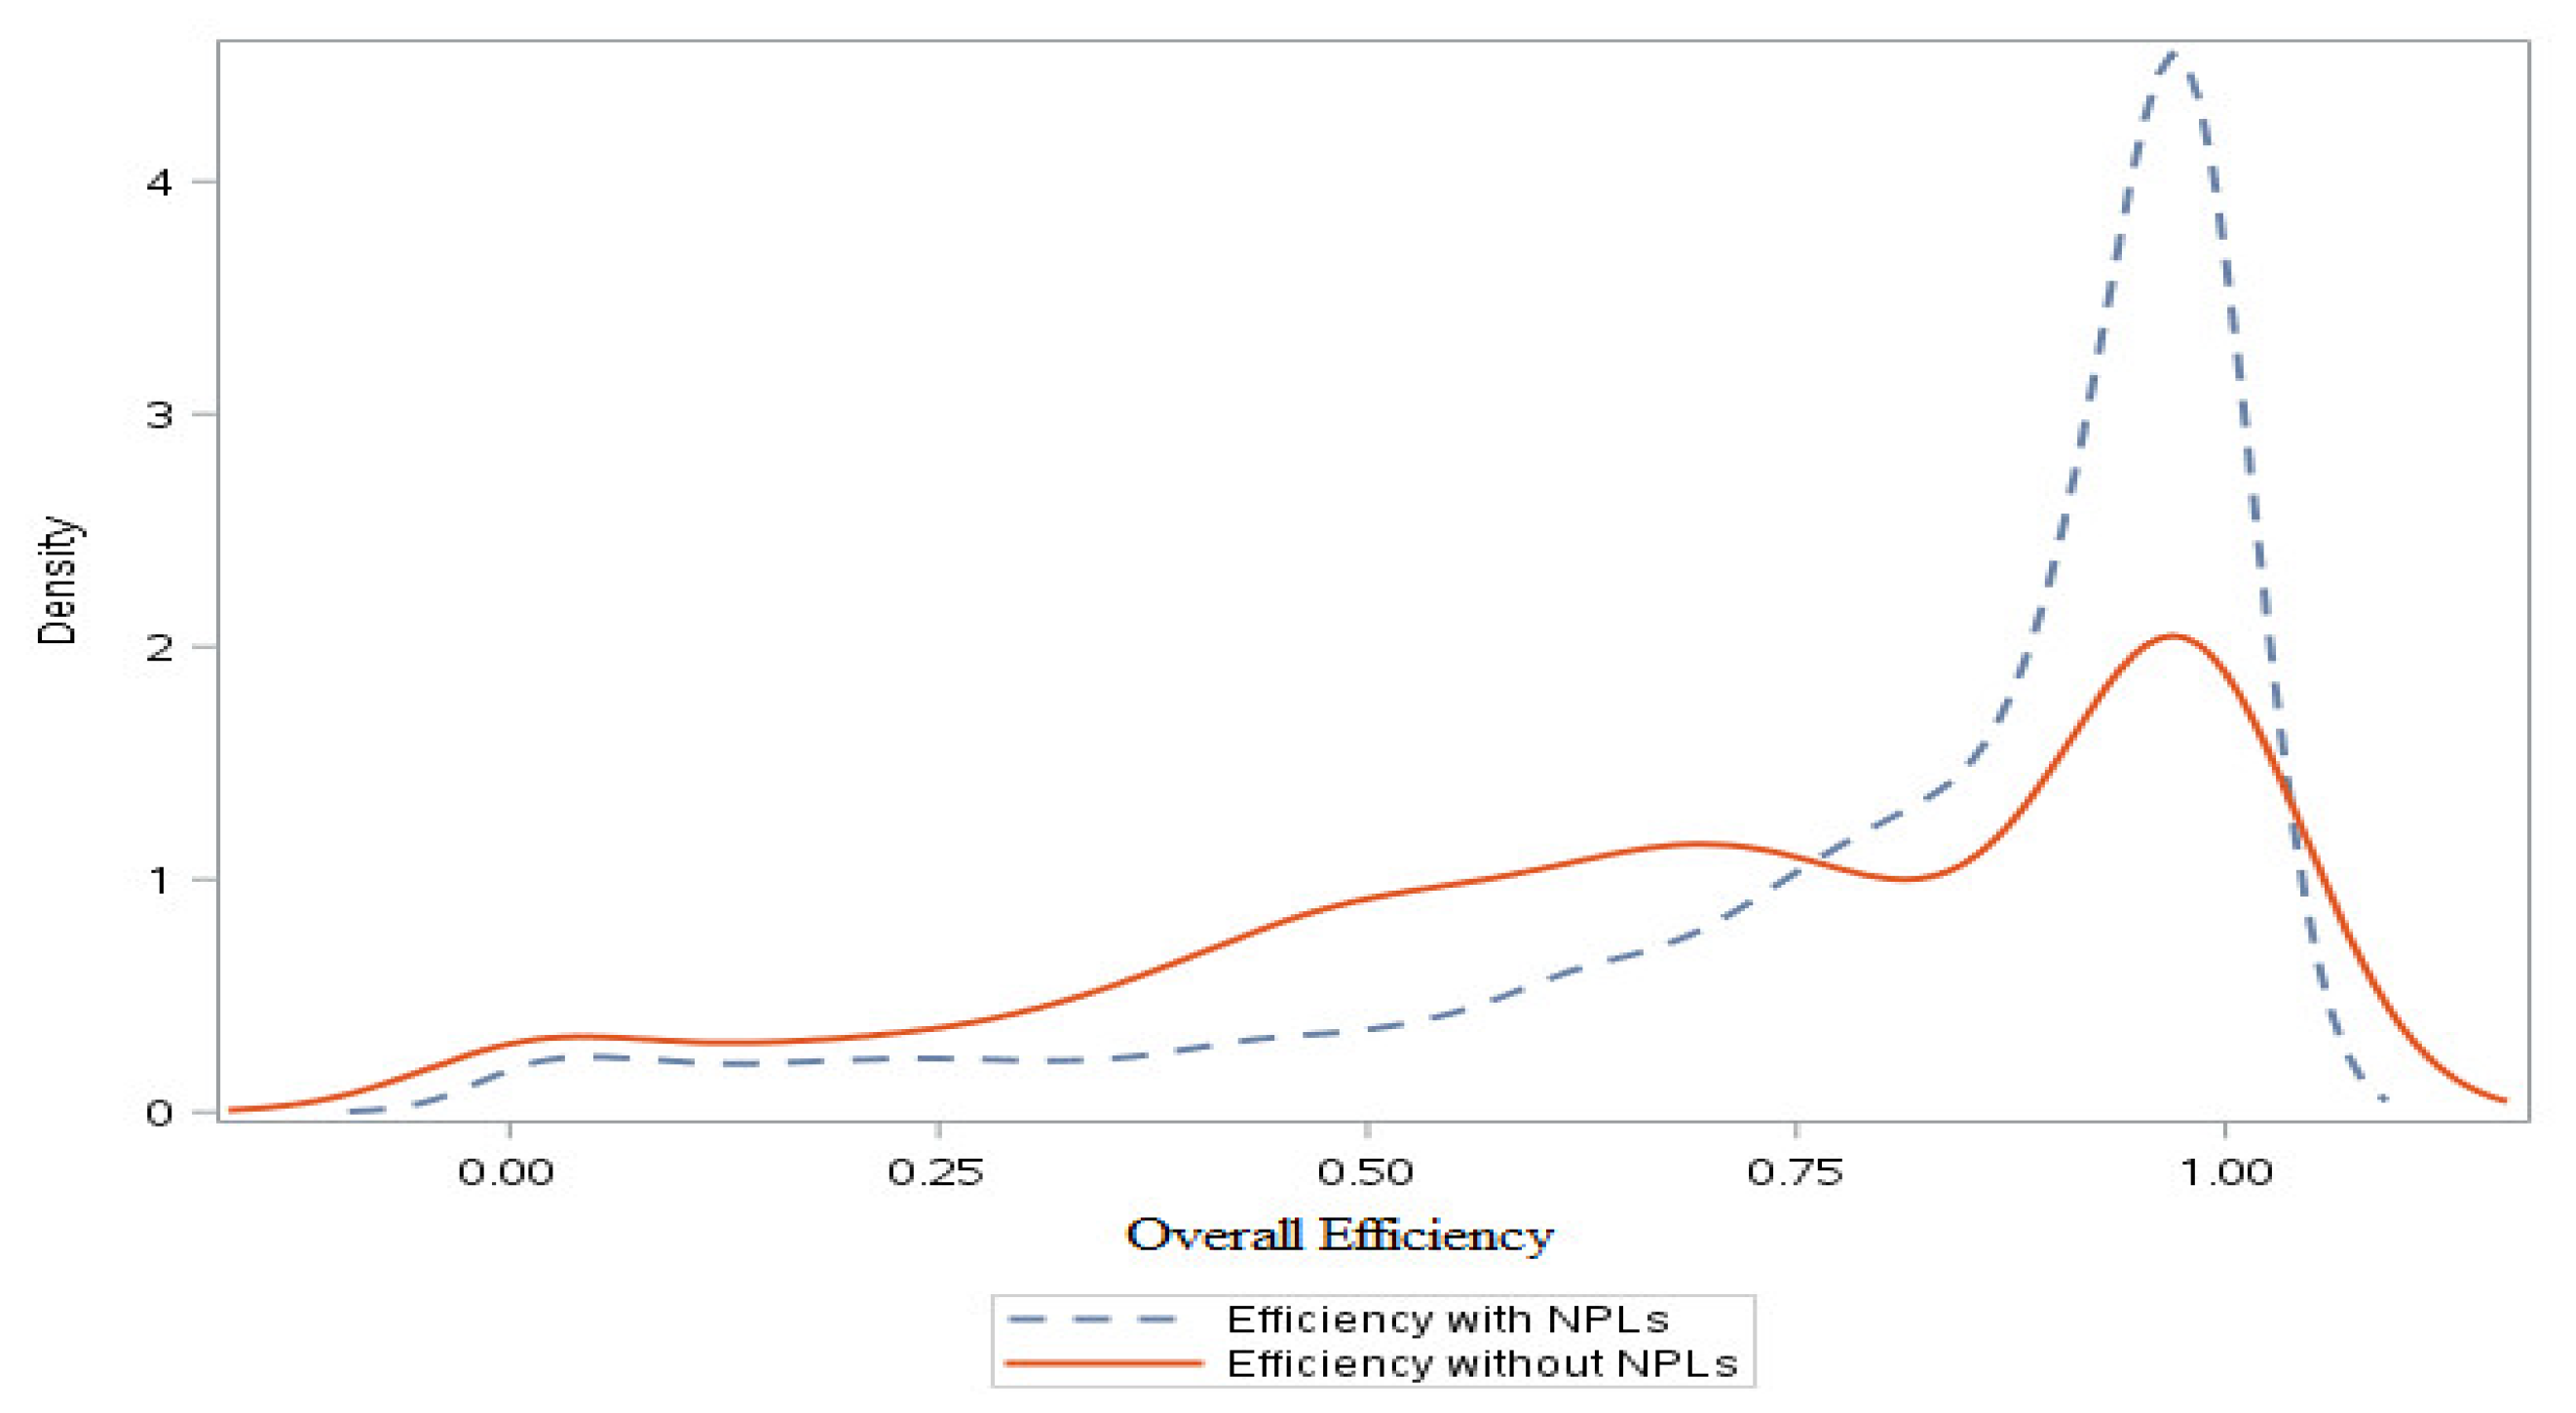
By contrast, the efficiency scores calculated from the model that did not take NPLs into account had greater dispersion, and more of the mass of the distribution was concentrated in the lower efficiency range, represented by the interval of 0.25–0.75, compared to the distribution obtained upon including NPLs in the model (see Figure 2).
The same non-parametric test was employed to measure the equality of distributions for pre-crisis and post-crisis efficiency scores (Figure 3), also finding a significant difference at the 1% level. The distribution of efficiency scores pre-crisis were more skewed to the left. In addition, the mass of the distribution was concentrated at higher efficiency levels. By contrast, the efficiency scores post-crisis were concentrated in the lower efficiency range, represented by the interval of 0.70–0.90. The overall average efficiency score pre-crisis was 0.85; however, it dropped to 0.74 post-crisis (see Table 5). This reconfirmed that the global financial crisis hit banking efficiency in emerging economies.
Table 3 presents the technical efficiency scores for stage I (deposit mobilization) and stage II (loan financing), and their regional and national breakdown. The overall bank efficiency was 0.80, which resulted from a much higher average efficiency (93%) in the deposit mobilization stage than in the loan financing stage (85%). The most inefficient banks were in Africa and the Middle East where the average efficiency score was only 0.55. This was followed by South Asia and Emerging Europe, where the average efficiency scores were 0.67 and 0.68, respectively. The average overall bank efficiency scores for some countries were very low, for example, in Egypt (0.37), United Arab Emirates (UAE; 0.55), and Pakistan (0.61).
Despite overall higher efficiency in the deposit mobilization stage, banks in some countries were very inefficient in mobilizing deposits. For example, the first-stage efficiency scores in Egypt, Czech Republic, and Greece were 0.60, 0.69, and 0.75, respectively. This suggested that there was huge potential for saving the productive input resources used by the banks, while achieving the same level of mobilization of deposits.
For the (second) loan financing stage—where the bank’s risk-taking behavior may be manifested in the accumulation of non-performing loans—the average efficiency score was 85%, which is much lower than the first-stage efficiency score. In this second stage, the efficiency scores of banks in Malaysia, Thailand, Pakistan, India, Egypt, UAE, and South Africa were quite low. Again, the Egyptian banks had the lowest average efficiency score with only 52%.
Next, we discuss the regional comparisons of the overall average efficiency along with the stage-wise average efficiency. The Latin American banks were found to be the leaders in emerging economies and registered an overall average efficiency of 0.93, which was the result of an average efficiency of 0.95 at the deposit mobilization stage, and 0.97 at the loan financing stage. This was followed by East Asian and Southeast Asian banks, which registered good average efficiency scores of 0.85 and 0.83, respectively.
An important question is how taking into account bad loans as an undesirable output impacts the efficiency measurements. Zago and Dongili (2011) argued that “recognizing banks’ efforts to reduce bad loans increases their efficiency”. Our results (Table 4) showed that the overall efficiency scores after allowing for non-performing loans were higher at 0.80, compared to only 0.69 when NPLs were excluded. This was also true for all regions where the non-performing loans were a higher proportion of the banks’ loan portfolios. However, for Latin America, where the proportion on NLPs was only about half the average proportion of NPLs across all regions, the average efficiency scores with and without the inclusion of non-performing loans were quite similar. This suggests that it is important to incorporate non-performing loans, in addition to the undesirable output DEA formulation, for measuring bank efficiency in countries and regions with higher proportions of bad loans exist in the banks’ loan portfolios.
Table 5 shows that the overall average efficiency score during the period of 1999–2007 before the global financial crisis was 0.85. However, it dropped to 0.74 during the post-crisis period (2008–2013). A closer look at the stage-wise efficiency scores suggests that efficiency declines in the post-crisis period were more pronounced for the loan financing stage and were largely concentrated in the countries of South Asia, Africa and the Middle East, and emerging Europe—regions where the proportion of NPLs was higher. This suggests that non-performing loans had a role in the efficiency declines during the post crisis period.
Non-Parametric Regression
The non-parametric regression estimated in the study explained efficiency scores with the help of various financial ratios and macroeconomic variables (see Table 6). A set of dummy variables representing the ownership status, financial crisis of 2007–2008, and regional banks is also included.
Note that the effects of individual independent variables were tested against the null hypothesis of no effect over the entire domain of the regression function (J. Racine 1997). The p-values corresponding to the derived test statistics also referred to responses across all domains. Also, note that the non-parametric regression allows the effects of individual independent variables to vary locally. Both these considerations have to be borne in the mind when interpreting the non-parametric regression results presented in Table 6 (and in Figure 4). Table 6 reports the band width and the p-values for individual independent variables.
The efficiency of banks may also depend on the regulatory regime, which could vary from country to country (Barth et al. 2008).3 There are some very detailed World Bank surveys that provide a rich set of indicators of the bank regulatory environments for a large number of countries. These surveys capture the various features of the regulatory regimes as they existed at specific points in time, i.e., 1999, 2002, and 2006 (ibid. p. 5). This study used a research design based on a panel of annual bank-level data from 24 emerging economies from 1999 to 2013. The integration of both datasets for use in model estimation, where the other bank characteristics were observed annually, is not a trivial matter.4 However, failing to control for the regulatory regime in some way may bias the results. We tried to control for the country-specific regulatory environment by introducing country fixed effects in Model I and Model II (see Table 6).
The Model I results suggest that bank size significantly affected efficiency with a p-value of 0.075, which was somewhat above the conventional threshold of 5%. The ownership status (public bank) was also highly significant. No other bank characteristic had a statistically significant effect. Among the two indicators of macroeconomic environment, inflation had a significant effect on bank efficiency and the GDP growth rate variable was insignificant. The impact of the 2007–2008 financial crisis on efficiency was highly significant.
While the financial crisis of 2007–2008 had global effects, individual countries also had financial crises whose effects were less contagious. Model II included country financial crisis dummies. For the country in question, these dummy variables took the value of 1 during the crisis period, and 0 otherwise. Model II was also estimated with country fixed effects. The results presented in Table 6 suggest that, in addition to size and ownership status, capital adequacy was a highly significant determinant of bank efficiency. None of the macroeconomic variables had statistical significance, and the dummy variable for the 2007–2008 financial crisis had a p-value of 0.08, making it significant at the 10% level. Among the country financial dummies, only the dummy variables for Egypt and Thailand were statistically significant, with the latter only marginally so. The model R2 value was only 0.48 compared to the R2 of 0.80 for Model I.
In contrast to Models I and II, Model III did not specify country fixed effects, and instead included dummy variables for regions to capture the regional heterogeneity of efficiency scores. All regional dummies were statistically highly significant. The model R2 was 0.78, which was comparable to that of Model I. The bank characteristics that had statistically significant effect on efficiency were found to be capital adequacy and ownership status, with p-values of 0.06 and <0.0001, respectively. Both variables reflecting macroeconomic conditions were statistically highly significant. The dummy variable representing the impact on bank efficiency of the global financial crisis was also highly significant.
We present the partial regression plots for Model I in Figure 4. The plots for Models II and III can be found in the Appendix. The graphs from all plots show a high degree of similarity.
Increases in the capital adequacy ratio raised technical efficiency across the entire domain (top right panel of Figure 4). However, the imprecision of this effect increased, especially for capital adequacy ratios higher than 0.3. Several other studies found a positive relationship between capital adequacy and bank efficiency, for example, see (Gropp and Heider 2010; Kleff and Weber 2008).
Figure 4 also provides a graphical representation of the relationship between bank technical efficiency and the macroeconomic environment in which the banks operated. These graphs reveal interesting empirical regularities in different segments of the domain of the relationship. The banks operating in stagnant or contracting economies had poor efficiency scores (top panel), which were also highly volatile in that part of the domain.5 As GDP growth entered positive territory, the bank efficiency score also increased. This pattern was observed to be positive at growth rates of up to about 5%. Vu and Nahm (2013) pointed out that high growth led to more savings and, hence, more deposits with the banks at a relatively low cost. For growth rates exceeding 5%, however, the technical efficiency scores became considerably more volatile and showed a somewhat declining trend.
Higher bank efficiency scores were found at low to moderate rates of inflation. Vu and Nahm (2013) also found that low inflation was associated with high levels of bank efficiency. As inflation exceeded 6%, the relationship became somewhat more volatile and declining efficiency scores were observed.6 With inflation rates in excess of 10%, efficiency scores showed great variation and declined sharply. This finding is consistent with that of Batir et al. (2017) who pointed out that high inflation caused the efficiency of banks to decline.
The ownership status of banks indicates that public banks performed significantly poor at the 1% level of significance as compared to private banks. Several other studies pointed out the poor performance of public banks; for example, private banks were more efficient than public banks in Czech Republic and Poland (Weill 2003); public banks were less efficient compared to private banks in 15 East European transition countries (Fries and Taci 2005); joint-stock banks which were not owned by the government were found to be more efficient than state-owned banks in China (Xiaoqing Maggie and Heffernan 2007).
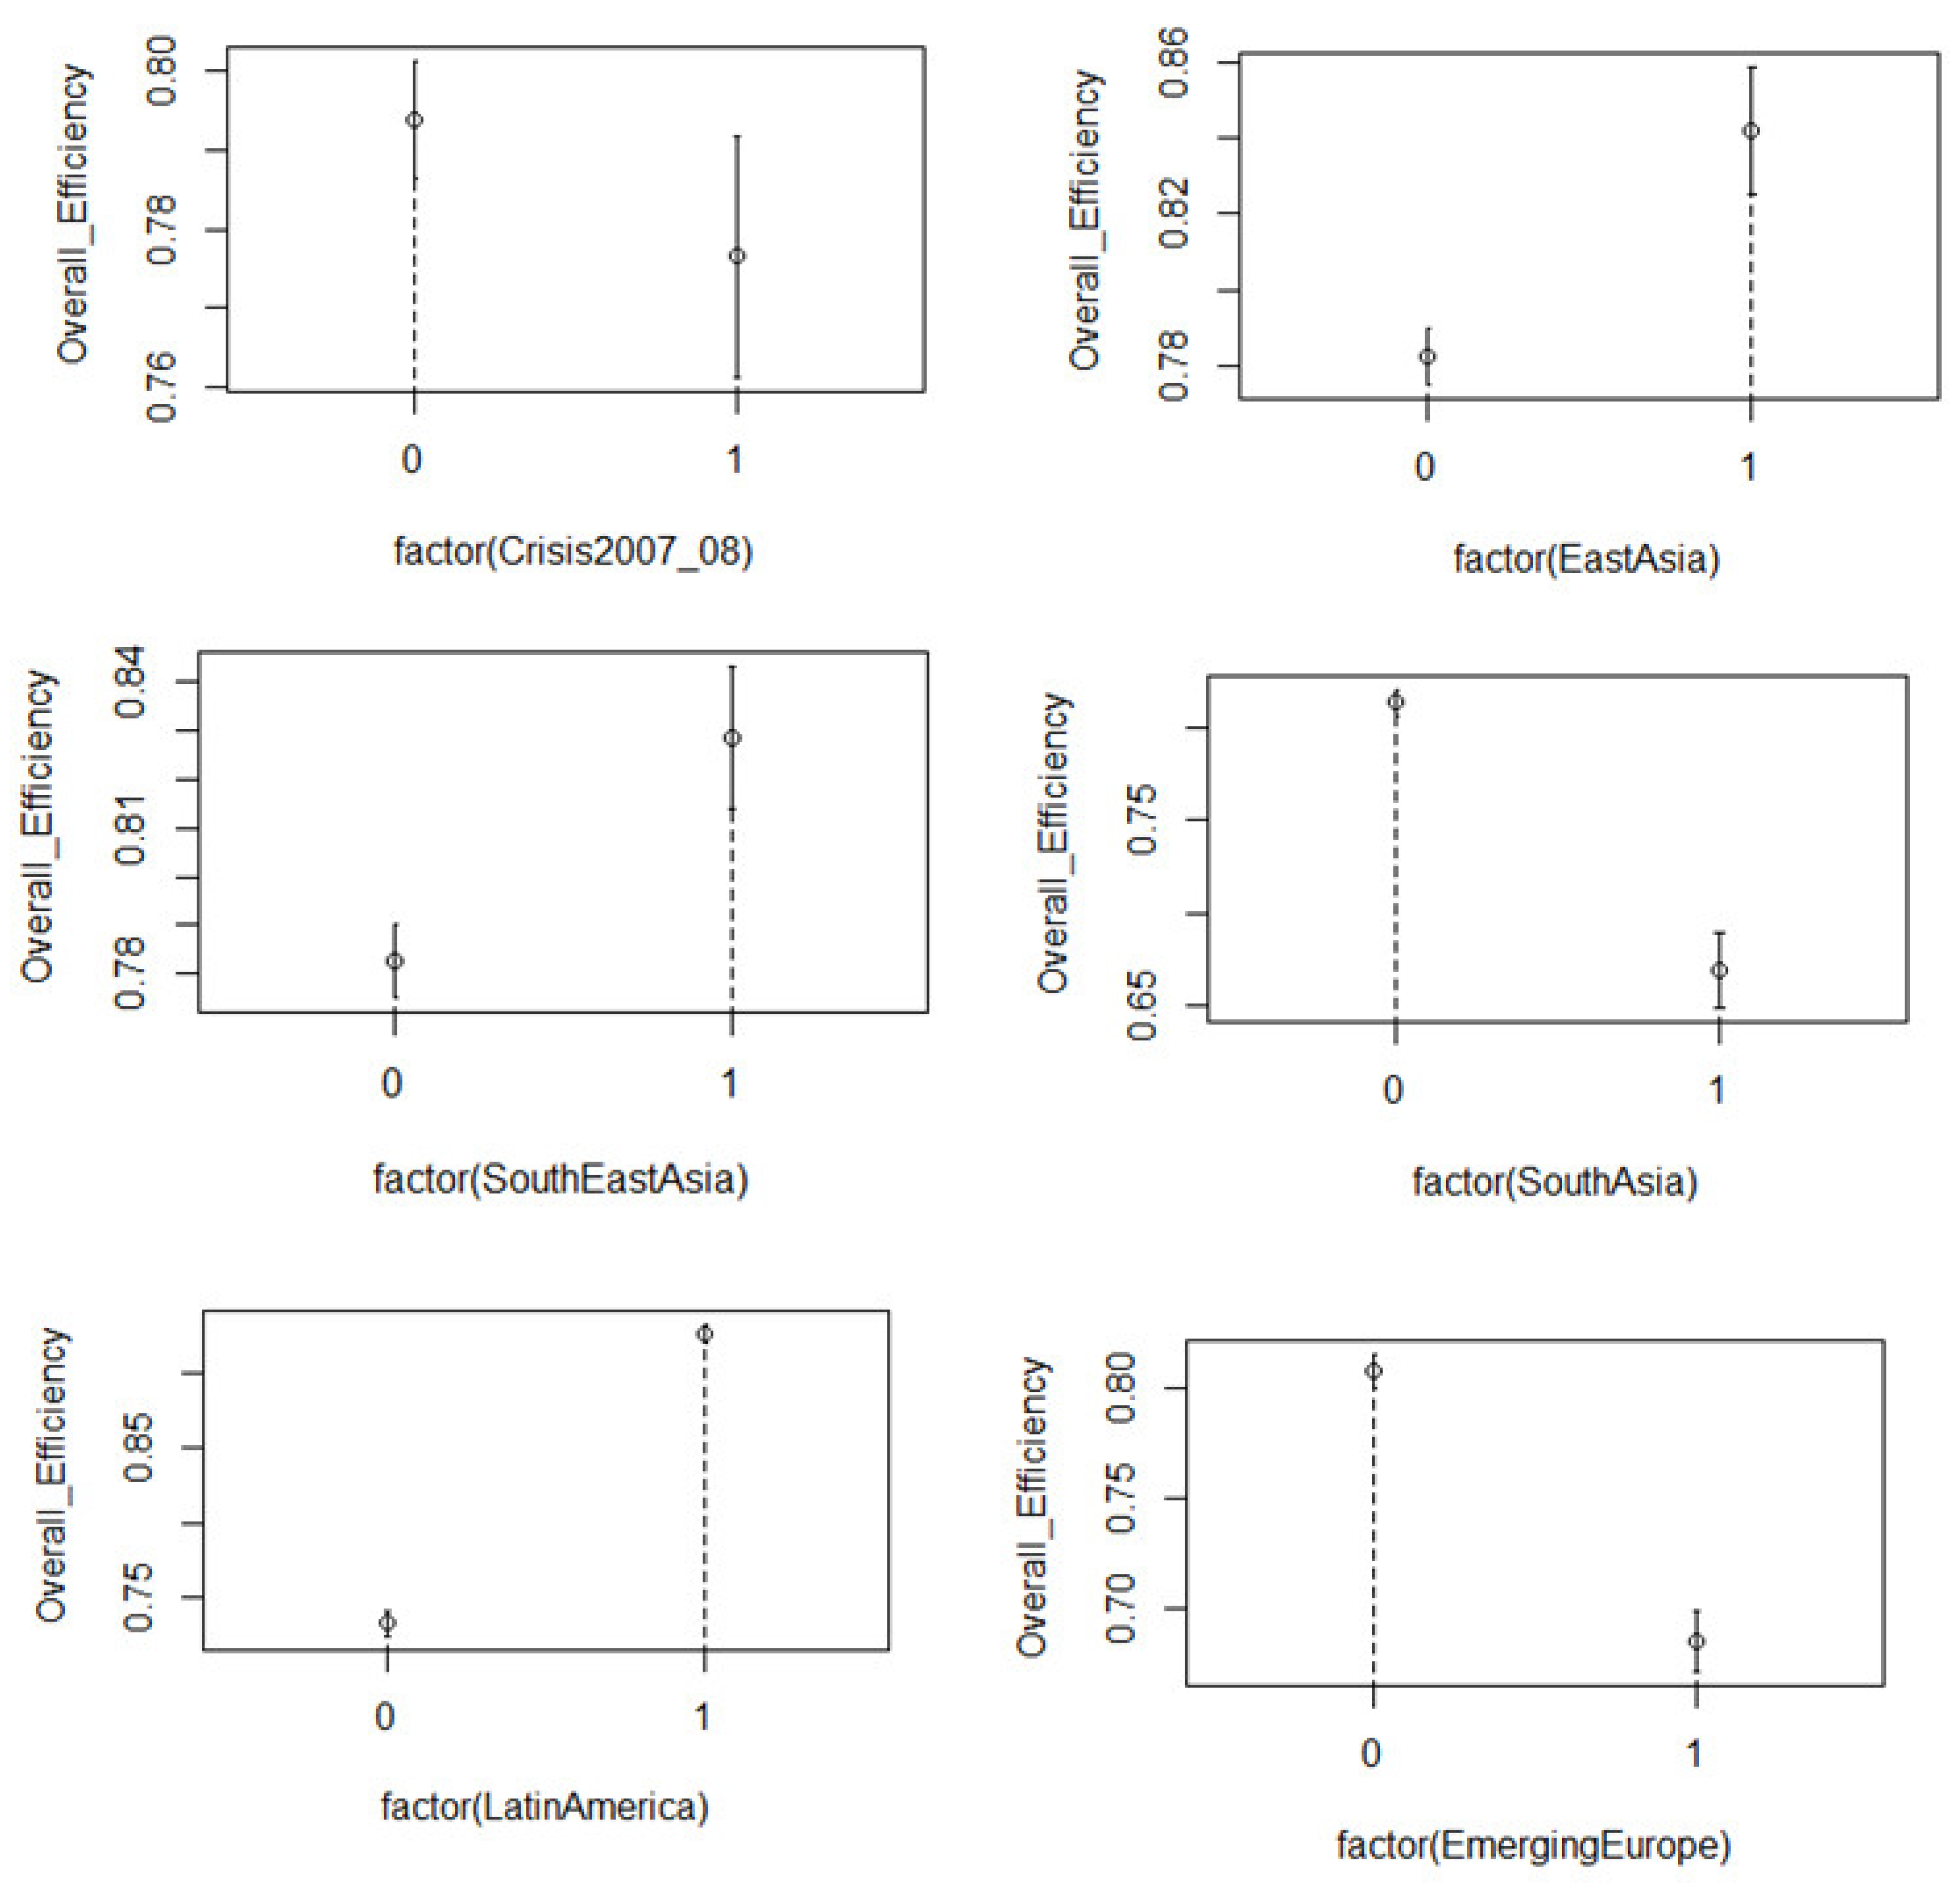
The results of Model III suggested that the financial crisis of 2007–2008 caused efficiency scores to decline in emerging economies. The regional banks in East Asia, Southeast Asia, and Latin America performed significantly better with p-values < 0.01. The banks in these regions had a lower proportion of non-performing loans in their portfolios. In contrast, banks in the regions of South Asia and Emerging Europe performed significantly poorly with p-values < 0.01.7 The banks in these regions had a high proportion of non-performing loans (see Table 4). This suggests that the negative impact of the crisis on bank efficiency was associated with the accumulation of non-performing loans.
6. Concluding Remarks
The present study modeled banking operations as consisting of two stylized stages—the deposit mobilization stage, and the loan financing stage—and separately estimated technical efficiency at each stage. An important feature of the study was the use of a cross-country panel dataset for efficiency measurement. To the best of our knowledge, no other study estimated technical efficiency for a panel or emerging economy banks using network DEA and directional distance functions featuring NPLs. This research design made it possible to perform regional comparisons of bank efficiency and also to investigate the impact of global macroeconomic shocks. Our results indicated that lower efficiency scores were concentrated in regions where the proportions of non-performing loans in banks’ loan portfolios were higher.
The results obtained allowed not only profiling the efficient banks, but also a meaningful characterization of the macroeconomic environment conducive for achieving higher levels of bank efficiency. The efficient banks were smaller, better capitalized, and privately owned. The macroeconomic conditions conducive for bank efficiency were a growing economy, and low to moderate inflation rates (below ~5%). The financial crisis of 2007–2008 negatively impacted the technical efficiency of banks. The analysis of regional patterns of efficiency scores suggested that the most vulnerable banks were located in regions (South Asia and emerging Europe) where the proportion of non-performing loans was high.
Policy Implications
The study provides several policy implications. Our results indicated that banks need to be sufficiently capitalized. This may require regulations setting capital adequacy requirements that the bank could achieve by attracting capital from shareholders and investors, or acquired through mergers and acquisitions. Our results also support regulatory authorities forcing the less capitalized banks to merge.8
A high proportion of non-performing loans increases the risk of bank failures, macroeconomic crisis, and contagion, depending on whether the accumulation of non-performing loans took place at a single bank, within the banking system, or in countries across the region, respectively.
Finally, good macroeconomic management provides an environment in which banks can perform efficiently. Our results indicated that two dimensions of this environment were economic growth and low inflation.
Author Contributions
The research problem was identified by A.Q.; the analytical solution was pointed out by K.R.; The algorithmic implementation was performed by A.Q.; Both authors contributed to the specification of models and the interpretation of results; the paper was written by A.Q. with input from K.R. who also supervised the research.
Funding
This research received no external funding.
Acknowledgments
We are grateful to two anonymous referees for their helpful suggestion. We are responsible for any remaining errors.
Conflicts of Interest
The authors declare no conflict of interest.
Appendix
Figure A1.
The relationship between technical efficiency, bank characteristics (size, capital adequacy, liquidity and public bank dummy), and macroeconomic indicators (GDP growth rate and inflation rate) (Model II).
Figure A1.
The relationship between technical efficiency, bank characteristics (size, capital adequacy, liquidity and public bank dummy), and macroeconomic indicators (GDP growth rate and inflation rate) (Model II).

Figure A2.
The relationship between technical efficiency and the financial crisis of 2007–2008, along with country crisis dummy variables (Indonesia crisis 1999 dummy, Malaysia crisis 1999 dummy, Philippines crisis 1999–2001 dummy, Thailand crisis 1999–2000 dummy, Brazil crisis 1999 dummy and Argentina crisis 1999–2002 dummy) (Model II).

Figure A3.
The relationship between technical efficiency and country crisis dummy variables (Colombia crisis 1999 dummy, Turkey crisis 2001 dummy, Egypt crisis 2011–2013 dummy, Morocco crisis 2009 dummy, Czech Republic crisis 2009–2011 dummy and Greece crisis 2009–2013 dummy) (Model II).
Figure A3.
The relationship between technical efficiency and country crisis dummy variables (Colombia crisis 1999 dummy, Turkey crisis 2001 dummy, Egypt crisis 2011–2013 dummy, Morocco crisis 2009 dummy, Czech Republic crisis 2009–2011 dummy and Greece crisis 2009–2013 dummy) (Model II).

Figure A4.
The relationship between technical efficiency, bank characteristics (size, capital adequacy, liquidity and public bank dummy) and macroeconomic indicators (GDP growth rate and inflation rate) (Model III).
Figure A4.
The relationship between technical efficiency, bank characteristics (size, capital adequacy, liquidity and public bank dummy) and macroeconomic indicators (GDP growth rate and inflation rate) (Model III).

Figure A5.
The relationship between technical efficiency and the financial crisis of 2007–2008, along with regional dummy variables (East Asia dummy, Southeast Asia dummy, South Asia dummy, Latin America dummy and emerging Europe dummy) (Model III).
Figure A5.
The relationship between technical efficiency and the financial crisis of 2007–2008, along with regional dummy variables (East Asia dummy, Southeast Asia dummy, South Asia dummy, Latin America dummy and emerging Europe dummy) (Model III).

References
- Acharya, Viral, and Hassan Naqvi. 2012. The seeds of a crisis: A theory of bank liquidity and risk taking over the business cycle. Journal of Financial Economics 106: 349–66. [Google Scholar] [CrossRef]
- Akther, Syed, Hirofumi Fukuyama, and William L. Weber. 2013. Estimating two-stage network slacks-based inefficiency: An application to Bangladesh banking. Omega 41: 88–96. [Google Scholar] [CrossRef]
- Ashraf, Badar Nadeem, Sidra Arshad, and Liang Yan. 2017. Trade openness and bank risk-taking behavior: Evidence from emerging economies. Journal of Risk and Financial Management 10: 15. [Google Scholar] [CrossRef]
- Baily, Martin Neil, and Douglas J. Elliott. 2009. The US Financial and Economic Crisis: Where Does It Stand and Where Do We Go from Here. Brookings Institution, Jun. Available online: https://www.brookings.edu/wp-content/.../0615_economic_crisis_baily_elliott.pdf (accessed on 20 July 2018).
- Banker, Rajiv D., Abraham Charnes, and William Wager Cooper. 1984. Some models for estimating technical and scale inefficiencies in data envelopment analysis. Management Science 30: 1078–92. [Google Scholar] [CrossRef]
- Banker, Rajiv D., Zhiqiang Eric Zheng, and Ram Natarajan. 2010. DEA-based hypothesis tests for comparing two groups of decision making units. European Journal of Operational Research 206: 231–38. [Google Scholar] [CrossRef]
- Barros, Carlos Pestana, Shunsuke Managi, and Roman Matousek. 2012. The technical efficiency of the Japanese banks: non-radial directional performance measurement with undesirable output. Omega 40: 1–8. [Google Scholar] [CrossRef]
- Barth, James R., Gerard Caprio Jr., and Ross Levine. 2008. Bank Regulations Are Changing: For Better or Worse? The World Bank. Available online: https://openknowledge.worldbank.org/handle/10986/6664 (accessed on 8 September 2018).
- Barth, James R., Gerard Caprio Jr., and Ross Levine. 2013. Bank Regulation and Supervision in 180 Countries from 1999 to 2011. Journal of Financial Economic Policy 5: 111–219. [Google Scholar] [CrossRef]
- Batir, Tugba Eyceyurt, David A. Volkman, and Bener Gungor. 2017. Determinants of bank efficiency in Turkey: Participation banks versus conventional banks. Borsa Istanbul Review 17: 86–96. [Google Scholar] [CrossRef]
- Bholat, David M., Rosa M. Lastra, Sheri M. Markose, Andrea Miglionico, and Kallol Sen. 2016. Non-Performing Loans: Regulatory and Accounting Treatments of Assets. Available online: https://papers.ssrn.com/abstract=2768865 (accessed on 15 July 2018).
- Charnes, Abraham, William W. Cooper, and Edwardo Rhodes. 1978. Measuring the efficiency of decision making units. European Journal of Operational Research 2: 429–44. [Google Scholar] [CrossRef]
- Charnes, A., W. W. Cooper, B. Golany, B. Kirby, J. McGahan, and D. Semple. 1988. Measuring the Impact of National Advertising on Recruiting by Data Envelopment Analysis Methods (No. CCS-595). Texas Univ at Austin Center for Cybernetic Studies. Available online: www.dtic.mil/dtic/tr/fulltext/u2/a191591.pdf (accessed on 7 November 2018).
- Chung, Yangho H., Rolf Färe, and Shawna Grosskopf. 1997. Productivity and undesirable outputs: A directional distance function approach. Journal of Environmental Management 51: 229–40. [Google Scholar] [CrossRef]
- Drigă, Imola, and Codruţa Dura. 2014. The Financial Sector and the Role of Banks in Economic Development. Paper presented at the 6th International Multidisciplinary Symposium “Universitaria SIMPRO”, University of Petrosani, Petroșani, Romania, October 10–11. [Google Scholar]
- Emrouznejad, Ali, and Guo-liang Yang. 2017. A survey and analysis of the first 40 years of scholarly literature in DEA: 1978–2016. Socio-Economic Planning Sciences 61: 4–8. [Google Scholar] [CrossRef]
- Färe, Rolf, and Shawna Grosskopf. 2000. Network dea. Socio-Economic Planning Sciences 34: 35–49. [Google Scholar] [CrossRef]
- Färe, Rolf, Shawna Grosskopf, C. A. Knox Lovell, and Carl Pasurka. 1989. Multilateral productivity comparisons when some outputs are undesirable: a nonparametric approach. The Review of Economics and Statistics 71: 90–98. [Google Scholar] [CrossRef]
- Fries, Steven, and Anita Taci. 2005. Cost efficiency of banks in transition: Evidence from 289 banks in 15 post-communist countries. Journal of Banking & Finance 29: 55–81. [Google Scholar]
- Fukuyama, Hirofumi, and William L. Weber. 2008. Japanese banking inefficiency and shadow pricing. Mathematical and Computer Modelling 48: 1854–67. [Google Scholar] [CrossRef]
- Fukuyama, Hirofumi, and William L. Weber. 2010. A slacks-based inefficiency measure for a two-stage system with bad outputs. Omega 38: 398–409. [Google Scholar] [CrossRef]
- Gropp, Reint, and Florian Heider. 2010. The determinants of bank capital structure. Review of Finance 14: 587–622. [Google Scholar] [CrossRef]
- Hamid, Nurhayati, Noor Asiah Ramli, and Siti Aida Sheikh Hussin. 2017. Efficiency measurement of the banking sector in the presence of non-performing loan. In AIP Conference Proceedings. Melville: AIP Publishing, vol. 1795, no. 1. p. 020001. [Google Scholar]
- Hayfield, Tristen, and Jeffrey S. Racine. 2008. Nonparametric econometrics: The np package. Journal of Statistical Software 27: 1–32. [Google Scholar] [CrossRef]
- Huang, Jianhuan, Juanjuan Chen, and Zhujia Yin. 2014. A network DEA model with super efficiency and undesirable outputs: An application to bank efficiency in China. Mathematical Problems in Engineering 2014: 14. [Google Scholar] [CrossRef]
- Illueca, Manuel, José M. Pastor, and Emili Tortosa-Ausina. 2009. The effects of geographic expansion on the productivity of Spanish savings banks. Journal of Productivity Analysis 32: 119–43. [Google Scholar] [CrossRef]
- Johnes, Jill, Marwan Izzeldin, and Vasileios Pappas. 2014. A comparison of performance of Islamic and conventional banks 2004–2009. Journal of Economic Behavior & Organization 103: 93–107. [Google Scholar]
- Kleff, Volker, and Martin Weber. 2008. How do banks determine capital? Evidence from Germany. German Economic Review 9: 354–72. [Google Scholar] [CrossRef]
- Kumar, Sunil, and Rachita Gulati. 2014. A Survey of Empirical Literature on Bank Efficiency Deregulation and Efficiency of Indian Banks. New Delhi: Springer, pp. 119–65. [Google Scholar]
- Liu, John S., Louis Y. Y. Lu, Wen-Min Lu, and Bruce J. Y. Lin. 2013. A survey of DEA applications. Omega 41: 893–902. [Google Scholar] [CrossRef]
- McDonald, John. 2009. Using least squares and tobit in second stage DEA efficiency analyses. European Journal of Operational Research 197: 792–98. [Google Scholar] [CrossRef]
- Moyo, Jennifer, Boaz Nandwa, Dubai Economic Council, Jacob Oduor, and Anthony Simpasa. 2014. Financial Sector Reforms, Competition and Banking System Stability in Sub-Saharan Africa. Available online: https://www.imf.org/external/np/seminars/eng/2014/lic/pdf/Moyo.pdf (accessed on 3 August 2018).
- Office of the Comptroller of the Currency, United States. 1988. Bank failure: An Evaluation of the Factors Contributing to the Failure of National Banks: Office of the Comptroller of the Currency. Available online: https://www.occ.treas.gov/publications/publications-by-type/other-publications-reports/pub-other-bank-failure.pdf (accessed on 5 August 2018).
- Racine, Jeff. 1997. Consistent significance testing for nonparametric regression. Journal of Business & Economic Statistics 15: 369–78. [Google Scholar]
- Racine, Jeffrey S. 2008. Nonparametric econometrics: A primer. Foundations and Trends® in Econometrics 3: 1–88. [Google Scholar] [CrossRef]
- Racine, Jeffery S., Jeffrey Hart, and Qi Li. 2006. Testing the significance of categorical predictor variables in nonparametric regression models. Econometric Reviews 25: 523–44. [Google Scholar] [CrossRef]
- Rosenblatt, Murray. 1956. Remarks on some nonparametric estimates of a density function. The Annals of Mathematical Statistics 1: 832–37. [Google Scholar] [CrossRef]
- Saini, Priyanka, and Jyoti Sindhu. 2014. Role of Commercial Bank in the Economic Development of India. International Journal of Engineering and Management Research 4: 27–31. [Google Scholar]
- Seiford, Lawrence M., and Joe Zhu. 1999. Profitability and marketability of the top 55 US commercial banks. Management science 45: 1270–88. [Google Scholar] [CrossRef]
- Titko, Jelena, Jelena Stankevičienė, and Nataļja Lāce. 2014. Measuring bank efficiency: DEA application. Technological and Economic Development of Economy 20: 739–57. [Google Scholar] [CrossRef]
- Tobin, James. 1985. Estimation of relationships for limited dependent variables. Econometrica: Journal of the Econometric Society, 24–36. [Google Scholar] [CrossRef]
- Tone, Kaoru, and Miki Tsutsui. 2009. Network DEA: A slacks-based measure approach. European Journal of Operational Research 197: 243–52. [Google Scholar] [CrossRef]
- Vu, Ha, and Daehoon Nahm. 2013. The determinants of profit efficiency of banks in Vietnam. Journal of the Asia Pacific Economy 18: 615–31. [Google Scholar] [CrossRef]
- Wang, Ke, Wei Huang, Jie Wu, and Ying-Nan Liu. 2014. Efficiency measures of the Chinese commercial banking system using an additive two-stage DEA. Omega 44: 5–20. [Google Scholar] [CrossRef]
- Wanke, Peter, and Carlos Barros. 2014. Two-stage DEA: An application to major Brazilian banks. Expert Systems with Applications 41: 2337–44. [Google Scholar] [CrossRef]
- Weill, Laurent. 2003. Banking efficiency in transition economies: The role of foreign ownership. Economics of Transition 11: 569–92. [Google Scholar] [CrossRef]
- Xiaoqing Maggie, F. U., and Shelagh Heffernan. 2007. Cost X-efficiency in China’s banking sector. China Economic Review 18: 35–53. [Google Scholar]
- Yang, Chyan, and Hsian-Ming Liu. 2012. Managerial efficiency in Taiwan bank branches: A network DEA. Economic Modelling 29: 450–61. [Google Scholar] [CrossRef]
- Zago, Angelo, and Paola Dongili. 2011. Credit quality and technical efficiency in banking. Empirical Economics 40: 537–38. [Google Scholar] [CrossRef]
- Zhu, Ning, Bing Wang, and Yanrui Wu. 2015. Productivity, efficiency, and non-performing loans in the Chinese banking industry. The Social Science Journal 52: 468–80. [Google Scholar] [CrossRef]
| 1 | Most previous studies used either the production or the intermediation approach to model bank efficiency. |
| 2 | It may be argued that, instead of the non-performing loans (NPLs), the loan loss provisions are an alternative representation of the undesirable output in the model. Note, however, that the loan loss provisions are also calculated on the basis of non-performing loans (Bholat et al. 2016). The previous studies employed non-performing loans as an undesirable output in measuring efficiency through directional distance functions. See, for example, (Akther et al. 2013; Barros et al. 2012; Zhu et al. 2015). We followed the same convention and used NPLs to represent undesirable outputs in this study. |
| 3 | We would like to thank an anonymous referee for this point. |
| 4 | The surveys contain a wealth of information that, when suitably combined with other sources of bank-level data, could offer rich possibilities for further research. We hope to explore some of these possibilities in our own future research. Models I and II that incorporated country fixed effects in an attempt to capture the individual country regulatory environment, while not fully capturing the dynamics of the regulatory regimes, were motivated by Barth et al. (2008). |
| 5 | In our sample, the economies of countries such as Greece, Hungary, Czech Republic, Turkey, and UAE experienced negative growth rates and poor bank efficiency during various sub-periods. |
| 6 | In our sample, the economies of countries such as Turkey, Argentina, Indonesia, Malaysia, and Pakistan experienced high inflation at various sub-periods and highly volatile technical efficiency scores for banks. |
| 7 | The negative impact on efficiency of banks was due to generating higher NPLs and administrative expenses faced by banks as a result of crises in the regions of South Asia and emerging Europe. |
| 8 | For example, if a small bank is merged with a large bank, then it is an empirical question whether or not the effect of the larger size on efficiency would outweigh the effect of improved capital adequacy. This study helps answer such empirical questions. |
Figure 1.
Distributions of measured efficiency scores.

Figure 2.
Comparative distribution analysis of efficiency scores with and without non-performing loans (NPLs).
Figure 2.
Comparative distribution analysis of efficiency scores with and without non-performing loans (NPLs).

Figure 3.
Comparative distribution analysis of efficiency scores pre-crisis and post-crisis.

Figure 4.
The relationship between technical efficiency, bank characteristics (size, capital adequacy, liquidity and public bank dummy), macroeconomic indicators (GDP growth rate and inflation rate), and the financial crisis of 2007–2008.
Figure 4.
The relationship between technical efficiency, bank characteristics (size, capital adequacy, liquidity and public bank dummy), macroeconomic indicators (GDP growth rate and inflation rate), and the financial crisis of 2007–2008.


Table 1.
Stage-wise inputs and outputs of banking operations. DEA—data envelopment analysis.
| Process | Variables | Method | |
|---|---|---|---|
| Inputs | Outputs | ||
| Deposit mobilization stage | • Personnel expenses | • Total deposits | Directional distance function based on network DEA |
| • Other administrative expenses | |||
| • User cost of fixed assets | |||
| Loan financing stage | • Total deposits | ||
| • Personnel expenses | • Total loans • Other earning assets • Non-performing loans2 | ||
| • Other administrative expenses | |||
| • User cost of fixed assets | |||
Table 2.
Descriptive information of efficiency scores *.
| Variable | Skewness | Kurtosis | Mean | Std. Deviation |
|---|---|---|---|---|
| Efficiency of deposit mobilization (Stage I) | −3.11 | 12.51 | 0.93 | 0.1293 |
| Efficiency of loan financings (Stage II) | −1.98 | 3.21 | 0.85 | 0.2311 |
| Overall efficiency | −1.60 | 1.79 | 0.80 | 0.2463 |
Note: * The model was estimated including non-performing loans (NPLs) as an undesirable output.
Table 3.
Regional and national bank efficiency patterns. UAE—United Arab Emirates.
| Region | Country Name | Number of Banks | Number of Observations | Stage I | Stage II | Overall Average Efficiency Scores | |
|---|---|---|---|---|---|---|---|
| Southeast Asia | Indonesia | 80 | 562 | 1.00 | 0.86 | 0.86 | 0.83 |
| Malaysia | 46 | 137 | 0.99 | 0.64 | 0.64 | ||
| Philippines | 32 | 191 | 1.00 | 0.94 | 0.94 | ||
| Thailand | 6 | 54 | 1.00 | 0.69 | 0.68 | ||
| South Asia | India | 69 | 587 | 0.93 | 0.72 | 0.69 | 0.67 |
| Pakistan | 26 | 219 | 0.91 | 0.65 | 0.61 | ||
| Latin America | Argentina | 57 | 506 | 0.96 | 0.98 | 0.95 | 0.93 |
| Brazil | 96 | 640 | 0.96 | 0.97 | 0.93 | ||
| Chile | 30 | 134 | 0.91 | 0.96 | 0.89 | ||
| Colombia | 14 | 93 | 0.95 | 1.00 | 0.95 | ||
| Mexico | 32 | 225 | 0.93 | 0.97 | 0.90 | ||
| Peru | 15 | 124 | 0.91 | 0.99 | 0.90 | ||
| Emerging Europe | Czech Republic | 25 | 148 | 0.69 | 0.73 | 0.54 | 0.68 |
| Greece | 16 | 99 | 0.75 | 0.91 | 0.69 | ||
| Hungary | 13 | 94 | 0.80 | 0.93 | 0.74 | ||
| Poland | 33 | 173 | 0.83 | 0.86 | 0.72 | ||
| Turkey | 39 | 276 | 0.86 | 0.83 | 0.71 | ||
| East Asia | China | 151 | 744 | 0.98 | 0.85 | 0.84 | 0.85 |
| South Korea | 15 | 61 | 1.00 | 0.91 | 0.91 | ||
| Taiwan | 47 | 164 | 0.97 | 0.94 | 0.91 | ||
| Africa and the Middle East | Egypt | 22 | 91 | 0.60 | 0.52 | 0.37 | 0.55 |
| Morocco | 12 | 57 | 0.91 | 0.79 | 0.72 | ||
| South Africa | 18 | 91 | 0.85 | 0.70 | 0.65 | ||
| UAE | 24 | 215 | 0.87 | 0.60 | 0.55 | ||
| Average | 918 | 5685 | 0.93 | 0.85 | 0.80 | 0.80 | |
Table 4.
Average overall efficiency scores with and without non-performing loans (NPLs).
| Region | Share of NPLs | Efficiency Scores | |
|---|---|---|---|
| With NPLs | Without NPLs | ||
| Southeast Asia | 9.76 | 0.83 | 0.61 |
| South Asia | 7.29 | 0.67 | 0.51 |
| Latin America | 3.97 | 0.93 | 0.94 |
| Emerging Europe | 10.74 | 0.68 | 0.54 |
| East Asia | 4.11 | 0.85 | 0.71 |
| Africa and the Middle East | 8.98 | 0.55 | 0.41 |
| Average | 7.48 | 0.80 | 0.69 |
Table 5.
Average efficiency and NPLs pre- and post-crisis by region.
| Classification | Southeast Asia | South Asia | Latin America | Emerging Europe | East Asia | Africa and the Middle East | Overall Efficiency of Banks |
|---|---|---|---|---|---|---|---|
| Efficiency pre-crisis | |||||||
| Deposit mobilization stage | 1.00 | 0.94 | 0.96 | 0.83 | 0.98 | 0.83 | 0.85 |
| Loan financing stage | 0.87 | 0.76 | 0.97 | 0.82 | 0.94 | 0.59 | |
| Overall | 0.87 | 0.73 | 0.94 | 0.68 | 0.93 | 0.53 | |
| Efficiency post-crisis | |||||||
| Deposit mobilization stage | 1.00 | 0.91 | 0.92 | 0.78 | 0.98 | 0.81 | 0.74 |
| Loan financing stage | 0.78 | 0.63 | 0.98 | 0.86 | 0.83 | 0.65 | |
| Overall | 0.78 | 0.60 | 0.90 | 0.68 | 0.81 | 0.56 | |
| Share of non-performing loans (%) | |||||||
| Pre-crisis | 12.44 | 8.15 | 4.12 | 9.41 | 5.99 | 7.95 | |
| Post-crisis | 6.24 | 6.19 | 3.63 | 11.85 | 2.98 | 9.57 |
Table 6.
Non-parametric regression results. GDP—gross domestic product.
| Model I | Model II | Model III | ||||
|---|---|---|---|---|---|---|
| Variable | Band Width | p-Value | Band Width | p-Value | Band Width | p-Value |
| Size | 0.2853 | 0.07518 | 1.6045 | 0.06767 | 0.2852 | 0.41353 |
| Capital adequacy | 0.0177 | 0.21303 | 69358 | <0.0001 | 0.0143 | 0.06015 |
| Liquidity | 0.1325 | 0.26566 | 17.1520 | 0.38346 | 0.1264 | 0.54386 |
| GDP growth rate | 7.3452 | 0.84962 | 0.01462 | 0.37093 | 4.9081 | 0.06516 |
| Inflation gate | 3.1927 | 0.02005 | 0.3356 | 0.75188 | 3.6092 | 0.02256 |
| Public banks | 0.0746 | <0.0001 | 0.4999 | 0.02757 | 0.0463 | <0.0001 |
| Financial crisis of 2007–2008 | 0.4293 | <0.00251 | 0.2600 | 0.0802 | 0.4474 | <0.0001 |
| East Asia | – | – | – | – | 0.02753 | <0.0001 |
| Southeast Asia | – | – | – | – | 0.000073 | <0.0001 |
| South Asia | – | – | – | – | 0.01635 | <0.0001 |
| Latin America | – | – | – | – | 0.00037 | <0.0001 |
| Emerging Europe | – | – | – | – | 0.00059 | <0.0001 |
| Indonesian crisis dummy | – | – | 0.5 | 0.48622 | – | – |
| Malaysian crisis dummy | – | – | 0.49999 | 0.74686 | – | – |
| Philippines crisis dummy | – | – | 0.49999 | 0.28070 | – | – |
| Thailand crisis dummy | – | – | 0.3107 | 0.08521 | – | – |
| Brazil crisis dummy | – | – | 0.49999 | 0.44611 | – | – |
| Argentina crisis dummy | – | – | 0.5 | 0.99749 | – | – |
| Colombia crisis dummy | – | – | 0.40188 | 0.97744 | – | – |
| Turkey crisis dummy | – | – | 0.46401 | 0.89724 | – | – |
| Egypt crisis dummy | – | – | 0.12138 | 0.01253 | – | – |
| Morocco crisis dummy | – | – | 0.49999 | 0.89474 | – | – |
| Czech Republic crisis dummy | – | – | 0.49999 | 0.58897 | – | – |
| Greece crisis dummy | – | – | 0.49999 | 0.59398 | – | – |
| R2 = 0.80 | R2 = 0.48 | R2 = 0.78 | ||||
| Dependent variable: overall efficiency scores | ||||||
Model I: country fixed effect; Model II: country fixed effect and country crises dummies; Model III: regional fixed effects (dummies). Note: In Model II, the details of the country crisis dummies are as follows: Indonesian crisis 1997–1999, Malaysian crisis 1997–1999, Philippines crisis 1997–2001, Thailand crisis 1997–2000, Brazil crisis 1999, Argentina crisis 1999–2002, Colombia crisis 1999, Turkey crisis 2001, Egypt crisis 2011–2013, Morocco crisis 2009, Czech Republic crisis 2009–2011, and Greece crisis 2009–2013.
© 2018 by the authors. Licensee MDPI, Basel, Switzerland. This article is an open access article distributed under the terms and conditions of the Creative Commons Attribution (CC BY) license (http://creativecommons.org/licenses/by/4.0/).
Share and Cite
MDPI and ACS Style
Qayyum, A.; Riaz, K. Incorporating Credit Quality in Bank Efficiency Measurements: A Directional Distance Function Approach. J. Risk Financial Manag. 2018, 11, 78. https://doi.org/10.3390/jrfm11040078
AMA Style
Qayyum A, Riaz K. Incorporating Credit Quality in Bank Efficiency Measurements: A Directional Distance Function Approach. Journal of Risk and Financial Management. 2018; 11(4):78. https://doi.org/10.3390/jrfm11040078
Chicago/Turabian StyleQayyum, Abdul, and Khalid Riaz. 2018. "Incorporating Credit Quality in Bank Efficiency Measurements: A Directional Distance Function Approach" Journal of Risk and Financial Management 11, no. 4: 78. https://doi.org/10.3390/jrfm11040078