
An Event Study on the Reaction of Equity and Commodity Markets to the Onset of the Russia–Ukraine Conflict


1
College of Business, Purdue University Northwest, Hammond, IN 46321, USA
2
College of Business and Economics, University of Johannesburg, P.O. Box 524, Auckland Park, Johannesburg 2006, South Africa
3
Strathmore University Business School, P.O. Box 59857, Nairobi 00200, Kenya
*
Author to whom correspondence should be addressed.
J. Risk Financial Manag. 2023, 16(5), 256; https://doi.org/10.3390/jrfm16050256
Submission received: 1 February 2023
/
Revised: 31 March 2023
/
Accepted: 11 April 2023
/
Published: 24 April 2023
(This article belongs to the Special Issue Price Volatility in Financial and Commodity Markets)
Abstract
:Using a standard event study methodology and the EGARCH model, this study examined the depth of market anomaly at the onset of the Russia–Ukraine conflict in 2022. Equity markets in Africa and G7 nations were analyzed for their varied political and economic connections to the conflict. While the G7 nations were strongly opposed to Russia, African countries remained neutral. This study shows that abnormal losses in the initial period of the conflict were larger and more persistent in the G7 markets, contradicting the widely held notion that more developed equity markets are more efficient than the less developed markets. EGARCH results revealed that volatility persistence was widely present, although the leverage effect was only confirmed for U.S. and Canada. Throughout the period, commodity prices rose sharply, producing significant abnormal gains in the futures market. Unfortunately, this had a deleterious effect on African economies due to their heavy reliance on grain and fuel imports, all of which are priced in U.S. dollars, and which also rose sharply during the period. This study concludes with suggestions on how to mitigate currency and commodity price shocks to dollar-reliant and import-dependent economies.
1. Introduction
Prior to the start of the Russia–Ukraine conflict on 24 February 2022, the global economy was already dealing with various economic challenges as it struggled to recover from the burden of the COVID-19 pandemic. Top among them were supply shortages, rising inflation, and a surge in the value of the U.S. dollar. The Russian invasion of Ukraine led to three additional shocks. The first was the escalation of pre-existing political tensions between the two countries, which can be traced back to April 2014 when pro-Russian separatists in Ukraine’s eastern region of Donbas declared independence (Appendix A shows the timeline of events leading up to the 2022 invasion). The second was a sharp rise in food costs due mostly to disruptions in grain exports from Ukraine. And the third was a sharp rise in the price of petroleum caused primarily by limited oil supply and high demand in the immediate post-COVID period.
The Russian blockade of Ukraine’s Black Sea ports hampered grain exports from Ukraine, where most of the country’s agricultural produce is shipped out to sea. This export bottleneck aggravated pre-existing problems of global food shortages caused by supply chain disruptions which began with the easing of COVID-19 lockdowns. Not surprisingly, the countries most affected were those in sub-Saharan Africa. According to the World Economic Forum, more than a quarter of African countries rely on Russia and Ukraine for more than half of their wheat imports, and almost half depends on imports for more than a third of their wheat.1 These export constraints pushed up the prices of corn and wheat futures contracts by more than 40 percent within weeks of the invasion, based on trading data from the New York Mercantile Exchange (NYMEX). Together with crude oil, corn and wheat are the most widely and actively traded commodities in futures exchanges around the world.
In addition to the spike in the cost of grains, there was a sharp rise in the price of crude oil. Within two weeks of the conflict, the price of West Texas Intermediate (WTI), the North American crude oil benchmark, jumped 30 percent, reaching a multiyear high of more than $120 per barrel in June 2022. Before the invasion, there was already a steady increase in global travel demand as countries lifted COVID travel restrictions. That surge in worldwide travel had a knock-on effect on the demand for petroleum and, with that, a sharp rise in energy prices.
The geopolitical crisis caused by the invasion, together with its COVID-19 antecedents, led to increased uncertainties in the commodities markets, especially petroleum. The International Energy Agency (IEA) lists Russia as the world’s largest exporter of petroleum and the second largest crude oil exporter after Saudi Arabia. While the United States is the world’s largest producer of crude oil, with about 18 million barrels per day (2022 data), Russia’s global oil footprint is massive, especially in Europe, where 60 percent of its oil is consumed. For context, Russia’s total petroleum production in January 2022 was 11.3 million barrels per day, of which 10 million barrels was crude oil. Saudi Arabia is a close third with a daily production figure of 12 million barrels (IEA 2022).
As the conflict deepened, three price effects converged to adversely affect the wealth of consumers and stockholders worldwide. The first was a sharp rise in geopolitical risk, which forced global equity markets into a tailspin. The second was the steep rise in commodity prices, which heightened the pace of global inflation. The final factor was the sharp rise in the value of the U.S. dollar. Because international commodities such as corn, wheat, and crude oil are denominated in dollars, it means that parallel increases in their prices and in the value of the dollar have a magnified (negative) wealth effect on foreign consumers while offering a safe haven for traders with a long futures position (Kyriazis 2022).
Outside of the United States, consumers face shrinking buying power when their national currencies weaken and the price of their dollar-denominated imports rises. This was the predicament faced by many African economies through the early months of the crisis. Recent studies that have examined this exchange rate conundrum include Obi et al. (2019) and Devereux and Smith (2018). Table 1 provides a summary of how the widespread currency depreciation in key African economies heightened the rate of commodity price inflation in the early months of the crisis. In some cases, prices more than doubled within six months of the start of the conflict.
The onset of the invasion was met with severe economic sanctions by the West. The effect of the sanctions was double-edged, however. For one thing, it raised the specter of uncertainty about Russia’s future oil supply to Europe. Moreover, there was the issue of disruptions in grain shipment from the region. All of this was in addition to the problem of rising inflation and the unpredictability of Russia’s military intentions in the region. By examining the price impact of the invasion on the equity and commodities markets, the wealth effect on investors and consumers can be better understood. We pursue this by using a standard event study model. Like Jiun (2018) and Gopane and Mmotla (2019), our empirical analysis is supplemented with an asymmetric GARCH model to account for the presence of volatility clustering during the event period.
Event studies are widely used to investigate the impact of an event on asset returns. The goal is to determine if the event led to such a prolonged stretch of abnormal returns as to cast doubt on the validity of the semistrong form of the efficient market hypothesis (Fama et al. 1969). The efficient market theory by Fama (1970) argues that asset prices adjust quickly to new information, making it difficult for any trader to earn consistent abnormal returns based on that information. Thus, by examining the length of post-event abnormal returns, one might determine if an event led to a prolonged stretch of sluggish price movement, which would be a violation of semistrong form market efficiency.
The rest of this paper continues with a review of studies on semistrong form market efficiency, especially those dealing with geopolitical events. This is followed by a description of the empirical data and estimation models. Empirical results and conclusions are presented afterward. Lastly, we offer some risk mitigation recommendations.
2. Literature Review
Event studies, as the means to test the validity of the semistrong form of the efficient market hypothesis, gained momentum after the seminal works of Fama et al. (1969), Fama (1970), Brown and Warner (1980, 1985), Corrado (1989), and Fama (1991). Kothari and Warner (2007) provide a helpful overview of event study methodologies highlighting, in particular, the benefits of short-horizon studies with daily stock data.
The literature discusses three basic event study methodologies for calculating abnormal returns, also referred to as excess returns. These are risk-adjusted return (RAR), market-adjusted return (MKAR), and mean-adjusted return (MAR). The last model is also referred to as constant mean return (CMR). As the name implies, RAR adjusts excess returns by the risk of the security using a pricing model such as the capital asset pricing model (CAPM). Market-adjusted return (MKAR) calculates excess returns as the difference between the return on the asset and the contemporaneous return on some underlying index. Excess return using MAR is the difference between the return on the security and the average return (or constant mean) obtained from some estimation period. Regardless of the method used, the goal of these studies is to identify how specific events affect the wealth of investors by their ability to create prolonged positive or negative abnormal returns and, thereby, materially alter the wealth position of investors. Examples of studies that use a combination of these models include Buigut and Masinde (2022) and Kabiru et al. (2015) on the impact of Kenya’s elections, Afego (2013) on the effects of the earnings announcement, Gopane and Mmotla (2019) and Obi et al. (2009) on the impact of major sports events, Nazir et al. (2014) and Jiun (2018) on the impact of political events, and Shaikh et al. (2021) on the impact of COVID-19 on the stock returns of G7 economies.
As is easily observed, neither RAR nor MKAR is appropriate when using stock indices or nonfinancial assets since these indices are themselves the performance measures. Fortunately, Brown and Warner (1980, 1985) and later Kothari and Warner (2007) demonstrate that in a wide variety of cases, MAR is sufficient in identifying abnormal performance, especially when using high-frequency data. Campbell et al. (1996, p. 154) reinforce this view by pointing out that “this lack of sensitivity to the model choice can be attributed to the fact that the variance of the abnormal return is frequently not reduced much by choosing a more sophisticated model.”
Three notable studies that use event study methodologies to examine market efficiency in the commodities market are Liu et al. (2019), Kutan and Demirer (2010), and Deaves and Krinsky (1992). Liu et al. (2019) investigated the impact of OPEC announcements on the price and volatility of crude oil. The study finds that oil price reacts asymmetrically to production decisions leading to price increases versus price cuts. The study also finds that price volatility is a function of the type of production decision and the level of oil production at the time the decision was made. Kutan and Demirer (2010) examined abnormal returns in crude oil spot and futures markets around the OPEC conference and SPR announcement dates. They also find asymmetric price behavior in that only OPEC production cut announcements yielded a statistically significant impact, with the impact diminishing for longer maturities. In an earlier study on the price behavior of crude oil and heating oil futures around OPEC conferences, Deaves and Krinsky (1992) found significant excess returns for market participants who went long in oil futures contracts on the day following the end of the conferences. They find, moreover, that these excess returns were larger than would typically be found in equity market event studies.
A study by Sajid Nazir et al. (2014) looks at the price impact of the different forms of government in Pakistan using data from the Karachi Stock Exchange. The authors compare the degree of market efficiency when a leadership change occurs from autocratic to democratic regimes. Using the MAR model, the study finds that the two types of governments affect stock returns differently. Specifically, they find that there is a short span of inefficiencies lasting about 15 trading days after a change in government. In a related study, Kumara and Fernando (2020) investigated the relationship between political events and stock market returns in the Colombo Stock Exchange. Using the MAR model, they find that investors overreact to positive political news but underreact to negative news.
In a recent study on the impact of terrorism on stock markets, Ahmad et al. (2022) show that developing countries are more fragile and susceptible to terrorism than developed markets. The latter tend to be more resilient and generally more efficient. In an apparent contrast to these findings, Zaremba et al. (2022) find that countries with high levels of geopolitical risks tend to outperform their counterparts.
Other recent event studies include Alekneviciene et al. (2018) and Balcilar et al. (2018). Using data from the Baltic countries, Alekneviciene et al. find that due to thin trading, the stock markets of Lithuania, Latvia, and Estonia are not efficient in the semistrong form. Balcilar et al. examined the effect of geopolitical uncertainty on the stock return volatility dynamics of the BRICS stock markets. They find that the effects of exogenous shocks are heterogeneous across markets. They also find that these shocks exert a greater impact on price volatility than on stock returns.
With regard to African economies, Ahmed (2017) explored the impact of political regime changes on equity markets in Egyptian stocks between 2011 and 2014. The study employed both event study and univariate VAR-EGARCH models in the analysis. The results show that political turmoils have a profound effect on the risk-return profiles across all the market sectors but with varying degrees of intensity. Earlier, Aizenman et al. (2016) examined the impact of external economic shocks on developing countries’ financial vulnerability on equity and bond markets. The study finds that global crises consistently have a negative effect on the returns of these markets. More recently, Truong and Friday (2021) have used similar volatility models to confirm the presence of the day-of-the-week effect for the Ho Chi Minh Stock Exchange following the introduction of a new index futures contract.
Buigut and Masinde (2022) examined the stock market impact of Kenyan elections. Using both parametric and nonparametric tests, the findings reveal that political conflicts negatively affect tourism stocks to a greater extent than financial and media stocks. On the other hand, the tourism sector reacts much more positively to peaceful elections than most of the other sectors of the economy. Lehkonen and Heimonen (2015) used a panel dataset of 49 emerging markets to examine the effect of democracy and political risk on stock market performance. The findings show that the relationship between democracy and political risk is inverse. Improvements in democratic practices, together with declining political risks, lead to higher investment returns.
Recent studies on how financial markets reacted to the Russia–Ukraine crisis include Bagchi and Paul (2023), Abbassi et al. (2022), and Yousaf et al. (2022). Using the fractionally integrated GARCH model, Bagchi and Paul find distinct structural breaks in exchange rates and stock returns in G7 markets due to the oil price shock that occurred in the first month of the crisis. The last two studies investigate the effect of the conflict on EU stocks using a standard event study methodology. These studies show that there was a significant negative effect on most of the stock markets before and after the conflict began.
The political and economic fallout of the conflict has also received some attention in the literature. For example, using machine learning, Ngo et al. (2022) find that public sentiments about the invasion are vastly heterogenous, with the most significant divergence within Asian and African countries. On the economic front, Hoang et al. (2022) show that the economic sanctions imposed by the West did not affect Russian energy firms, although they had a negative impact on capital expenditures, cost of capital, and R&D intensity in the nonenergy-related firms in Russia.
In a notable departure from these studies, our inquiry compares pre-post abnormal returns for G7 and African equity markets using a standard event study methodology supplemented by an asymmetric GARCH model. By this approach, we are able to compare the levels of abnormal returns across the two diametrically different regions while examining the degree to which volatility asymmetries existed around the initial period of the crisis. We also investigate how the price shocks in the commodity markets at the onset of the crisis aggravated pre-existing food insecurity and inflation pressures, especially in the developing economies of sub-Saharan Africa.
3. Data and Methodology
We used stock indices from the G7 markets and the following African countries: Egypt, Ghana, Kenya, Mauritius, Morocco, Nigeria, and South Africa. Our African sample was limited to these seven markets due to problems of data sufficiency. Fortunately, these countries are home to the largest equity markets on the continent. In the commodities market, we used one-month futures prices for crude oil, corn, and wheat, which are the three most widely and actively traded commodities. Stock indices for the African exchanges are value-weighted and were sourced from the archives of the various stock exchanges. G7 stock returns are for the S&P 500 (U.S.), FTSE 100 (U.K.), TSX (Canada), DAX 30 (Germany), CAC 40 (France), MIB (Italy), and Nikkei 225 (Japan). Crude oil futures prices are for the West Texas Intermediate (WTI) and were obtained from the U.S. Energy Information Administration (EIA). Corn and wheat futures prices were obtained from the Chicago Mercantile Exchange (CME). Daily data were used in the analysis.
3.1. Event Study Model
The event day, dubbed day 0, is 24 February 2022, which is the first day that Russian troops entered Ukrainian territory. The sample period is from September 2021 to August 2022. Within this period, we chose a 100-day estimation period ending on or about 2 February 2022. The pre-event and post-event observation periods are the 15 trading days before and after day 0, respectively. The event study model in Equation (1) calculates abnormal return (AR) as the difference between the actual return for each trading day (Rt) within the observation period and the expected return [Rt|] conditional on , the information set.
Actual returns are calculated as , where Pt and Pt−1 are current and previous day prices, respectively. Using the MAR model, Equation (1) is operationalized as follows:
where is the mean return calculated with data from the estimation period. For multiple periods, cumulative abnormal return (CAR) is calculated as running totals of daily ARs:
where T1 is the first day in the event window, and T2 is the last day in the same event period. The test of significance for CAR is used to determine the effect of the event in each observation window. Under the assumption that abnormal returns are normally distributed, Kothari and Warner (2007) and, more recently, Gopane and Mmotla (2019) explain that a standard parametric test statistic of the following form can be used for the test of significance:
where
and where L is the horizon length, which is the total number of trading days within the event window. The null hypothesis is that the CAR in each event window is equal to zero:
H0: CAR = 0 (No abnormal returns);
HA: CAR ≠ 0.
Post-event test results provide information on market efficiency. Persistent abnormal returns after an event has occurred are inconsistent with market efficiency and suggest that a profitable trading rule can be designed.
3.2. Supplementing Event Study with EGARCH
While conventional event study methodologies are generally robust in many cases, some authors have argued for the inclusion of volatility models to account for volatility clustering and possible asymmetries in asset returns around the event period. Recent event studies that incorporate volatility behavior include Jiun (2018) and Gopane and Mmotla (2019). Similar to these studies, we supplement our analysis with the GARCH model pioneered by Bollerslev (1986). To account for the possibility of leverage effects in the conditional variance, we specify the exponential GARCH (EGARCH) model first introduced by Nelson (1991). Like all GARCH models, EGARCH is estimated through a combination of mean and variance equations. In this study, the appropriate conditional mean equation is specified as ARMA(2,1):
Volatility persistence and asymmetries are examined in the following conditional variance equation, specified as EGARCH(1,1):
In the mean equation, is the logarithmic return on the stock index; and are dummy variables for the inner window period before and after day 0, respectively. The covariate, VIX, is a control variable reflecting the effect of near-term market volatility. This risk metric rises and falls with investor pessimism. In addition to using the optimal lag selected by the information criterion, the inclusion of the one-period term, , in the mean equation helps avoid the nonspherical disturbance problem of serial correlation.
In the variance equation, and are the one-period ARCH and GARCH variables, respectively. The constant, , measures long-run average volatility; α is the coefficient of the ARCH term; β is the coefficient of the GARCH term; is the coefficient of the EGARCH term. The EGARCH coefficient measures the leverage effect and is expected to be negative and statistically significant. Thus, if λ < 0, it means that negative shocks or bad news increase volatility more than positive shocks of the same magnitude. However, if λ > 0, then positive shocks weigh more on the conditional variance than negative shocks. In the case where λ = 0, the EGARCH term in the model disappears, meaning that there are no asymmetry or leverage effects in the data-generating process of the conditional variance. Pre- and post-event impact on the returns generating process is measured by and , respectively. Similarly, and measure the impact of the event on the conditional variance. The coefficients of the control variable, and , capture the impact of near-term volatility on the returns process and on the conditional variance, respectively.
4. Results
Table 2 contains event study results of average abnormal returns on day 0, the event day. Despite being at vastly different levels of market development, abnormal returns on the initial day of the invasion were comparable. The average abnormal return for the G7 markets was −2.4 percent, slightly larger than that of the African markets, which came out at −2.2 percent. Both abnormal returns are statistically significant at the 0.01 level. The agricultural commodities equally produced statistically significant excess returns on day 0. Because abnormal returns for the commodities are positive, they represent above-normal mark-to-market cash inflows for futures traders with a long position and negative cash flows of the same size for the short position holders.
4.1. Pre-Event and Post-Event Abnormal Returns
Cumulative abnormal returns (CAR) are summarized in Table 3. Panel A shows the results for the entire 31-day event window (−15, +15). For the two equity market regions, CARs are negative and significant at the 0.01 level. It is noteworthy that total losses were larger for the G7 markets (−5.9 percent) than for the African markets (−4.8 percent). These results show that over the sample period, the loss of investor wealth was higher in the more developed equity markets than in the African markets. In the commodities markets, abnormal returns rose nine percent for oil, 24 percent for corn, and 30 percent for wheat. These results are significant at either the 0.01 or 0.05 level.
Pre-event abnormal returns are summarized in Panel B of Table 3. Except for oil, all the other abnormal returns are statistically significant at the 0.01 level. Pre-event abnormal returns are not unusual in event studies as they suggest the degree to which investors anticipated the occurrence of the event (Kothari and Warner 2007). In the derivatives markets, such behavior is not uncharacteristic in the pricing of futures contracts since traders consider the cost of carry, which typically rises with uncertainty.
Inferences on market efficiency are based on the persistence of abnormal returns in the post-event period. This period is broken into two parts. Panel C shows abnormal returns for the immediate post-event window (+1, +7), while Panel D shows results for the extended period (+1, +15). Perhaps because of their physical or political detachment from the politics of the crisis, post-event abnormal returns for the African markets, although negative, were not significant. Without any other logical explanation, one might surmise that the African markets behaved more consistently with market efficiency. For the G7 markets, CAR in the 7-day post-event period was larger than −5 percent and significant at 0.05.
Interestingly, it took longer than seven trading days for the G7 markets to normalize after the invasion began, leading one to conclude that these more developed equity markets were less efficient in assimilating the informational impact of the crisis than the less developed ones in Africa. This finding is in direct contrast to a key observation by Ahmad et al. (2022) that developed markets tend to be more resilient and more efficient than the developing markets which tend to succumb more quickly to shocks such as terrorism.
Throughout the period, the commodities produced significant positive abnormal returns up to a full week after the invasion began. Other than corn futures, abnormal returns on the commodities were eliminated by the second week of the crisis.
Graphs of cumulative abnormal returns are presented in Figure 1 and Figure 2. The pre-event drop in abnormal returns in the equity markets is quite noticeable, especially about a week before day 0. On the other hand, CARs for agricultural commodities rose sharply during the same period, obviously in line with developing news of a possible invasion. Except for corn futures, the extended post-event CARs were not as substantial in the commodities market, as shown in Panel D of Table 3.
Overall, pre-event abnormal returns suggest the invasion was largely anticipated as Russian troops began amassing at Ukraine’s eastern frontier. Such market behavior offers insight into the extent to which traders absorbed evolving news of the impending invasion. Of particular note is the significance of the post-event positive abnormal returns in the commodities markets. While they represent huge gains for futures traders with a long position, they also, by equal measure, represent above-normal mark-to-market losses for the counterparties in the contracts. More importantly, consumers in regions that rely heavily on the importation of these commodities faced unsustainably high prices, enough to compel countries such as Ghana, Nigeria, and later, Kenya to limit or abandon long-held fuel subsidies.2
4.2. EGARCH Results
EGARCH estimation was conducted for each of the G7 markets. Thus, there were seven mean and conditional variance equations. Moreover, diagnostic tests were performed for each of the models. Each column in Table 4 shows the results of each model. The results of the mean equations are presented in the top half of the table, followed by the results of the more important variance equation. Due to problems of thin and nonsynchronous trading, African markets were excluded from this secondary analysis. Results of the mean equation show that the crisis led to widespread pre-event negative returns. However, they were only statistically significant for markets in the U.S. and Canada. The post-event impact was negative for all markets except the U.S. Expectedly, the near-term volatility metric, VIX, introduced in the model as a control variable, is negative and significant, a confirmation of the market’s aversion to uncertainty.
Concerning the volatility impact of the conflict, we find that although it produced higher returns variability in the post-event period, these increases were generally insignificant. This outcome demonstrates that, on its own, the conflict did not contribute much to the variability of returns outside of the impact of implied volatility. Quite notably, the leverage coefficient is negative across the board but only significant for U.S. and Canada. This outcome means that negative news in these two North American markets increases volatility much more than positive news of the same magnitude. As it turns out, U.S. and Canada were also the only G7 markets with significant pre-event negative returns. Post-event returns for the U.S. were positive and statistically significant. Thus, in post-event time, U.S. investors expected to be rewarded with higher returns. The diagnostic test results at the bottom of Table 4 confirm the validity of the estimation models. These results show no remaining ARCH effects and no serial correlation.
5. Conclusions
This study examined the nature of abnormal market performance around the onset of the 2022 Russian invasion of Ukraine. Equity markets in Africa and G7 countries were analyzed for their widely different political and economic connections to the conflict. While G7 economies are the most affluent with the strongest geopolitical stance against Russia, African economies are primarily import-dependent and politically nonaligned with the parties to the conflict.
The primary investigatory goal was to determine the wealth effect of the invasion in the two equity market regions and if the impact differed across the markets given their vastly different levels of economic and political development. The second aim was to assess the degree to which these markets proved efficient following the initial shock of the invasion. Since the crisis aggravated pre-existing global inflation trends, the study also examined its impact on the prices of essential commodities, specifically crude oil, corn, and wheat. This latter inquiry was motivated by the heavy reliance of African economies on fuel and food imports (especially wheat), most of which are denominated in U.S. dollars.
Event study results showed that abnormal losses through the initial period of the conflict were larger for the G7 equity markets than for the African markets. Pre-event abnormal returns were negative and statistically significant, with heavier losses occurring for the G7 markets. We view this pre-event abnormal behavior as an indication that the event was partially anticipated. In the post-event time, the G7 markets exhibited sluggish price behavior, casting doubt on how efficiently these markets were able to absorb news of the crisis. Surprisingly, we found no evidence of significant post-event abnormal returns for the African markets, suggesting that, unlike the more developed markets, African stock markets behaved in a manner that was more consistent with market efficiency.
In the commodity markets, cumulative abnormal returns were widely positive in both pre-event and post-event periods. Abnormal price increases were undoubtedly a boon for long position holders but a bust for traders with short positions. The surge in commodity prices also meant higher food and energy prices, especially for the import-dependent developing economies in sub-Saharan Africa. The effect of these high prices was made worse by the sharp rise in the value of the U.S. dollar during the period, which, incidentally, is also the denominating currency for these commodities. Unfortunately, these parallel increases in the direct costs of commodities and U.S. currency resulted in abnormally high commodity prices, which in some cases, doubled in less than six months from the onset of the crisis.
We supplemented the event study with the EGARCH model to account for volatility clustering and leverage effects. The goal was to determine if the crisis had a discernible impact on the conditional variance of stock returns and, if so, whether the effect was asymmetric. Due to a lack of data sufficiency in the African markets, this secondary analysis was conducted only with equity data from the G7 economies. Results showed that volatility persistence or the GARCH effect was present across the board. However, the leverage effect during the period was only confirmed for U.S. and Canada. Moreover, there was only a marginal post-event impact on the conditional variance.
6. Risk Management and Policy Implications
One important finding in this study is that investors in the advanced equity markets other than those in North America face the daunting reality that positive abnormal returns may not necessarily accompany volatility increases in the wake of a global crisis. Because the GARCH analysis showed that the two are mostly uncorrelated, portfolio rebalancing at such times may have little chance of success. Given that, investors are better off taking a long-term view with a buy-and-hold approach in which regular investments are made at defined intervals to take advantage of volatility clustering at such times.
Secondly, investing in dollar-denominated assets may prove profitable, given the predictable rise in the value of the U.S. currency at such times. This study demonstrates that the combined increase in commodity prices and the U.S. dollar in times of global crisis tends to create opportunities for short-term payoffs in the futures market. For example, a long futures position with a planned early offset might prove gainful. Early offset appears wise because often, there are concerted efforts to resolve the production and supply chain problems responsible for the price hike. A case in point was in July 2022 when Turkey brokered a grain export deal between Russia and Ukraine. In the same month, U.S. President, Joe Biden, traveled to Saudi Arabia to sway OPEC members to boost oil production. The combined effect of these two diplomatic efforts was the restoration of grain shipment and increased oil production and, with that, falling commodity prices in the months that followed. Thus, investing in commodities in times of global uncertainty is an excellent way to diversify from equities which often suffer significant losses.
Economic policies can be forged on three fronts, especially for the African economies. First, a renewed emphasis on domestic grain production is imperative. However, like food production in other developing regions, such as Southeast Asia, this would have to be accompanied by robust regulatory oversight to ensure international quality standards. This combined approach should help reduce the need for food imports and the predisposition of these economies to commodity price shocks. Further, it would alleviate the damaging effect of excessive food imports on foreign reserves.
Second, it is evident that an important way of building economic independence is to develop home-grown high-level human capital, especially in science and technology. In growth economies, this typically begins with creating research centers in select universities. For many African economies, there is, unfortunately, a persistent dependence not only on imported goods and materials but also on technical expertise. This overreliance on foreign labor and capital taxes the thin reserves of these countries. Yet, as some developing economies such as Thailand, Indonesia, and Vietnam have proved, an intentional focus on building up domestic capacities goes a long way to ensuring sustainable economic growth. The added benefit is reduced exposure to currency spikes, which often makes the cost of imported resources exceedingly high in times of crisis.
The observed deleterious effects of currency and commodity price shocks beg for a robust assessment of the potential benefit of full dollarization, especially for dollar-reliant and import-dependent economies. The main attraction of using the dollar as a legal tender, as Berg and Borensztein (2000) explain, is the elimination of the risk of sharp exchange rate adjustments and currency shocks. While such a policy shift might be viewed negatively by some, it has the potential to boost international investor confidence, reduce spreads on dollar-denominated loans, and most importantly, lead to a more predictable economic climate in times of global crisis.
The practical reality of full dollarization for the affected economies is that many commercial assets and cross-border transactions are already priced in U.S. dollars. With the entire economy anchored to the dollar rather than on domestic output, these countries struggle to meet recurrent payment obligations when the dollar or dollar-denominated assets experience a sudden surge in price. Two such examples occurred in the final half of 2022 when the Ghanaian cedi lost more than half its value in less than a week. This forced the Ghanaian government to seek a massive restructuring of its debt portfolio. A similar erosion in the value of the Nigerian naira around the same period compelled the country’s central bank to restrict foreign airlines from repatriating their dollar revenues. With the tightening dollar squeeze amid slow growth and fiscal strain, Moody’s Investors Service downgraded Nigeria’s debt deeper into junk status in January 2023.
Author Contributions
Conceptualization, P.O.; methodology, P.O.; software, P.O.; validation, P.O., F.W. and M.N.; formal analysis, P.O. and M.N.; investigation, P.O.; resources, P.O.; data curation, M.N.; writing—original draft preparation, P.O.; writing—review and editing, F.W.; visualization, P.O.; supervision, P.O. All authors have read and agreed to the published version of the manuscript.
Funding
This research received no external funding.
Data Availability Statement
The data presented in this study are available as follows: crude oil futures price: U.S. Energy Information Administration (www.eia.gov/dnav/pet/hist/RCLC1D.htm, accessed on 4 April 2023). Corn and wheat futures prices: CME Group (https://www.cmegroup.com/markets/agriculture.html#products, accessed on 4 April 2023), G7 stock indices: (https://www.investing.com/indices/major-indices, accessed on 4 April 2023), African stock indices: Egypt—https://www.egx.com.eg/en/Indices.aspx, accessed on 4 April 2023; Ghana—https://gse.com.gh/trading-and-data/, accessed on 4 April 2023; Kenya—https://www.nse.co.ke/dataservices/historical-data/, accessed on 4 April 2023; Mauritius—https://www.stockexchangeofmauritius.com/products-market-data/indices, accessed on 4 April 2023; Morocco—https://www.casablanca-bourse.com/bourseweb/en/Negociation-History.aspx?Cat=24&IdLink=225, accessed on 4 April 2023; Nigeria—https://ngxgroup.com/exchange/data/historical-data/, accessed on 4 April 2023; and South Africa—https://www.jse.co.za/market-data, accessed on 4 April 2023.
Conflicts of Interest
The authors declare no conflict of interest.
Appendix A. Timeline of Events Leading Up to the 2022 Russian Invasion of Ukraine

| 1991 Dec 25 | Ukraine declares independence after the fall of the Soviet Union. |
| 2004 Nov 21 | Pro-Russian candidate Viktor Yanukovich, who speaks only Russian, is declared president of Ukraine amid allegations of massive election fraud. Protests, dubbed the Orange Revolution, forced a rerun. Election results were also later overturned by the Ukrainian Supreme Court. |
| 2004 Dec 26 | In a new runoff, Yanukovych was defeated. Pro-Western candidate, Viktor Yushchenko, is elected president and declares intent to join NATO and EU. |
| 2010 Feb 7 | Yanukovich returns to win the presidential election with a narrow victory. Strengthens ties with Russia by extending Russia’s lease of Ukraine’s port at Sevastopol in exchange for a reduction in the price of Russian natural gas. |
| 2013 Nov | Yanukovich suspends trade talks with the EU and opts to revive economic ties with Russia, triggering months of mass protests in Kyiv, Ukraine’s capital. |
| 2014 Feb 22 | Ukraine’s parliament voted to remove Yanukovich for allowing the killing of protesters. Within days, pro-Russian armed men seized parliament in the Ukrainian region of Crimea and raised the Russian flag. Moscow later annexes Crimea. |
| 2014 Feb 28 | Yanukovych appears at the Kremlin, where he delivers a speech asserting that he is still the president of Ukraine. |
| 2014 Apr | Pro-Russian separatists in the Eastern Ukrainian region of Donbas declare independence following months of fighting between the separatists and the Ukrainian army. |
| 2016 Jan 1 | An association agreement between Ukraine and the EU opens markets for free trade of goods and services and visa-free travel to the EU for Ukrainians. |
| 2019 Jan | Yanukovych was found guilty of high treason and sentenced to 13 years in prison in absentia (he was still in exile in Russia). |
| 2019 Apr 21 | Volodymyr Zelenskiy is elected president of Ukraine and pledges to strengthen ties with the EU. |
| 2021 Jan | Zelenskiy appeals to U.S. President Joe Biden to allow Ukraine to join NATO amid mounting Russian support for separatists in eastern Ukraine. |
| 2021 Feb | Zelenskiy’s government freezes the assets of opposition leader Viktor Medvedchuk, Russia’s most prominent ally in Ukraine’s politics. |
| 2021 Spring-Fall | Russia begins amassing troops near Ukraine’s eastern border in what Russia’s President, Vladimir Putin, referred to as training exercises. |
| 2021 Dec 17 | Russia presents security demands which include that NATO pull back troops and weapons from Eastern Europe and bar Ukraine from ever joining NATO. |
| 2022 Jan 26 | U.S. states its commitment to NATO’s “open-door” policy while offering a “pragmatic evaluation” of Moscow’s concerns. Two days later, Russia said that its demands had not been addressed. |
| 2022 Feb 15 | Amid growing fears of imminent Russian attack, U.S. announces it would send 3000 additional troops to NATO members Poland and Romania for defense purposes but not to Ukraine. |
| 2022 Feb 21 | In a TV address, Russia’s President Putin says Ukraine is an integral part of Russian history and has a puppet regime managed by foreign powers. He ordered what he referred to as peacekeeping forces into two breakaway regions in Eastern Ukraine, recognizing them as independent. |
| 2022 Feb 22 | G7 and EU countries sanction Russian parliament members, Russian banks, and various Russian assets in response to Putin’s troop order. Germany halts the Nord Stream 2 gas pipeline project. |
| 2022 Feb 24 | Putin authorizes “special military operations” in Ukraine. Russian forces begin missile and artillery attacks, striking major Ukrainian cities, including Kiev. |
| 2022 Feb 26 | Western allies announce new sanctions, including restrictions on Russia’s central bank. Russian banks are also barred from the global payments system. |
Sources: Britannica, 5 July 2022 (www.britannica.com/biography/Viktor-Yanukovych, accessed on 13 August 2022). Reuters, 1 March 2022 (www.reuters.com/world/europe/events-leading-up-russias-invasion-ukraine-2022-02-28, accessed on 13 August 2022).
| 1 | Averting an African Food Crisis in the Wake of the Ukraine War. World Economic Forum, 16 May 2022. (https://www.weforum.org/agenda/2022/05/averting-an-african-food-crisis-in-the-wake-of-the-ukraine-war (accessed on 30 June 2022)). |
| 2 | Kenya scraps petrol subsidy after president warned it was unsustainable. Reuters, 15 September 2022. (https://www.reuters.com/world/africa/kenya-scraps-petrol-subsidy-after-president-warned-it-was-unsustainable-2022-09-15 (accessed on 19 September 2022)). |
References
- Abbassi, Wajih, Vineeta Kumari, and Dharen K. Pandey. 2022. What makes firms vulnerable to the Russia–Ukraine crisis? Journal of Risk Finance 24: 24–39. [Google Scholar] [CrossRef]
- Afego, Pyemo N. 2013. Stock Price Response to Earnings Announcements: Evidence from the Nigerian Stock Market. Journal of African Business 14: 141–49. [Google Scholar] [CrossRef]
- Ahmad, Tanveer, Shahzad Hussain, Muhammad Akbar, and Ajid Rehman. 2022. Impact of terrorism on stock market: Evidence from developed and developing markets. International Journal of Disaster Risk Reduction 70: 102786. [Google Scholar] [CrossRef]
- Ahmed, Walid. 2017. The impact of political regime changes on stock prices: The case of Egypt. International Journal of Emerging Markets 12: 508–31. [Google Scholar] [CrossRef]
- Aizenman, Joshua, Yothin Jinjarak, Minsoo Lee, and Donghyun Park. 2016. Developing countries’ financial vulnerability to the eurozone crisis: An event study of equity and bond markets. Journal of Economic Policy Reform 19: 1–19. [Google Scholar] [CrossRef]
- Alekneviciene, Vilija, Lauryna Kviedaraitiene, and Egle Alekneviciute. 2018. Semi-Strong Form Efficiency in the Baltic Stock Markets under Changing Economic Situation. Engineering Economics 29: 495–506. [Google Scholar] [CrossRef]
- Bagchi, Bhaskar, and Biswajot Paul. 2023. Effects of Crude Oil Price Shocks on Stock Markets and Currency Exchange Rates in the Context of Russia-Ukraine Conflict: Evidence from G7 Countries. Journal of Risk and Financial Management 16: 64. [Google Scholar] [CrossRef]
- Balcilar, Mehmet, Matteo Bonato, Riza Demirer, and Rangan Gupta. 2018. Geopolitical risks and stock market dynamics of the BRICS. Economic Systems 42: 295–306. [Google Scholar] [CrossRef]
- Berg, Andrew, and Eduardo Borensztein. 2000. The Pros and Cons of Full Dollarization. IMF Working Paper WP/00/50. Washington, DC: International Monetary Fund. [Google Scholar]
- Bollerslev, Tim. 1986. Generalized autoregressive conditional heteroskedasticity. Journal of Econometrics 31: 307–27. [Google Scholar] [CrossRef]
- Brown, Steven, and Jerold Warner. 1980. Measuring security price performance. Journal of Financial Economics 8: 205–58. [Google Scholar] [CrossRef]
- Brown, Steven, and Jerrold Warner. 1985. Using daily stock returns. Journal of Financial Economics 14: 3–31. [Google Scholar] [CrossRef]
- Buigut, Steven, and Brian Masinde. 2022. The Impact of General Elections on Kenya’s Tourism, Financial and Media Sector Stock Returns: An Event Study Approach. Journal of African Business 23: 497–515. [Google Scholar] [CrossRef]
- Campbell, John, Andrew Lo, and A. Craig MacKinlay. 1996. The Econometrics of Financial Markets. Princeton: Princeton University Press. [Google Scholar]
- Corrado, Charles. 1989. A nonparametric test for abnormal security-price performance in event studies. Journal of Financial Economics 23: 385–95. [Google Scholar] [CrossRef]
- Deaves, Richard, and Itzhak Krinsky. 1992. The Behavior of Oil Futures Returns Around OPEC Conferences. Journal of Futures Market 12: 563–74. [Google Scholar] [CrossRef]
- Devereux, Michael B., and Gregor W. Smith. 2018. Commodity Currencies and Monetary Policy. Working Paper 25076. Cambridge: National Bureau of Economic Research. [Google Scholar] [CrossRef]
- Fama, Eugene F. 1970. Efficient capital markets: A review of theory and empirical work. The Journal of Finance 25: 383–417. [Google Scholar] [CrossRef]
- Fama, Eugene F. 1991. Efficient capital markets II. The Journal of Finance 46: 1575–617. [Google Scholar] [CrossRef]
- Fama, Eugene, Lawrence Fisher, Michael Jensen, and Richard Roll. 1969. The Adjustment of Stock Prices to New Information. International Economic Review 10: 1–21. [Google Scholar] [CrossRef]
- Gopane, Thabo J., and Reggy M. Mmotla. 2019. Stock Market Reaction to Mega Sport Events: Evidence from South Africa and Morocco. International Journal of Sports Finance 14: 193–210. [Google Scholar]
- Hoang, Khanh, Toan L. D. Huynh, and Steven Ongena, eds. 2022. DP1741 The Impact of Foreign Sanctions on Firm Performance in Russia. CEPR Press Discussion Paper No. 17415. Available online: cepr.org/voxeu/columns/impact-foreign-sanctions-firm-performance-russia (accessed on 4 April 2023).
- IEA. 2022. Russian Supplies to Global Energy Markets. Paris: IEA. Available online: https://www.iea.org/reports/russian-supplies-to-global-energy-markets/oil-market-and-russian-supply-2 (accessed on 29 June 2022).
- Jiun, Ricky C. C. 2018. The Effect of Political Elections on Stock Market Volatility in Malaysia. International Journal of Engineering and Technology 7: 114–19. [Google Scholar] [CrossRef]
- Kabiru, James N., Duncan E. Ochieng, and Hellen W. Kinyua. 2015. The Effect of General Elections on Stock Returns at the Nairobi Securities Exchange. European Scientific Journal 11: 435–60. [Google Scholar]
- Kothari, Sagar P., and Jerold B. Warner. 2007. Econometrics of Event Studies. Handbook of Empirical Corporate Finance 1: 3–36. [Google Scholar] [CrossRef]
- Kumara, H. V. U. D., and P. N. D. Fernando. 2020. Impact of Political Events on Stock Market Return: Empirical Evidence from Sri Lanka. Paper presented at International Conference on Business & Information (ICBI) 2020, Sharjah, United Arab Emirates, February 13–14. [Google Scholar] [CrossRef]
- Kutan, Ali M., and Riza Demirer. 2010. The Behavior of Crude Oil Spot and Futures Prices around OPEC and SPR Announcements: An Event Study Perspective. Energy Economics 32: 1467–76. [Google Scholar] [CrossRef]
- Kyriazis, Nikolaos A. 2022. Optimal Portfolios of National Currencies, Commodities and Fuel, Agricultural Commodities and Cryptocurrencies during the Russian-Ukrainian Conflict. International Journal of Financial Studies 10: 75. [Google Scholar] [CrossRef]
- Lehkonen, Heikki, and Kari Heimonen. 2015. Democracy, political risks and stock market performance. Journal of International Money and Finance 59: 77–99. [Google Scholar] [CrossRef]
- Liu, Yue, Hao Dong, and Pierre Failler. 2019. The Oil Market Reactions to OPEC’s Announcements. Energies 12: 3238. [Google Scholar] [CrossRef]
- Nazir, Sajid M., Hassan Younus, Ahmad Kaleem, and Zeshan Anwar. 2014. Impact of Political Events on Stock Market Returns: Empirical Evidence from Pakistan. Journal of Economic and Administrative Sciences 30: 60–78. [Google Scholar] [CrossRef]
- Nelson, Daniel B. 1991. Conditional heteroskedasticity in asset returns: A new approach. Econometrica: Journal of the Econometric Society 59: 347–70. [Google Scholar] [CrossRef]
- Ngo, Vu M., Toan L. D. Huynh, Phuc V. Nguyen, and Huan H. Nguyen. 2022. Public sentiment towards economic sanctions in the Russia–Ukraine war. Scottish Journal of Political Economy 69: 564–73. [Google Scholar] [CrossRef]
- Obi, Pat, Ebenezer B. Anarfo, and Greg Obi. 2019. Revenue Dampening Effect of the Oil–Dollar Inverse Relationship for Sub-Saharan African Economies. Journal of African Business 20: 305–16. [Google Scholar] [CrossRef]
- Obi, Pat, J. Surujlal, and O. Okubena. 2009. South African Equity Market Reaction to the 2010 FIFA World Cup Announcement. African Journal for Physical Health Education, Recreation and Dance 9: 284–96. [Google Scholar]
- Shaikh, Maria, Sumra H. Shaikh, Mahboob Ullah, and Aisha B. Shah. 2021. COVID-19 Outbreak and Stock Return of G7 Economies. International Journal of Management 12: 15–26. [Google Scholar] [CrossRef]
- Truong, Loc Dong, and H. Swint Friday. 2021. The Impact of the Introduction of Index Futures on the Daily Returns Anomaly in the Ho Chi Minh Stock Exchange. International Journal of Financial Studies 9: 43. [Google Scholar] [CrossRef]
- Yousaf, Imran, Ritesh Patel, and Larisa Yarovaya. 2022. The reaction of G20+ stock markets to the Russia–Ukraine conflict “black-swan” event: Evidence from event study approach. Journal of Behavioral and Experimental Finance 35: 100723. [Google Scholar] [CrossRef]
- Zaremba, Adam, Nusret Cakici, Ender Demir, and Huaigang Long. 2022. When bad news is good news: Geopolitical risk and the cross-section of emerging market stock returns. Journal of Financial Stability 58: 100964. [Google Scholar] [CrossRef]
Figure 1.
Cumulative Average Abnormal Returns: African and G7 Equities.

Figure 2.
Cumulative Abnormal Returns: Commodities.
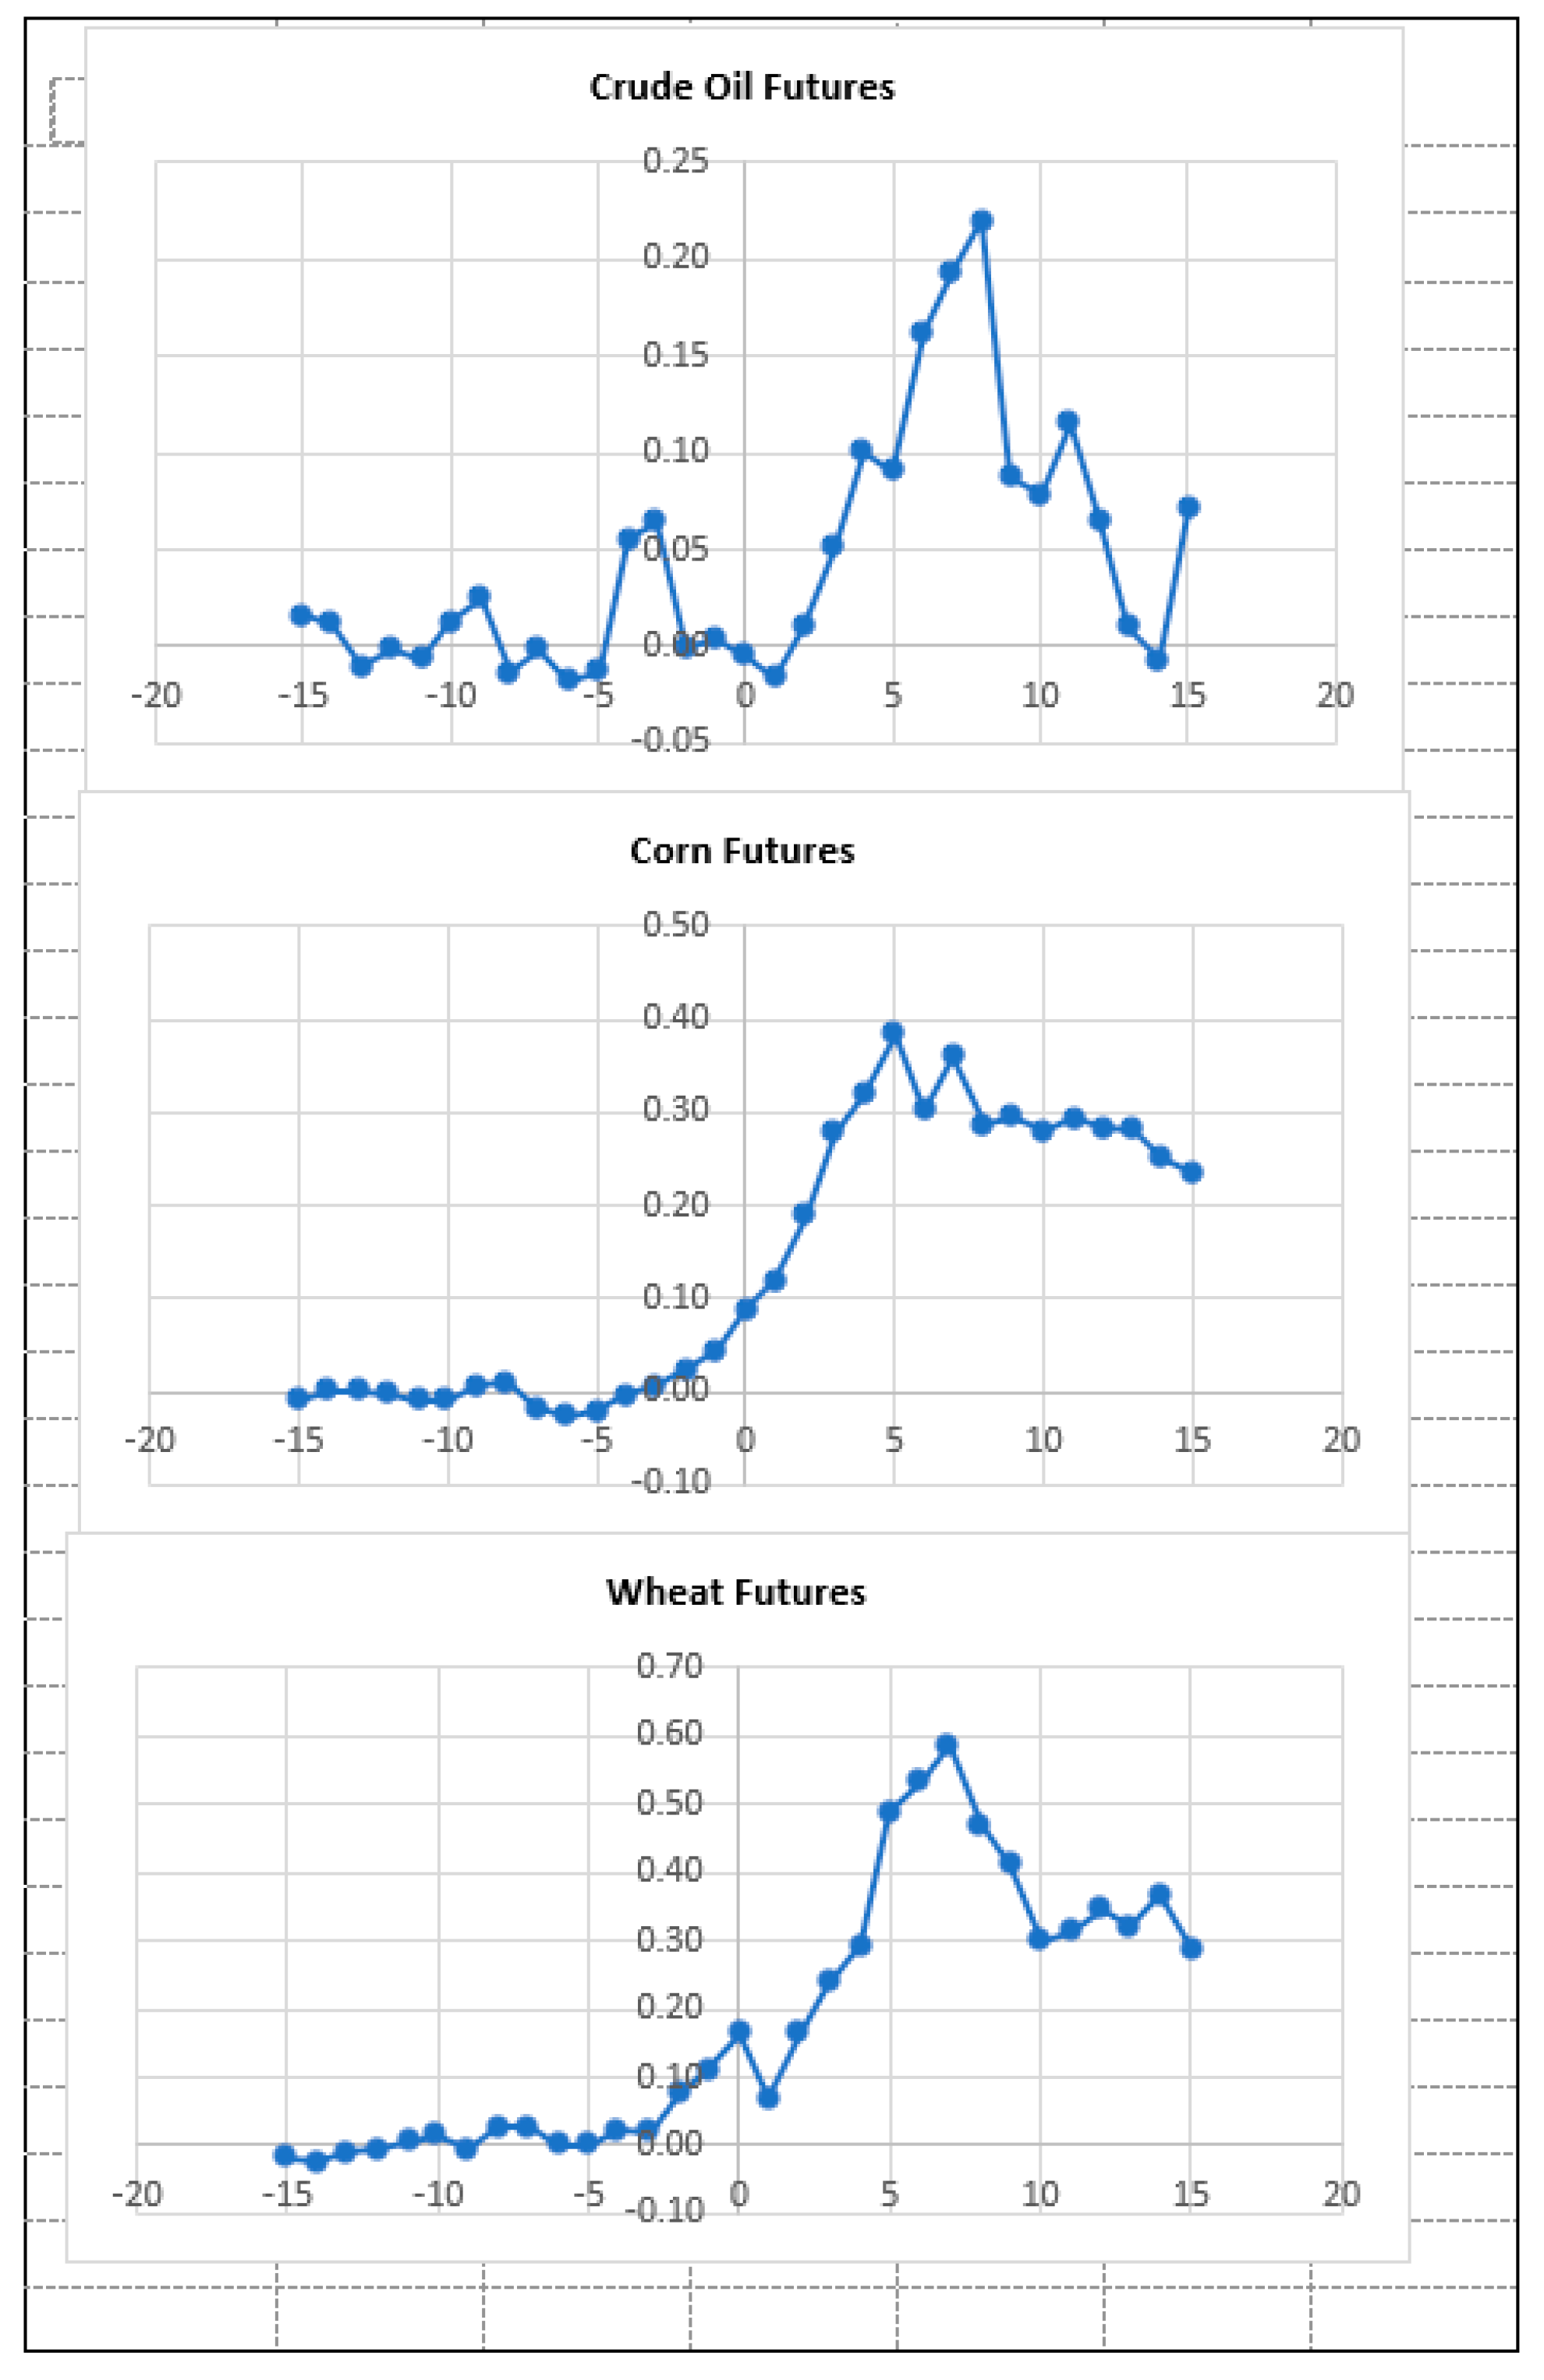
Table 1.
Currency Depreciation and Rise in Commodity Prices Early in the Crisis Period.
| FX | Oil | Corn | Wheat | FX | Oil | Corn | Wheat | FX | Oil | Corn | Wheat | |
|---|---|---|---|---|---|---|---|---|---|---|---|---|
| 24 February 22 | 22 July 22 | % Change | ||||||||||
| U.S. | 1.0000 | $87 | $2.80 | $9.26 | 1.0000 | $110 | $5.75 | $11.58 | NA | 26% | 105% | 25% |
| Egypt | 15.73 | 1368 | 44.04 | 145.66 | 18.86 | 2074 | 108.44 | 218.29 | −17% | 52% | 146% | 50% |
| Ghana | 6.70 | 583 | 18.76 | 62.04 | 8.57 | 943 | 49.28 | 99.20 | −22% | 62% | 163% | 60% |
| Kenya | 113.75 | 9895 | 318.50 | 1053.33 | 118.02 | 12,982 | 678.62 | 1366.08 | −4% | 31% | 113% | 30% |
| Mauritius | 43.95 | 3823 | 123.06 | 406.98 | 45.835 | 5042 | 263.55 | 530.54 | −4% | 32% | 114% | 30% |
| Morocco | 9.4754 | 824 | 26.53 | 87.74 | 10.3300 | 1136 | 59.40 | 119.57 | −8% | 38% | 124% | 36% |
| Namibia | 15.46 | 1345 | 43.29 | 143.16 | 16.28 | 1790 | 93.59 | 188.41 | −5% | 33% | 116% | 32% |
| Nigeria | 576.00 | 50,106 | 1612.80 | 5333.76 | 630.00 | 69,300 | 3622.50 | 7292.25 | −9% | 38% | 125% | 37% |
| SA | 15.36 | 1336 | 43.01 | 142.23 | 17.02 | 1872 | 97.87 | 197.01 | −10% | 40% | 128% | 39% |
% changes are based on the value of each currency in units of U.S. dollar. Exchange rates (FX) are for the Egyptian pound, Ghanaian cedi, Kenyan shilling, Mauritian rupee, Moroccan dirham, Namibian dollar, Nigerian naira, and South African rand. On July 22, Ukraine and Russia reached an agreement to allow the export of grains from Black Sea ports (CNBC, 22 July 2022).
Table 2.
Abnormal Returns on Event Day.
| Abnormal Return | p-Value | |
|---|---|---|
| African Equities | −0.0224 *** | 0.0000 |
| G7 Equities | −0.0237 *** | 0.0000 |
| Oil | −0.0087 * | 0.0672 |
| Corn | 0.0434 ** | 0.0321 |
| Wheat | 0.0542 ** | 0.0203 |
*** Significant at 0.01, ** Significant at 0.05, * Significant at 0.10. The event day is 24 February 2022, the first day Russian troops entered Ukrainian territory.
Table 3.
Cumulative Abnormal Returns.
| Asset | CAR | t-Statistic | p-Value |
|---|---|---|---|
| Panel A. Total Event Window: −15 to +15 | |||
| African Equities | −0.0480 *** | −7.0559 | 0.0000 |
| G7 Equities | −0.0593 *** | −4.0803 | 0.0000 |
| Oil | 0.0870 ** | 2.0649 | 0.0477 |
| Corn | 0.2375 *** | 6.5002 | 0.0000 |
| Wheat | 0.2980 *** | 4.7929 | 0.0000 |
| Panel B. Pre-Event Window: −15 to −1 | |||
| African Equities | −0.0156 *** | −5.4788 | 0.0001 |
| G7 Equities | −0.0470 *** | −6.3913 | 0.0000 |
| Oil | 0.0224 | 0.8034 | 0.4335 |
| Corn | 0.0443 *** | 3.4554 | 0.0040 |
| Wheat | 0.1195 *** | 5.4001 | 0.0001 |
| Panel C. Post-Event Inner Window: +1 to +7 | |||
| African Equities | −0.0146 | −1.5702 | 0.1604 |
| G7 Equities | −0.0523 ** | −2.6136 | 0.0347 |
| Oil | 0.1998 *** | 4.9777 | 0.0016 |
| Corn | 0.2719 *** | 4.1971 | 0.0041 |
| Wheat | 0.4221 *** | 4.2288 | 0.0039 |
| Panel D. Post-Event Extended Window: +1 to +15 | |||
| African Equities | −0.0100 | −1.3551 | 0.1970 |
| G7 Equities | 0.0113 | 0.6096 | 0.5520 |
| Oil | 0.0893 | 1.7259 | 0.1062 |
| Corn | 0.1478 *** | 3.0028 | 0.0090 |
| Wheat | 0.1495 * | 1.8048 | 0.0900 |
*** Significant at 0.01, ** Significant at 0.05, * Significant at 0.10. H0: CAR = 0.
Table 4.
Event Study EGARCH Results of G7 Stock Markets Controlled by Near-term Volatility.
| Model | U.S. | U.K. | Japan | Canada | France | Germany | Italy |
|---|---|---|---|---|---|---|---|
| (p, q) | (1, 1) | (1, 1) | (1, 1) | (1, 1) | (1, 1) | (1, 1) | (1, 1) |
| Mean Equation: Coefficient (p-value) | |||||||
| Constant | 0.0006 *** (0.0000) | 0.0004 ** (0.0317) | 0.0003 (0.5874) | 0.0004 * (0.0811) | 0.0010 *** (0.0044) | 0.0007 ** (0.0300) | 0.0005 (0.1979) |
| Pre-event | −0.0067 *** (0.0081) | −0.0012 (0.8975) | −0.0041 (0.4538) | −0.0051 *** (0.0023) | −0.0023 (0.7586) | −0.0056 (0.4197) | −0.0028 (0.7200) |
| Postevent | 0.0040 * (0.0569) | −0.0073 ** (0.0469) | −0.0042 (0.4625) | −0.0040 *** (0.0006) | −0.0116 * (0.0601) | −0.0017 (0.7410) | −0.0158 *** (0.0051) |
| VIX | −0.0822 *** (0.0000) | −0.0416 *** (0.0000) | −0.0755 *** (0.0000) | −0.0539 *** (0.0000) | −0.0528 *** (0.0000) | −0.0296 *** (0.0000) | −0.0578 *** (0.0000) |
| AR(1) | 0.8994 *** (0.0000) | 0.4127 *** (0.0091) | −0.6249 * (0.0970) | 0.2801 (0.2735) | −1.1210 *** (0.0000) | 0.3432 * (0.0649) | −0.2337 (0.3667) |
| AR(2) | 0.0297 (0.5477) | −0.0544 (0.3921) | −0.0026 (0.9790) | 0.0599 (2793) | −0.1339 *** (0.0058) | −0.0803 (0.2160) | −0.0697 (0.2208) |
| MA(1) | −0.9661 *** (0.0000) | −0.6107 *** (0.0000) | 0.4507 (0.2229) | −0.3919 (0.1264) | 0.9961 *** (0.0000) | −0.4942 *** (0.0083) | 0.1215 (0.6445) |
| Variance Equation: Coefficient (p-value) | |||||||
| Constant | −0.1374 *** (0.0000) | −0.0143 (0.7550) | −0.3176 *** (0.0000) | −0.4111** (0.0233) | −0.3393 *** (0.0003) | −0.5491 *** (0.0001) | −0.5091 *** (0.0025) |
| ARCH | −0.0182 (0.4758) | −0.0103 (0.7232) | −0.1153 *** (0.0000) | 0.1629 *** (0.0035) | 0.0524 (0.1247) | 0.0692 * (0.0999) | 0.0882 * (0.0606) |
| EGARCH | −0.1638 *** (0.0000) | −0.0674 (0.1180) | −0.0067 (0.9366) | −0.1616 ** (0.0160) | −0.0573 (0.3420) | −0.0766 (0.2084) | −0.1413 * (0.0528) |
| GARCH | 0.9853 *** (0.0000) | 0.9983 *** (0.0000) | 0.9558 *** (0.0000) | 0.9729 *** (0.0000) | 0.9692 *** (0.0000) | 0.9473 (0.0000) | 0.9529 *** (0.0000) |
| Pre-event | −0.1621 (0.2136) | 0.2161 * (0.0869) | 0.1102 (0.5322) | −0.1874 (0.3496) | 0.0595 (0.6165) | 0.0244 (0.8689) | 0.0278 (0.8364) |
| Postevent | 0.1765 (0.1374) | −0.0593 (0.5419) | 0.0462 (0.7762) | 0.0959 (0.5977) | 0.2211 * (0.0942) | 0.1500 * (0.0633) | 0.3034 (0.1106) |
| VIX | 3.7059 *** (0.0000) | 3.5093 *** (0.0000) | 1.7388 ** (0.0257) | 2.3527 *** (0.0042) | 3.3284 *** (0.0000) | 3.3311 *** (0.0000) | 2.7671 *** (0.0007) |
| 12.4365 *** (0.0171) | 9.3127 (0.3278) | −0.0931 (0.9902) | 5.4630 (0.6216) | −0.3670 (0.9617) | −5.6376 0.4667) | 2.4754 (0.7758) | |
| Residual Diagnostics | |||||||
| ARCH-LM Statistic (p-value) | |||||||
| χ2 | 1.1166 (0.2906) | 0.3290 (0.5674) | 0.7950 (0.3726) | 1.8510 (0.1737) | 0.6708 (0.4128) | 0.0185 (0.8918) | 0.6950 (0.4045) |
| Ljung−Box Q2 Statistic p-value | |||||||
| 5 lags | 0.269 | 0.648 | 0.690 | 0.828 | 0.048 | 0.288 | 0.282 |
| 10 lags | 0.484 | 0.673 | 0.180 | 0.911 | 0.134 | 0.197 | 0.349 |
*** Significant at 0.01, ** Significant at 0.05, * Significant at 0.10 (p-value in parenthesis).
Disclaimer/Publisher’s Note: The statements, opinions and data contained in all publications are solely those of the individual author(s) and contributor(s) and not of MDPI and/or the editor(s). MDPI and/or the editor(s) disclaim responsibility for any injury to people or property resulting from any ideas, methods, instructions or products referred to in the content. |
© 2023 by the authors. Licensee MDPI, Basel, Switzerland. This article is an open access article distributed under the terms and conditions of the Creative Commons Attribution (CC BY) license (https://creativecommons.org/licenses/by/4.0/).
Share and Cite
MDPI and ACS Style
Obi, P.; Waweru, F.; Nyangu, M. An Event Study on the Reaction of Equity and Commodity Markets to the Onset of the Russia–Ukraine Conflict. J. Risk Financial Manag. 2023, 16, 256. https://doi.org/10.3390/jrfm16050256
AMA Style
Obi P, Waweru F, Nyangu M. An Event Study on the Reaction of Equity and Commodity Markets to the Onset of the Russia–Ukraine Conflict. Journal of Risk and Financial Management. 2023; 16(5):256. https://doi.org/10.3390/jrfm16050256
Chicago/Turabian StyleObi, Pat, Freshia Waweru, and Moses Nyangu. 2023. "An Event Study on the Reaction of Equity and Commodity Markets to the Onset of the Russia–Ukraine Conflict" Journal of Risk and Financial Management 16, no. 5: 256. https://doi.org/10.3390/jrfm16050256